
Abstract
Abstract
Background
Targets for cholesterol reduction are part of the Quality Outcomes Framework and general practitioners have to meet these targets to fulfil their remuneration package. By contrast, there are no targets for the accuracy of cholesterol or other lipid measurements and no recent surveys on performance of these assays. We have assessed the performance of lipid measurement of the available methods in the UK.
Methods
Serum samples collected from individual donors attending the national blood service were distributed after values were obtained from a secondary reference laboratory. Samples were sent to participant laboratories to assess different methods' analytical performance on single donation specimens, on routine external quality assessment pooled specimens, on specimens subjected to a range of freeze–thaw cycles and on frozen-stored specimens.
Results
Differences in measured cholesterol were found that were method-dependent and related to triglyceride content. HDL-cholesterol (HDL-C) showed significant positive bias in all assays. Individual donor specimens showed no significant changes with differing numbers of freeze–thaw cycles. Pooled serum was stable for up to six months.
Conclusions
Most cholesterol measurements are accurate but some methods are affected by triglyceride interference. HDL-C methods show significant positive bias. Although there are potential matrix effects introduced as a result of specimen preparation, additional work is needed to show if these effects are present in fresh patient samples.
Introduction
Coronary heart disease (CHD) is responsible for the death of over 105,000 people in the UK each year and is the major cause of death among men and women. Symptomatic CHD is present in more than 1.7 million people in the UK and the costs to the UK health economy are large. 1,2 More recently, the National Service Frameworks for Heart Disease have focused on a number of key issues that require targeting by general practitioners and among these is the necessity to establish a register of patients who are at risk and to ensure that their total cholesterol concentration is reduced to <5.0 mmol/L. 3 In addition, high‐risk individuals have to be assessed with measures that include knowledge of cholesterol and HDL-cholesterol (HDL-C) concentrations.
A survey by Packard et al. 4 showed that in a cohort of Scottish and Irish laboratories, cholesterol measurements were positively biased by at least 5%. This positive bias was compared with the secondary reference method published by the Division of Laboratory Sciences from the Centers for Disease Control (CDC) in Atlanta and two further circulations of material were sent after the initial pool was distributed. Laboratories altered their calibration methods to reflect the positive bias found and the net result was that cholesterol concentrations became more aligned, i.e. more accurate. The United Kingdom National External Quality Assessment Scheme (UK NEQAS) then carried out further studies in collaboration with the University of Glasgow to give an accuracy base for their specimens and to alert UK laboratories to the problems of cholesterol standardization. 5
Since that time there has been no major follow-up survey and the general overview of whether or not accurate lipid measurements are being provided is at present unknown. These lipid measurements not only include cholesterol but also triglyceride and HDL-C. UK NEQAS note that pooled samples distributed as part of the routine lipid investigations distributions have a small positive bias from the majority of laboratories that measured cholesterol in the UK. There are limitations with the lipid investigations scheme, the major one of which is that the serum material used is pooled from several donations and undergoes multiple freeze–thaw cycles before being distributed to participants. Freeze–thaw cycles may be deleterious to lipid samples 6 but there are other data that show serum cholesterol samples subjected to freeze–thaw cycles are not affected. 7
The importance of accurate lipid measurements cannot be underestimated in UK practice. General practitioners are remunerated by reaching targets for individuals who are part of high-risk groups and currently the target is to reduce cholesterol concentrations to <5.0 mmol/L in 60% of these individuals. Assessment of individuals at high risk of coronary disease includes the use of the Framingham Risk Calculator, 8 which requires the measurement of cholesterol and HDL-C and in some health authorities there is additionally a wish to use LDL-cholesterol as a target.
Methods
Distribution of single donation material
Venous blood was collected from donors attending the local United Kingdom National Blood Service Centre (NBS). Blood was collected into plain bags and allowed to coagulate. The blood was centrifuged and the serum collected, frozen and stored at −40°C prior to despatch to UK NEQAS. The serum in these single donations was thawed and aliquots sent to a local laboratory for lipid measurement. The donations were re-frozen while awaiting analyses. Serum donations selected after initial testing were thawed, aliquoted and samples sent to Glasgow for CDC referenced results. 9,10 The aliquots were once again frozen at −40°C. When results were available from Glasgow the single serum donations that met the requirements for the distribution were sent to 84 laboratories in the UK. This selected group of laboratories were chosen to reflect the distribution of the various manufacturers' methods in the UK. The limited volume of material available for analysis restricted the distribution but a minimum of four (and a maximum of 14) laboratories using individual manufacturer's methods were chosen to ensure that there was sufficient representation of these methods in the survey. The laboratories surveyed were asked to measure the lipids as soon as possible after receipt and to return the results within eight days.
Effect of repeat freeze–thaw cycles
Single donor samples were obtained from UK NBS as previously described. The serum was thawed, pooled, mixed and aliquotted. One-third of the aliquotted material (Specimen A) was frozen and stored at −40°C (2 freeze–thaw cycles by the time the laboratory received the specimens). One-third of the aliquotted material (Specimen B) was frozen and stored at −40°C for two days and then thawed, mixed by inversion and re-frozen (3 freeze–thaw cycles; this is the norm for routine specimens despatched through the UK NEQAS for lipid investigations). One-third of the aliquotted material (Specimen C) was frozen and stored at −40°C for two days and then thawed, mixed by inversion and re-frozen. It was stored frozen for a further two days, thawed and mixed by inversion and re-frozen (4 freeze-thaw cycles). At each stage, an aliquot was sent to Glasgow (on dry ice) to obtain a CDC referenced result. An aliquot of each specimen was sent to all participants in the UK NEQAS for lipid investigations as previously detailed.
Stability of stored pooled material
Donations from single donors were obtained from NBS and prepared by the following protocol. Blood was collected into plain bags and allowed to coagulate. Serum was collected after centrifugation, frozen, stored at −40°C and sent to UK NEQAS. The serum was thawed, an aliquot taken and measured at a local laboratory and the bulk serum was re-frozen and stored at −40°C. Three separate pools were made by pooling like-for-like donations. Sufficient material was prepared such that each specimen could be distributed on two separate occasions. Each pool was aliquotted, frozen and stored at −40°C (the usual 3 freeze–thaw cycles by the time the laboratory received the specimens). The first distribution of samples took place one week later, and the second distribution was undertaken after six months.
Results
Distribution of single donation material
Cholesterol
The results of the cholesterol measurements made are detailed in Table 1 and Figure 1. For sample 1A, cholesterol measured by the secondary reference method (Glasgow) was 5.21 mmol/L and the mean measured cholesterol by the laboratories was 5.19 mmol/L. The observed bias found with these specimens was not marked, with the greatest bias shown with dry slide technology, where there was a negative bias compared with conventional methods. For sample lB, cholesterol measured by the secondary reference method was 8.61 mmol/L while the mean measured cholesterol by the laboratories was 8.64 mmol/L. An increased bias was shown on all of the cholesterol oxidase methods with a range of −5.8% to +4.7% recorded. Sample 1C contained a greater concentration of triglyceride than samples 1A and 1B. For sample lC, cholesterol measured by the secondary reference method was 4.68 mmol/L while the mean measured cholesterol by the laboratories was 4.56 mmol/L. However, there were significant differences noted in the total cholesterol methods with two of the methods showing biases of −19.7% and −24.2%. The between-laboratory agreement for all individual methods was good for most of the reagents excepting one which had a poor between-laboratory agreement that varied between 3.9 and 5.4%.
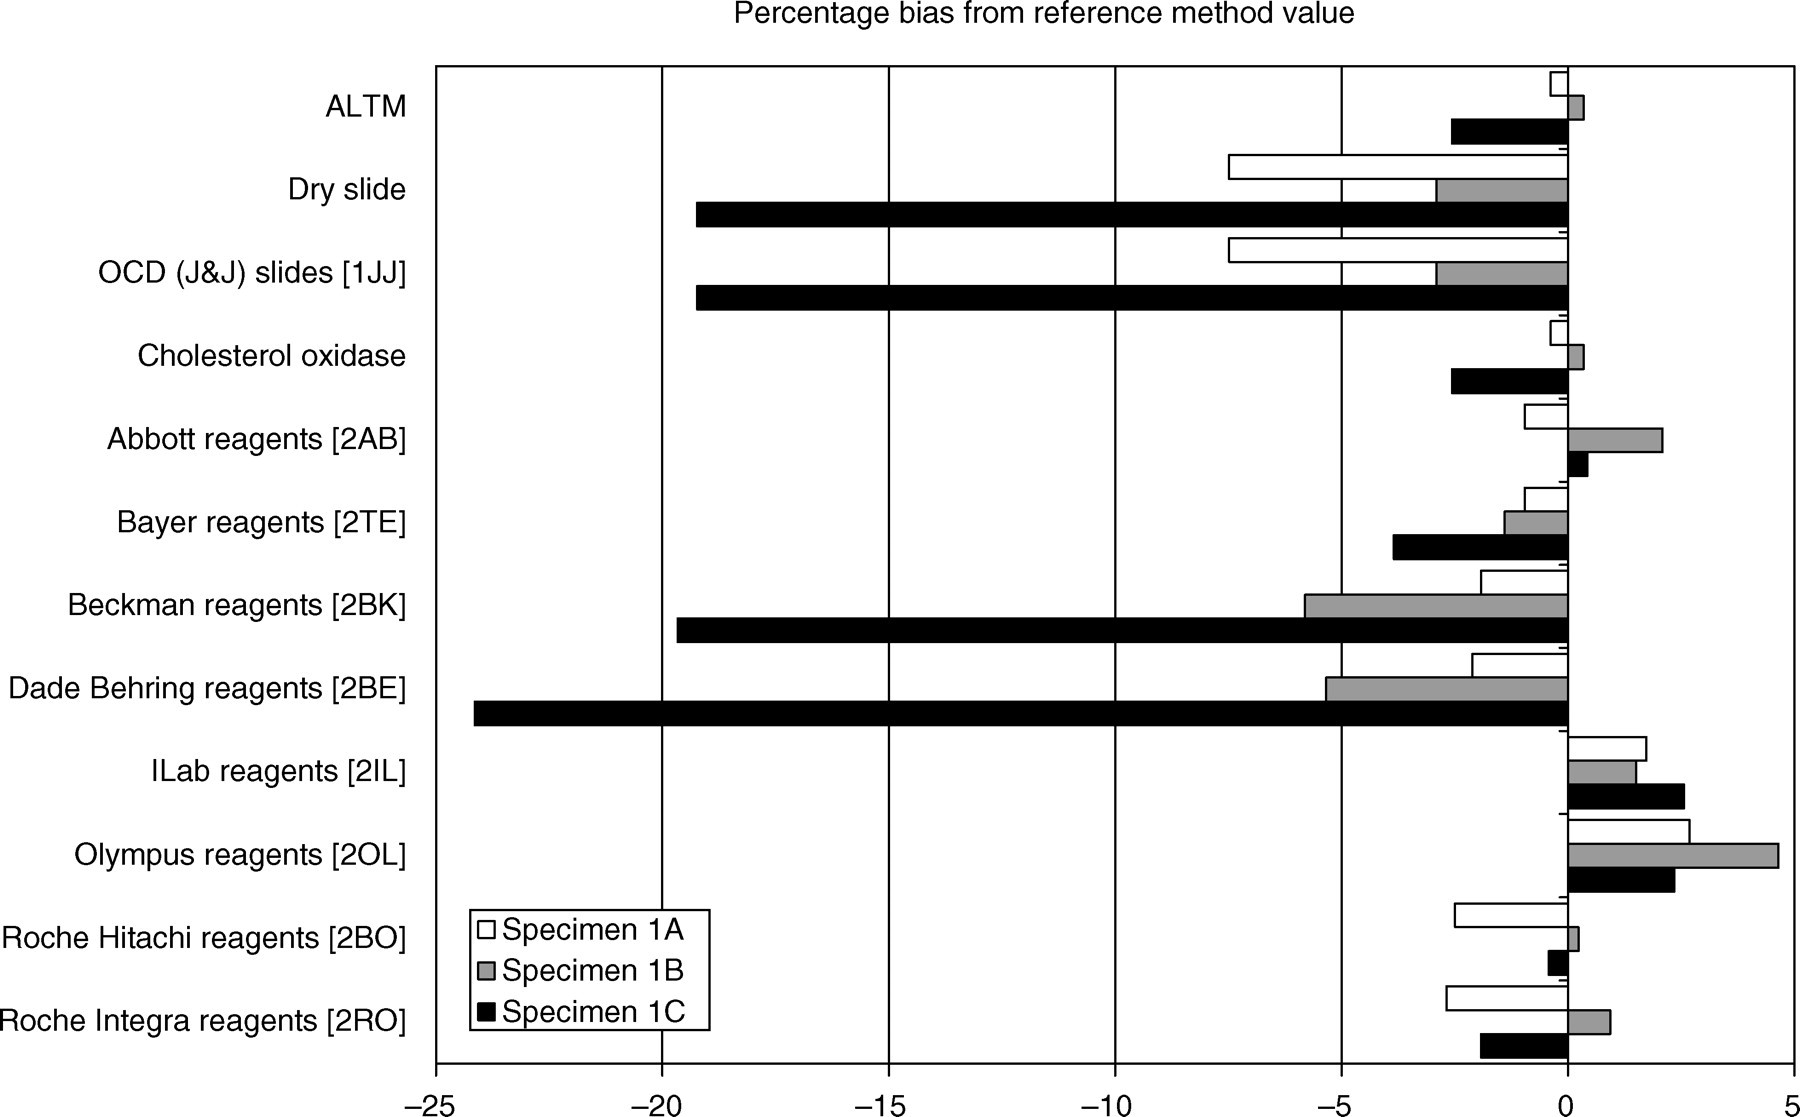
Cholesterol methods. Reference values for samples A, B and C are detailed in Table 1. Values obtained on methods available in the selected laboratories for measured cholesterol are shown. ALTM, all laboratory trimmed mean; OCD, Ortho-Clinical Diagnostics
Cholesterol and triglyceride reference values
Triglyceride
The results are shown in Table 1 and Figure 2. For sample 1A, triglyceride measured by the secondary reference method (Glasgow) was 0.96 mmol/L and the mean measured triglyceride by the laboratories was 0.93 mmol/L. Total (un-blanked) glycerol methods gave biases that varied anywhere between −8 and +2%. Dry slide technology showed a positive bias of 14.6%. For sample 1B, triglyceride measured by the secondary reference method was 2.25 mmol/L and the mean measured triglyceride by the laboratories was 2.22 mmol/L. The bias shown with the un-blanked glycerol reagents varied between −6.2 and +4.0%. Dry slide methods recorded a bias of −4%. For sample 1C, triglyceride measured by the secondary reference method was 4.75 mmol/L and the mean measured triglyceride by the laboratories was 4.50 mmol/L. The un-blanked wet chemistry methods showed biases between −12 and +15%, while the dry slide technology had a bias of −14.7%. The overall between-laboratory agreements were variable with values of 1.1 to 9.1%.
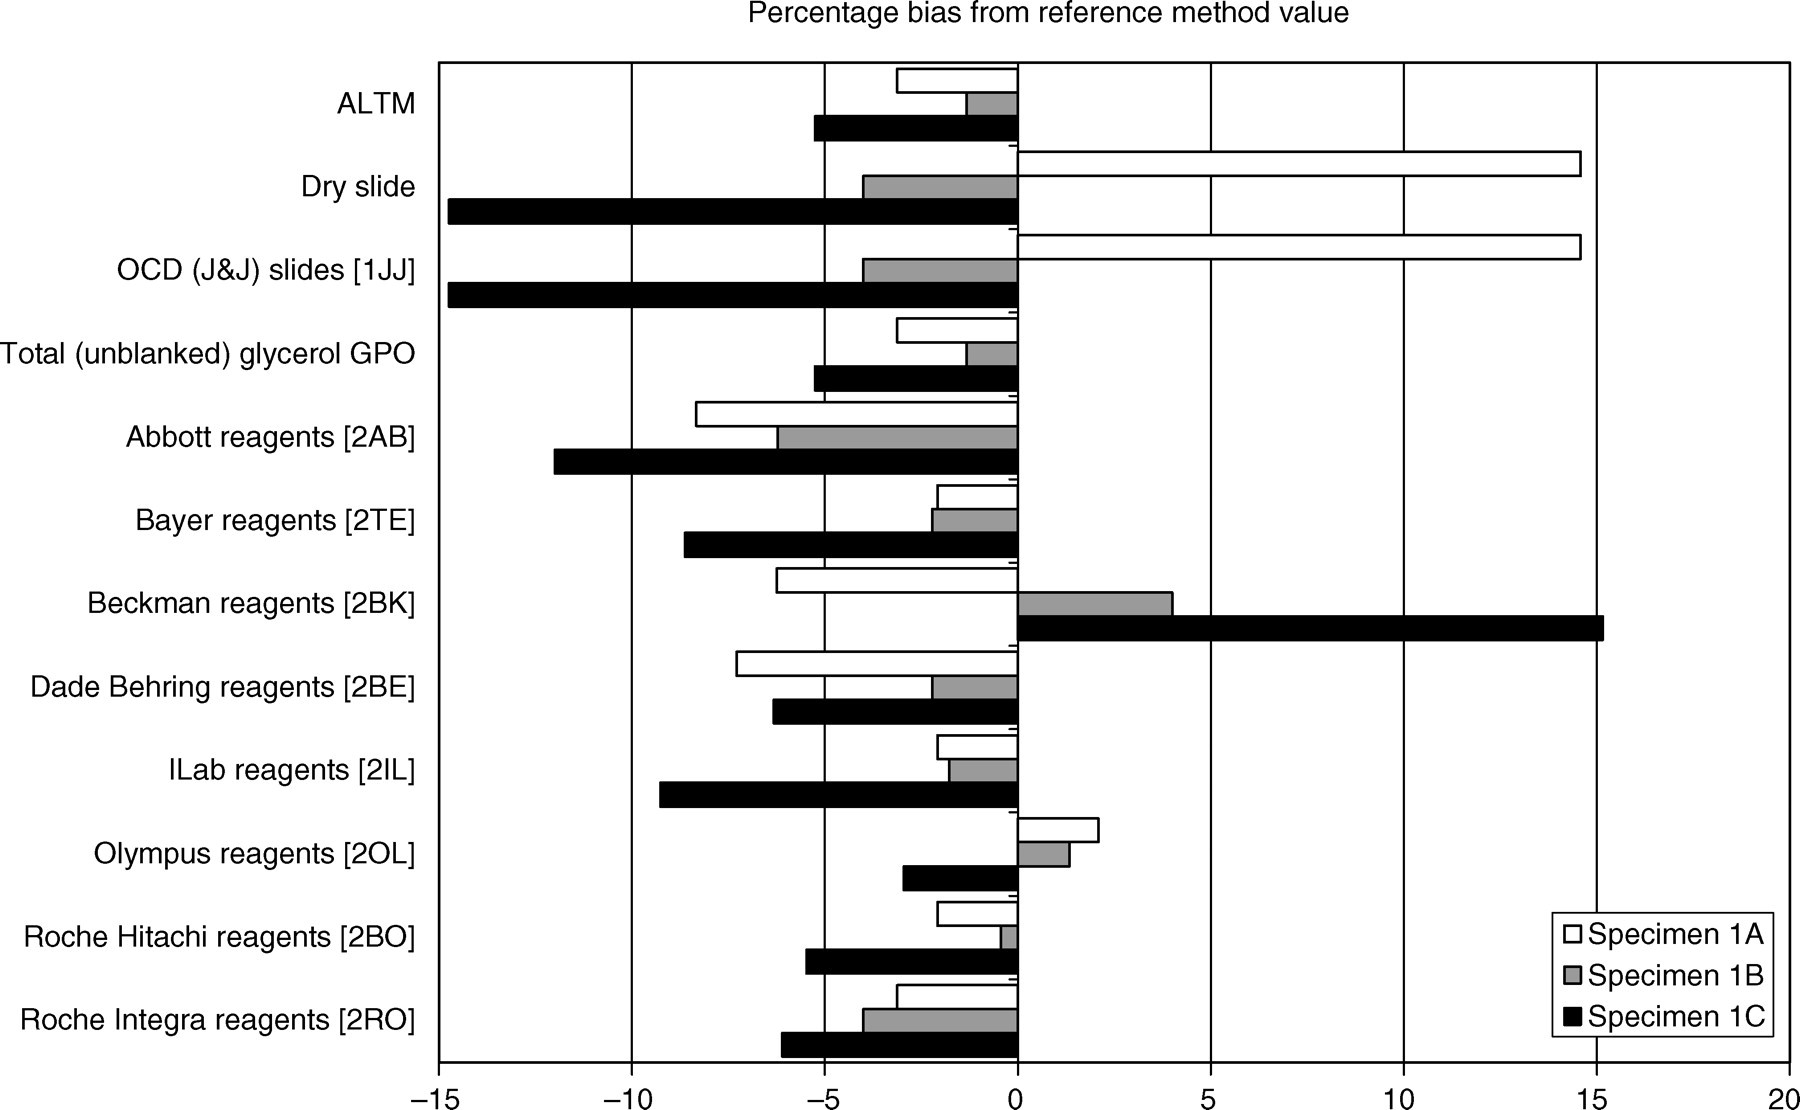
Triglyceride methods. Reference values for samples A, B and C are detailed in Table 1. Values obtained on methods available in the selected laboratories for measured triglyceride are shown. ALTM, all laboratory trimmed mean; OCD, Ortho-Clinical Diagnostics, GPO, glycerol phosphate oxidase
HDL-cholesterol
The results are shown in Table 1 and Figure 3. For sample 1A, HDL-C measured by the secondary reference method (Glasgow) was 2.00 mmol/L and the mean measured HDL-C by the laboratories was 2.15 mmol/L. There was a much wider range of reagents and methods that were used to remove all other lipid fractions. These included polyethylene glycol (PEG) enzymatic reagents, polyanion detergent reagents, antigen antibody complexes for LDL and VLDL, sequential reagents and the Accelerator Selective Detergent method (ASDM). The range of bias to the reference method was anywhere between 0 and +22.5%. For sample 1B, HDL-C measured by the secondary reference method was 1.51 mmol/L and the mean measured HDL-C by the laboratories was 1.59 mmol/L. The bias varied between −6.0% for some PEG enzymatic methods to +30.5% for ASDM methods. For sample 1C, HDL-C measured by the secondary reference method was 0.84 mmol/L and the mean measured HDL-C by the laboratories was 0.94 mmol/L. There was a range of bias on these samples from 0% with the polyanion detergent methods to +32% using ASDM methods. The between-laboratory agreements ranged anywhere from 1.1 through to 20.2%. It was noted that the poorest performance with an increased variation between laboratories was realized from the same manufacturer that produced a similar performance with its cholesterol and triglyceride reagent.
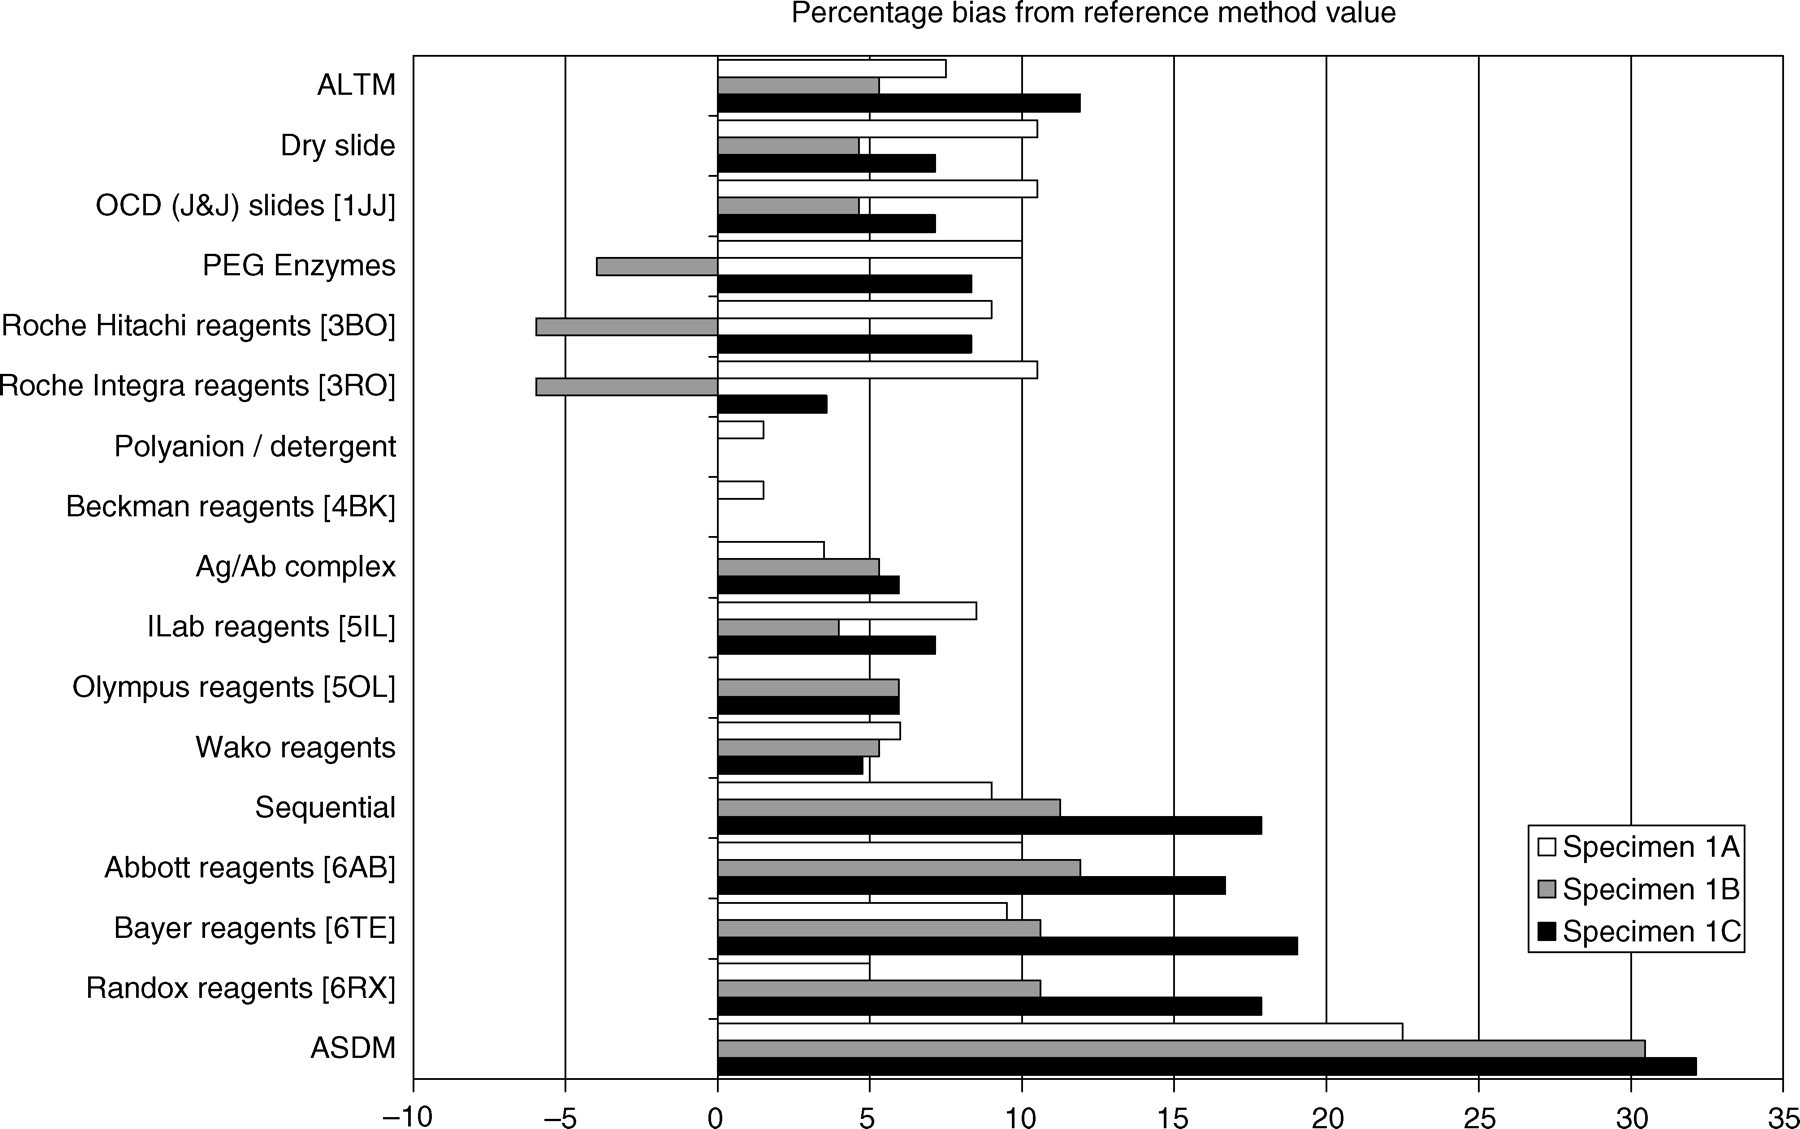
HDL-cholesterol methods. Reference values for samples A, B and C are detailed in Table 1. Values obtained on methods available in the selected laboratories for measured HDL-C are shown. ALTM, all laboratory trimmed mean; OCD, Ortho-Clinical Diagnostics; PEG, polyethylene glycol; Ag/Ab, antigen/antibody; ASDM, Accelerator Selective Detergent method
Effect of repeat freeze–thaw cycles on serum specimens
The summary of data found is shown in Table 2. Cholesterol measured by the reference method showed little difference in the observed results whether the sample had two, three or four freeze–thaw cycles. By comparison there was a trend to show decreasing cholesterol concentrations when the samples were measured by the laboratory methods. The reference method demonstrated an increase in the HDL-C measured with increasing numbers of freeze–thaw cycles while in general the laboratory methods showed no change. Triglyceride concentrations were mostly stable when measured with reference or laboratory methods. These pooled serum samples used for the freeze–thaw experiments produced similar biases to those seen in the single donation serum samples.
Numbers of freeze–thaw cycles
TC, total cholesterol; TG, triglyceride
Effect of extended storage on serum specimens
Specimens were collected as above and results analysed and data are shown in Table 3. Three pooled serum specimens labelled D, E and F were distributed. In general, there was no significant change in the measured cholesterol whether the samples were measured by the reference or the routine method. HDL-C showed changes in two of the distributed materials measured by the reference method but no change by the laboratory routine methods. A very marked change in the triglyceride was noted in specimen F as measured by the reference method that was not mirrored in the samples measured by the laboratory methods.
Percentage change after six months storage at −40°C
TC, total cholesterol; TG, triglyceride
Discussion
Although this survey gives the best possible opportunity for laboratories to perform analysis with a human serum sample, there are difficulties in procuring and distribution of human-derived specimens for measurement. The ideal is to produce specimens that are commutable so that comparable data on assay performance obtained by EQA specimens is similar to that obtained when patient-derived material is used. 11 For this distribution of material we have used single donation specimens to minimize any effects that might arise from pooling specimens. Pooled secondary referenced samples for cholesterol have been shown to be stable at −20°C for periods up to five years. 12
Current guidelines for lipid measurement state that samples kept in the laboratory should be analysed as quickly as is possible or should be stored for no longer than four days at 4°C before analysis. 13 Beyond this time, changes in the lipoprotein particles can occur that lead to misleading measured results. Samples may be frozen and thawed but ideally this should only be once to ensure that matrix effects are minimized. In this survey, the necessity of selection of appropriate specimens for distribution has forced a less than perfect collection procedure and the limitations are imposed by the need to ensure that the specimens are safe (hepatitis and HIV-negative) and appropriate for the needs of the exercise. The concentrations of lipid were verified by CDC secondary reference methods. We accede all manufacturers, including those using dry slide technologies, indicate that they show concordance on data acquired using fresh (non-freeze–thaw) samples with CDC secondary reference methods to meet Food and Drug Administration (FDA) criteria. Although there are inherent difficulties of freeze–thaw cycles in the distribution of EQA materials, some of the effects may be minimized in this distribution by using single donations. Repeated freeze–thaw cycles make no significant difference to these values. There is therefore consistency in the results of specimens that are frozen and thawed. It is possible that laboratories may not analyse these specimens immediately on receipt and some may re-freeze specimens before analysis. Postal delay might occur and this could contribute to differences especially when liquid specimens are used for EQA though we have no direct proof of this effect in practice as no formal testing of delay in analysis was planned in these studies.
These data demonstrate that cholesterol measurements in samples that contain average amounts of triglyceride show little bias from a reference method and between-laboratory agreement is good. The divergence of results when triglyceride concentrations are moderately raised is a problem. The bias for many manufacturers is markedly different to the secondary reference method and significant underestimations of cholesterol concentrations can be made, particularly where decision limits are important. This is of importance where research specimens rather than clinical specimens are analysed. To minimize imprecision of repeated small analytical runs, samples for research may be frozen for some time before analysis. As previously stated, we know that acceptance of methods requires secondary referencing to gain FDA approval and manufacturers work with fresh specimens to achieve certification. Recent work in the UK has shown that exchange of fresh clinical specimens analysed on the same day using different instrument platforms and reagents shows no significant difference between methods. 14 The concentration of cholesterol in the study samples varied between 2 and 24 mmol/L and for triglyceride the concentrations varied between 3 and 14 mmol/L. Therefore, this separate study showed that different methods produced similar results with fresh samples. By contrast, in our data, samples that were subjected to freeze–thaw cycles significantly affected some, but not all, methods.
For HDL-C only a minor handful of manufacturers achieve a bias of <5% the target guideline of the National Cholesterol Education Programme 15 and there is poor between-laboratory agreement within methods. We emphasize that these observations are made in samples subjected to freeze–thaw cycles. The data for samples that contain moderate amounts of triglyceride is worse and the between-laboratory agreement is significantly worse. Triglyceride measurements are consistently poor and appear to be worse at lower concentrations.
These data show significant trends, but the specimens collected were from non-fasting individuals. Under ideal conditions they would of course be fasting, but the majority of patients who are now being screened for risk factor management, particularly in Primary Care (General Practice) are non-fasting. There is a reliance on the use of cholesterol and HDL-C for the stratification of individuals with coronary disease using the Framingham Risk Programme. Our data show that HDL-C concentrations are overestimated by the majority of methods in this survey. Since HDL-C significantly contributes to the calculation of coronary risk, there is the potential to underestimate the risk within a primary care population. Additionally, when samples contain moderate amounts of triglyceride, dependent on the method used by a laboratory to process specimens, there may be an underestimation of the cholesterol and, with the over-estimation of HDL-C that may lead to an average risk calculation that does not reflect the true risk. Our data are based on samples subjected to freeze–thaw cycles. If our data were a true reflection of what happens in clinical practice there would be significant worries. For the majority of specimens processed, we should not be unduly negative about these results since they demonstrate commutability of cholesterol, HDL-C and triglyceride with no significant bias whatever the specimen type.
We show that different manufacturers' reagents show subtle differences in their performance and we presume that this may be a reason why there are the differences in their kit inserts about specimen requirements. One manufacturer recommends freezing specimens if the specimen is not analysed on the same day, but this method is affected by freeze–thaw cycles. Another manufacturer has different recommendations for specimen storage dependent on which of its two instruments is used. However, there is little difference in the bias and between-laboratory agreement for these two same manufacturer methods.
In summary, this survey shows that routine lipid measurements might not accurately reflect particular groupings of patients with hyperlipidaemia especially if serum is stored frozen before analysis. To accurately review whether manufacturers produce robust lipid measurements would require a distribution of fresh material with measurements made on the same day. This study will be considered but in the meantime we would emphasize that continued collaboration with industry at all levels is important to ensure that the currently available lipid measurements are sufficiently accurate to meet the needs of national guidelines and government-led targets.
Footnotes
Acknowledgements
This article was prepared on behalf of the Hyperlipidaemia Education and Research Trust UK Laboratory sub-committee. The authors thank the helpful discussions within the laboratory sub-committee of HEART UK.
RC and MM have no conflicts of interests. RDGN is the Director of an SAS regional laboratory for cardiovascular biomarkers. MC is the Director of an SAS regional laboratory for cardiovascular biomarkers and the laboratory if secondarily referenced to CDC. JF and FM are employed by the University Hospital Birmingham NHS Foundation Trust and advise participants and manufacturers about EQA of lipids and other analytes as part of the UK NEQAS service.