
Abstract
Abstract
Background
Infiltrating ductal carcinoma (IDCA) is the most common type of breast cancer accounting for 85% of all invasive breast cancers.
Methods
Forty tissue specimens comprising 20 pairs of normal and cancerous tissues were analysed. The tissues were homogenized and proteins were extracted using phosphate buffer. The protein extracts from each pair of cancerous and normal tissue were separated using sodium dodecyl sulphate-polyacrylamide gel electrophoresis in the same gel. The protein profiles of both the tissues were compared, and the differentially expressed proteins that were detected at >70% in one or both of the tissue types were selected for protein identification analysis. Target proteins were excised and digested in situ with trypsin prior to liquid chromatography/tandem mass spectrometry (LC/MS/MS) analysis. A protein that was present in both tissue types was further quantified using extracted ions chromatogram.
Results
The proteins were grouped as down-regulated, up-regulated and unique proteins. Twenty-two proteins were identified and eight of the proteins were found unique to cancer. These proteins belong to various molecular classes, i.e. structural protein, hypothetical protein, cytoskeletal protein, enzyme, calcium binding protein and extracellular matrix protein. One extracellular matrix protein, namely collagen α-1(I) chain precursor was found unique to cancer. By virtue of its location on the cell surface and its function in cancer growth, this protein may be a biomarker candidate for breast cancer.
Conclusions
The proteins identified in this study were present in at least 70% of the tissues tested; therefore they should have significant roles in the development of IDCA.
Introduction
Breast cancer is one of the most common cancers or malignancies in women. 1 It constitutes 18% of all cancers in women of the Western World. 2 Cancer is a disorder of cells that is usually visible as a tumour evolves from a series of changes that may take years to develop. 3 Proteins, being the functional components of cells, regulate a cell's activity. Therefore, the proteome of cancerous tissues compared with normal tissues will lead to better understanding of the disease.
Molecular events leading to breast epithelial carcinogenesis 4 involve modifications of the structure and expression of both oncogenic and suppressive genes. This leads to unbalanced growth that is characterized by high rates of proliferation, migration and tendency to survive environmental stress that would otherwise lead to apoptosis. 5 Protein-expression profiling (expression proteomics) is to identify proteins, which are characteristic of disease that changed due to perturbations. 6 Significant progress in cancer proteomics 7 resulted in the protein databases for tumour-derived breast cell line. 8 However, the use of established cell lines may not represent the actual protein expression, since protein expression in cells is influenced by external factors such as growth environment of the cells.
In this study, we used the tissue specimens from breast cancer patients to identify the differentially expressed proteins for the normal and cancerous tissues of the most common type of breast cancer, i.e. infiltrating ductal carcinoma (IDCA). The data gathered in this study will not only contribute to the understanding of the disease but the potential biomarkers for breast cancer can also be identified.
Methods
Sample collection
Twenty pairs of tissue specimens from Chinese patients with grade three IDCA were obtained from female breast cancer patients following surgery at Hospital Pulau Pinang (HPP). The normal tissue collected was the tissue adjacent to the tumour tissue. Both the normal and cancerous tissues were confirmed by the hospital's pathologist. Sections of tissue samples were taken from the anterior and deep regions of the tissues to ensure adequacy of the respective cell types and only those samples that contained >90% malignant cells for cancerous tissues and >50% ductal cells for normal tissues were used in the analysis. The tissues were taken from the surgically resected specimens after informed consent had been obtained from the patients prior to surgery. The specimens were stored at −70°C in a bio-freezer immediately after surgery and transported to the laboratory in ice in order to minimize degradation of the tissues. The adipose tissues were removed, the remaining tissue cut into very fine pieces, weighed and stored at −70°C in a bio-freezer. Table 1 shows the breast cancer demographic report of the 20 Chinese patients tested.
We obtained human ethical approval from the ministry of health, Malaysia, for conducting this project.
Breast cancer patients' demographic – Chinese women
+ve, positive; −ve, negative
Phosphate extraction buffer
Proteins were extracted from the tissues using phosphate buffer (Ph buffer) that was prepared according to Hjelmeland
9
with slight modification. The optimized Ph buffer contains 0.2 mmol/L Ph buffer (pH 7.2), 150 mmol/L NaCl, 8 mmol/L urea, 1% (w/v) CHAPS, 10% (v/v) glycerol and 2 mmol/L EDTA. A volume of Ph buffer was added to the tissue in a microcentrifuge tube following a ratio of 1:2, i.e. tissue (weight): buffer (volume). A homogenizer was used to disrupt the deep-frozen breast tissue and the homogenized tissue was vortexed to thoroughly mix for 30 s. The mixture was centrifuged (15 min, 12,000
Protein concentration determination
Protein concentration determination was carried out using a Bio-Rad RC-DC Protein assay. Bovine serum albumin was used to construct a standard curve. The protein extracts were diluted 50 times in Ph buffer. Optical density (OD)650 nm was measured using a microplate reader (Anthos Labtec HT2).
Sodium dodecyl sulphate-polyacrylamide gel electrophoresis
Sodium dodecyl sulphate-polyacrylamide gel electrophoresis (SDS-PAGE) was performed as described by the modified method of Laemmli. 10 The gel percentage used was 12% polyacrylamide gel in a Hoefer SE 600 Ruby vertical slab gel apparatus (Amersham Bioscience, USA). The gel size used was 18 × 16 cm. Sample buffer of 10 μL [0.5 mmol/L Tris-HCl pH 6.8, 10% (v/v) glycerol, 0.02% (w/v) SDS and 0.1% (w/v) bromophenol blue] was added to 1 mg protein extract and the mixture was loaded into the well of the polyacrylamide gel. Separation of proteins was carried out at a constant voltage of 200 V throughout the whole electrophoresis process. The electrophoresis was stopped when the dye front was approximately 2–3 mm away from the bottom edge of the gel. The gel was stained with Coomassie Blue.
Image analysis
After staining, the images of the gels were captured and analysed using VersaDoc Imaging System and Quantity One 1-D Analysis software (Bio-Rad, USA). The intensity and the migration of the protein bands were analysed in order to measure the quantity and molecular weights of the proteins. The differentially expressed protein bands were then targeted and subjected to the in-gel protein digestion.
In-gel protein digestion
In-gel protein digestion using trypsin was performed as described by Gam and Aishah. 11 Target proteins were excised and washed thrice with 100 mmol/L NH4HCO3. The gel pieces were then shrunk by dehydration in 500 µL acetonitrile (ACN) and this step was repeated three times. The solvent was discarded and the gel pieces dried in a vacuum centrifuge (Eppendorf, Germany). One hundred microlitres of 10 mmol/L dithiotreitol (DTT) in 100 mmol/L NH4HCO3 was added and the protein was incubated for 1 h at 56°C. The DTT solution was replaced with the same volume of 55 mmol/L iodoacetic acid in 100 mmol/L NH4HCO3 and the incubation continued for 45 min at 25°C in the dark and with occasional vortexing. The gel pieces were washed with 500 µL of 100 mmol/L NH4HCO3 for 10 min and then dehydrated with ACN, rehydrated with 100 mmol/L NH4HCO3 before a final dehydration with ACN. The liquid phase was removed and the gel pieces dried in a vacuum centrifuge. The gel pieces were swollen in 100 µL of digestion buffer containing 50 mmol/L NH4CO3, 5 mmol/L CaCl2 and 12.5 ng/µL trypsin in an ice-cold bath. After 45 min, the supernatant was removed and replaced with a volume of the same buffer but without trypsin and incubated at 37°C overnight. The supernatant was transferred to a new tube. Twenty microlitres of 20 mmol/L NH4HCO3 was added, vortexed and incubated at room temperature for 10 min. The supernatant was recovered after a brief spin and pooled with the supernatant from the overnight incubation. Five percent (v/v) formic acid in a 70:30 ratio mixture of ACN and water were added to one to two times the volume of gel pieces, vortexed and incubated for 20 min at room temperature, Again the supernatant was recovered and pooled with the rest. These steps were repeated twice. Pooled extracts of peptides were dried under a continuous flow of nitrogen and stored at −20°C prior to analysis.
Mass spectrometric analysis
The peptides were reconstituted in 30 µL of deionized water (Millipore, USA) and mixed thoroughly. The reconstituted sample was centrifuged (500
Mascot protein identification
The MS/MS data obtained after mass spectrometry analysis were used to identify proteins with the Mascot Protein Search Database (MSDB) engine. The taxonomy and enzyme selected were Homo sapiens (human) and trypsin, respectively, while fixed modification was carboxymethyl (C). The peptide mass tolerance was set at ±2 Da, whereas ±0.8 Da was set for the fragment mass (MS/MS) tolerance. The program can be directly accessed through the Internet at
Results
Figure 1 shows the protein profiles of proteins extracted from six of the Chinese patients with grade 3 IDCA. Protein bands of cancerous tissues were equally spread throughout the length of the gel (250–15 kDa). However, proteins from the normal tissues were mostly found at the higher molecular weight region. Figure 1a shows the SDS-PAGE protein profiles and Figure 1b represents the consistently expressed proteins in >70% of the tissues analysed. Only the protein bands that were detected at >70% in one or both tissue types were selected for mass spectrometry analysis. For normal tissues, protein bands at 333.4 kDa, 142.6 kDa, 127 kDa, 106.8 kDa, 78.4 kDa, 70.5 kDa, 40.4 kDa, 36.1 kDa, 32.8 kDa and 26.5 kDa were analysed while protein bands at 333.4 kDa, 142.6 kDa, 127 kDa, 106.8 kDa, 78.4 kDa, 70.5 kDa, 41.7 kDa, 40.4 kDa, 36.1 kDa, 32.8 kDa, 26.5 kDa and 24.7 kDa from cancerous tissues were analysed. Some of these bands were detected at different band intensity between normal and cancerous tissues while others were distinctly expressed in only one type of the tissues.
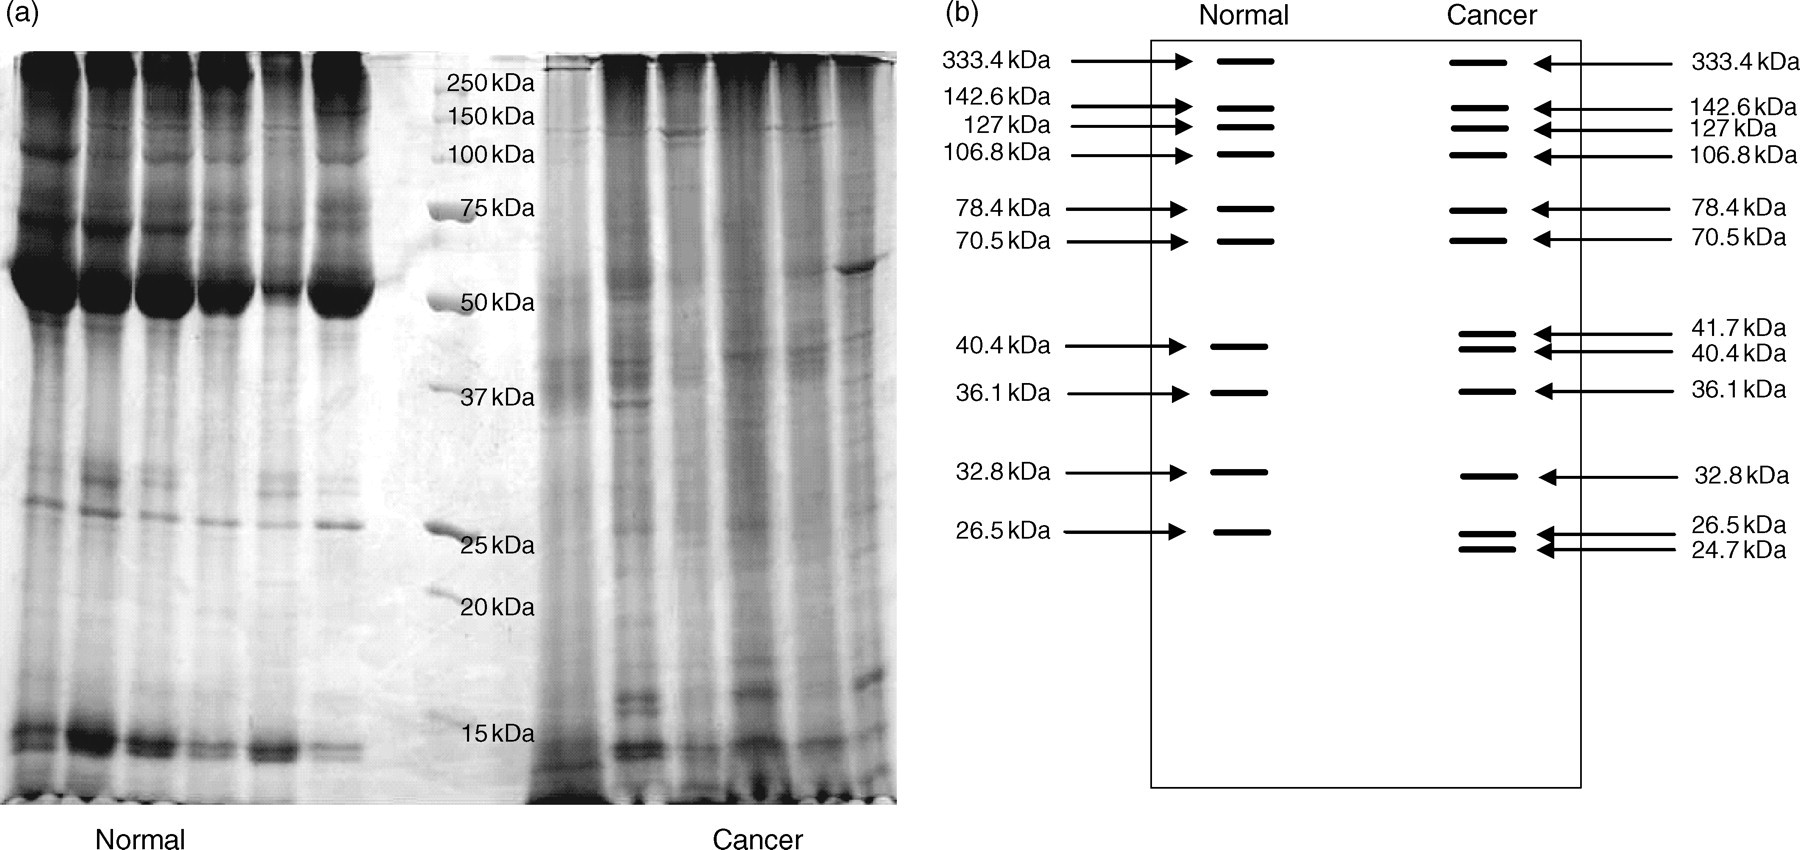
(a) Sodium dodecyl sulphate-polyacrylamide gel electrophoresis (SDS-PAGE) protein profile of normal and cancerous tissues from six different patients; (b) the diagram shows the consistently expressed protein bands in 70% of the patients tested
Figure 2 shows the mass spectrometry analysis of one of the peptides. Figure 2a shows the MS spectrum of a peptide fragment that was eluted at 34.4 min retention time. A doubly charged ion with m/z value of 612.0 was registered from the ionized peptide. Figure 2b shows the product ions spectrum (MS/MS spectrum) for the 612.0 m/z peptide ion. Figure 2c shows the amino acid sequence of TPAQYDASELK that was derived from the product ions spectrum shown in Figure 2b. This peptide sequence was confirmed via a series of b and y product ions that was produced through the fragmentation of the peptide. The b product ions detected were b5, b6 and b9 ions at m/z of 561.3, 676.3 and 963.4, respectively, whereas the y product ions detected were y2, y5, y6, y7, y8 and y9 at m/z of 260.2, 547.3, 662.3, 825.4, 936.5 and 1024.5, respectively. The product ions represented important information in determining the peptide sequence. The product ion spectra were analysed by the Mascot protein databases search, six peptides matched Annexin A2 (ANXA2) from the Homo sapiens taxonomy. The total score gained from the six matched peptides were 193, where a score >41 indicates the identity or extensive homology (P > 0.05). These peptides covered 18% of the total amino acid sequence of ANXA2. The theoretical molecular weight of the protein is 38,681. In addition, we also performed a manual inspection on the MS/MS data to ensure the reliability of the data.
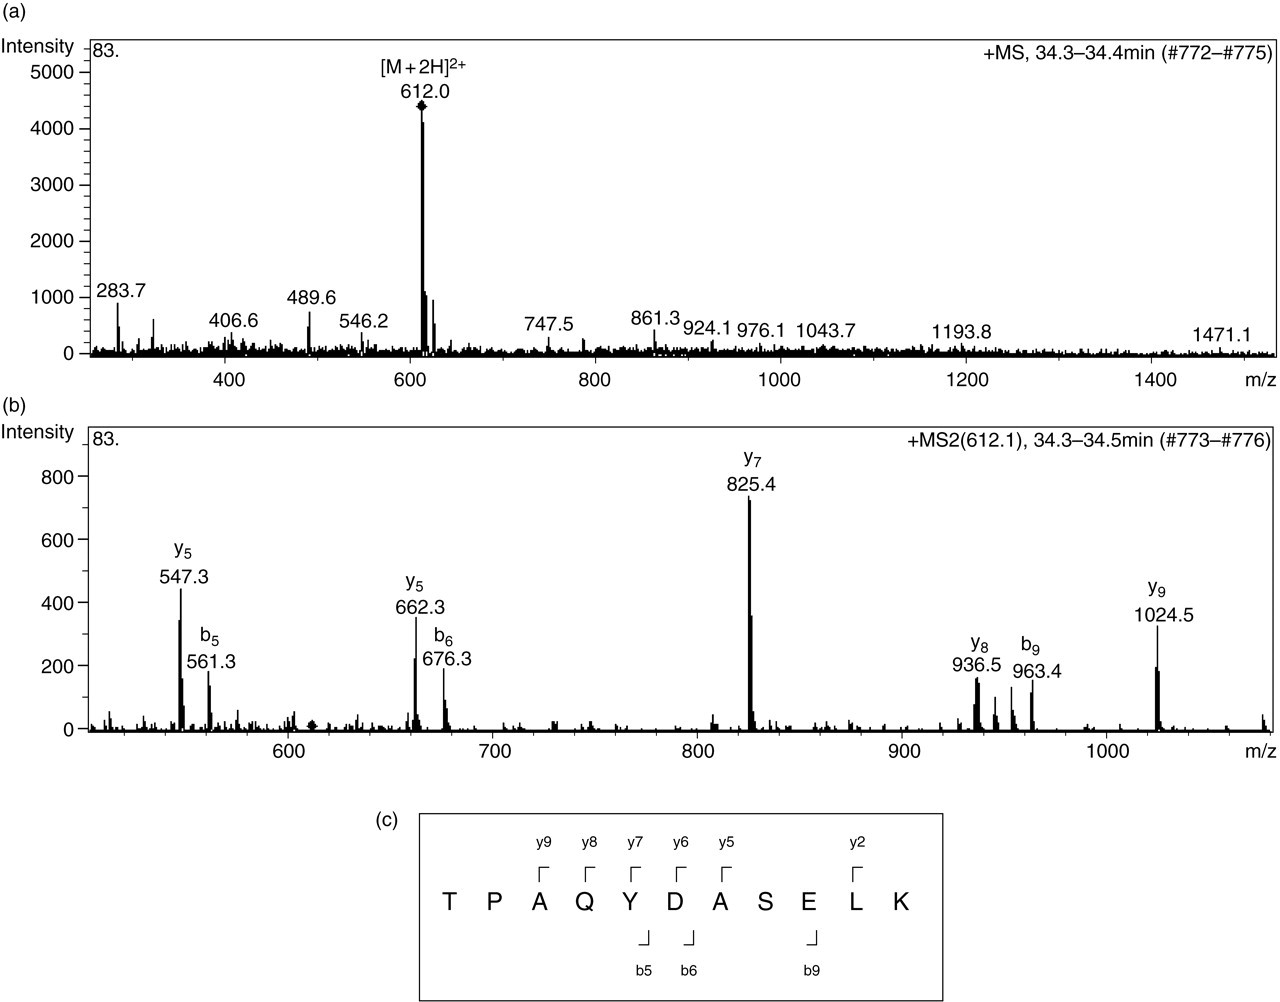
(a) A full scan MS spectrum; (b) a full scan MS/MS spectrum; (c) the peptide sequence derived from the full scan MS/MS spectrum in (b)
In the same analysis, we have also detected cytokeratin 1, cytokeratin 9 and cytokeratin 14 that were found in the same protein band with ANXA2. Six peptides were found that matched cytokeratin 1 whereas four peptides matched cytokeratin 9 while two peptides matched cytokeratin 14, and the total scores obtained for the respective proteins were 183, 84 and 49 (Figure 3). The sequence coverage of the proteins by their matched peptides was 9%, 7% and 5% for cytokeratin 1, cytokeratin 9 and cytokeratin 14, respectively. As the result of proteins possibly overlapping in a similar band, classification of up- and down-regulated protein based on protein band intensity is not reliable. In order to determine the expression level of each protein, both protein bands from the normal and cancerous tissues were excised for mass spectrometry analysis, an example of a protein band at 40.4 kDa is used for the explanation.
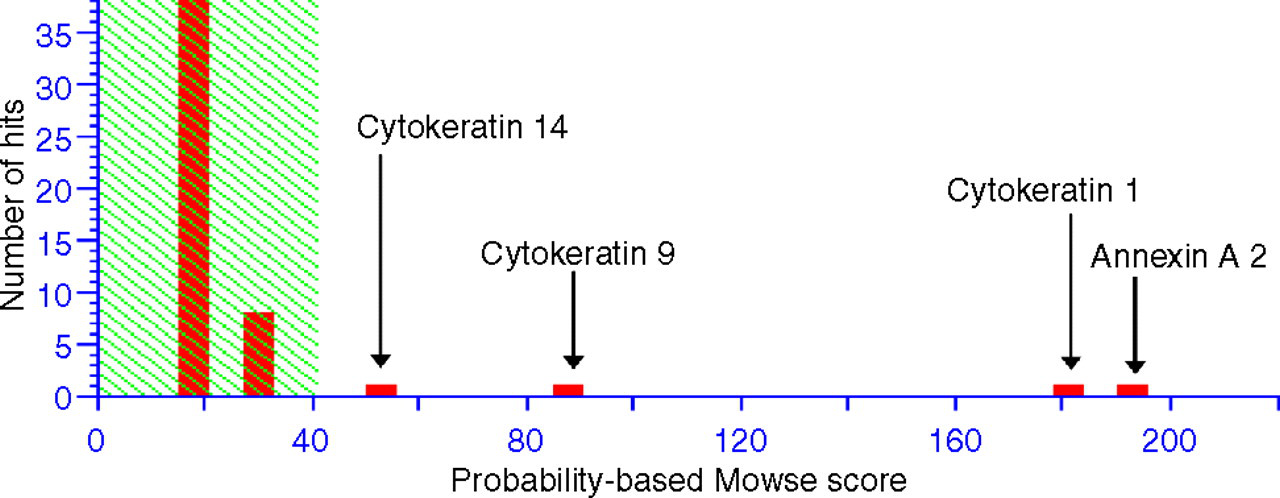
The proteins that were co-eluted with Annexin A2. Those proteins whose scores fall in the shaded box (<41) are not significant to indicate identity or extensive homology
Protein bands at 40.4 kDa were detected in both the normal and cancerous tissues. Densitometry analysis for the 40.4 kDa bands gave peak intensity of 1513.75 and 2178.75 for normal and cancerous tissue, respectively (data not shown). Upon mass spectrometry analysis, the proteins found in 40.4 kDa bands are shown in Table 2.
List of proteins identified from 40.4 kDa protein band for normal tissue and cancerous tissue
Phosphoglycerate kinase (PGK) was found only in cancerous tissues, and was therefore grouped as a cancer unique protein. On the other hand, actin α-1 skeletal muscle was detected in both normal and cancerous tissues, however extracted ion chromatogram of all the matched peptides for actin α-1 skeletal muscle, i.e. peptide ions 489.13(cancer)/489.53(normal); 500.15(cancer)/500.16(normal); 581.59(cancer)/581.57(normal); and 750.54(cancer)/750.55(normal) gave peak areas of 350,800(cancer)/3,305,767(normal); 89,259(cancer)/54,930 (normal); 5,084,225(cancer)/499,690(normal) and 1,816,825(cancer)/256,616(normal), respectively (an example is shown in Figure 4). The data indicate that actin α-1 skeletal muscle was expressed at a higher quantity in cancerous tissues and therefore it was grouped as an up-regulated protein. By using the same method, we have identified 22 proteins that were differentially expressed in cancerous and normal breast tissues.
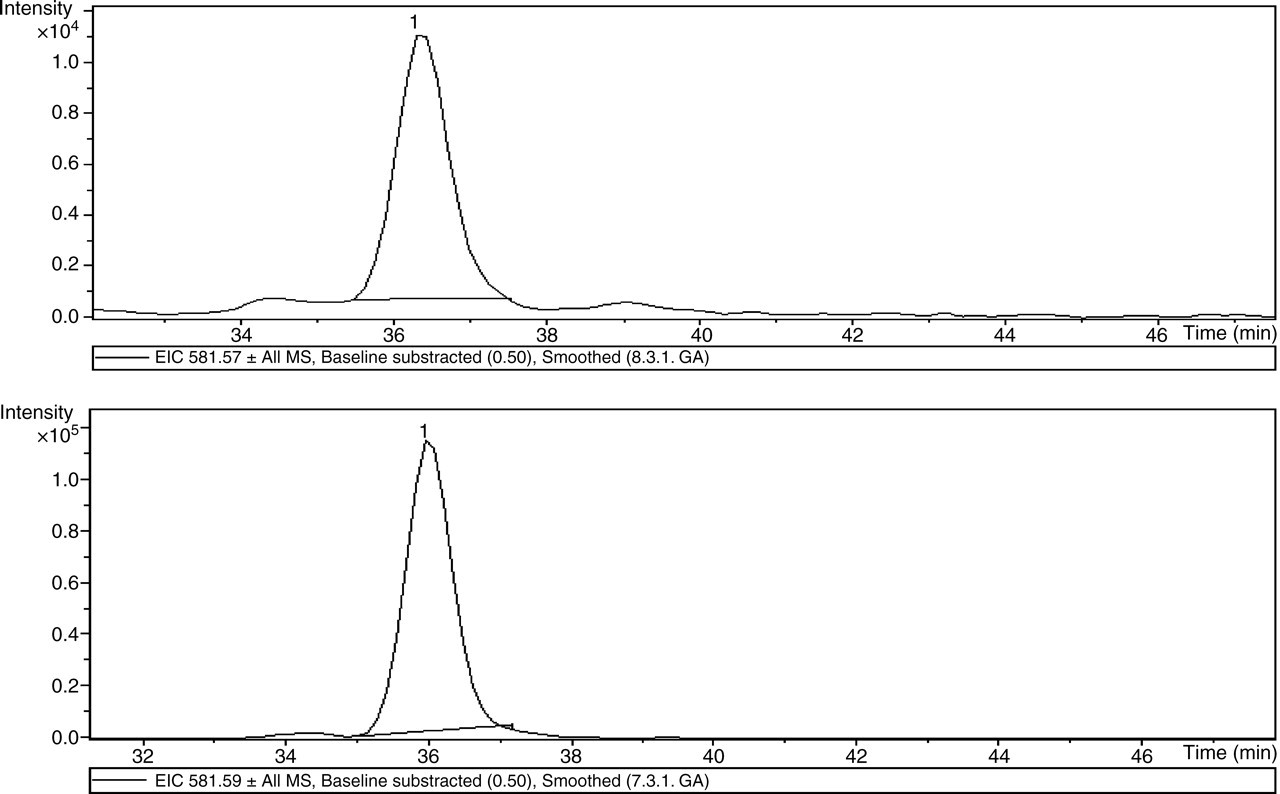
Extracted ion chromatogram of peptide ions 581.57 (normal, upper panel) and 581.59 (cancer, lower panel) for actin α, the areas under the peaks for these two ions were 499,690 and 5,084,225, respectively
Table 3 lists the down-regulated and up-regulated proteins identify in normal and cancerous tissue extracts. Four down-regulated proteins consisting of three structural proteins and one cytoskeletal protein. Eight up-regulated proteins consisting of two hypothetical proteins, two structural proteins, one each of calcium binding protein and extracellular matrix protein. Table 4 lists the proteins that were uniquely expressed in only one tissue type. Some of the unique proteins identified were heterogeneous proteins that displayed variable mobility in the SDS-PAGE, thus appearing as unique protein bands. These proteins were excluded from the list of unique proteins. The molecular classes of unique proteins to normal tissues were one each of hypothetical protein and growth factor whereas two structural proteins, two cytoskeletal proteins and one each of extracellular matrix protein, enzyme, calcium binding protein and chaperone were defined as unique to cancer. In this study, we see the potential of the unique proteins in cancer to serve as biomarker candidates.
List of based proteins down-regulated and up-regulated proteins identified in breast tissues
List of unique proteins identified in breast tissues
Although cancerous tissue specimens used in this study varied in the immunohistochemistry test for hormone receptor and C-erb-B2 oncogene, there is no correlation between the immunohistochemical results and the expression of the proteins identified.
Discussion
Surgically resected specimens were used for the analysis. The tissue specimens could thus be contaminated with other cells such as stromal cells in cancerous and normal tissues at various percentages. In addition to this there was the inflammatory cellular component which had to be considered. In order to reduce such contamination, frozen sections were taken from each specimen and only the regions that had the least contamination were used for the analysis. Furthermore, only the protein bands that were consistently found in at least 70% of the patients were targeted, which also minimized the possibility of having to analyse the proteins originating from the contaminant cells.
Phosphate extraction buffer was used to extract total cellular proteins, i.e. both hydrophobic and hydrophilic proteins from the homogenized tissue. The composition of the Ph buffer was made up of detergents, chaotrope, protease inhibitor, glycerol and sodium chloride salt. Detergents and chaotrope agents increase the solubility of a wide range of proteins. NaCl solubilizes membrane proteins that display both ionic and hydrophobic interactions and it also prevents precipitation of proteins at their respective pI. Glycerol promotes the protein solubilization and maintains protein stability by preventing protein denaturation. 12
SDS-PAGE is a cost-effective, rapid and robust protein separation method. Furthermore, it allows direct protein comparison as a few protein samples can be run concurrently in the same gel. This reduces the possibility of gel-to-gel variation that can be affected by many external factors such as changes in running conditions. Although SDS-PAGE has been shown to have limited resolution, this was compensated for by using LC/MS/MS analysis that is a highly automated, fast, reliable, powerful and also sensitive instrument for protein and peptide detection. 13,14 In general, the target protein was subjected to proteolytic digestion and the resultant peptide fragments were separated by liquid chromatography (LC) and analysed using MS/MS. Mass spectrometry, in line with the soft ionization method, electrospray ionization (ESI), has evolved as an important technique for the characterization of protein. 15–17 Moreover, CID 18 in MS/MS is capable of providing the mass and sequence information 19,20 of the primary structure of peptides. Since amino acid sequence for each protein is unique, the sequences revealed by the peptides can provide identification of a protein. In addition to qualitative analysis, the extracted ion chromatogram of the matched peptides can be used to quantify the relative intensity of each protein when subjected to identical analysis conditions.
Most of the proteins identified in this study belong to the cytokeratin family, the intermediate filament proteins that make up the cytoskeleton of epithelial cells. 8 Cytokeratins encompass structural signalling capabilities, and changes in cytokeratin expression patterns indicate tissue behavioural changes. Cytokeratin 8 is the major receptor for plasminogen on breast cells. 21 A large number of cytokeratins including cytokeratins 5, 6, 7, 8, 17, 18 and 19 were reported to be differentially expressed in cultured normal breast epithelial cells and the corresponding tumour cells. 22 Cytokeratins 8 and 18 were highly expressed in fibroadenomas when compared with breast cancers 23 and the similar patterns were reported in benign ovarian tumours and benign prostatic hyperplasia. 24 However, expression of numerous cytokeratins was reported to be reduced in breast cancer tissues. 23 In this study, we detected cytokeratins 12, 13, 8 and 18 as unique proteins in cancerous tissues and the expression of cytokeratins 1, 4, 9 and 10 were lower in the breast cancerous tissues than in the breast normal tissues.
Actin γ-1 and α-1 (ACTG1) were identified as up-regulated proteins. Actin γ mutation was associated with tumourigenicity and together with the alteration of other cytoskeletal proteins, it may cause cancer initiation or progression. Such mutations were identified in human neoplastic cells suggesting that mutated cytoskeletal genes may be one of the oncogenes. 25
Two hypothetical proteins were up-regulated in cancerous tissues. Hypothetical proteins are the proteins that are not described at the protein level but are predicted based on their amino acid sequence derived from cDNA. 26,27
Annexins represent a family of calcium and phospholipids binding proteins that are involved in several physiological processes including signal transduction, cellular differentiation and proliferation. 28 Annexins play key roles in breast cell proliferation and differentiation 29 and differential expression of annexins in normal and malignant human mammary tissue have been associated with the development of malignancy in the mammary gland. 30 We detected ANXA2 as an up-regulated protein in cancerous tissues, and ANXA2 pseudogene 2 as a unique protein in cancerous tissues. Annexin 2 was linked with tumour-endothelial interactions 31 and was differentially regulated between normal and malignant breast epithelial cells. 30
Glyceraldehyde-3-phosphate dehydrogenase (GAPDH) is an up-regulated protein in cancerous tissues. Up-regulation of GAPDH was reported in hypoxia, which is common in cancerous tissues 32 and also associated with breast cancer proliferation and aggressiveness of the tumour. 33
Succinate dehydrogenase is an enzyme of the Krebs cycle. We detected succinate dehydrogenase as an up-regulated protein in cancerous tissues although its expression was reported to decrease simultaneously with malignancy of breast tumours. 34
Amongst the proteins identified as unique to breast cancer was PGK-1, a glycolytic enzyme. PGK-1 induces multidrug resistance that results in the development of a barrier to successful cancer treatment. 35
BiP protein unique to cancerous tissues was also found. It is a member of the heat-shock protein-70 (HSP70) family. BiP protein was induced under physiological stress conditions, i.e. hypoxia, low pH and glucose deprivation that normally exist in the microenvironments of solid tumours. 36
Extracellular matrix proteins play important roles in many normal and pathological processes. Interactions between tumour cells and their surrounding extracellular matrixes are crucial events in the invasion and metastasis of cancer cells. Cancer cells metastasize through the extracellular matrix protein before entering small blood vessels or lymphatics. Therefore, extracellular matrix proteins can be associated with the advancement of cancer. In this study, we detected two types of extracellular matrix protein, i.e. collagen α-2(I) chain precursor as an up-regulated protein and collagen α-1(I) chain precursor as a unique protein. The role of collagen type 1 is highly significant in cancer development because it provides contact guidance for invasive tumour growth. 37,38 Although collagen α-1(I) chain precursor has not been associated with breast cancer, by virtue of its location on the cell surface and its function in cancer growth, its unique expression in cancerous tissue may imply a biomedical importance in the development or metastasize of breast cancer. Therefore its potential as a biomarker candidate for breast cancer is worth further investigation.
Conclusions
The proteins identified in this study were consistently expressed in >70% of the tissue, therefore their differential expressions in normal and cancerous breast tissues may be significant in regulating the development of breast cancer. The unique proteins from the cancerous tissues are particularly useful for the diagnosis of the disease especially when the protein is located on the cell surface. Amongst the proteins that were identified, we see the potential of collagen α-1(I) chain precursor as a biomarker for grade 3 IDCA. Nevertheless, this needs to be verified with a larger sample set.
Footnotes
Acknowledgements
We thank Universiti Sains Malaysia for funding this project and the Ministry of Health, Malaysia for providing the tissue specimens for the analysis. We also want to express our sincere gratitude to the patients who donated their surgically resected tissues for this study.