
Abstract
Abstract
Background
Biological variation of an analyte is an important determinant of its usefulness. Intraindividual variation in serum thyroid hormones, parathyroid hormone (PTH) and insulin-like growth factor-1 (IGF-1) in healthy subjects was determined in this study.
Methods
Blood samples were taken at weekly intervals for six weeks from 10 healthy subjects and analysed for serum thyroid-stimulating hormone (TSH), free thyroxine (FT4), free triiodothyronine (FT3), PTH and IGF-1.
Results
Intraindividual variations for serum FT4 and FT3 were <5.0%, IGF-1 9.4% and TSH and PTH 25.1% and 25.9%, respectively. Index of individuality was lowest for FT4 (0.42) and FT3 (0.38), and highest for PTH (1.09).
Conclusion
Intraindividual variation for FT4, FT3 and IGF-1 are low.
Introduction
Interpretation of serum hormone concentrations requires knowledge of the sources of variation, including intraindividual variation. 1 Intra and interindividual variations of thyroid-stimulating hormone (TSH), total thyroxine and total triiodothyronine have been studied before. 2–3 However, there is little information for free thyroxine (FT4) and free triiodothyronine (FT3), serum insulin-like growth factor-1 (IGF-1) and parathyroid hormone (PTH). 4 In this study we have assessed the intra and interindividual variations of TSH, FT3, FT4, IGF-1 and PTH.
Materials and methods
Blood samples were taken at weekly intervals from 10 healthy subjects (4 men and 6 women, median age 21 years, range 19–27 years; mean body mass index 21.3, range 19.0–25.9) for six weeks at the same time of the day (between 12:30 and 14:30 h), centrifuged within 30 min and stored at −70°C until analysis.
Serum TSH was measured by an immunochemiluminometric method, and FT3 and FT4 were measured by competitive immunoassays using a Bayer Centaur analyser (Bayer Ltd, UK). Serum IGF-1 and PTH were measured on the Nichols Advantage System (Nichols Institute Diagnostics, USA) by sandwich immunoassays.
Within-batch analytical coefficients of variation (CV) varied from 1.2% for FT3 to 13.5% for TSH (Table 1). All samples in this study were analysed in one batch.
Summary of results on the biological variation of thyroid hormones, insulin-like growth factor-1 (IGF-1) and parathyroid hormone (PTH)
*Figures in brackets are the laboratory reference ranges
†Figures in brackets are the concentrations at which the within-batch analytical CV was determined
TSH, thyroid-stimulating hormone; FT4, free thyroxine; FT3, free triiodothyronine; CV, coefficient of variation
Intraindividual biological variation (CVI), interindividual variation (CVG) and index of individuality (IOI) were calculated according to the method of Fraser 1 after testing for possible outliers. Statistically, none of the values were outliers. Biological critical differences at the 5% significance level were calculated as 2.77 × CVI. The critical difference between the two results was calculated as 2.77 (CVI 2 + CVA 2 )1/2. 1 All statistical analyses were done using SPSS version 11.1 (Chicago, IL, USA).
Results and discussion
Table 1 shows a summary of the results. Individual values are shown in Figure 1. For estimates of components of biological variation to be valid, the analytical component of variation has to be less than half the intraindividual variation. 5 The CVA for all hormones except TSH was below half of their CVI.
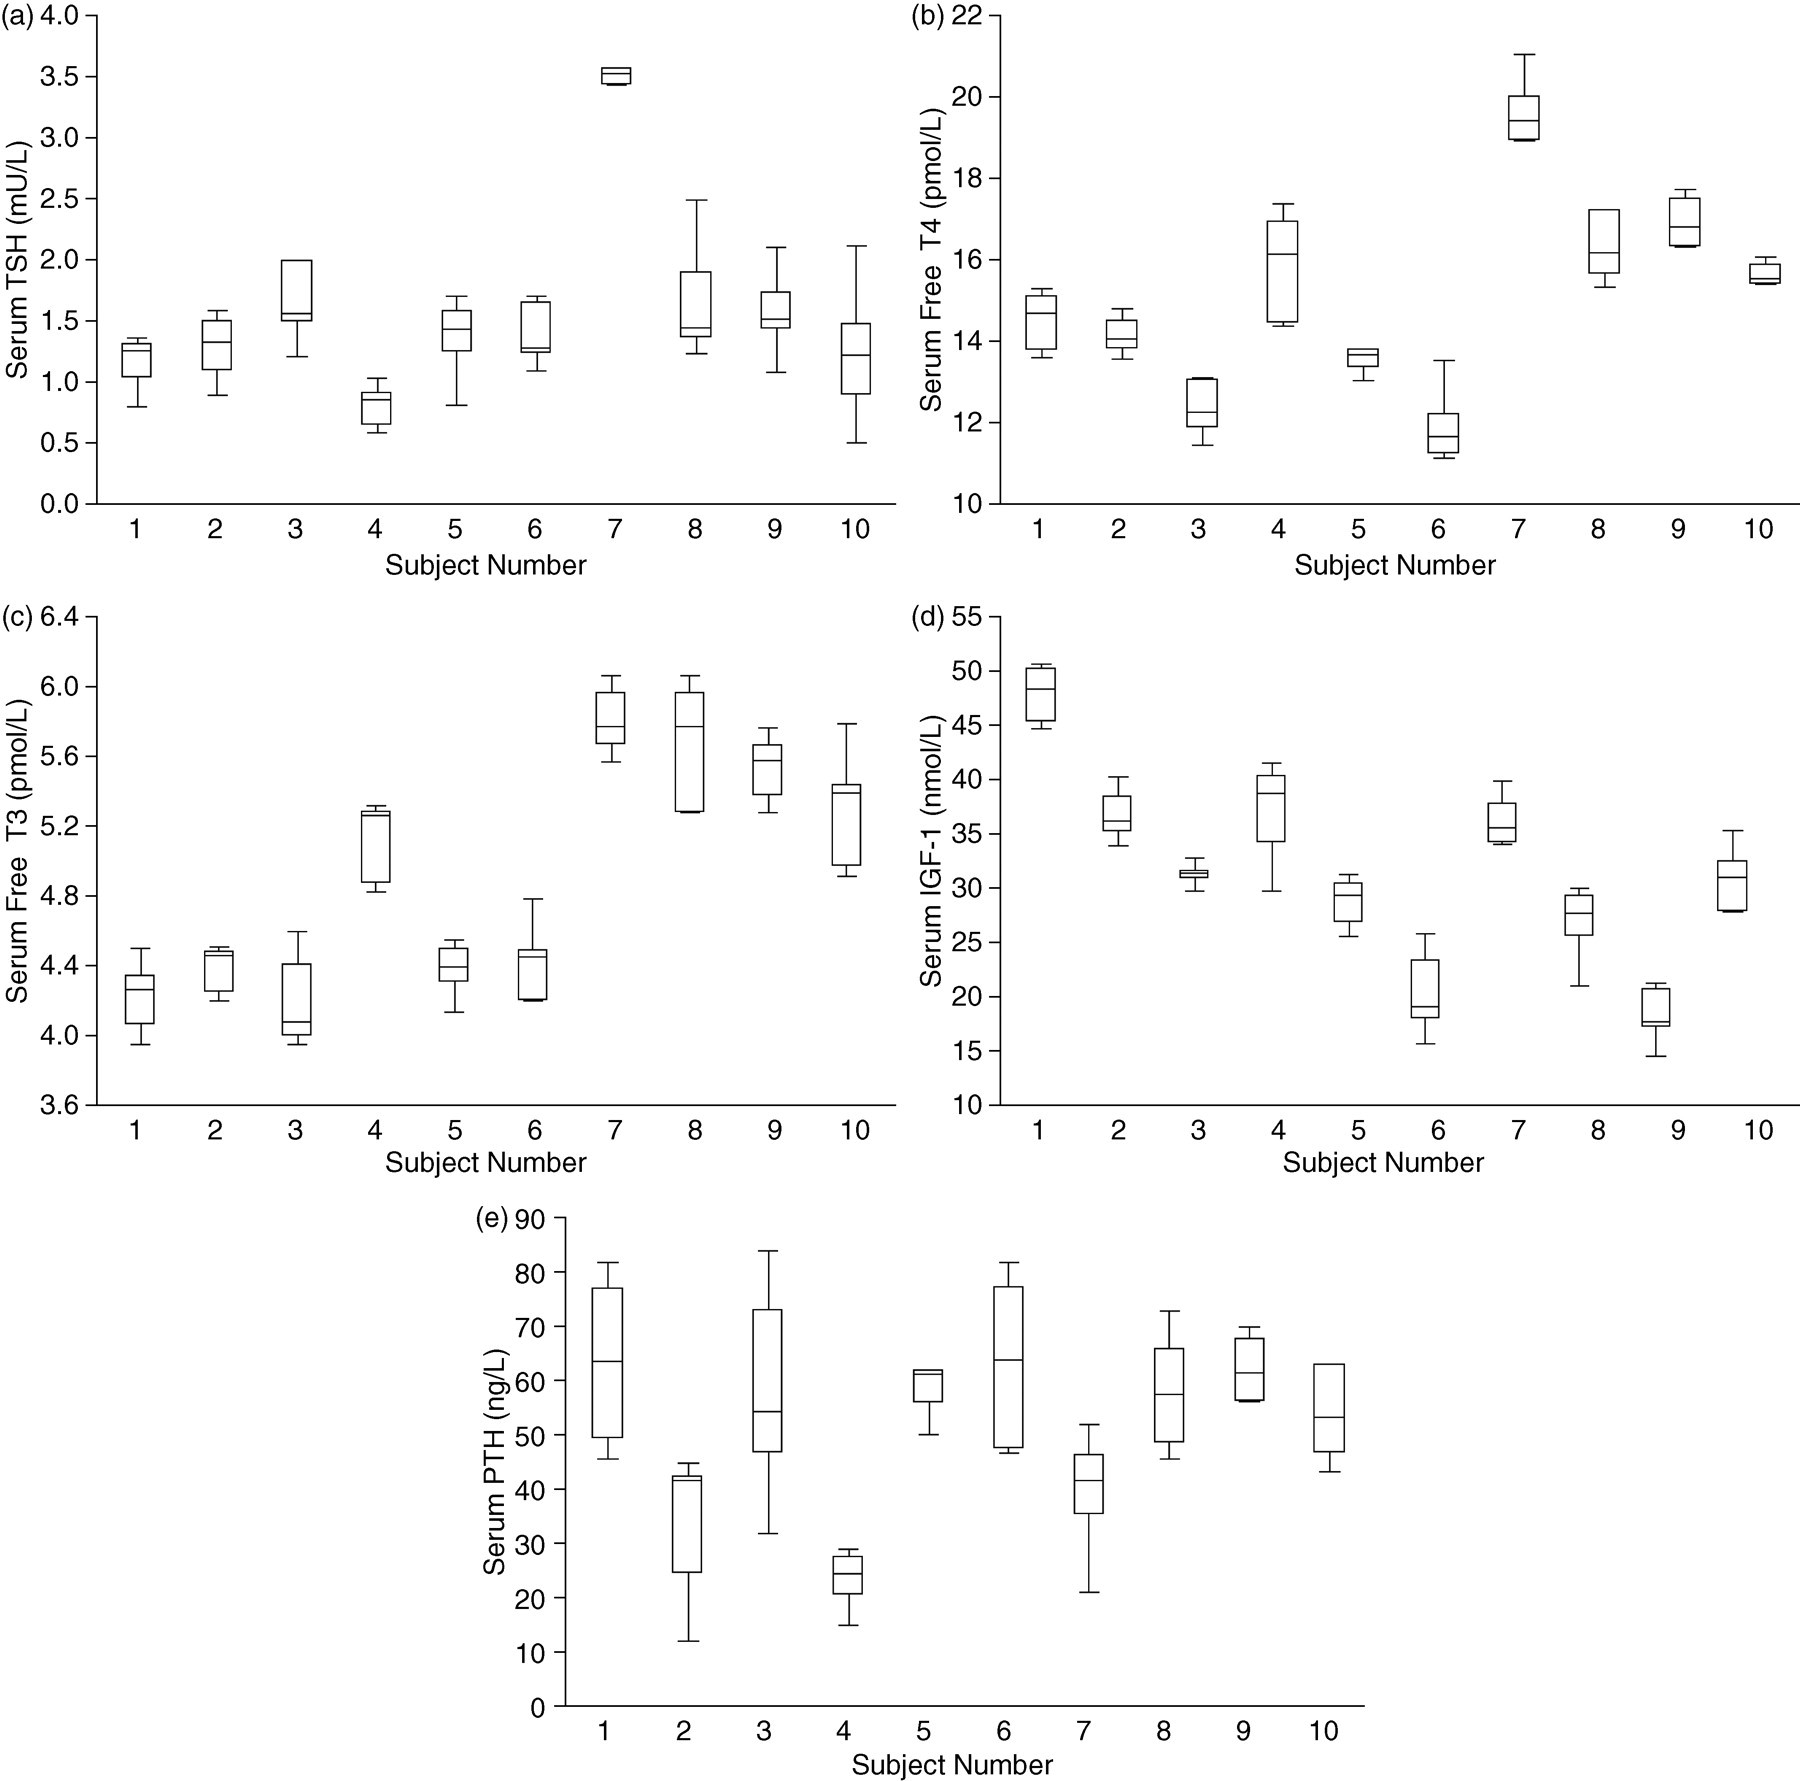
Box plot showing median (horizontal line), upper and lower quartile (large rectangle) and range (represented by the whiskers) for serum (a) thyroid-stimulating hormone (TSH), (b) free thyroxine (FT4), (c) free triiodothyronine (FT3), (d) insulin-like growth factor-1 (IGF-1) and (e) parathyroid hormone (PTH) in the 10 subjects
TSH has been known to show large fluctuations within and between individuals. Previous studies have reported intraindividual variation of 16.2% 3 and 19.3% 5 , and these values are similar to the findings here.
The thyroid hormones, FT4 and FT3 display the lowest intraindividual variation. Intraindividual variation of FT3 and FT4 observed in this study compares well with previous reports. 3,6 The data from this study confirm that within an individual, thyroid hormone concentrations are maintained within tight limits. This tight control of the thyroid hormone set-point is likely to be due to genetic factors. 7
The CVG of FT3 and FT4 make up the largest component of total variability. Overall, the current findings are in agreement with the notion that thyroid hormones show greater interindividual variation than intraindividual variation. 8 The importance of biological variation in the interpretation of thyroid function tests has recently been discussed. 8
This study presents new data for CVI for IGF-1 in healthy young adults and this (9.4%) is lower than the value (13.9%) reported in prepubertal children. 9 This is to be expected, as IGF-1 is sensitive to short-term changes in body mass seen during prepubertal growth. 9 However, for healthy adults maintaining a constant lifestyle, the hormone remains within tight limits. A change of 8.4 nmol/L between two samples from a healthy subject has a 95% chance of being significant. The CVG makes up the largest component of biological variation at 27.0%, indicating significant differences in the homeostatic mean values for IGF-1 among the 10 individuals. This high individuality between members of the group may be due to many factors including different genetic set-points. 10 Within each individual, PTH varied with a CVI of 26.0%. Serum PTH can change by as much as 37.3 ng/L before one can be confident with 95% certainty that the change is real. The CVG was 23.8%, some of which may be due to nutritional factors such as vitamin D status, which was not determined in this study.
We conclude that FT4, FT3 and IGF-1 showed little variation, and PTH showed the greatest variation within an individual in this study.