
Abstract
Abstract
Background
The most reliable assessment of vitamin D status is measurement of plasma 25-hydroxyvitamin D (25[OH]D) concentration. High variability in 25(OH)D measurements due to utilized test and assay technologies and the lack of standardization against reference materials and reference method often confounds proper assessment of vitamin D status.
Methods
We evaluated the accuracy of six routinely available methodologies: high-performance liquid chromatography (HPLC), the IDS-radioimmunoassay (IDS-RIA) and enzyme immunoassay (IDS-EIA), the Nichols Advantage automated protein-binding assay (Advantage), two versions of the DiaSorin automated immunoassay (Liaison 1 and Liaison 2) – and one prototype automated immunoassay (Elecsys) for assessment of the 25(OH)D3 status in a cohort of 300 randomly selected patients' samples compared with the reference method liquid chromatography-tandem mass spectrometry (LC-MS/MS).
Results
Passing-Bablok regression analysis demonstrated a slope for each method compared with LC-MS/MS that varied from 0.62 (IDS-EIA) to 1.0 (HPLC). The Advantage and the Liaison 1 showed significant deviation from linearity with highly variable individual results vs. the LC-MS/MS. Difference plots revealed a considerable persistent proportional bias for the IDS-RIA and IDS-EIA. All evaluated methods except HPLC demonstrated a more or less considerable deviation of individual 25(OH)D3 values compared with LC-MS/MS defined target concentrations.
Conclusions
Standardization of methods for the quantification of 25(OH)D on a human-based sample panel by means of LC-MS/MS would help to reduce the inter-method variability with respect to accuracy existing in 25(OH)D measurement considerably. However, there will still remain differences in the accuracy of methods utilizing sample purification before final quantification or immunological reaction when compared with those methods without separate sample purification.
Introduction
The most reliable assessment of vitamin D status is measurement of plasma 25-hydroxyvitamin D (25[OH]D) concentration. Two distinct forms of 25(OH)D exist: 25(OH)D3 from cutaneously derived vitamin D3 (cholecalciferol), the predominant natural source of vitamin D in humans and 25(OH)D2 from vitamin D2 (ergocalciferol), nearly solely derived from supplementation or fortification of food. As vitamin D2 is substantially less potent than vitamin D3 1,2 and vitamin D3 maintains 25(OH)D concentrations to a much higher degree (3-fold to 10-fold) than vitamin D2 3 does, 25(OH)D3 is the major metabolite of interest.
The hydrophobic nature of 25(OH)D, its binding to a specific binding protein (vitamin D-binding protein, DBP) with high affinity and with lower affinities to lipoproteins and albumin, and the impact of sample matrix on assay performance makes determination of 25(OH)D no easy task. 4 High variability in 25(OH)D measurements due to utilized test and assay technologies, the lack of equity of 25(OH)D2 and 25(OH)D3 metabolite recognition and the lack of a reference method often confounds proper assessment of vitamin D status. 5,6
Traceability and accuracy should be the very foundation of a high-quality assay. Human matrix should be utilized for establishing the reference material for standardization and calibration of the assay. Trueness should be defined by means of the reference method liquid chromatography-tandem mass spectometry (LC-MS/MS) with stable-isotope-labelled internal standard compounds. 7 This study evaluates the accuracy of six routinely available methodologies (Nichols Advantage being no longer available) and one prototype immunoassay for assessment of the 25(OH)D3 status in a cohort of 300 randomly selected patients’ samples compared with the reference method LC-MS/MS.
Materials and methods
Samples
A total of 300 surplus single donor EDTA plasma samples from routine laboratory investigations sent to the Department of Endocrinology and Oncology of the Limbach Laboratory, Heidelberg, from July to September 2005 for measurement of intact parathyroid hormone and various bone markers were randomly selected. The only selection criterion was the availability of a minimum amount of 3.5 mL plasma after the requested routine tests had been processed. After homogenization and centrifugation, the samples were bar-coded to achieve blinding of samples, aliquoted into portions of 0.5 mL and stored deep frozen at –80°C until analysis. Samples were measured by means of LC-MS/MS, high-performance liquid chromatography (HPLC), Liaison 1, IDS-radioimmunoassay (IDS-RIA), Advantage and Elecsys® assays in October 2005 and by means of the Liaison 2 and IDS-enzyme immunoassay (IDS-EIA) (simultaneously) assays in March 2007.
Methods
Liquid chromatography-tandem mass spectometry
LC-MS/MS was utilized as the candidate reference method for the quantification of 25(OH)D3 and 25(OH)D2, accordingly. 8 Between-run coefficients of variation (CVs) were 5.1% at a 25(OH)D3 mean concentration of 13 nmol/L and 3.2% at a 25(OH)D3 mean concentration of 48 nmol/L, respectively.
High-performance liquid chromatography
The HPLC method employs an initial acetonitrile protein precipitation with further solid-phase purification of the protein-free sample on a nucleosile C18 column. The eluted fraction is applied to a reverse-phase C18 analytical column followed by UV-quantification of 25(OH)D3 concentration at 265 nm. Between-run CVs were 6.5% at a 25(OH)D3 mean concentration of 73 nmol/L and 2.3% at a 25(OH)D3 mean concentration of 250 nmol/L, respectively.
IDS-radioimmunoassay
The IDS 25-hydroxyvitamin D RIA (Immunodiagnostic Systems, Boldon, UK) utilizes a competitive assay format with a highly-specific polyclonal sheep antibody, 125I-labelled tracer and anti-sheep IgG cellulose as second antibody. Before performing the RIA the 25(OH)D is released with sodium hydroxide solution from its protein bond and proteins are precipitated with acetonitrile solution and centrifugation. Between-run CVs were 8.1% at a 25(OH)D mean concentration of 58 nmol/L and 7.3% at a 25(OH)D mean concentration of 135 nmol/L, respectively. As stated by the manufacturer, cross-reactivity with 25(OH)D3 is 100% and with 25(OH)D2 75%, respectively.
IDS-enzyme immunoassay
The IDS OCTEIA 25-hydroxyvitamin D (Immunodiagnostic Systems) utilizes a competitive assay format with a polyclonal sheep-antibody-coated microplate and biotinylated 25(OH)D as a tracer. A proprietary buffer reagent is used for dissociating 25(OH)D from its binding proteins. Between-run CVs were 6.4% at a 25(OH)D mean concentration of 73 nmol/L and 8.7% at a 25(OH)D mean concentration of 133 nmol/L, respectively. As stated by the manufacturer, cross-reactivity with 25(OH)D3 is 100% and with 25(OH)D2 75%, respectively. The assay has been adapted on the Triturus® System (Grifols, Barcelona, Spain) an open, fully-automated ELISA analyser.
Advantage
The chemiluminescence competitive protein-binding assay from Nichols Institute Diagnostics (San Clemente, CA, USA) employs a proprietary releasing reagent to set the 25(OH)D free from its protein bond and irreversibly denature the serum proteins. The 25(OH)D of the sample and 25(OH)D3-coated magnetic particles compete for binding on vitamin DBP. An acridinium-ester labelled anti-DBP is utilized as a tracer. The test was performed on the fully-automated Nichols Advantage® Speciality System (Nichols Institute Diagnostics, San Clemente, CA, USA). 9 Between-run CVs were 9.9% at a 25(OH)D mean concentration of 50 nmol/L and 6.4% at a 25(OH)D mean concentration of 125 nmol/L, respectively. The manufacturer claimed 100% cross-reactivity with 25(OH)D3 and 25(OH)D2, but this has been disputed in several publications. 6,10 The test is no longer available.
Liaison 1
The LIAISON® 25 OH Vitamin D Assay (DiaSorin® Inc, Stillwater, MN, USA) is a competitive chemiluminescence immunoassay (CLIA). A polyclonal goat antibody to 25(OH)D is used for coating magnetic particles and 25(OH)D is linked to an isoluminol derivative. During the incubation, 25(OH)D is dissociated from its binding protein and competes with labelled 25(OH)D and 25(OH)D from the patients' samples for binding sites on the antibody. 11 Between-run CVs were 14.8% at a 25(OH)D mean concentration of 38 nmol/L and 13.2% at a 25(OH)D mean concentration of 133 nmol/L, respectively.
Liaison 2
A modified test version (LIAISON® 25 OH Vitamin D TOTAL assay) has become available recently. Modifications in the on-board extraction, two-step instead of one-step incubation and the use of human serum-based calibrators instead of horse serum should enhance assay performance. Between-run CVs were 10.2% at a 25(OH)D mean concentration of 38 nmol/L and 8.4% at a 25(OH)D mean concentration of 133 nmol/L, respectively. Both test versions claim cross-reactivity of 100% with 25(OH)D3 and 25(OH)D2 on an equimolar basis.
Elecsys®
The Elecsys® prototype vitamin D3 electrochemiluminescence immunoassay (Roche Diagnostics, Penzberg, Germany) utilizes a competitive assay format based on the streptavidin-biotin technology. The assay employs a polyclonal sheep antibody against 25(OH)D3, which is ruthenium labelled. The vitamin D in the sample competes for binding with biotinylated 25(OH)D antigen which is bound to the strepavidin-coated microparticles. The test is designed to be applied on automated immunoanalysers such as the Elecsys® 2010 or Modular Analytics E170. Between-run CVs were 4.7% at a 25(OH)D3 mean concentration of 48 nmol/L and 5.1% at a 25(OH)D3 mean concentration of 178 nmol/L, respectively.
All analytical platforms or tests were used in the participating laboratories for routine testing. They were run strictly in accordance with the guidelines given by the manufacturers and were subject to continuous maintenance and service according to our standard operating procedures for good laboratory practice.
Data and statistical analysis
Concentrations of 25(OH)D are given in molar units (nmol/L). For conversion to mass units (μg/L), molar units have to be multiplied by a factor of 0.4. 25(OH)D3 values obtained with LC-MS/MS were used as the reference for method comparison studies. Values reading below or above the lower or upper limit of the method-specific measuring ranges were omitted from evaluation. As a measure of method association between the LC-MS/MS targeted plasma samples and the seven evaluated 25(OH)D methods a Passing-Bablok regression analysis was performed.
12
For illustrating the magnitude of differences between each method and LC-MS/MS the differences expressed as a percentage of the LC-MS/MS value were plotted.
13
To test for the differences between each method and LC-MS/MS Wilcoxon match pairs signed ranks test was used. Mean difference and limits of agreement between each method and LC-MS/MS were calculated according to Hollis.
14
To evaluate the impact of cold storage times on measured 25(OH)D3 values 288 samples were remeasured by means of HPLC in April 2007 after one additional freeze/thaw cycle and obtained values tested for equivalence. Statistical analyses and calculation were carried out using the MedCalc software package version 9.2.1.0 (MedCalc, Belgium,
Results
Overall, 291 complete cases out of 300 could be evaluated. This final population consisted of 139 women, mean age 67 ± 1.2 (SEM) years (range, 26–92 years) and 152 men, mean age 64 ± 1.1 years (range, 27–90 years), respectively. The LC-MS/MS-defined 25(OH)D3 values covered a representative concentration range between 6.5 and 240 nmol/L with a mean value of 68 nmol/L (95% CI: 63–73 nmol/L), a median value of 63 nmol/L (95% CI: 53–65 nmol/L) and a non-normal distribution (Kolmogorov-Smirnov test: P = 0.006). A total of 277 of the cases had undetectable 25(OH)D2 values below 5 nmol/L (lower limit of quantification LC-MS/MS). Fourteen samples read between 5 and 8 nmol/L. Details of the Passing-Bablok regression analysis and the Spearman's rank correlation coefficient (rho) are listed in Table 1. The slope of the Passing-Bablok regression line for the evaluated seven methods relative to LC-MS/MS varied from 0.62 for the IDS-EIA to 1.00 for the HPLC, and the intercept from −3.45 nmol/L for the Elecsys® to 9.35 nmol/L for the IDS-RIA. These results indicate that despite apparent good correlation, as evidenced by the coefficients of correlation (0.89–0.99), systematic bias was detected in all the evaluated methods except HPLC. The Advantage and the Liaison 1 showed significant deviation from linearity with highly variable individual results vs. the LC-MS/MS. This assessment was confirmed by means of Wilcoxon match pairs signed ranks test which revealed significant differences between each method and LC-MS/MS except HPLC (Table 2). Negative ranks were predominant for all methods except HPLC indicating more or less pronounced underestimation of 25(OH)D3 values compared with LC-MS/MS. Difference plots according to Pollock et al. 13 (modified as % differences were plotted against LC-MS/MS value instead of average) were applied to all 291 evaluated samples (Figure 1) and separately to 186 samples reading lower than 75 nmol/L (Figure 2), respectively. A considerable persistent proportional bias is demonstrable for the IDS-RIA and IDS-EIA which would lead to an increasing underestimation of 25(OH)D values with increasing absolute concentrations. This assay behaviour is clearly attributable to an incorrect standardization and could easily be eliminated.
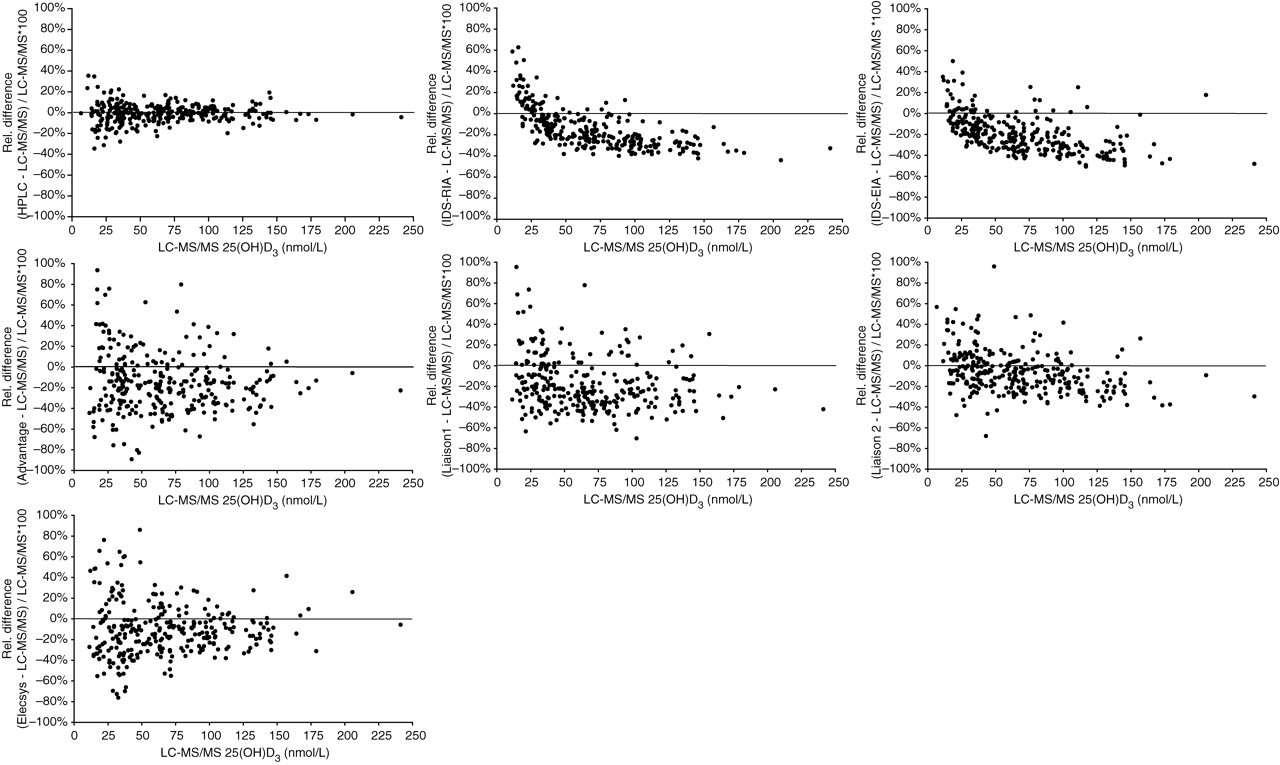
Plots of the percentage difference in 25(OH)D3 concentrations measured in seven evaluated methods and by liquid chromatography-tandem mass spectrometry (LC-MS/MS) (% differences are plotted against the LC-MS/MS value). A total of 291 complete cases covering a representative concentration range between 6.5 and 240 nmol/L by means of LC-MS/MS are plotted. 25(OH)D3 concentrations are given in molar units (nmol/L). For conversion to mass units (μg/L), molar units have to be multiplied by a factor of 0.4. (One extreme outlier is not shown for the IDS-radioimmunoassay (IDS-RIA), IDS-enzyme immunoassay (IDS-EIA), Liaison 2 and Elecsys® assay, two for the Liaison 1 and three for the Advantage, respectively. Corresponding LC-MS/MS 25(OH)D3 values were less than 8 nmol/L). For details of mean % bias and limits of agreements refer to Table 2
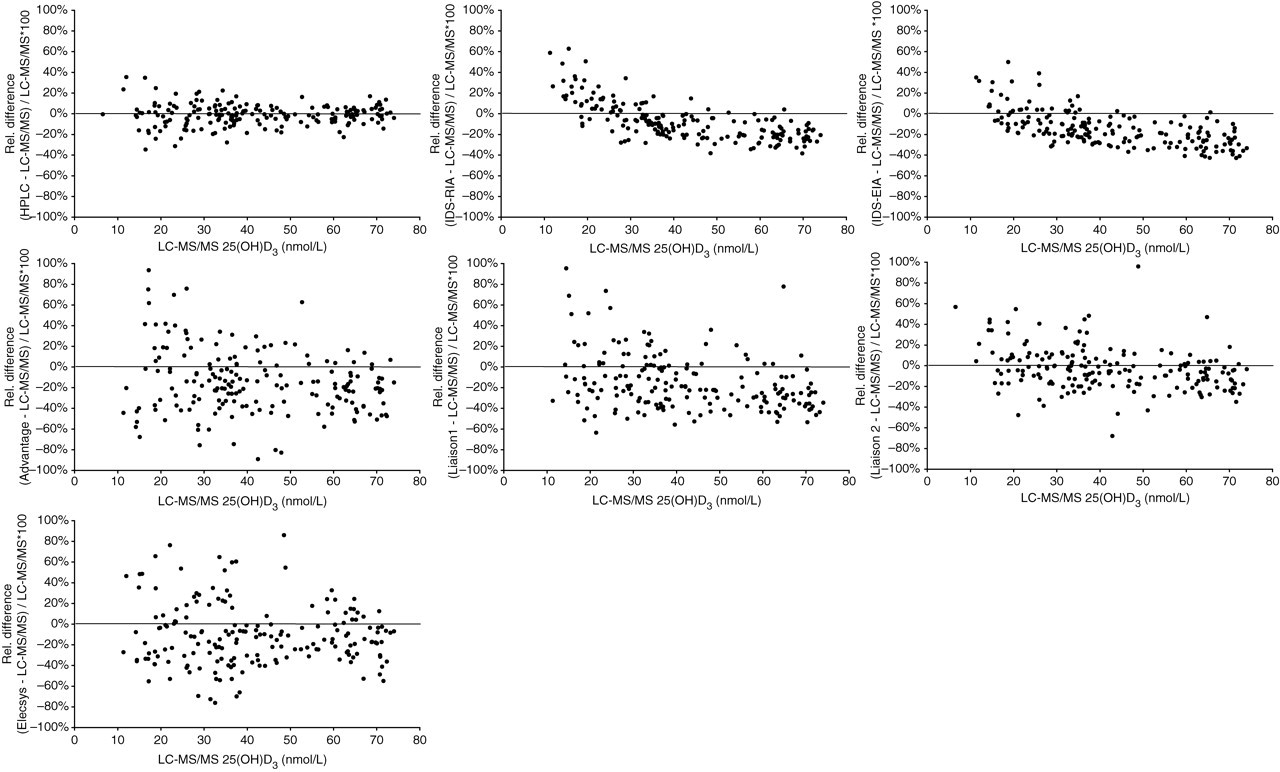
Plots of the percentage difference in 25(OH)D3 concentrations measured in seven evaluated methods and by liquid chromatography-tandem mass spectrometry (LC-MS/MS) (% differences are plotted against the LC-MS/MS value). A total of 186 cases with 25(OH)D3 values <75 nmol/L by means of LC-MS/MS are plotted. 25(OH)D3 concentrations are given in molar units (nmol/L). For conversion to mass units (μg/L), molar units have to be multiplied by a factor of 0.4. (One extreme outlier is not shown for the IDS-radioimmunoassay (IDS-RIA), IDS-enzyme immunoassay (IDS-EIA), Liaison 2 and Elecsys® assay, two for the Liaison 1 and three for the Advantage, respectively. Corresponding LC-MS/MS 25(OH)D3 values were less than 8 nmol/L). For details of mean % bias and limits of agreement refer to Table 2
Passing-Bablok regression analysis of evaluated methods vs. liquid chromatography-tandem mass spectrometry (LC-MS/MS) targeted 25(OH)D3 values
The degree of relationship between the variables was calculated by means of Spearman's rank correlation coefficient rho. 25(OH)D3 concentrations are given in molar units (nmol/L). For conversion to mass units (μg/L), molar units have to be multiplied by a factor of 0.4
HPLC, high-performance liquid chromatography; EIA, enzyme immunoassay; RIA, radioimmunoassay
Wilcoxon match pairs signed ranks test was used to test for differences between each evaluated method and liquid chromatography-tandem mass spectrometry (LC-MS/MS)
Comparison of evaluated methods was performed according to Hollis.14 In order to describe accuracy and limits of agreement, a difference plot of log-transformed values was used. Mean, mean ± CI and mean ± 2SD (limits of agreement) are calculated as antilogs of mean, mean ± CI and mean ± 2SD of differences of log-transformed concentrations (e.g. antilog (log(method x) – log(method y) = method x/ method y)
HPLC, high-performance liquid chromatography; EIA, enzyme immunoassay; RIA, radioimmunoassay
Since the observed range of differences depends on the LC-MS/MS value difference plots of log-transformed values were used according to Hollis 14 and mean % bias and limits of agreement given as antilogs (Table 2).
The Wilcoxon match pairs signed ranks test revealed a marginal, but statistically significant (P < 0.001) difference between 25(OH)D3 values measured in October 2005 (median 61 nmol/L, 95% CI: 49–66 nmol/L) and March 2007 (median 57 nmol/L, 95% CI: 47–63 nmol/L) by means of HPLC. In addition, 25(OH)D3 values obtained in 2005 and 2007 were tested for equivalence by calculating relative differences (25[OH]D3 value 2005–25[OH]D3 value 2007/25[OH]D3 value 2005*100). Mean relative difference was −7.5% (95% CI: −8.8% to −6.1%) and median relative difference was −6.4% (95%CI: −7.8% to −5.1%), respectively. It can be speculated whether this difference is attributable to measurement inaccuracy or instability of 25(OH)D3. However, the marginal loss of 25(OH)D3 is far exceeded by the observed Liaison 2 and, particularly the IDS-EIA, under-recoveries.
Discussion
The evaluated methods for the assessment of 25(OH)D concentrations represent a variety of different methodologies to release 25(OH)D from its protein bond with consecutive quantification of the molecule. LC-MS/MS and HPLC utilize a chemical release of the analyte from the DBP followed by a protein precipitation before separation of the 25(OH)D by means of chromatography and final quantification by mass spectrometry or UV detection. Sample prepurification guarantees assessment of 25(OH)D concentration without any interfering sample compounds. The IDS-RIA employs a comparable chemical sample purification followed by a classical immunoassay, whereas the remaining methods also chemically release 25(OH)D from its protein bond, but keep all serum compounds in the liquid reaction mixture until the final quantification occurs by means of immunoassay. This procedure may lead to interference with DBP, if entire chemical release of 25(OH)D from its binding protein and irreversible denaturation of DBP are not achieved or if there is interference of serum matrix factors (e.g. lipids) in the final immunological reaction. It is worth noting that the Advantage assay is the only immunoassay employing human DBP as a binding agent, which may make this assay more susceptible to matrix effects and potential cross-reactivity with metabolites such as 24,25- and 25,26-dihydroxyvitamin D or 25(OH)D3 sulphate, than the polyclonal antibody-based assays. 6,15,16
A problem for the quantification of 25(OH)D3 could be the strong binding of the molecule to its specific binding protein with variable affinities. 17 The association constants (Ka) of the three most common genetic forms of DBP (GC*1F, GC*1S and GC*2) are significantly different with the highest affinity for 25(OH)D3 of GC*1F. When compared with white skin Caucasians, black populations have a relatively high frequency of the GC*1F allele. 18 This high affinity for 25(OH)D3 of GC*1F could have an impact on obtained 25(OH)D3 values if 25(OH)D3 is not completely set free from its protein bond before quantification in different ethnic groups.
Since the principle of isotope dilution with stable-isotope-labelled internal standard compound, with its physicochemical behaviour identical to that of the native analyte, and mass spectrometry detection yields the highest attainable analytical accuracy, this methodology has been selected as the reference. Despite parallel quantification of 25(OH)D3 and 25(OH)D2 by means of the LC-MS/MS methodology, we could only focus on the determination of 25(OH)D3, since cholecalciferol, by contrast with USA and Australia, is the therapeutic choice of vitamin D supplementation in Germany. In our cohort of randomly selected patients’ samples, representative for Germany, none exhibited significant 25(OH)D2 values enabling us to evaluate assay performance of 25(OH)D2. Nonetheless, the problem of efficient analyte release from its protein bond and interference of serum matrix factors in the immunological reaction is applicable to 25(OH)D2 quantification as well. Furthermore, the importance of vitamin D2 as a contributing factor to maintain sufficient 25(OH)D concentrations and the assumption that vitamin D2 and vitamin D3 are equally effective in humans may be overestimated. Nutritional intake does not contribute to the human vitamin D status since without supplementation 25(OH)D2 serum values are very low or undetectable. 19–22 There is clear evidence that vitamin D2 is less effective than vitamin D3 in humans. 1,3 Finally, as stated by Houghton and Vieth, vitamin D2 should no longer be considered equivalent to vitamin D3 and ergocalciferol should not be regarded as a nutrient suitable for supplementation or fortification. 23
Except for HPLC all evaluated methods showed a variable systematic bias in measured 25(OH)D3 values when compared with LC-MS/MS. This variable systematic bias would limit the use of a single cut-off value for 25(OH)D3 established by means of a reference method. Therefore, at present this bias may justify assay-specific decision limits; 21 however, most importantly standardization of 25(OH)D3 detection methods against reference method should be sought.
There remains a significant difference for individual patients’ samples in the accuracy of methods utilizing sample purification before final quantification or immunological reaction when compared with those methods without separate sample purification, but the gap is getting narrower. LC-MS/MS has already been introduced as a simple, rapid and robust reference method for the determination of steroid hormones such as testosterone or oestradiol. The suitability for routine measurement of the 25-hydroxyvitamin D metabolites will make this interference-free method 24 an ideal tool for establishing a human serum or plasma-based sample panel covering the entire measuring range for standardization of available methods for the quantification of 25(OH)D. This would help to reduce the inter-method variability existing in 25(OH)D3 measurement and may pave the way for international standardization and for definition not of a single threshold value, but of clinically relevant 25(OH)D decision ranges. 6,25 Therefore, manufacturers should reconsider their respective assay standardization to improve accuracy. Despite the availability of a reliable reference method for proper assay standardization, intra- and inter-method reproducibility will still be a major contributing factor to the overall performance of 25(OH)D quantification. The wide range of results submitted to DEQAS by users of the same method illustrates the degree to which 25(OH)D methods are operator-dependent. 6 Therefore, we still have to quote Bruce Hollis: ‘The determination of circulating 25-hydroxyvitamin D: no easy task!’. 4
Footnotes
ACKNOWLEDGEMENTS
The authors thank Dr Uwe Kobold (Roche Diagnostics, Penzberg, Germany) for determination of 25(OH)D3 and 25(OH)D2 by means of LC-MS/MS. Dr Apostolos Kyriatsoulis for providing the Elecsys® prototype vitamin D3 reagents (Roche Diagnostics) and Dr Thomas Keller for his advice with the statistical analyses (ACOMED statistik, Leipzig, Germany). This study would not have been possible without the efforts of our colleague Ingrid Zahn and the technical staff of Limbach Laboratories, Heidelberg.