
Abstract
Abstract
Background
Total prostate-specific antigen (tPSA) is the best available test for the detection of prostate cancer but it lacks specificity. The free-to-total ratio (F/T ratio) is used to increase specificity in the range of tPSA of 4–10 µg/L.
Materials and methods
Four hundred and seven biopsy results and quantitative tPSA and F/T ratio data were combined. Using the histological determination, normal/hyperplasia versus malignant as a gold standard, receiver operating characteristic (ROC) curves as well as the areas under the curve (AUC) for tPSA and F/T ratio were determined. The differences between the two AUCs were considered for various tPSA ranges and specificities of F/T ratio and tPSA were calculated.
Results
In the total group, there was a gain of specificity of 11% (from 23% to 34%) when the sensitivity was 92% (using a cut-off >0.28 for the F/T ratio and a cut-off >4 µg/L for tPSA). When considering the group of patients for which the F/T ratio is currently used (4–10 µg/L), the gain of specificity was 27% (from 2% to 29%). This implicates that the number of unnecessary biopsies taken will be reduced by 27%. Moreover, the AUC of the F/T ratio was significantly higher at an even broader range of tPSA, i.e. up to 40 µg/L.
Conclusions
This study demonstrates that the F/T ratio has better diagnostic performance than tPSA, not only in the grey zone of tPSA, but also outside the grey zone, i.e. up to 40 µg/L.
Introduction
Prostate cancer has become one of the most frequently diagnosed cancers in men. When detected at an early stage, it is a form of cancer that can be successfully treated. Early detection is possible by the widely accepted and objective test: serum prostate-specific antigen (PSA) concentration. 1–3 An elevated total PSA (tPSA) concentration is an indication for prostate biopsy, with or without the combination of a deviate digital rectal examination or transrectal ultrasound of the prostate. Although until now it is the best test there is, the specificity of this important tumour marker is low.
In order to lower the amount of biopsies taken, an additional Food and Drug Administration approved marker has recently been investigated: free PSA. A small proportion of total PSA is unbound (free). Free and bound PSA make up total PSA. With the use of this marker, a free-to-total PSA ratio can be calculated (F/T ratio). The diagnostic value of this ratio has been the subject of various studies and especially how it can improve specificity. 4–7 The sensitivity is required to be high (90%–95%) to avoid missing cancer. 8 The inevitable consequence is an unacceptable low specificity, resulting in unnecessary biopsies. 8,9 Improvement of specificity implies that fewer biopsies will be performed in men who have elevated PSA concentrations and do not yet have cancer.
The aim of the present study is to retrospectively investigate the extent of improvement of specificity by using F/T ratio instead of total PSA in the patient group in which it is difficult to discriminate between normal/benign prostate hyperplasia and prostate cancer. The usefulness of the F/T ratio was explored within different ranges of total PSA.
Materials and methods
Study population
The study population consisted of 535 patients who were investigated by the urologists in our hospital and had a biopsy from January 1997 to December 1998. From these patients there were 620 pathology reports available. Data were retrospectively collected. Biopsies were taken within three months of PSA determination. If one patient had more than one pathology, tPSA and F/T ratio combination, the first in time was used. More biopsies may have been performed because of a first negative result or because of increasing PSA. There were 239 benign or hyperplasia pathology results, 175 malignant results, from which: four carcinoma in situ and three non-conclusive for malignancy results. The two last pathology results were excluded. Note that including or excluding them did not alter the outcome. Overall, 407 combinations of pathology, tPSA and F/T ratio were available for statistical analyses.
Pathology
As a rule, three biopsies from the right side and three from the left side were received in two separate vials in formalin. After fixation overnight, they were paraffin embedded and routinely processed to haematoxylin and eosin stained histological sections. The histological sections were evaluated by experienced pathologists. Right and left biopsies were reported as separate subheadings of the same report. In most cases, the grading was done according to Andersson (grades 1, 2 or 3). Gleason's grading was not routinely applied to needle biopsies at the time of data collection. The pathology report was used as the gold standard.
Prostate-specific antigen determination
During the time of study, an F/T ratio was performed from all PSA requests. Free and total PSA were simultaneously measured using the AutoDELFIA® ProStatusTM PSA Free/Total kit on the 1235 Autodelfia from Perkin Elmer, MA, USA, according to the manufacturer's protocol.
The free and total PSA assay is a solid phase fluoroimmunometric assay based on the direct sandwich technique in which three monoclonal mouse antibodies are used. Free and complexed PSA are equally bound to the same immobilized monoclonal antibodies specific for both free and complexed forms of PSA. Europium-labelled antibodies directed against an antigenic site which is accessible only in free PSA are reacted with solid phase bound free PSA. Simultaneously, samarium-labelled antibodies directed against antigenic site common to both free and complexed PSA are reacted equimolarily with bound free and complexed PSA.
The standards used in the assay were calibrated by immunoassay against purified PSA, isolated from human seminal plasma.
The inter-assay coefficient of variation of total PSA was 6.8% at a concentration of 0.62 µg/L, 6.1% at a concentration of 1.7 µg/L and 5.4% at a concentration of 6.1 µg/L. The inter-assay coefficient of variation of free PSA was 7.6% at a concentration of 0.08 µg/L, 6.8% at a concentration of 0.22 µg/L and 5.4% at a concentration of 0.65 µg/L. Intra-assay coefficients of variations were <3% at the various concentrations.
Statistics
Receiver operating characteristic (ROC) curves of tPSA and F/T ratio were constructed for various tPSA ranges, i.e. 0–1, 0–2, 0–3, etc. up to the entire range. The areas under the curves (AUC) of tPSA and F/T ratio were plotted (Figure 1, y-axis) against the upper limit of the tested tPSA range (x-axis, g).
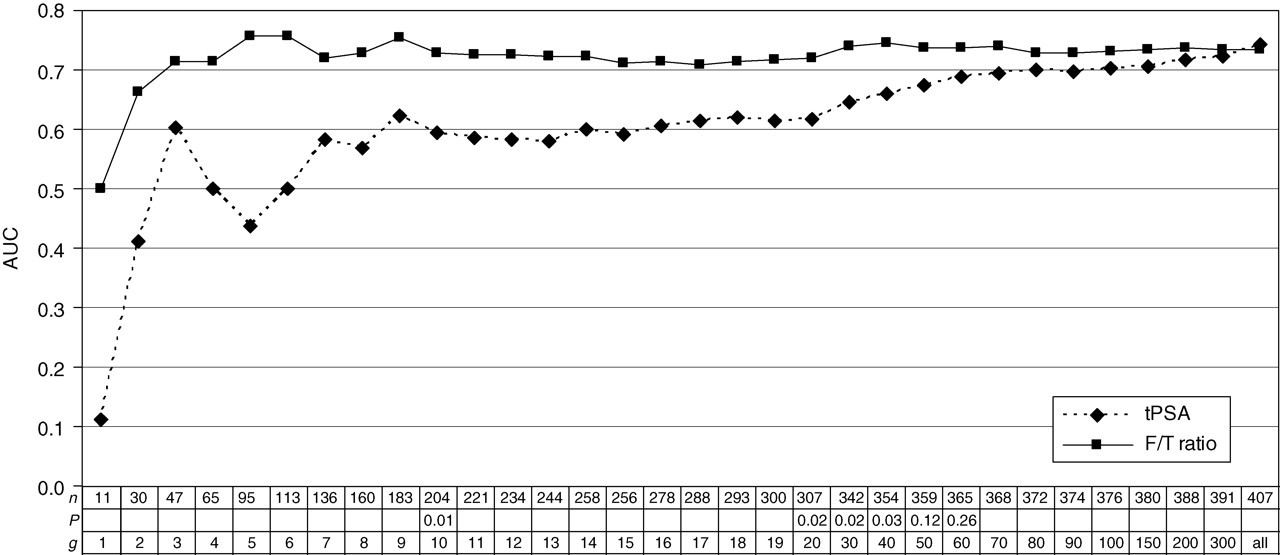
Calculated area under the curve (AUC) of total prostate-specific antigen (tPSA) and the free-to-total (F/T) ratio for different tPSA ranges. The calculated AUC of tPSA and F/T ratio for various tPSA groups. Each point represents the AUC for that particular tPSA range.
The statistical difference between the AUC values of tPSA and F/T was tested as follows: (1) the variable equals tPSA when tPSA was larger than the relevant cut-off, e.g. 40 µg/L or (2) it equals (1–F/T)/1 * 40 when tPSA <40 µg/L.
Thus, patients are evaluated on tPSA when that is larger than 40 µg/L and on F/T ratio when tPSA is lower than 40 µg/L, lower F/T ratios being more indicative of malignancy than higher ones. For statistical analysis, considering P < 0.05 to be significant, SPSS 11.0 and Stata (StataCorp, 2003, Stata Statistical Software: Release 8.0. College Station, TX: Stata Corporation) were used.
Results
The median age of the patients was 67 years (range 49–89 years), the median tPSA concentration was 10 µg/L (range 0.2–2810 µg/L) and the median F/T ratio 0.16 (range 0–0.82) (Table 1).
Patients' characteristics
tPSA, total prostate-specific antigen; F/T, free-to-total
The AUC calculated from the ROC curves were plotted against different ranges of tPSA (Figure 1). Regardless of the range of tPSA used, the AUC of the F/T ratio was always higher than the AUC of tPSA. The only exception to this was the total group of 407 PSA-pathology combinations in which the AUC of tPSA equals the AUC of the F/T ratio. The difference between the AUC of tPSA and the AUC of F/T ratio was statistically significant up to a tPSA of 40 µg/L.
In the total group, there was a gain of 11% (from 23% to 34%) of specificity when the sensitivity was chosen for both tPSA and F/T ratio at 92% (using a cut-off >0.28 for F/T ratio and a cut-off >4 µg/L for tPSA). In the tPSA subgroup of 4–10 µg/L, the gain of specificity was 27% (from 2% to 29%) with a sensitivity of 98% (using a cut-off >0.28 for F/T ratio and a cut-off >4 µg/L for tPSA; Table 2).
Calculated sensitivity and specificity with the cut-off values used
tPSA, total prostate-specific antigen; Sens, sensitivity; Spec, specificity; F/T, free-to-total
Discussion
PSA in serum is a valuable marker for cancer of the prostate, but the diagnostic accuracy of PSA is limited by the fact that PSA concentrations are also elevated in many benign diseases, particularly benign prostate hyperplasia. Elevated PSA concentrations are due to increased leakage or abnormal secretion of PSA into the circulation. In the blood the released PSA is predominantly bound to protease inhibitors and a minor fraction is present as free PSA (5%–40%). The contribution of free PSA to total PSA is significantly lower in men with prostate cancer than in men with benign disease. Hence, the F/T ratio is used in the diagnostic differentiation between prostate cancer and benign prostate diseases. An increased total PSA concentration and a decreased F/T ratio (below the cut-off) implies a worse diagnosis, while an increased total PSA concentration and a F/T ratio above the cut-off refers to benign diseases.
In literature, it has been described that when tPSA is used to predict the probability of prostate cancer within the 4–10 µg/L range, approximately 75% of all biopsies will be negative. 8–10 The F/T ratio can significantly improve specificity by 15%–25% compared with tPSA, with only a minimal loss of sensitivity in detecting prostate cancer. 11–13 This study confirms this improvement in specificity as there was a gain of 11% (from 23% to 34%) of specificity when sensitivity was 92% for both tPSA and F/T ratio using a cut-off >4 µg/L for tPSA and a cut-off >0.28 for F/T ratio. When considering the group for which the F/T ratio is currently used (tPSA: 4–10 µg/L), the gain of specificity was 27% (from 2% to 29%). This implies a reduction of 27% of unnecessary biopsies.
In literature, there are different cut-off values used for F/T ratio. 7,14–21 Catalona and colleagues showed that serum samples with an F/T ratio of >0.30 are extremely rare in the critically important diagnostic range of serum PSA concentrations >4.0 µg/L, where about 32% of all men will have prostate cancer. They advised an F/T ratio cut-off of 0.25, detecting 95% of cancers while avoiding 20% biopsies. 13–17 In a study by Luderer et al., 20 a cut-off value of 0.25 resulted in a sensitivity of around 100%, while the specificity was 31%. When the cut-off value of the F/T ratio was reduced to 0.20, sensitivity decreased to 88% and specificity increased to 50%. Pearson et al. 19 found a sensitivity of 76% and specificity of 94% when the F/T ratio cut-off value was 0.12. Christensson et al. 21 as well as Yeniyol et al. 7 concluded that at a cut-off level of 0.18 for F/T ratio most trustworthy results could be achieved.
In the present study, a cut-off of 4 µg/L for tPSA was used as this was proposed as a general guideline for biopsy in all age groups in a prospective study by Catalona et al. 14 Other cut-off values are proposed in literature, i.e. 3.0 and 2.5 µg/L. 15,16 There is much discussion about the various thresholds.
The use of higher tPSA thresholds risks missing an important cancer until it is too late for a cure, whereas the use of lower tPSA thresholds increases unnecessary biopsies, but also the proportion of biopsies that identify clinically insignificant disease. For patients between the age of 50 and 70 years, the use of a tPSA threshold of 4.0 µg/L has been accepted by most clinicians as a reasonable balance between these trade-offs.
The better diagnostic performance of F/T ratio has been illustrated in the present study by plotting AUC values of the ROC curves of tPSA and F/T ratio against the total PSA range tested. This is a new way of using ROC curves, but clearly shows the superiority of F/T over tPSA up to a PSA concentrations of 40 µg/L. This has not been shown before as in literature the advantage of F/T ratio has been described for tPSA of 2 to 20 µg/L. 6,13,22–24 This result could only be obtained because we measured F/T ratio in a standard combination with tPSA, regardless of the tPSA concentration, which is rarely undertaken.
In our study, there was a selection bias because only data were used from patients with both a PSA determination and biopsy, while those with no biopsy were not studied. Those patients with no biopsy were expected to have negative (benign) pathology results. As shown by Punglia et al. 25 , excluding this selection bias in a study in which all patients have both PSA determination and biopsy, even better results in terms of sensitivity and specificity could have been obtained, increasing the area under the ROC curves.
Further optimization of the decision biopsy or no biopsy may be achieved by using an artificial neural network as worked out by Stephan et al. 22 and Finn et al. 26 This network uses PSA and F/T ratio and also includes clinical information, such as age of the patient, prostate volume and digital rectal examination. Such a network further reduces the number of biopsies without lowering the sensitivity. We suggest that the performance of F/T ratio within the tPSA range 4–40 µg/L should be evaluated in an artificial neural network.
A limitation of this study is that if this study would have been performed with a total and free PSA assay of another manufacture not exactly the same results would have been obtained. This is due to lack of standardization of these assays. 27,28
Large disparities exist among assays due to calibration material (purified PSA, World Health Organization reference material), matrix differences between serum samples and buffer-based reference material, antibodies with different reactivity and affinity for the various forms of free PSA and complexed PSA in buffer or serum-based samples, the kind of detection system and the length of incubation time.
However, the message that the F/T ratio has better diagnostic performance than PSA remains similar. Further efforts are needed to harmonize total and free PSA assays, so clinical decision-making (biopsy/no biopsy) will not be influenced by the assay type. In conclusion, the F/T ratio provides a higher specificity compared with tPSA. This superior performance is seen over a much broader tPSA range than has ever been shown, to our knowledge, in the literature before. A lower F/T ratio is more indicative of malignancy than higher. The cut-off values to be used depend on desired sensitivity, specificity and the assay of the manufacturer.
Footnotes
Acknowledgements
Department of Clinical Chemistry, Atrium Medical Centre, Heerlen, The Netherlands; Department of Pathology, Atrium Medical Centre, Heerlen, The Netherlands and Department of Urology, Atrium Medical Centre, Heerlen, The Netherlands