
Abstract
Abstract
Aim
To provide conversion formulae between measurements based on different specimens in use in epidemiological studies and clinical practice, and to evaluate the relative precision for the different methods.
Background
The current guidelines emphasize the use of venous plasma for determining glucose concentration. Nevertheless, the World Health Organization (WHO) guidelines provide cut-off points for different specimens for the determination of the glucose concentration in circulating blood (venous plasma, whole blood, serum and capillary blood). There is a lack of data about the comparability between the values obtained by using different specimens.
Methods
Eleven different combinations of specimens and methods of measurement of blood glucose were used in 294 blood samples from 74 subjects. The methods were grouped by the specimen used for analysis (venous plasma, whole blood, serum and capillary blood).
Results
The result of the analysis is a set of linear equations allowing conversion of the result from one specimen or method to another. Furthermore, it was estimated how much of the variation for each method can be attributed to laboratory variance.
Conclusions
Measurements based on capillary blood had a very large variability compared with other methods. Measurements based on venous whole blood tended to give results 0.5 mmol/L lower than other methods. Our data indicate that the current diagnostic cut-off points, as recommended by WHO for non-plasma specimens, are not fully compatible and may differ as much as 0.5 mmol/L between specimens.
Introduction
In clinical diagnosis and monitoring of diabetes mellitus (DM), as well as in screening and in epidemiological studies of glucose tolerance, it is important to be able to produce accurate and reliable measurements of blood glucose levels. In practical clinical settings, it is of primary importance to have reproducible methods in order to make the surveillance of patients' circulating glucose levels as precise as possible. Hence, the primary concern will be the accuracy and reproducibility of the particular method in use at a particular clinic, i.e. internal validity.
Blood glucose is measured in many different ways (plasma/blood, capillary/venous, etc.) and the World Health Organization (WHO) provides diagnostic cut-off points for each of these, but no reference for the conversion factors is provided. The cut-off points for diagnosis of DM and glucose intolerance are therefore based on conversion factors for which there are very limited scientific data. The present study aims at solving this lack of information by providing conversion formulae.
As a diagnosis of diabetes has major implications for the patient with respect to treatment, lifestyle, insurance, etc., it is important that the diagnosis based on specific values of the glucose concentration in peripheral circulation (typically cut-off points), is independent of the method of assay and laboratory used (external validity). The measured values should reflect those of the laboratories that formed the basis for the implemented clinical procedures. In epidemiological studies where populations are surveyed with respect to glucose tolerance, it is of further interest to know the relationship between methods used in different centres. Particularly in studies that comprise populations diverse in time or geography, one is likely to encounter a large number of methods used. Therefore, both systematic differences between methods (biases) and variations of the measurement methods with respect to repeatability, reproducibility and possibly random interactions between individuals/samples and methods must be addressed. Both systematic and random differences between methods must in this context be considered at two levels:
Differences between methods based on different blood specimens (i.e. venous plasma/venous whole blood/venous serum/capillary blood); Differences between methods based on the same specimen.
The latter differences both in terms of bias and variance must be expected to be the smaller of the two.
It is somewhat surprising that hardly any conversion factors between different types of specimens or methods exist in the contemporary medical literature. 1,2 The aim of the present study has been to address these questions for 11 combinations of four specimens and eight methods for blood glucose measurement. However, the repeatability question has not been addressed separately, as the main purpose has been for applications in epidemiological studies. The repeatability must be addressed in specific studies for each laboratory. Further, it was the aim to provide guidelines for using the prediction from one method to another in practical epidemiological situations.
In addition, we aimed at comparing the WHO diagnostic criteria 3 for diabetes for measurements based on venous plasma, venous whole blood and capillary blood with the conversion formulae we derive. Ideally, the cut-off points used in the WHO diagnostic criteria for the different types of specimens should coincide with the conversion formulae except for rounding errors.
Material and methods
Subjects
The study subjects were randomly selected from among the participants of the Finnish Diabetes Prevention Study (DPS) 4,5 in five study centres, 11–19 per centre. The subjects were, according to inclusion criteria to the DPS, overweight (body mass index [BMI] > 25) and had impaired glucose tolerance (WHO 1999 criteria) 3 at the beginning of the study. This selection of patients was deliberate in order to assure a broad range of glucose levels for the comparison study.
Blood sampling
The oral glucose tolerance test (OGTT) was administered in the morning after an overnight fast of 10–16 h. After collection of the fasting venous and capillary blood samples, the subjects drank 75 g of anhydrous glucose and 1.6 g citric acid in 250–300 mL of water in the course of 3 min. Capillary and venous blood samples were collected 30, 60 and 120 min after the test load from the antecubital vein with the subject in a sitting position. The skin was cleaned (with 70% ethanol etc.) and blood was drawn into vacuum tubes. If a tourniquet was used, it was opened immediately after the needle had entered the vein. All the blood samples were drawn by experienced research nurses.
The capillary sample was obtained using an automatic lancet from the side of the fingertip, without squeezing the finger. The capillary sample was taken immediately after the venous samples.
Sample processing
All centres collected a reference sample in a citrate fluoride tube, which was mixed by turning it around gently and centrifuged 10 min (3400 rpm), within 15 min. Plasma was separated and dispensed into two tubes, of which one was mailed the same day to the central laboratory in an envelope and the other one was frozen and kept at −20°C and sent to the central laboratory packed in dry ice.
Venous serum sample was drawn into a plain vacuum tube and allowed to clot at room temperature for 30–60 min and was centrifuged, after which the serum was separated. The serum was kept in the refrigerator, and the glucose concentration was measured within 3 h.
Glucose measurement methods
The 11 methods fall in four classes based on the material (specimen) used for the measurements as shown in Table 1. The names refer to a combination of the method and the specimen.
The 11 measurement methods compared, grouped by specimen. The names refer to those used in labelling plots and tables
Data
Data are hierarchically classified by centre, person, time and method, with five centres, 74 persons and four time-points (0, 30, 60 and 120 min) for each person. Table 2 shows which methods were applied to samples from each centre.
Types of blood specimens for the measurement of blood glucose and allocation
Number of samples by centre. Note that a few samples were lost in some of the centres, so not all individuals were measured on all methods, and not all individuals contribute four samples
Statistical methods
The statistical standard for comparing methods of measurement are given in Bland and Altman (1986, 1999), 6,7 where ‘limits of agreement’, and the so-called Bland–Altman plots are explained. However, in this study, the different samples from the same person are not independent, we have more than two methods to compare, and we want to devise an algorithm to convert between the methods. Hence, a statistical model extending the Bland–Altman approach was set up.
The data using the pairs of methods, actually directly compared, are shown in Figure 1. The assumption about constant difference (which underlies ‘limits of agreement’) was clearly not tenable, so a model with a linear relationship between methods was chosen.
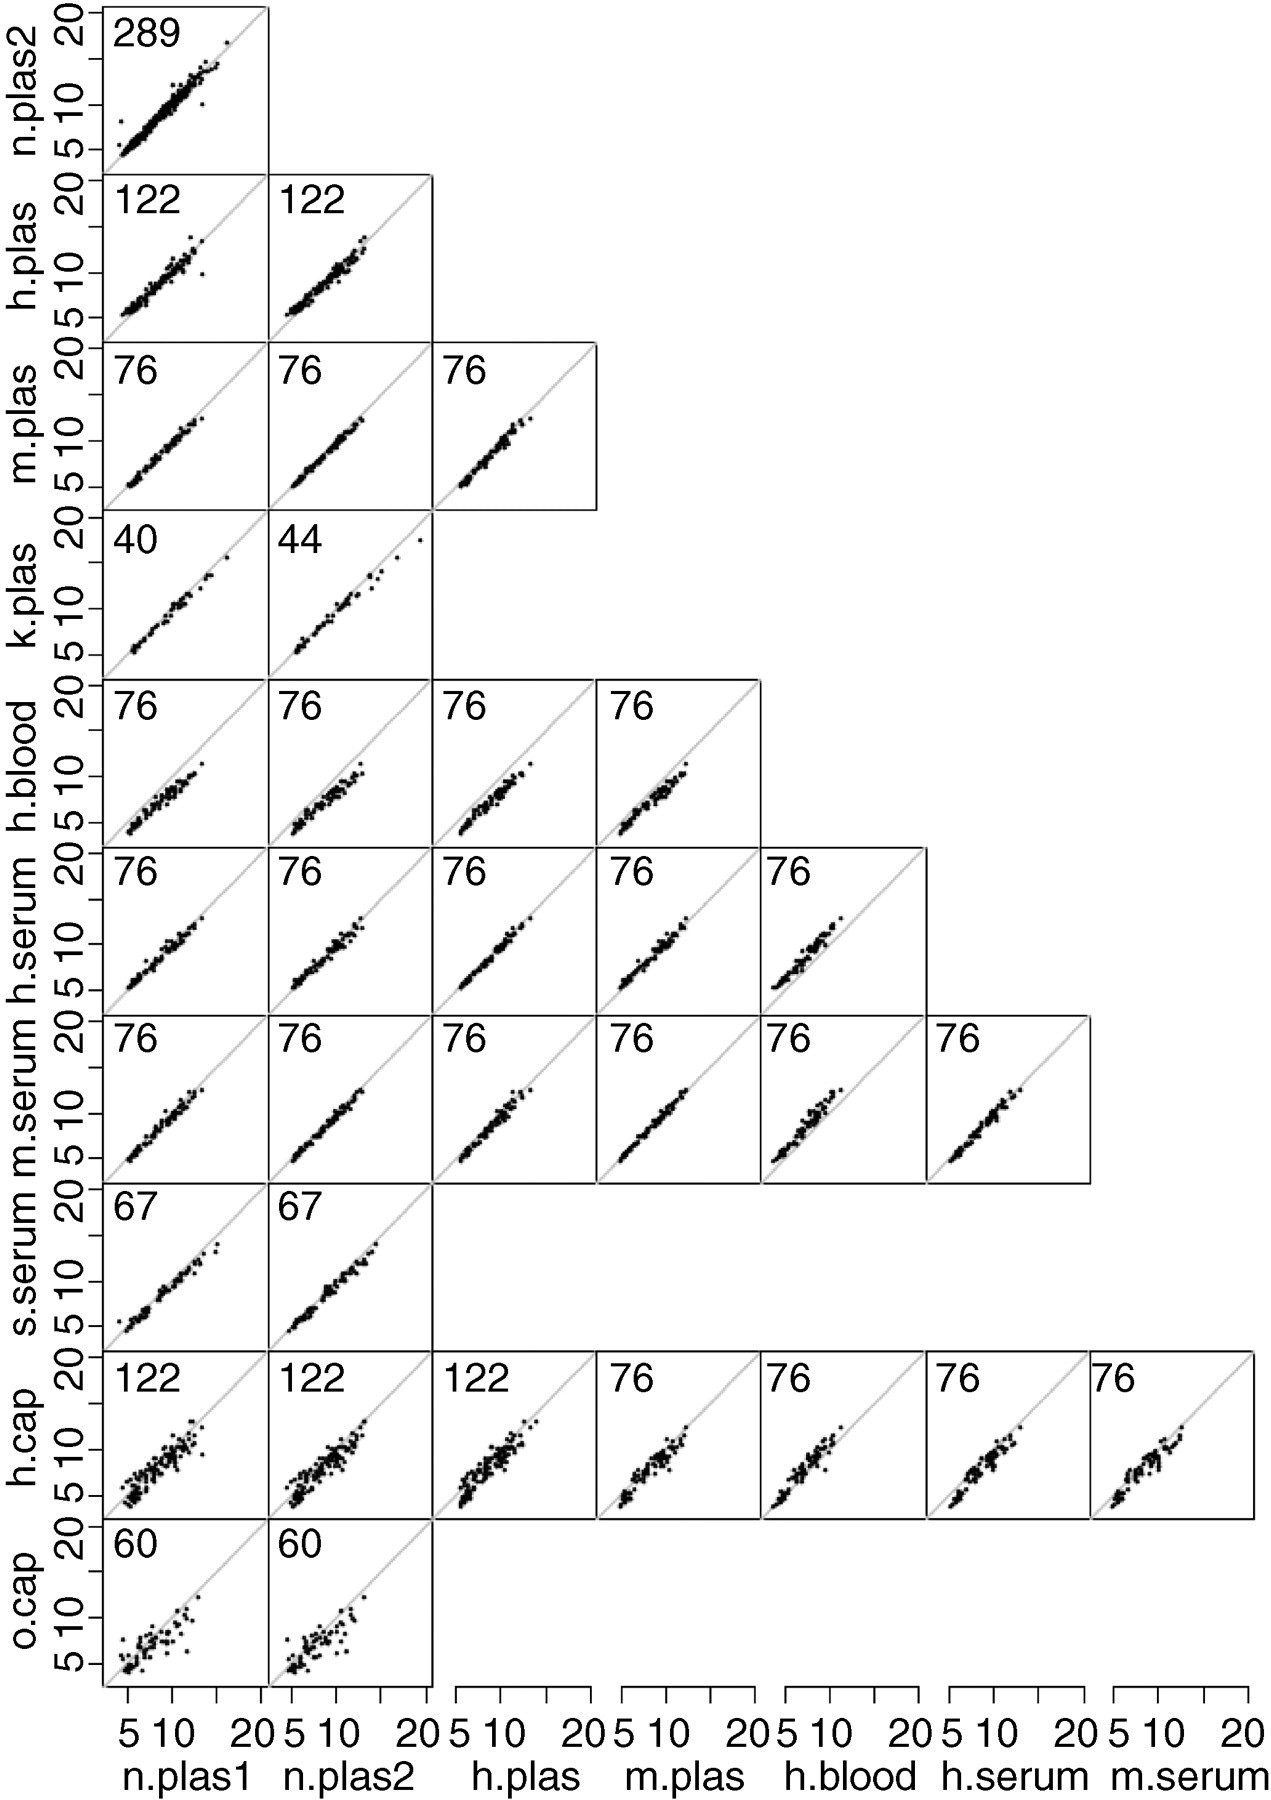
Original data (blood glucose in mmol/L) for the pairs of methods that have been applied to the same blood samples are shown. Number of points is given in the upper left corner of each panel
The model was fitted to both the original and log-transformed data, to see whether the log-transformation produced a substantially better fit. We found no indication of non-linear relationships or increasing variance by glucose level that would have made the log-transformation preferable (data not shown). On the other hand, data were reasonably compatible with modelling on a log-scale; there was very little power in the study to discriminate between the two approaches. The actual predictions between measurement methods obtained from using the log-transformed data would have been virtually the same as those we got from using the untransformed data (data not shown).
We have therefore chosen to present the conversion formulae (Tables 3 and 4) for data on the original glucose-concentration scale.
Model
The purpose of the statistical model is
To estimate simple linear conversion formulae between methods and To give prediction limits for them.
The model used is a slight variant of the one described by Carstenen in 2004.
8
We assume a simple linear relationship between methods, and that the relationship is the same at time-points 0, 30, 60 and 120 min. Statistically, this is expressed as a linear relation of each measurement y to an unknown ‘true’ value of the glucose concentration, μ. Formally, the measurement y
mit
with method m on individual i at time t is modelled as:

Where c mi and e mit are error terms. The random individual × method interaction, c mi , and the combined measurement error and sample × method interaction, e mit were assumed independent and normally distributed with means 0 and variances τ m 2 and σ m 2 respectively.
Thus, τ m represents the standard deviation (SD) of the errors that cannot be changed by improved laboratory practice, whereas σ m represents measurement error that is attributable to the technical laboratory procedure. The size of these sources of error is allowed to vary by the method, both for the individual by methods interaction and for the pure measurement error.
The ‘true’ sample values, μ it , are taken as parameters and not assumed to follow any distribution, because subjects chosen for method comparison studies cannot reasonably be assumed to be representative of any population, and least of all populations on which derived prediction rules are to be applied. Seen from a prediction point of view, the μ values must be regarded as nuisance parameters of no interest per se, but any distributional assumption about them would be arbitrary and would likely lead to biased results with respect to predictive power.
Estimation
The model used is an extension of a two-way analysis of variance (two-factor main effects model), where a special feature of the interaction is modelled in the mean value structure as a linear relationship between the methods. Carstensen 8 has devised an algorithm to estimate in a slightly simpler situation than this. This method has been applied to this data-set for the estimation of parameters.
Model validation
The model used requires a number of assumptions to be met:
The relationships between methods are linear; The residuals are homoschedastic, i.e. the size of the variance components does not vary with the level of blood glucose; The residuals are normally distributed.
Assumptions 1 and 2 were checked by plotting residuals against predicted means, and assumption 3 was checked by normal probability plots of the residuals. These results showed that the stated assumptions were met.
Prediction between specimens and methods
Prediction of measurements by one specimen/method from results obtained by another was based on this model. Prediction of a measurement by method 1, y
1, from a measurement by method 2, y
2, under model (1) is:
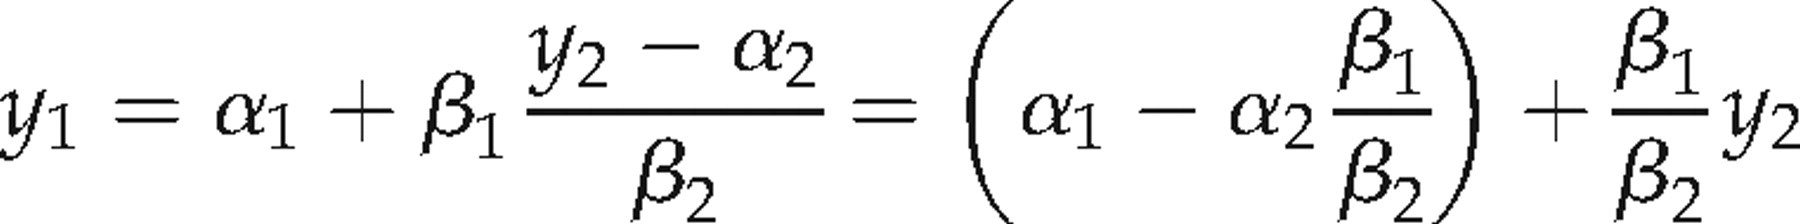
The intercept and slope on the right hand side of this equation is reported in Tables 3 and 4. The prediction SD was computed as:
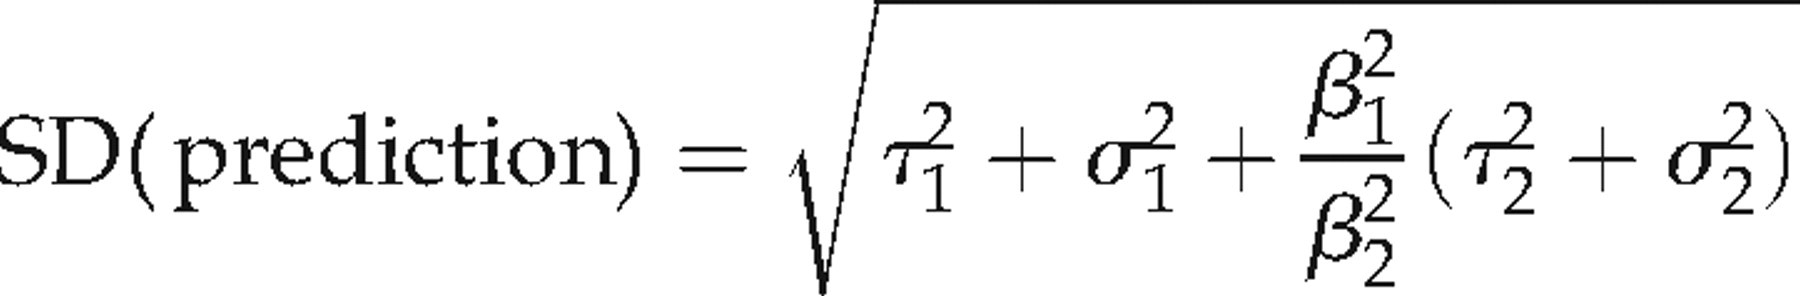
Table of conversion formulae with prediction standard deviations
These are used to construct prediction intervals: 90% intervals using ±1.645 × SD, 95% intervals using ±1.960 × SD. The SDs on the diagonal are 
Table of conversion formulae with prediction standard deviations
Based on the data for the four different specimens, ignoring methods for glucose determination, and excluding all measurements by o.cap. The standard deviations are used to construct prediction intervals: 90% intervals using ±1.645 × SD, 95% intervals using ±1.960 × SD. The SDs on the diagonal are 
Prediction from one combination of specimen and method to itself is, in essence, a prediction of the range where one would expect to see a second measurement on the same specimen by the same method of the same sample, and hence does not involve a new realization of the individual × method interaction, and so has a prediction SD of
Grouping methods by type of specimen
In order to be able to compare methods based on the four specimens venous plasma, whole blood, serum and capillary blood, we estimated a model as (1) where methods were grouped by specimen, i.e. all measurements on venous plasma were considered one method etc. In this analysis with only four methods, the estimated μs from the analysis of the 11 individual methods were fixed and the conversion parameters and error terms estimated for these. However, as the plasma-based methods were represented by 824 measurements, out of which many were replicates on the same samples, we should expect to see a very small individual × method (=specimen) interaction in this analysis, biasing the prediction SDs slightly towards 0.
Results
The estimates of conversion formulae between the 11 specimens/methods are given in Table 4. From the last two rows/columns in the table it is clearly seen that the methods based on capillary blood are by far the most imprecise methods, as the SDs of the predictions are about three times the size of those of the other methods. Further, it is clear from the last row/column that the o.cap method is systematically wrong. Subsequent to the study, it was verified that the analyser used was old and maladjusted. Hence, for the rest of the analyses these measurements have been excluded. From Table 5, it is seen that the residual variation is larger than the individual × method interaction, except for h.blood and h.serum. Comparisons between methods by specimen are given in Table 4, example conversions in Table 6, and a graphical version in Figure 2. Clearly, the methods based on capillary blood have the lowest precision: the prediction intervals are more than twice as wide as those for the other substances. The best agreement is between venous plasma and serum; in the range 3–15 mmol/L, the disagreement is smaller than 0.5 mmol/L with serum values being lower. For venous blood, the readings tend to be around 1.5 mmol/L smaller than those from plasma and serum. For conversions between these three methods, the prediction standard error is about 0.4 mmol/L.
Table of the standard deviations of the variance components (mmol/L) from the analysis of 11 methods and from the analysis of the four specimens
Conversions with 95% prediction intervals from the formulae in Table 4
For example, from a measured value of 7.0 mmol/L in a venous blood sample we would expect that the corresponding measured value in a venous plasma sample would be 8.4 mmol/L and that it with 95% probability would be between 7.5 and 9.3 mmol/L
Graphical display of the prediction algorithms between the four specimens with 95% prediction limits as given in Table 4. The dots represent means over measurements by different methods based on the same substance. The crosses correspond to the diagnostic cut-off points laid down by the WHO consultation criteria
On average there is quite good agreement between capillary blood and serum, with capillary measurements being about 0.5 mmol/L lower. However, the method based on capillary blood is more imprecise, prediction standard errors between the other methods and capillary blood are all close to 1 mmol/L, i.e. any prediction interval will be of the order ±2 mmol/L.
Finally, we applied our conversion factors compared with plasma to reproduce the table given in the report of the WHO consultation for different types of specimens (Table 7). Our data indicate that the cut-off points proposed by the WHO consultation were not in keeping with our results.
Cut-off points (mmol/L) for diabetes and impaired glucose tolerance for venous plasma and for measurements based on other types of specimens, as defined by WHO, and as found in this study
Discussion
The main aim of the present study was to provide conversion formulae between measurements of glucose based on different kinds of specimen. Table 4 provides this result. We have deliberately not addressed the issue of possibly differing conversions for samples drawn fasting, after a 2 h OGTT or just at a random time.
Other studies have investigated relationships for 2 h measurements only. Neely et al. 1 investigated relationships between measurements based on venous plasma, venous whole blood and capillary blood. They found the relationships:
venous plasma = −0.08 + 1.10 × venous blood and venous plasma = −0.06 + 1.10 × venous blood
for pregnant and non-pregnant individuals respectively. The relationship we found was:
venous plasma = 0.56 + 1.12 × venous blood
(i.e. plasma values about 0.6 mmol/L higher throughout the range). Neely et al. found no variation with the haematocrit values, despite considerable differences between pregnant and non-pregnant individuals. Farrer et al. 2 found the relationship
venous plasma= −0.24 + 1.15 × venous blood
also for 2 h postload measurements. However they found the ratio of measurements based on plasma to those based on whole blood to be increasing by haematocrit values.
Burrin and Alberti reported 14–16% higher glucose values in plasma compared with whole blood. 9 This is a consequence of the higher water content for plasma (93%) compared with that of the erythrocyte (73%). Capillary blood is an intermediate mix of blood from arterioles, venules and capillaries. Thus, the difference in glucose concentrations between venous whole blood and capillary blood is small, but can be up to 8% higher in capillary blood after meals or glucose challenge. 9 In addition, high haematocrit can result in additional bias. 10,11
These variations in the relationships are in this study embedded in the estimated variance components, and incorporated in the prediction variation. It should be noted that the prediction variation is independent of the size of the study – the sources of variation (individual × method and residual) are present in any new measurement by a particular method. The statistical uncertainty in the conversion formulae is negligible compared with these, and is therefore not reported here.
The variation between patients with respect to glucose tolerance is controlled for in the model, but the interaction between the glucose tolerance and the measurement method is taken account of in the variance components, and hence reflected in the prediction precision.
Therefore, the prediction variation estimated from this study is presumably larger than those that would be obtained if data were restricted to the 2 h values alone. However, this has not been possible to determine because we then would only have had a single measurement per person and specimen/method, and hence no way to estimate the variance components.
Methodology
Even though the present experiment has not compared all 11 methods to each other directly (only 34 of the 55 possible pairings have actually been tested, cf. Figure 1), the statistical modelling has made it possible to provide conversion formulae for all 55 pairs. While this, from a purely statistical point of view, would be possible with even relatively scanty data, the design of the present study where virtually all samples have been tested by methods n.plas1 and n.plas2 ensures that all other methods have been compared with these two common standards. Thus the conversion formulae between two methods not directly compared, e.g. s.serum and m.plas, are based on at least two common measurements, namely those by n.plas1 and n.plas2.
Other recent studies have mainly compared self-monitoring instruments with a laboratory standard, 12,13 i.e. they have considered a number of methods against a gold standard that could be assumed to be roughly error-free. This study had a different goal: to provide conversion formulae between methods, allowing any of the methods to have imprecisions associated with them. The estimates of precision (variance components) given in Table 5 might be higher than expected, because they are to some extent dependent on the design of the study, notably the methods chosen for comparison. This is particularly the case for the estimates of the individual × method interactions. If, for example, fewer methods based on venous plasma and more methods based on venous whole blood had been included we would most likely have seen an increase in the individual × method interaction SDs for plasma methods and a decrease for methods based on venous whole blood.
Four specimens were collected from each individual during an OGTT. Thus, glucose concentrations at each time-point varied markedly and independently of the baseline value, which made it possible to include each of them as independent values for the calculations. Replicate measurements of the same blood sample were not done, but this would presumably not have added much to the variance components. The variation between the four time-points in each individual is described by the ‘true’ values μ it , and hence the interindividual variation that would be observed between two blood samples taken, e.g. 5 min apart is not included in variations used in constructing prediction intervals.
In the model fitting process, we looked into whether a log-transform of the glucose measurements was appropriate. It turned out that on purely statistical grounds, there is no particular reason to prefer one scale to the other. From a practical point of view in this study, the actual conversion formulae (applicable in the range 3–15 mmol/L) would of course look mathematically different, but yield essentially the same predictions in this range when converting from one method to another. The major difference between the two approaches is the shape of the prediction bands, which will vary with glucose level for the log-transformed model but not for the model using the original scale. However the actual differences in these are also quite small in the region where the bulk of the data are, so we do not have much hard empirical evidence to prefer one method to another.
A large uncertainty was found in the measurements by the methods based on capillary blood; both the residual SD and the individual × method interaction are two to three times higher than for any of the other methods. Thus, capillary blood seems to have limited value as a diagnostic tool. For the other methods, the residual SDs are in the range 0.1–0.3 mmol/L and the individual × method interaction SD in the range 0.07–0.2 mmol/L, giving prediction SDs largely in the range 0.25–0.45 mmol/L, corresponding to 95% prediction intervals for conversions of the size ±0.5 to ± 0.9 mmol/L.
Patient population
The patients selected for this study were all overweight (BMI > 25) and were known to have impaired glucose tolerance. This choice was deliberate, because the aim of the study was to compare the methods of measurement, not to characterize any specific population. The underlying assumption is that the obesity and glucose tolerance of the patients do not per se interfere with the results of the methods, the only effect being through the actual glucose levels. The main interest is in separating the impaired fasting glucose (IFG), impaired glucose tolerance (IGT) and DM, so that the focus is on the conversion between methods in the range 5–12 mmol/L. In this range, we believe that it is quite a reasonable assumption.
Consistency with cut-off points from diagnostic criteria
In the WHO consultation recommendations, cut-off points are given for diagnosing DM, IGT and IFG, using either fasting or 2 h postload blood glucose. 3 These are given for venous plasma, venous whole blood and for capillary whole blood, and thus represents an official belief in what the conversion should be at specific levels of blood glucose between methods based on these three specimens. As noted, there is a tendency that capillary blood glucose does not decay as fast during a 2 h glucose tolerance test as that in venous blood, 14 which in this study is likely to inflate the variance associated with measurements based on capillary blood. However, we found it impractical to provide conversion formulae between specimens that were specific for different clinical situations. This tendency is reflected in the WHO criteria, as can be seen from Figure 2 and Table 7, where these points are given for the methods based on three of the substances mentioned in the WHO recommendations. It is seen that the points for high values of blood glucose are above the line and those for low values below the estimated conversion line.
There is no such tendency for the points linking the plasma and venous whole blood, where the WHO cut-off points are closer to the identity line than the conversion line we estimated, indicating a closer agreement (i.e. smaller bias) than we actually observed in this study. Using the WHO cut-off points would thus mean that it was more likely to diagnose a person as diabetic if diagnosis were made on the basis of plasma measurements than if based on venous blood.
Fishman et al. 12 used a conversion from plasma to venous blood measurements, which was a multiplication by 0.89 (depending somewhat on the haematocrit value). This is in close agreement with our finding (cf. Table 4, second entry in first column). However, we found an intercept of about −0.5 mmol/L, corresponding to the difference between the estimated relation and the relation implied by the various WHO cut-off points. The cut-off points from the recommendations of the WHO consultation thus seem not to be consistent with our findings of conversion factors between methods based on plasma and venous blood respectively. How large the misclassification problem is in practice will depend on the population where a given test is applied. This cannot be inferred from this study where the study subjects were chosen to give maximal power in method comparisons and not to be representative of any particular population.
Nevertheless, it would be prudent to re-evaluate the issue of cut-off points based on specimens other than plasma. Although it has been proposed a long time ago that glucose determination should be done on plasma rather than whole blood, 15,16 other types of specimens are used. This is an important cause of confusion for both health professionals and patients that until now has not received sufficient attention. Despite the practical problems associated with plasma measurements, the simplest standardization would be to define DM and glucose intolerance only in terms of measurements on venous plasma. If, for understandable practical and logistic reasons WHO wants to keep the other options, then the need for revising the conversion factors should be considered.
Footnotes
ACKNOWLEDGEMENTS
The skilful technical assistance in the blood sampling of Pirjo Härkönen, Anja Ilmanen, Kaija Kettunen, Paula Nyholm and Arja Putilais is gratefully acknowledged. We are also indebted to the researchers in the Finnish Diabetes Prevention Study Group: Sirkka Aunola, Zygimantas Cepaitis, Johan Eriksson, Martti Hakumäki, Helena Hämäläinen, Pirjo Ilanne-Parikka, Sirkka Keinänen-Kiukaanniemi, Mauri Laakso, Pirjo Lehto, Anne Louheranta, Marjo Mannelin, Vladislav Moltchanov, Merja Rastas, Virpi Salminen, Matti Uusitupa and Timo Valle. The Finnish Diabetes Prevention Study is partly supported by grants from the Academy of Finland (40758, 46558), Finnish Diabetes Research Foundation, Novo Nordisk Foundation, Juho Vainio Foundation and Yrjö Johansson Foundation.