
Abstract
Background
Neurons in superficial (SDH) and deep (DDH) laminae of the spinal cord dorsal horn receive sensory information from skin, muscle, joints and viscera. In both regions, glycine-(GlyR) and GABAA-receptors (GABAARs) contribute to fast synaptic inhibition. For rat, several types of GABAAR coexist in the two regions and each receptor type provides different contributions to inhibitory tone. Recent work in mouse has discovered an additional type of GlyR, (containing alpha 3 subunits) in the SDH. The contribution of differing forms of the GlyR to sensory processing in SDH and DDH is not understood.
Methods and Results
Here we compare fast inhibitory synaptic transmission in mouse (P17-37) SDH and DDH using patch-clamp electrophysiology in transverse spinal cord slices (L3-L5 segments, 23°C). GlyR-mediated mIPSCs were detected in 74% (25/34) and 94% (25/27) of SDH and DDH neurons, respectively. In contrast, GABAAR-mediated mIPSCs were detected in virtually all neurons in both regions (93%, 14/15 and 100%, 18/18). Several Gly- and GABAAR properties also differed in SDH vs. DDH. GlyR-mediated mIPSC amplitude was smaller (37.1 ± 3.9 vs. 64.7 ± 5.0 pA; n = 25 each), decay time was slower (8.5 ± 0.8 vs. 5.5 ± 0.3 ms), and frequency was lower (0.15 ± 0.03 vs. 0.72 ± 0.13 Hz) in SDH vs. DDH neurons. In contrast, GABAAR-mediated mIPSCs had similar amplitudes (25.6 ± 2.4, n = 14 vs. 25. ± 2.0 pA, n = 18) and frequencies (0.21 ± 0.08 vs. 0.18 ± 0.04 Hz) in both regions; however, decay times were slower (23.0 ± 3.2 vs. 18.9 ± 1.8 ms) in SDH neurons. Mean single channel conductance underlying mIPSCs was identical for GlyRs (54.3 ± 1.6 pS, n = 11 vs. 55.7 ± 1.8, n = 8) and GABAARs (22.7 ± 1.7 pS, n = 10 vs. 22.4 ± 2.0 pS, n = 11) in both regions. We also tested whether the synthetic endocanabinoid, methandamide (methAEA), had direct effects on Gly- and GABAARs in each spinal cord region. MethAEA (5 μM) reduced GlyR-mediated mIPSC frequency in SDH and DDH, but did not affect other properties. Similar results were observed for GABAAR mediated mIPSCs, however, rise time was slowed by methAEA in SDH neurons.
Conclusion
Together these data show that Gly- and GABAARs with clearly differing physiological properties and cannabinoid-sensitivity contribute to fast synaptic inhibition in mouse SDH and DDH.
Background
The superficial and deep laminae of the spinal cord dorsal horn, termed SDH and DDH respectively, are important sites for processing sensory information arising in skin, muscle, joints and viscera [1, 2]. This information arrives in the dorsal horn via primary afferents, which have specific termination patterns in SDH (laminae I-II) and DDH (laminae IV-VI) depending on their axon diameter, sensory modality and peripheral origin [3–5]. The SDH receives inputs predominately from small diameter Aδ and C-fibres carrying nociceptive, thermal, itch, and innocuous tactile information [6–11]. In contrast, the DDH receives inputs predominately from larger Aβ myelinated fibres carrying tactile information [3, 12, 13].
As with primary afferent inputs, the outputs of the SDH and DDH, which are conveyed by projection neurons, also differ. Projections from the SDH terminate mostly in brainstem and midbrain centres such as the parabrachial nuclei and periaqueductal grey [14, 15]. In contrast, projections from the DDH terminate mainly in the thalamus [16, 17]. Recent evidence also suggests intrinsic synaptic connectivity differs in the two regions. For example, paired recordings in SDH neurons show a modular pattern of synaptic linkages connecting a restricted number of neuron types [18, 19]. Similar recordings in the DDH suggest a more extensive synaptic connectivity among neuron classes [20].
These recent data suggest synaptic processing mechanisms differ in the SDH and DDH. Indeed, some aspects of fast inhibitory synaptic transmission, mediated by GABAA and glycine receptors (GlyRs) differ in the SDH and DDH. For example, c-Fos expression differs in the SDH and DDH after blockade of tonic inhibition with specific GABAA and GlyR antagonists [21] and an unusual form of the GlyR, containing alpha 3-subunits, is confined to the SDH of the mouse spinal cord [22]. These data suggest the two receptors play differing roles in setting inhibitory tone and subsequent processing of sensory information in the two regions.
The type-one cannabinoid receptor (CB1R), which has long been known to be involved in analgesia [23, 24], is also expressed at different levels in the SDH versus DDH [25]. The CB1R appears to be more highly expressed in the SDH, consistent with the analgesic action of cannabinoids. Several mechanisms have been proposed for the analgesic action of cannabinoids including modulation of glutamatergic [26, 27], noradrenergic [28] and opioidergic systems [29, 30]. In addition to these CB1R mediated effects, several reports have suggested cannabinoids also act directly on GlyRs [31, 32]. One study reported attenuation of glycinergic currents by cannabinoids in isolated hippocampal and Purkinje neurons [32], whereas another has reported cannabinoids potentiate glycine-activated currents in isolated ventral tegmental area neurons and in recombinant GyRs [31]. No studies have investigated the effects of cannabinoids on “native”, synaptically located GlyRs on SDH or DDH neurons.
In this paper, we first characterize synaptically-mediated miniature inhibitory postsynaptic currents (mIPSCs) in both the SDH and DDH of the mouse spinal cord using patch clamp techniques. We then test whether the synthetic endocannabinoid, methanadamide (methAEA), has direct effects on synaptically located Gly- and GABAARs in the SDH and DDH. Finally, we use real-time PCR (qPCR) to quantify and compare subunit expression of Gly- and GABAARs, and the CB1R in the SDH and DDH.
Methods
Tissue preparation
All experimental procedures were approved by the University of Newcastle Animal Care and Ethics Committee. Mice (C57/Bl6; both sexes, aged 17–17 days) were anaesthetized with Ketamine (100 mg kg−1 i.p.) and decapitated. The vertebral column (~T5 - S1) was isolated and immersed in ice-cold oxygenated sucrose substituted artificial cerebro-spinal fluid (S-ACSF). This solution contained (in mM): 250 sucrose, 25 NaHCO3, 10 glucose, 2.5 KCl, 1 NaH2PO4, 1 MgCl2 and 2.5 CaCl2 and was bubbled with Carbogen (95% O2 and 5% CO2). The lumbar spinal cord (L1 - L6) was removed, placed against a Styrofoam support block, and glued (rostral side down) to a cutting platform with cyanoacrylate glue (Loctite 454, Loctite, Caringbah, Australia). The cutting platform was then transferred to a cutting chamber, filled with ice-cold S-ACSF, and transverse slices (300 μm-thick) were obtained from the L3-L5 segments using a vibratome (Leica Microsystems, Wetzlar, Germany). Slices were transferred to a storage chamber containing Carbogen-bubbled artificial cerebro-spinal fluid (ACSF; 118 mM NaCl substituted for sucrose in S-ACSF) and allowed to equilibrate for 1 h before electrophysiological recording.
Electrophysiology
Individual slices were transferred to a recording chamber (bath volume 0.4 ml) and continually perfused (exchange rate 4–4 bath volumes/min) with bubbled ACSF. Neurons were visualized in spinal cord slices using infrared differential interference contrast optics (IR-DIC) and a Hamamatsu charge coupled device camera (Model C-2400-79H, Hamamatsu City, Japan) linked to a video monitor. Under IR-DIC lamina II appears as a translucent band that clearly delineates the lamina II-III border in mice older than six days (P6) [33]. All SDH recordings were made between this border and the dorsal white matter. We defined the DDH as the grey matter dorsal to the central canal, and more than 100 μm ventral to lamina II. All our DDH recordings were made within these boundaries. Patch pipettes (3-4 MΩ resistance), made from borosilicate glass (1.5 mm O.D; PG150T-15; Harvard Apparatus, UK) were filled with an internal solution containing (in mM): 130 CsCl, 10 HEPES, 10 EGTA, 1 MgCl2, 2 ATP and 0.3 GTP (pH adjusted to 7.35 with 1 M CsOH). Under these recording conditions the reversal potential for chloride ions is 0 mV: thus, at a holding potential of −70 mV all chloride-mediated inhibitory currents are inward. Whole-cell voltage-clamp recordings were made at room temperature (22 - 24°C) from SDH and DDH neurons. After obtaining the whole-cell recording configuration, series resistance and neuronal input resistance were assessed according to the response to a 5 mV hyperpolarizing step (average of 20 repetitions, holding potential −70 mV). These values were monitored at the beginning and end of each recording session, and data were rejected if values changed by > 20%. Series resistance (< 20 MΩ) was uncompensated in all experiments. All synaptic currents were recorded at a holding potential of −70 mV using an Axopatch 200B amplifier (Molecular Devices, Sunnyvale, CA, USA). Signals were filtered at 2 kHz and digitized online at 10 kHz via an Instrutech ITC-16i A/D board (Instrutech, Long Island, NY, USA). Data were stored on a Macintosh G4 computer and analysed offline using Axograph v4.6 software (Molecular Devices, Sunnyvale, CA, USA).
Experimental protocols
mIPSCs, which are considered to be the postsynaptic response to the spontaneous release of single vesicles of neurotransmitter [34], were recorded as follows. GlyR-mediated mIPSCs were pharmacologically isolated by bath application of the AMPA-kainate receptor antagonist 6-cyano-7-nitroquinoxaline-2,3-dione (CNQX; 10 μM), the GABAA receptor antagonist bicuculline (10 μM), and the sodium channel blocker tetrodotoxin (TTX; 1 μM). Data collection commenced 3 minutes after drugs were washed into the recording bath (wash-on) and continued for at least another 3 minutes. These mIPSCs were completely abolished by subsequent bath application of the GlyR antagonist strychnine (1 μM; n = 10). GABAAR-mediated mIPSCs were pharmacologically isolated in CNQX (10 μM), strychnine (1 μM), and TTX (1 μM), and were abolished by bath application of bicuculline (10 μM; n = 10). The effect of the synthetic endocannabinoid, methAEA (5 μM), on GlyR- and GABAAR -mediated mIPSCs was tested in a subset of neurons where mIPSC frequency was relatively high (> 1 Hz). MethAEA was allowed to wash-on for at least 10 minutes before mIPSCs were recorded for analysis. Each recorded neuron's location was carefully noted and mapped as described previously at the completion of each recording session [35]. The templates for L3, L4, and L5 spinal cord segments (Figure 1) were adapted from Franklin and Paxinos' Mouse Brain Atlas [36].
Analysis of mIPSC properties
Pharmacologically isolated GlyR- and GABAAR -mediated mIPSCs were detected and captured using a sliding template method (semi-automated procedure within Axograph software package [37]). Captured mIPSCs were inspected individually and accepted for analysis when: (1) the captured trace did not contain overlapping mIPSCs; (2) the baseline before the rise, or after the decay phase of the mIPSC trace was stable for > 5 ms; and (3) no time-dependent trend was evident in either mIPSC amplitude or instantaneous frequency over the recording period [38]. Analyses were performed on averaged mIPSCs, obtained by aligning the rising phase of all accepted mIPSCs for a given neuron. Peak amplitude, rise time (calculated over 10-90% of peak amplitude), and decay time constant (calculated over 20-80% of the decay phase) were calculated using semi-automated procedures within Axograph software. In both SDH and DDH neurons, GlyR- and GABAAR-mediated mIPSCs were best fit by a single decay time constant [39].
Analysis of single channel conductance
The single-channel conductance underlying mIPSCs was determined by peak scaled nonstationary noise analysis [40] using the Mini Analysis Program (v6; Synaptosoft, Fort Lee, NJ, USA). This procedure calculates a weighted mean of the underlying multiple conductance states for synaptically located receptors, that is, those generating the recorded mIPSCs versus receptors located outside the synaptic cleft. Briefly, for each neuron, mIPSCs were aligned at the midpoint of their rising phase and averaged. This averaged mIPSC was then scaled to the peak amplitude of all captured mIPSCs that contributed to the averaged mIPSC. The peak scaled average current was then subtracted from individual (scaled) mIPSCs to obtain a difference current, which represents random receptor fluctuations around the mean. Difference currents were binned over the decay phase of the mIPSC. The variance was then plotted against the mean current. A parabolic function (variance = I [current] - [current2]/NP + baseline noise) was then fit to the variance/mean plot, where I is single-channel current, N is the average number of channels open at mIPSC peak, and P is open probability [40].

RNA extraction and relative real-time PCR
A separate set of experiments were undertaken to quantify Gly-, GABAAR and CB1R subunit mRNA. Spinal cord slices were prepared as described above and each slice was microdissected into 2 regions containing the SDH and DDH. This procedure yielded two pieces of tissue per slice. The SDH and DDH regions for all slices (six slices, L3 - L5) were pooled by region, and prepared for relative real-time PCR (qPCR). Total RNA was extracted from the tissue using TRIzol reagent (Invitrogen, USA) [41]. Tissue was added to TRIzol reagent and total RNA was prepared according to the manufacturer's instructions. RNA integrity was assessed by A260/A280 ratios (> 1.8), or visualisation of 18s and 28s ribosomal bands by electrophoresis with formaldehyde denaturing 1% agarose gel. Total RNA was treated with DNAse1 (Invitrogen, USA) and reverse transcribed with SuperscriptII reverse transcriptase (Invitrogen, USA) as per manufacturer's instructions. Real-time PCR using SYBR Green PCR Mastermix (PE Applied Biosystems, UK) and an ABI prism 7500 sequence detection system (PE Applied Biosystems, UK) was performed to assess the expression of the GlyR subunit genes (α1-4 and β), GABAAR subunit genes (α1-α3,α5, β2-3,γ2) and CB1R levels. Primers (Additional File 1) were designed for each gene using Primer Premier 5.0 (Premier Biosoft International, USA). Reactions consisting of 2 × SYBR Green PCR Mastermix, 40 nM of each primer, cDNA template, and nuclease-free water were run in triplicate for each gene on the ABI 7500 sequence detection system under the following conditions: 50°C for 2 min, 95°C for 10 min, 45 cycles of 95°C for 15 s and 60°C for 90 s. Dissociation curves consisting of 95°C for 15 s and 60°C for 15 s, followed by a 2% ramp to 95°C were used to ensure a single product of the correct molecular size was present in each reaction. An average cycle threshold value (Ct) was calculated from triplicate results for each gene. Threshold values were normalized to the housekeeping gene β-actin to provide ACt values. Relative expression levels for each gene were then calculated using the formula 2−ΔCt. Finally, we calculated a ratio for all GlyR- and GABAAR- subunits in a given sample (eg, GlyR α1:α2) and then compared the average ratios between the SDH and DDH.
Statistical analysis
SPSS v13 software package (SPSS Inc. IL, USA) was used for all statistical analyses. Student's unpaired t-tests were used to compare mIPSC properties recorded in the SDH and DDH, and to compare mIPSC properties before and after exposure to methAEA. One-way ANOVA's compared gene expression data for all GlyR- and GABAAR subunits in the SDH and DDH. Student's unpaired t-tests compared gene expression for each subunit (GlyR, GABAAR and CB1) in the SDH versus DDH. When data were not normally distributed non-parametric statistics (Mann-Whitney two sample tests) were applied. All values are presented as means ± SEM. Statistical significance was set at p < 0.05.
Drugs
TTX was obtained from Alomone Laboratories (Jerusalem, Israel), and methAEA from Tocris Bioscience (Bristol, UK). All other drugs were purchased from Sigma Chemicals (St Louis, MO, USA).
Results
Whole-cell patch clamp recordings were obtained from 92 neurons in 18 animals in either the SDH (n = 45) or the DDH (n = 47) as illustrated in Figure 1. Mean animal age (21.4 ± 0.3 vs. 21.9 ± 0.3 days) and series resistance (11.6 ± 0.7 vs. 11.6 ± 0.6 MΩ) were similar for SDH and DDH recordings, suggesting neither age nor recording conditions influenced our results. In contrast, input resistance was higher in SDH neurons (640 ± 65 vs. 260 ± 30 MΩ). This is consistent with morphology data, which shows SDH neurons are smaller than those in the DDH [42, 43]. GlyR-mediated mIPSCs were detected in 74% (25/34) of SDH neurons and in almost all DDH neurons (93%; 25/27). In contrast, GABAAR-mediated mIPSCs were detected in virtually all neurons in our dorsal horn recordings: 93% (14/15) and 100% (18/18) for SDH and DDH neurons, respectively. Thus, inhibitory synaptic transmission at GlyR-containing synapses is more prominent in the DDH, whereas GABAAR containing synapses are distributed similarly in both regions of the mouse spinal cord dorsal horn.
Glycine receptor-mediated synaptic transmission
Figure 2 and Table 1 compare the properties of GlyR-mediated mIPSCs recorded in SDH and DDH neurons. Mean mIPSC amplitude in SDH neurons was approximately half that observed in DDH neurons (37.1 ± 3.9 vs. 64.7 ± 5.0 pA, n = 25 and n = 25 respectively; Figure 2A&2C). mIPSC kinetics also differed between the two regions. The decay time constant for mIPSCs was slower in SDH versus DDH neurons (8.5 ± 0.8 vs. 5.5 ± 0.3 ms), however, mIPSC rise times were identical in the two regions (0.85 ± 0.07 vs. 0.85 ± 0.04 ms). mIPSC frequency was lower in the SDH compared to the DDH (0.15 ± 0.03 vs. 0.72 ± 0.13 Hz). Interestingly, the combined effect of smaller slow decaying mIPSCs in the SDH and larger fast decaying mIPSCs in the DDH resulted in a similar charge transfer per mIPSC in the two regions (364.5 ± 57.7 vs. 456.6 ± 39.9 pA.ms). However, when glycinergic charge is multiplied by mIPSC frequency, to provide an overall measure of glycinergic drive, the result is a more than seven fold greater drive in DDH versus SDH (68.0 ± 26.8 vs. 400.0 ± 107.9 pA.ms.Hz). Of course under in vivo conditions neurotransmitter release is driven largely by action potential invasion of presynaptic terminals. Thus, in vivo differences in background discharge (not assessed in this study) will contribute to overall levels of glycinergic drive in the two regions.
The marked differences in GlyR-mediated mIPSC amplitude in SDH and DDH neurons could be attributable to specific properties of the GlyR, such as differences in single-channel conductance, number of receptors open during quantal release (No), or channel open probability (Po). To distinguish between these possibilities, peak-scaled nonstationary noise analysis was undertaken on a subset of mIPSC recordings from SDH and DDH neurons (Table 1). This analysis showed both unitary conductance (54.3 ± 1.6 vs. 55.7 ± 1.8 pS, n = 8 and n = 11, respectively) and Po (0.97 ± 0.01 vs. 0.99 ± 0.01), were identical for GlyRs in the SDH and DDH, however, only half the number of channels (10.3 ± 0.5 vs. 19.0 ± 5.3) contributed to mean quantal current in the SDH versus DDH.
GABAA receptor-mediated synaptic transmission
Many of the properties of GABAAR-mediated mIPSCs were similar in SDH and DDH neurons (Table 1, Figure 3). Specifically, mIPSC amplitude (25.6 ± 2.4 vs. 25.3 ± 2.0 pA, n = 14 and n = 18, respectively) and frequency (0.21 ± 0.08 vs 0.18 ± 0.04 Hz) were similar in both regions (Figure 3A&3C). The rise time and decay time constant of GABAAR-mediated mIPSCs, however, was significantly slower in the SDH (1.97 ± 0.18 vs. 1.49 ± 0.10 ms, and 23.0 ± 3.2 vs. 18.9 ± 1.6 ms). Interestingly, the slower decay times of GABAA-mediated mIPSCs in the SDH resulted in a significantly greater charge transfer per mIPSC in SDH versus DDH neurons (717.3 ± 75.5 vs. 486.3 ± 52.4 pA.ms). GABAAR-mediated drive, as estimated by measuring mIPSC charge transfer by event frequency, however, was similar in both regions (152.4 ± 61.9 vs. 92.8 ± 21.1 pA.ms.Hz).
Peak-scaled nonstationary noise analysis was also applied to GABAAR-mediated mIPSCs to examine the properties of synaptically located receptors. This analysis showed that GABAARs underlying the mIPSCs had an identical unitary conductance in the SDH and DDH (22.7 ± 1.7 vs. 22.4 ± 2.0 pS, n = 8 and n = 11, respectively). Po was lower in SDH neurons (0.76 ± 0.04 vs. 0.94 ± 0.02) and No was greater in SDH neurons (18.5 ± 1.6 vs. 12.9 ± 1.0). These data suggest more GABAA channels underlie quantal transmission in the SDH but open probability is lower.
Cannabinoid effects on GlyR-mediated synaptic transmission
Two studies have suggested that cannabinoids have direct (allosteric) effects on recombinant or cultured GlyRs [31, 44]. To test for direct cannabinoid effects on native GlyRs in the SDH or DDH we compared the properties of GlyR-mediated mIPSCs, recorded in both regions, before and after bath application of the synthetic endocannabinoid, methAEA (5 μM). Figure 4A shows the effect of methAEA on glycinergic mIPSCs in the SDH. MethAEA significantly reduced mIPSC frequency (0.18 ± 0.03 vs. 0.08 ± 0.02 Hz, n = 7). In contrast, methAEA had no effect on mIPSC amplitude (35.9 ± 5.7 vs. 31.7 ± 3.4 pA), rise time (0.81 ± 0.16 vs. 0.96 ± 0.08 ms), or decay time constant (7.86 ± 1.10 vs. 7.93 ± 1.03 ms). Figure 4B summarizes the effect of methAEA on GlyR-mediated mIPSCs in the DDH. As in the SDH, methAEA significantly reduced GlyR-mediated mIPSC frequency (0.37 ± 0.09 vs. 0.15 ± 0.03 Hz, n = 8) in DDH neurons. MethAEA, however, did not affect mIPSC amplitude (62.4 ± 6.0 vs. 52.2 ± 6.8 pA), rise time (0.63 ± 0.03 vs. 0.60 ± 0.09 ms), or decay time constant (5.04 ± 0.68 vs. 5.02 ± 0.57 ms). In summary, methAEA reduced mIPSC frequency but had no direct effect on GlyRs located at synapses on either SDH or DDH neurons.
Cannabinoid effects on GABAAR-mediated synaptic transmission
We next tested if methAEA had direct effects on GABAAR-mediated mIPSCs in the SDH or DDH. Figure 5A summarises the effect of methAEA on GABAAergic synaptic transmission in SDH neurons. MethAEA produced a significant reduction in mIPSC frequency (0.27 ± 0.05 vs. 0.18 ± 0.03 Hz, n = 6), without altering mIPSC amplitude (30.1 ± 1.7 vs. 28.1 ± 0.9 pA), or decay time constant (29.51 ± 7.39 vs. 37.52 ± 12.57 ms). The rise time of GABAAergic mIPSCs, however, was slowed by methAEA (1.89 ± 0.52 vs. 2.51 ± 0.69 ms). Figure 5B summarises the effect of meth-AEA on GABAAR-mediated mIPSCs in DDH neurons. Bath application of methAEA significantly reduced mIPSC frequency (0.20 ± 0.04 vs. 0.05 ± 0.02 Hz, n = 7), but did not affect mIPSC amplitude (19.6 ± 1.3 vs. 17.0 ± 1.1 pA), rise time (1.58 ± 0.17 vs. 2.10 ± 0.51 ms), or decay time constant (19.70 ± 3.52 vs. 23.10 ± 4.64 ms). These results suggest the predominant effect of methAEA is to reduce GABAAR-mediated mIPSC frequency, though the slowed rise times suggest a postsynaptic effect of methAEA, possibly involving a direct interaction on GABAARs.

Properties of mIPSCs in mouse SDH and DDH neurons
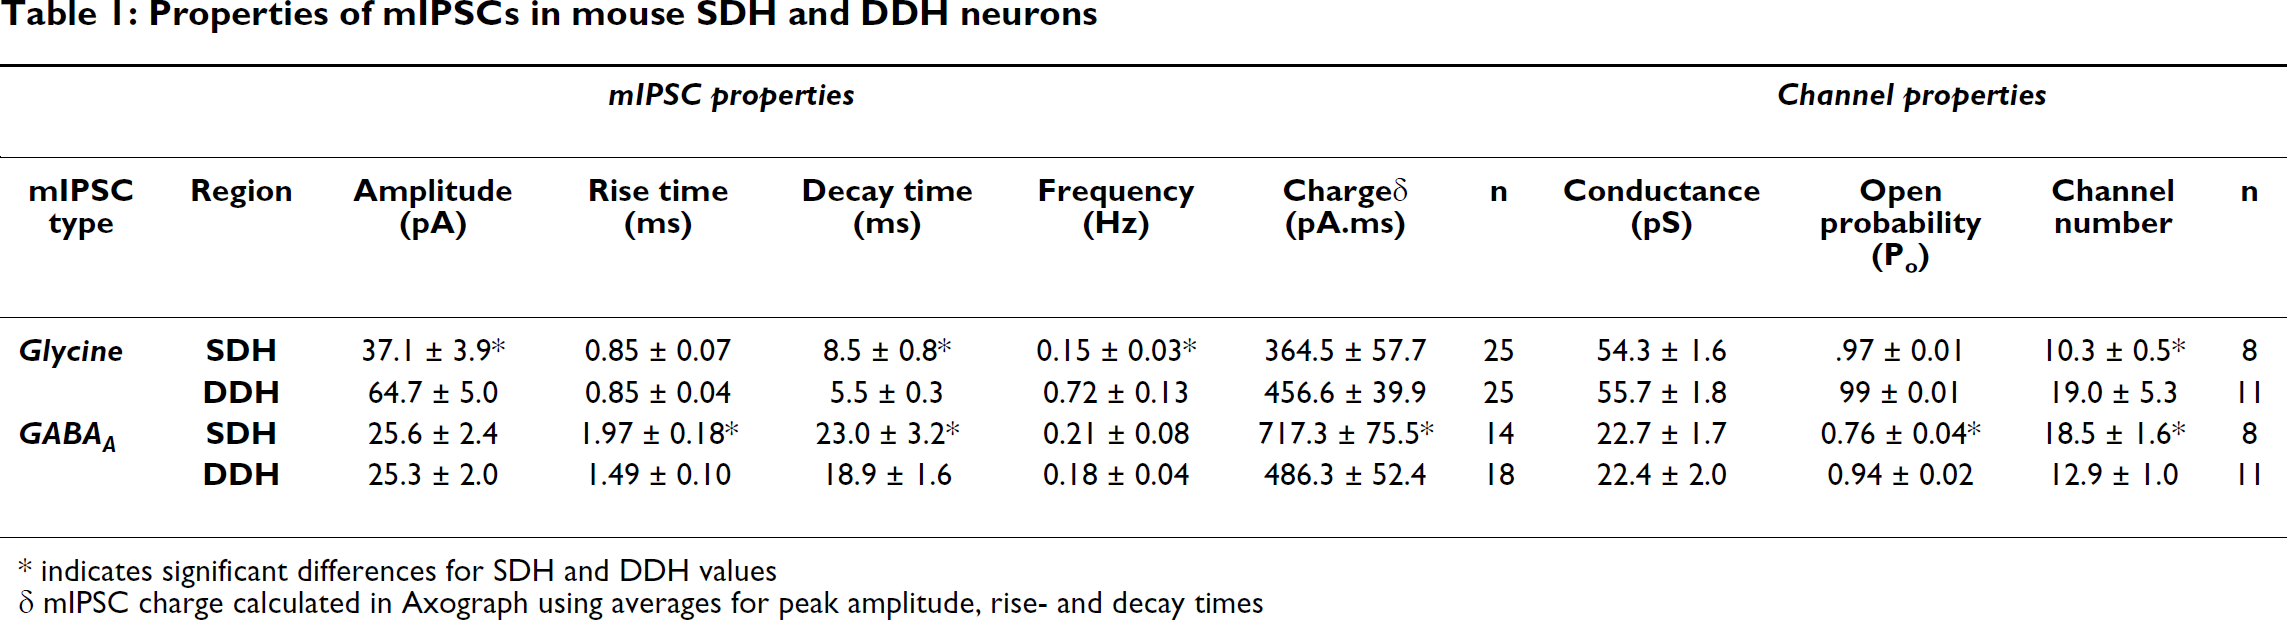
*indicates significant differences for SDH and DDH values
δ mIPSC charge calculated in Axograph using averages for peak amplitude, rise- and decay times
Expression of glycine, GABAA, and CB1 receptor subunits in SDH and DDH
Because GlyR- and GABAAR-mediated mIPSC properties differ markedly in SDH and DDH neurons, we next analysed subunit expression of both receptors in each region using qPCR. Figure 6 summarises qPCR results for Glyand GABAAR subunits in the SDH and DDH. Data are presented as relative expression values. In the SDH (Figure 6A, left) Glyα1 is most highly expressed, followed by Glyβ, Glyα3 and Glyα2, with negligible expression of Glyα4. In the DDH (Figure 6A, right), Glyα1 is again the most highly expressed subunit, followed by Glyβ. Glyα2, Glyα3, and Glyα4 are expressed at much lower levels. Comparison of each GlyR subunit in SDH versus DDH showed Glyα1, Glyα2, Glyα4 and Glyβ were more highly expressed in the DDH (Figure 6A). The results of GABAAR subunit expression in the SDH (Figure 6B, left) showed no significant differences in subunit expression. In the DDH (Figure 6B, right), qPCR analysis also failed to resolve any differences in GABAAR subunit expression. Comparison of each GABAAR subunit in SDH versus DDH shows that only expression levels of GABAα1 and GABAβ2 differed in the two regions. Again higher expression levels were detected in the DDH. Finally, comparison of CB1R relative expression using qPCR in the SDH and DDH detected significantly higher relative expression in the DDH (0.007 ± 0.001 vs. 0.025 ± 0.006, respectively).
Because both GlyR and GABAARs are heteropentamers at native synapses we further analyzed all possible subunit combinations for both receptor types in the SDH and DDH. Comparisons for GlyR subunit combinations are presented in Table 2. This analysis showed possible subunit combinations are differentially weighted in the two regions. For example, the Glyα1:GlyRα2 ratio is higher in the SDH, whereas the Glyα1:GlyRα3 ratio is higher in the DDH. This finding suggests an increased likelihood of Glyα1:GlyRα2 combinations in the DDH and that Glyα1:GlyRα3 combinations would be more prevalent in the SDH. A similar analysis was conducted for GABAAR subunits and none of the possible comparisons were significantly different (data not shown).
Discussion
We found the properties of GlyR- and GABAA-mediated mIPSCs to be clearly different in SDH and DDH, suggesting the contribution of each receptor type to fast synaptic inhibition differs between the two regions. An additional aim of our experiments was to examine the action of an endocannabinoid on the two ligand-gated ion channels that are important for inhibitory signalling in the dorsal horn of the spinal cord. Our experiments were driven by three considerations: both Gly- and GABAARs have been implicated in the onset and maintenance of various pain states; the existence of a unique type of GlyR, containing α3 subunits in the SDH of the mouse spinal cord; and reports of a direct (allosteric) action of cannabinoids on GlyRs in oocytes and dissociated neurons. We found no evidence for a ‘direct effect’ of methAEA on GlyR function in either the SDH or DDH. The rise time of GABAAR-mediated mIPSCs, however, was slowed by methAEA in SDH neurons, suggesting a direct effect on GABAAR-mediated mIPSCs. Our real-time PCR data showed the balance of Gly- and GABAAR subunit expression differed somewhat in SDH and DDH. For GlyRs, the α1 and β subunits dominate in both SDH and DDH, expression of the α2 GlyR subunit was higher in DDH, whereas α3 subunits where expressed equally in both regions. For GABAARs, α1 and β2 subunit expression was higher in the DDH. In contrast to previous reports, using immunohistochemistry, we found CB1 receptor expression to be higher in the DDH.


Contributions of glycine- and GABAARs in dorsal horn function
To our knowledge this study is the first comparison of Gly- and GABAAR properties in superficial and deep laminae of the mouse spinal cord dorsal horn. Previously, we have used parasagittal slices (vs. transverse in this study) to compare Gly- and GABAAR-mediated mIPSCs in superficial laminae (I-II) of wildtype C57/Bl6 mice and the GlyR mutants spastic and oscillator [39]. As in the present study, a greater proportion of SDH neurons received GABAAR- versus GlyR-mediated inhibition. GABAAR - and GlyR-mediated mIPSC amplitude was also similar to that observed in wildtype mice in our previous work. In parasagittal slices, however, mIPSC frequency was higher and decay time constants were slower for both Gly- and GABAARs. The higher mIPSC frequency is probably due to the rostro-caudal orientation of the dendritic trees of SDH neurons [45] as their parasagittal orientation would result in retention of more synapses in a slice. It is unclear, however, why decay time constants are slower in parasagittal slices.

Our data show that the contribution of GlyRs to fast inhibitory synaptic transmission is greater in the DDH versus SDH, whereas GABAAR-mediated inhibition appears to be equally important in both regions. In rat, Cronin et al. (2004) used c-Fos expression to functionally assess tonic inhibitory drive mediated by GlyRs and GABAARs in dorsal horn and suggested GlyR-mediated mechanisms are more important for setting inhibitory tone in DDH. Our data are consistent with this finding and other data for rats. For example glycine-containing neurons [46, 47] and glycine terminals are more concentrated in deeper dorsal horn laminae [48]. In contrast, GABA containing neurons and terminals populate the entire dorsal horn [46, 49]. Thus, our mouse data are consistent with a clear regional variation of glycinergic and GABAAergic inhibition in the rodent dorsal horn.

Glycine receptor subunit expression ratio's in SDH and DDH

*indicates significant difference in subunit ratios between SDH and DDH
In mouse, Gly- and GABAARs with differing physiological properties contribute to fast synaptic inhibition in the SDH and DDH. Our data can be compared to a recent study in rat [50], even though the definition of “deep” dorsal horn varied from ours (laminae III-IV vs. laminae IV-VI). In the rat study, a greater proportion of neurons in the DDH received GlyR-mediated mIPSCs and receptor properties were similar in each region. We also found almost all neurons received GlyR-mediated mIPSCs in the mouse DDH, however, the properties of GlyRs differed markedly in SDH versus DDH. Specifically, mIPSC frequency and amplitudes were higher, and mIPSC decay times were faster in the DDH. Developmental processes may explain these differences as the rat study used younger animals (P10-15 rats vs. P17-37 mice). The importance of GABAAR- and GlyR- mediated inhibitory processing mechanisms changes in SDH neurons during postnatal development (at least from P0-14), with glycinergic transmission maturing later [51]. Exactly when inhibitory mechanisms are functionally mature in rat is not known. In mice, however, we have shown that GlyR properties do not change in SDH neurons after P17 [39]. Moreover, SDH neurons are certainly electrically mature in the P17-37 mice used in this study [33]. It is unknown whether DDH neurons are mature by P17. Together, this work suggests significantly more GlyRs, with faster kinetics, contribute to GlyR-mediated inhibition in mouse DDH.
GlyRs in mouse SDH and DDH differ in their decay times (8-10 ms vs. 4–4 ms, respectively). The fast decay times of GlyR-mediated mIPSCs in DDH neurons (4-5 ms) match previous reports for both mice [52] and rats [53, 54] for GlyRs that contain α1 and β subunits. One potential explanation for the slower kinetics of SDH versus DDH GlyRs in mouse is the existence of a distinctly expressed type of GlyR, containing α3 subunits, in lamina II of the mouse SDH [22]. As for other GlyRs, subunit composition (ie, Glyα1 vs. Glyα2) can shape channel kinetics [53, 55]. This, however, does not appear to be the case for α3 containing GlyRs in the mouse SDH as decay times, at least for evoked GlyR-mediated currents, are identical in wildtype and α3 knockout mice [22]. One explanation is that the somato-dendritic distribution of inhibitory synapses may differ for SDH versus DDH neurons. For example, preferential localization of GlyRs on dendrites would decrease the amplitude and slow the decay time of GlyR-mediated mIPSCs [56]. Such dendritic filtering effects would, however, also slow rise times of GlyR-mediated mIPSCs and this was not the case (Table 1). Thus, future experiments are needed to determine why the kinetics of GlyR channels in the SDH and DDH differ.
In contrast to the marked difference in the contribution of GlyRs to inhibition in the SDH and DDH, GABAAR-mediated inhibition appears equally important in both spinal cord regions. These observations are consistent with immunohistochemical data in rat showing that GABA-containing neurons, GABA positive terminals and GABAARs are equally distributed across the dorsal horn. The only major difference we observed in mouse dorsal horn was a slower decay time constant (23 vs. 18 ms) in SDH versus DDH neurons. The faster kinetics of mIPSCs in DDH neurons, are consistent with higher expression of the α1 GABAAR subunit in deeper lamina [57] as incorporation of the α1 subunit decreases channel open time and mIPSC decay time [58, 59]. Thus, in mice, GABAAR-mediated inhibitory transmission appears equally important across the entire dorsal horn, however, GABAARs in the DDH have faster kinetics.
The different decay times we report for both GlyR- and GABAAR-mediated mIPSCs in mouse SDH versus DDH point to varying subunit composition. Our qPCR data for GlyR subunits show that the balance of GlyR-subunit expression differs in SDH and DDH. Not surprisingly, the α1 and β subunits of the GlyR, the ubiquitous adult form of the receptor [60, 61], dominate in both regions. The α2 subunit, however, is expressed at higher levels in the DDH. This can not explain the slower kinetics of SDH mIPSCs, as developmental studies in spinal cord [55] and brainstem neurons [39, 53] show GlyRs containing α2 subunits have slower kinetics. Interestingly, our qPCR data did not show higher α3 expression in the SDH as reported by Harvey et al., (2004) using immunohistochemistry. A scenario where α3 subunit is preferentially directed to synaptic locations in SDH, whereas in DDH the protein remains at extrasynaptic locations would explain these differences. This needs to considered when comparing electrophysiological data, which only assesses synaptic receptors versus qPCR data which assesses subunit expression without considering location. Our qPCR data for GABAAR subunits showed there was significantly greater expression of GABAAR α1 and β2 subunits in the DDH versus the SDH. These data are consistent with reports showing GABAARs containing α1 subunits have faster kinetics [58, 59].
Endocannabinoid actions on fast inhibitory receptors in SDH and DDH
Our data show clearly that the endocannabinoid analogue, methAEA (5 μM), reduces GlyR- and GABAAR-mediated mIPSC frequency in both SDH and DDH neurons. These findings are consistent with the “in vivo” view of endcannabinoid action, whereby they are released postsynaptically and act retrogradely at presynaptic terminals to reduce neurotransmitter release [62–66]. The reduced mIPSC frequency we measured in the presence of methAEA is also consistent with immunohistochemical investigations showing that the CB1R is expressed on the presynaptic terminals of local circuit neurons, descending inputs, as well as peripheral sensory afferents in the spinal cord [25, 62, 67]
The negative action of methAEA on both GlyR- and GABAAR- mediated inhibition appears to be at odds with the well-documented antinociceptive effects of cannabinoids. In vivo administration of GlyR and GABAAR antagonists produces hyperalgesia and tactile allodynia rather than analgesia [68, 69]. These apparently conflicting observations made using in vitro and in vivo preparations emphasise that the
Because two recent reports suggest cannabinoids can
We also tested for direct effects of cannabinoids on GABAAergic mIPSCs. In both SDH and DDH neurons methAEA reduced mIPSC frequency and did not alter mIPSC amplitude. Similar responses have been reported in the cerebellum [74]. In addition, we observed a significant effect of methAEA on GABAAR-mediated mIPSC rise time, however, this was confined to SDH neurons. This is perhaps not surprising, as GABAARs are modulated by a multitude of exogenous and endogenous substances. For example, the benzodiazepines [75], gaseous and intravenous anaesthetics [76], alcohols [77], neurosteroids [78] and zinc [79] can all positively modulate the GABAAR responses to GABA via allosteric actions on the receptor complex. Thus, cannabinoids may prove to be yet another modulatory agent of GABAAR-mediated signaling.
Implications for spinal cord processing of sensory information
Previous work has shown that the SDH and DDH receive different types of peripheral input, project to different supraspinal targets and exhibit considerable variation in their intrinsic connectivity [18, 19, 71]. We propose that clear differences also exist in inhibitory control mechanisms within each region. Glycinergic signalling dominates in the DDH, whereas GABAA signalling is equally important in both regions. Finally, there appears to be need for an inhibitory system with fast and slow kinetics within both superficial and deep regions of the mouse spinal cord. GlyR-mediated inhibition is more important in deep regions of the dorsal horn, which preferentially receive peripheral inputs from axons with high conduction velocities [3, 12]. The existence of large and fast inhibitory inputs in the DDH would be well suited to modulate the effects of such inputs. In contrast, smaller and slower GABAAR-mediated inhibition appears to be equally important in both superficial and deep regions of the spinal cord dorsal horn. These features suggest GABAAR-mediated inhibition is more important for fine-tuning the effects of a functionally wider range of peripheral inputs.
Suppression of inhibitory signalling in the dorsal horn, which occurs in certain chronic pain states, can lead to hypersensitivity and tactile allodynia [68,80–82]. Both SDH and DDH neurons have been implicated in this form of plasticity, reinforcing the notion that both regions of the dorsal horn play key roles in nociception even though the SDH preferentially receives nociceptive input. The segregation of excitation and information processing in the two regions is hypothesised to play a key role in the segregation of noxious and innocuous sensory experience. The importance of both glycinergic and GABAAergic inhibition in this segregation was clearly illustrated in recent calcium imaging experiments in spinal cord slices [83]. In the control condition, dorsal root stimulation resulted in discrete and localized excitation that was restricted to the SDH. When the same preparation was stimulated under conditions where inhibition was blocked, excitation spread from the SDH to DDH and even contralaterally. These findings highlight the importance of inhibitory control of cross talk between the SDH and DDH. Consequently, a greater understanding of the properties of inhibitory mechanisms in the two regions will help identify new strategies for treating nociceptive dysfunction in the spinal cord dorsal horn.
Competing interests
The authors declare that they have no competing interests.
Authors' contributions
WBA and BAG participated equally in the experimental design, performing experiments, analysis and manuscript preparation. NJB and PAT performed and analyzed the qPCR experiments. The work was carried out in the laboratories of AMB and RJC who contributed to experimental design, analysis and manuscript preparation. All authors have read and approved the final version of the manuscript
Additional material
Additional file 1
Click here for file
[http://www.biomedcentral.com/content/supplementary/1744-8069-5-65-S1.DOC]
Footnotes
Acknowledgements
This work was supported by the National Health and Medical Research Council of Australia (Grants 276403, 401244 and 569206), The Hunter Medical Research Institute, and the University of Newcastle, Australia.