
Abstract
The main product of Portland cement hydration is C-S-H. Despite constituting more than half of the volume of hydrated pastes and having an important role in strength development, very little is known about the factors that determine its morphology. To investigate the relationship between the chemical composition, silicate anion structure and morphology of C-S-H, samples were synthesised via silica-lime reactions and by the hydration of C3S under controlled lime concentrations and with/without accelerators. The silicate anion structure of the samples was studied by 29Si magic angle spinning nuclear magnetic resonance spectroscopy and the morphology and chemical composition by TEM and SEM. All samples prepared via silica-lime reactions with bulk Ca/Si up to 1.5 were foil-like. The hydration of C3S at fixed lime concentration yielded foil-like C-S-H for [CaO]<22 mmol L− and fibrillar C-S-H for [CaO]>22 mmol L−1. A relationship between the silicate anion structure and the morphology of C-S-H was found for the samples fabricated with accelerators.
Introduction
C-S-H is the main product of cement hydration. It is known as the glue of cement, since it is the strength developing phase. However, the relationships between its morphology, chemical structure and composition are still a subject of debate. In a CEM-I system, C-S-H has a Ca/Si molar ratio of ≈1.75 and a fibrillar morphology. 1 In water activated OPC (Ordinary Portland cement) -slag blends, C-S-H morphology changes from foils to fibres increasing Ca/Si or decreasing content of slag.2,3 However, in similar alkali activated pastes, the morphology is foil-like regardless of the Ca/Si. 4 The question of whether C-S-H morphology depends only on the chemical composition or on growth kinetics remains open. 4 The simplest way to answer this question is to find synthetic analogues of C-S-H grown under controlled conditions, to determine the parameters that affect the morphology development. However, this has not been carried out in a systematic way. Grudemo first observed that the morphology of C-S-H changes from foils at low Ca/Si ratio to fibres at high Ca/Si. 5 Kalousek and Prebus reported a similar morphological change from foils to fibrils in synthetic C-S-H, 6 but some of their high Ca/Si products were not homogeneous and were possibly a mixture of a fibrous lime-rich phase and a lower Ca/Si phase. Products fabricated via silica-lime reactions with molar ratios in the range 0.8 v Ca/Si v 1.33 were foil-like, while products synthesised by the reaction of CH and silica with 1.5 v Ca/Si v 2 were fibrillar. The maximum Ca/Si ratio of C-S-H synthesised through routes such as the silica-lime reaction and double decomposition appears to be ≈1.5. 7 To obtain C-S-H with higher Ca/Si ratios, the use of C3S is normally involved. Chen et al. reported a method of decalcification and recalcification of hydrated C3S pastes to fabricate C-S-H with a range of Ca/Si ratios from 0.62 to 1.87. 8 Decalcification was carried out by leaching C3S hydrated pastes in ammonium nitrate. The leached samples were later equilibrated in water or recalcified in CH solutions. The study of these samples was focused on revising the solubility data in the CaO/SiO2/H2O system, and the morphology of C-S-H was not studied. However, the decalcification and recalcification method is probably not a suitable method to study the morphology of C-S-H, since leaching by ammonium nitrate is a harsh treatment that could affect the morphology. Nonat and co-workers9,10 developed another C3S-based synthesis technique in which C3S is hydrated at a fixed lime concentration. In this technique, the concentration, which is monitored using the conductivity of the solution, is controlled by the addition of deionized water from a reservoir and the simultaneous removal of an equal volume of the solution so that the overall volume is maintained. Nonat and co-workers9,10 produced C-S-H with Ca/Si ratios from 1.2 to 2 by varying the lime concentration from ≈6.5 to ≈30 mmol L−1. Garrault-Gauffinet and Nonat 11 showed that the growth of C-S-H samples synthesised by this method falls into the category of heterogeneous nucleation when the hydration of C3S is performed at lime concentrations over 8 mmol L−1. This method can also be used to explore the influence of the kinetics of C3S hydration on the morphology of C-S-H by stopping the reaction at the acceleration (fast growth) and deceleration (slow growth) periods for a given lime concentration. As this technique allows the hydration of C3S at lime concentrations from 8 to ≈30 mmol L−1, it offers a good representation of what occurs during the hydration of composite cements that contain supplementary cementitious materials.12,13 Taylor proposed a dreierketten-based model for the linear silicate anion structure of C-S-H, 14 which was supported by trimethylsilylation. 15 The silicate species that appear in C-S-H are Q1 (dimers or end-chain groups), Q2 (middle chain groups), and in few cases, Q3 (branching groups). 29Si magic angle spinning nuclear magnetic resonance (MAS NMR) and Raman spectroscopic studies of synthetic C-S-H with varying Ca/Si ratios have shown that samples with low Ca/Si ratios have, on average, long silicate chains and the silicate structure is dominated by Q2 tetrahedra, while samples with high Ca/Si have, on average, shorter chains and their silicate structures are predominantly formed by Q1 tetrahedra.8,9,16 21 The percentage of Q1 becomes greater than the percentage of Q2 when 1v Ca/Si v1.2. 8 , 16 18
A recent model for C-(A)-S-H(I)7 has shown constraints for Ca/Si and the average silicate chain length in terms of the fraction of vacant tetra-hedral sites. Relationships between morphology and silicate structure in C-S-H are so far unexplored. Two routes involving silica-lime reactions were chosen in this study to produce C-S-H with target Ca/Si ratios from 0.75 to 1.5. The first was a mechanochemical synthesis method by ball milling, which was used by Saito et al. 22 to synthesise afwillite, tobermorite and other calcium silicate hydrates, and later by Garbev et al. 23,24 to syn-thesise C-S-H(I). The second method was a solution route by continuous stirring. The controlled hydration of C3S was chosen to synthesise C-S-H with Ca/Si ratios from 1.3 to 1.65 and to explore the impact of growth kinetics on the morphology development.
Experimental methods
Synthesis
Five different sets of samples were fabricated: two batches via silica-lime reactions and three batches via the controlled hydration of C3S.
Mechanochemical series
Samples targeting molar ratios of Ca/Si=0.75, 0.83, 1, 1.25, 1.33 and 1.5 were fabricated from stoichiometric mixtures of lime and Aerosil 200, a hydrophilic fumed silica with a specific surface area (Brunauer-Emmett-Teller) of 200 m2 g21. The mixtures were made with a water-to-solid ratio (w/s) of 8 (by weight) with freshly boiled and deionized water. The mixtures were milled for 36 h, with on-off cycles of 20-10 min respectively. The slurries were rinsed with ethanol and filtered in a Buchner funnel. They were dried for 3 days over a hot plate at 60°C under an N2 flow of 20 cm3 min—1.
CaO-SiO2 solution series
Using the same raw materials as those from the previous batch, a set of samples was fabricated with Ca/Si=0.75, 0.8, 1, 1.27, 1.35 and 1.42 by continuously stirring at 20°C with w/s=50 for 1 month. The slurries were then filtered and rinsed with a mix of 50%-50% ethanol-water and pure ethanol afterwards. The samples were dried under vacuum for a day.
Controlled hydration of C3S series
A set of samples was synthesised via the controlled hydration of C3S at fixed lime concentrations of 12, 15, 17, 20, 22, 25 and 27 mmol L−1 with Ca/Si from ≈1.3 to ≈1.65. These Ca/Si ratios were calculated using the thermodynamic model of Haas and Nonat.25,26 Pure triclinic C3S from Lafarge, synthesised from SiO2 and calcium carbonate, was ground with an Alpine 100 AFG grinder/50 AP selector to get a mean diameter of 3 mm for the C3S grains. The lime concentration was controlled by the addition of deionized water and the simultaneous removal of an equal volume of the solution, so that the overall volume was maintained; the concentration was calculated from the conductivity of the solution, which is proportional to the calcium hydroxide concentration.9,10,27 Filtered undersaturated lime solutions were used for concentrations up to 20 mmol L−1. Filtered supersaturated solutions obtained by hydrating C3S were used for higher lime concentrations. Hydration was stopped at the acceleration period (towards the inflection point in the hydration curve) and at the deceleration period, obtaining thus two different samples per concentration. The w/s was 50, and the temperature was 25°C. The samples were filtered and dried in the same way as those in the section on ‘CaO-SiO2 solution series’.
Controlled hydration of C3S with ultrasound treatment series
Another set of three samples was synthesised via the controlled hydration of C3S at lime concentrations of 27, 28 and 29 mmol L−1 with Ca/Si from ≈1.45 to ≈1.65 using an ultrasound gun to accelerate the reaction. The ultrasound gun operated at 250 W with on-off pulses of 1 and 3 s respectively. The lime concentration and the w/s were controlled as in the previous series. The w/s was 50, and the temperature was 25°C. The samples were dried in the same way as those in the section on ‘CaO-SiO2 solution series’.
Controlled hydration of C3S with a C-S-H precursor series
A batch of three samples was synthesised by hydrating C3S at lime concentrations of 27, 28 and 29 mmol L−1 with Ca/Si from ≈1.53 to ≈1.62, adding 1 mL of the C-S-H precursor (X-SEED®, BASF Construction Solutions GmbH, Mannheim, Germany) solution previously filtered by dialysis to remove sodium. X-SEED® is a C-S-H precursor that contains C-S-H nanoplatelets synthesised from sodium metasilicate that act as homogeneous nuclei.28,29 The initial w/s was 100, and it was not controlled. The conductivity was controlled by the addition of deionized water. The temperature was 20°C, and the samples were dried in the same way as those in the section on ‘CaO-SiO2 solution series’.
29Si magic angle spinning nuclear magnetic resonance
Single-pulse 29Si MAS NMR spectra were acquired for all the samples on a Varian Direct-Drive VNMRS-600 spectrometer (14.09 T), using a homebuilt cross polarisation/MAS probe for 7 mm outside diameter zirconia rotors. The spectra were obtained at 119.137 MHz, employing a spinning speed of 6.0 kHz, single-pulse excitation with a flip angle of τ
τ
=45° (3.0μs for a radio frequency field strength of γΒ1/2π=42 kHz), and a relaxation delay of 90 s, and were referenced to tetramethylsilane using belite (β-Ca2SiO4, δ=−71.33 ppm) as an external reference. An array of spectra with different relaxation delays was acquired for one of the C3S-C-S-H samples, which revealed that full relaxation was obtained for all components under these conditions. The total number of scans was 1024. The spectra were deconvolved using the least-squares fitting routine of the VnmrJ software. The relative intensities 1(Qn), determined by this approach for different silicates, were used to calculate the mean silicate chain length (MCL) values and the degree of hydration (H) using the following expressions
Transmission electron microscopy and scanning electron microscopy
The morphology and chemical composition of the C-S-H preparations were studied with transmission electron microscopy (TEM) and scanning electron microscopy (SEM). For TEM, the samples were dispersed in ethanol and stirred in an ultrasonic bath for 1.5 min. A drop of the dispersed samples was deposited with a pipette over a 200 Cu mesh with a carbon film (Agar Scientific, UK). Bright field images and chemical analyses were collected using a field emission gun transmission electron microscope (FEI Tecnai TF20 FEGTEM/STEM operating at 200 kV and fitted with an Oxford Instruments INCA 350 EDX system and 80 mm X-Max SDD detector). The images were taken at magnifications of 10 000–19 000 using a spot size of 3. Energy dispersive X-ray (EDX) analyses were collected with a beam diameter of ≈200 nm, magnification of 17 000, spot size of 8 and live time of 50 s. A thickness of 200 nm and a density of 2.8 g cm−3 were used for the quantification of the spectra. For SEM, the samples were dispersed on carbon sticks and coated with a carbon layer of about 15 nm with a 208 Carbon Cressington carbon coater. AFEI XL-30 SFEG HR-SEM, equipped with an Oxford Si(Li) EDX detector, was used for imaging. Ultrahigh resolution mode, with an accelerating voltage of 2.5 kV, a spot size of 3, a working distance of ≈2.5 mm and magnification of 15 000 ×, was used.
Results and discussion
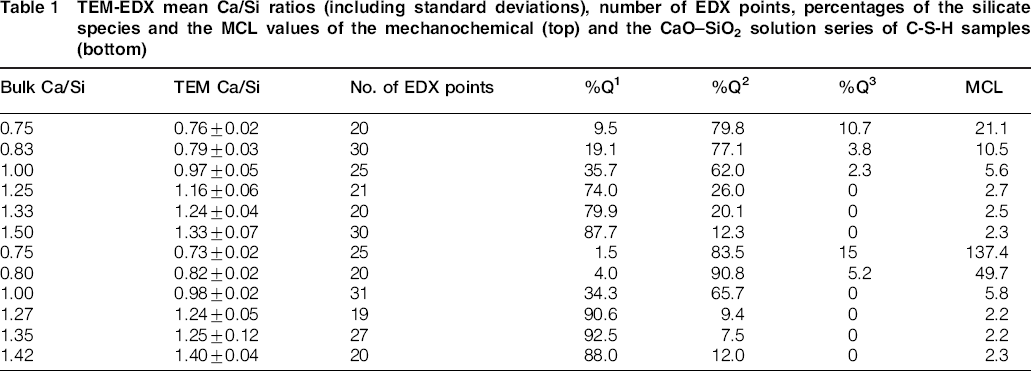
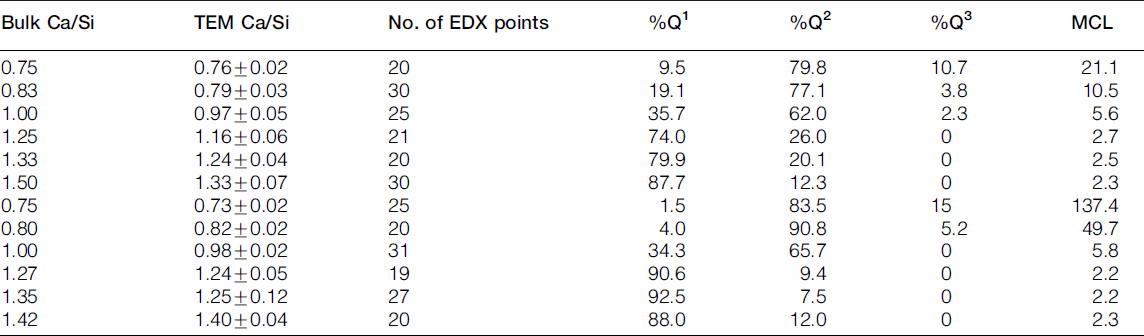
The morphology of the C-S-H preparations synthesised by the mechanochemical and CaO-SiO2 solution methods is foil like, for all of the Ca/Si ratios studied, as illustrated in Fig. 1. However samples of the CaO-SiO2 solution set appear to have thinner and more defined features. The mechanochemical method is a harsh synthesis approach, due to the mechanical milling, and from that point of view, it is expected that the surface of the samples appears rougher than the surface of the samples synthesised by the solution method. The mean molar Ca/Si ratios obtained by TEM-EDX are summarized in Table 1. The measured Ca/Si ratios are close to the bulk target ratios for most samples taking into account the standard deviations. The lower Ca/Si ratio found for the sample with highest bulk Ca/Si in the mechanochemical series reflects the presence of calcium hydroxide, which was identified by X-ray diffraction. The rest of the samples in the series were single-phase C-S-H(I) with respect to crystalline phase content. In the CaO-SiO2 solution series, the deviation between the experimental Ca/Si ratio and the bulk ratio for the sample with bulk Ca/Si = 1.35 is due to traces of the carbonate vaterite, as shown by X-ray diffraction. Traces of carbonates were also found in samples with bulk Ca/Si = 0.8 (aragonite) and 1.27 (vaterite), although the experimental Ca/Si composition was close to the bulk one in those cases. This could be an indication of heterogeneity in the samples. The evolution of the silicate species and the MCL varies as expected8,9,16-21 with the Ca/Si (Fig. 2 and Table 1). Low Ca/Si samples are dominated by middle chain groups (Q2), while high Ca/Si samples are dominated by dimers and end-chain groups (Q1). The 29Si MAS NMR spectra of the samples prepared by the mechanochemical route show broader and less defined peaks than the spectra of the samples from the CaO-SiO2 solution series for Ca/Si<1.25. This indicates structurally more wellordered chemical environments for the silicate species in the C-S-H samples produced by the solution method. The intensity attributed to bridging sites at approximately −82 ppm is also more defined in this case. The 29 Si NMR spectra in Fig. 2 were analysed by numerical deconvolution, considering resonances from Q1, Q2, and Q3 species. Generally, the linewidth, lineshape (Gaussian or Lorentzian) and frequency were considered as variable parameters for the individual peaks in the least-squares optimization to the experimental spectra. In some cases, best fits were obtained by using two overlapping peaks for each of the Q1 and Q2 resonances to account for minor asymmetries in the lineshapes. These asymmetries reflect variations in the local structural environment for the individual Q1 and Q2 sites in the C-S-H structure. For example, the paired chain sites, Q2p, can have identical second-nearest coordination spheres in pentameric silicate units, whereas different Q2p sites are present in octamers and higher polymeric silicate chains. However, it is hard to derive reliable information about these differences from the deconvolution, considering the resolution of resonances in the present spectra. Thus, the principal focus is on the relative fractions of the individual types of sites, used for the calculations of MCL and H values for the C-S-H.
TEM micrographs of C-S-H samples prepared by mechanochemical treatment (upper row images) and of C-S-H samples synthesised from CaO-SiO2 solutions (lower row images). All samples are foil-like, with observed coarser morphology for mechanochemical series. Bulk Ca/Si is indicated in each micrograph
29Si MAS NMR spectra of C-S-H samples produced by mechanochemical route and from CaO-SiO2 solutions illustrating increase in Q1 (−79 ppm) intensity and decrease in Q2 (−85 ppm) intensity with increasing Ca/Si ratio. Resonance from silicate bridging tetrahedra Q2b (−82 ppm) is clearly observed for samples with Ca/Si<1.25
TEM-EDX mean Ca/Si ratios (including standard deviations), number of EDX points, percentages of the silicate species and the MCL values of the mechanochemical (top) and the CaO-SiO2 solution series of C-S-H samples (bottom)
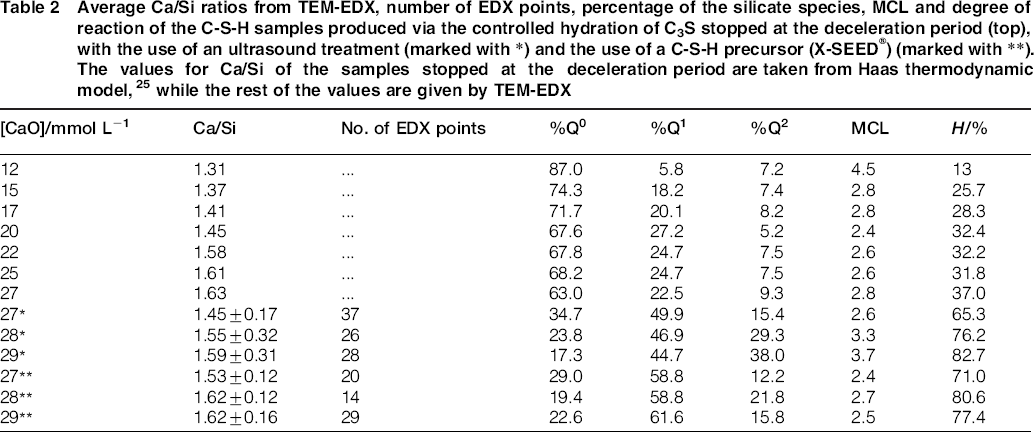
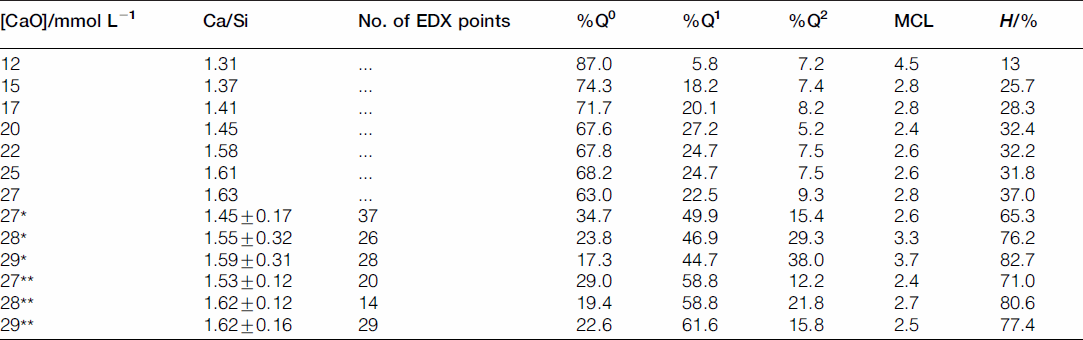
For the samples synthesised by the controlled hydration of C3S at constant lime concentration, the morphology of the C-S-H depends on the lime concentration (Fig. 3). For [CaO]<22 mmol L−1 (Ca/Siv1.58), the morphology is foil-like; for [CaO] = 22 mmol L−1 (Ca/Si<1.58), the morphology appears to be a mixture of foils and fibrils, and for [CaO]=22 mmol L−1 (Ca/Si≈1.58), the morphology is fibrillar, showing a clearly more directional growth. However, for a given lime concentration, the morphology is the same regardless of the reaction being stopped at the acceleration or at the deceleration period. The observed change in morphology with lime concentration is in agreement with studies from other authors who observed that the initial C-S-H product in C3S pastes was foil-like (after a few hours of hydration) but transformed into fibrils as hydration progressed.30,31 The dissolution of C3S during hydration causes the lime concentration in solution to initially increase with time. When the solution becomes supersaturated with respect to C-S-H and calcium hydroxide, they both precipitate. This explains the growth of foil-like C-S-H during the first hours of hydration (low lime concentration in solution) and fibrillar after a day (high lime concentration in solution). Local variations of the lime concentration during the hydration of cement pastes can thus explain the development of different C-S-H morphologies in blends with supplementary cementitious materials. C-S-H often presents different morphologies when growing outside the supplementary particles or from them. 32 Foil-like C-S-H can grow from fully reacted fly ash particles (see Fig. 13 in Ref. 20), which are SiO2 rich, and in turn contain a small percentage of CaO, while fibrillar C-S-H develops in other regions of cement-fly ash blends that may have been subjected to chemical environments richer in calcium (see Figs. 11 and 12 in Ref. 20). The 29Si NMR spectra show that only a small amount of C-S-H was produced during the acceleration period, since most intensities in the spectra originate from unreacted C3S (Q0) (Fig. 4). For the deceleration period, the C-S-H silicate structure showed a higher fraction of Q1 species, as expected for high Ca/Si (>1.2) ratios. The MCL for the samples hydrated until the deceleration period was practically the same (dimeric), except for the sample fabricated at [CaO]=12 mmol L−1, which showed longer average silicate chains (Table 2). Transmission electron microscopy-energy dispersive X-ray analysis of C-S-H free of intermixture with C3S was difficult in these samples and so the mean Ca/Si ratios (Table 2) were calculated using the thermodynamic model of Haas and Nonat.25,26 The Haas and Nonat model predicts the Ca/Si molar ratio of C-S-H for a given lime concentration in solution. It considers equilibrium of the solution with three different C-S-H model structural units (α, β and γ-C-S-H according to Nonat and Lecoq's nomenclature 9 ). The morphology of the samples synthesised with the use of ultrasound treatment with Ca/Si from ≈1.45 to ≈1.65 was foil-like (left of Fig. 5) and similar to the morphology of the samples synthesised by silica-lime reactions in Fig. 1. The samples fabricated with the ultrasound treatment showed a range of compositions (considering average Ca/Si ratios and standard deviations in Table 2) in which both foils and fibrils are expected; however, fibrils were not observed in Fig. 5. This could be a consequence of the use of the ultrasound treatment, which could have distorted the growth of the fibrils expected at the used high lime concentrations due to the high power used. The morphology of the samples synthesised with the C-S-H precursor (X-SEED®) with Ca/Si from ≈1.53 to ≈1.62 was a mixture of foils and fibres (right of Fig. 5), similar to the morphology of the samples synthesised at [CaO]=22 mmol L−1 with Ca/Si≈1.58 in Fig. 3 (this Ca/Si ratio falls into the range of possible compositions that the samples fabricated with the precursor showed, taking into account the standard deviations in Table 2). The surface of the samples fabricated with the ultrasound treatment and the C-S-H precursor at [CaO] = 27 mmol L−1 was also examined by SEM. The secondary electron images show that the sample synthesised using ultrasound vibrations had a flattened and more featureless surface than the sample prepared in the presence of the precursor (bottom of Fig. 5). The 29Si NMR spectra show that the samples fabricated with ultrasound had longer silicate chains than those produced with the precursor, since they included higher percentage of Q2 sites (Fig. 6). Although the temperature was controlled during synthesis, local variations of the temperature were likely to occur in the solution due to the ultrasound, which would explain higher The differences in mean Ca/Si values for these samples matched the differences of their NMR specta, since the ultrasound samples had a lower average Ca/Si ratio than the samples produced with the precursor and they showed a higher percentage of Q sites. For similar degrees of reaction (H in Table 2), the samples prepared with ultrasound treatment showed a higher ‘apparent’ degree of reaction, since they were more polymerized (Fig. 7). The MCL was clearly related to the degree of reaction in both ultrasound and X-SEED® series, since it increased for higher degrees of reaction (Table 2). This is in agreement with other reported studies that showed that the MCL of C-S-H in C3S pastes increased from 2 to 4 with hydration time33,34 (during the first 5 years of hydration), reaching a maximum value of ≈5 after two to three decades of hydration. 35
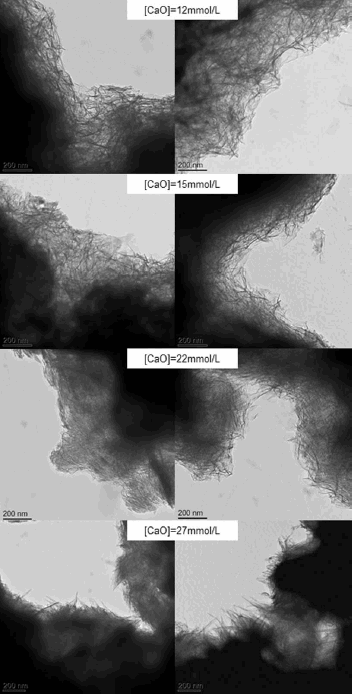
TEM micrographs of C-S-H samples produced by hydration of C3S at controlled lime concentration stopping hydration at acceleration period (left) and at deceleration period (right). Micrographs show foil-like C-S-H for [CaO] = 12 and 17 mmol L−1, mixture of foils and fibres for [CaO] = 22 mmol L−1 and fibrillar C-S-H for [CaO] = 27 mmol L−1
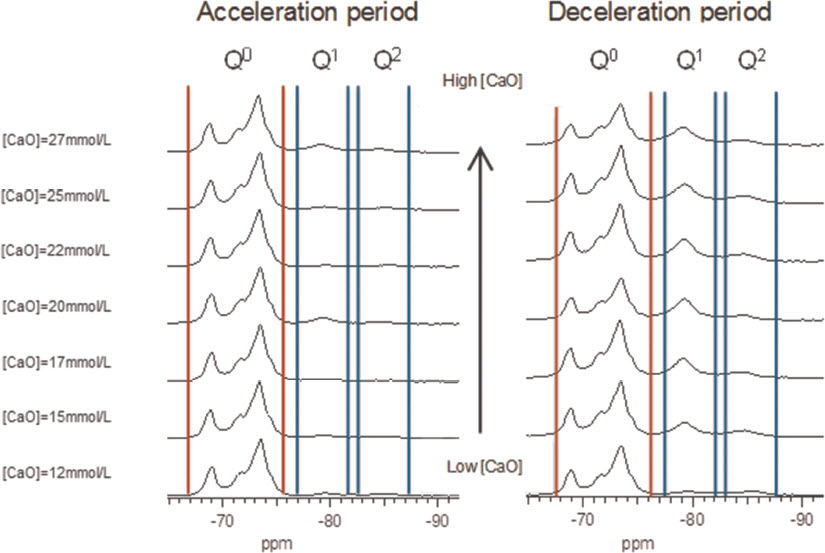
29Si MAS NMR spectra of C-S-H samples prepared by controlled hydration of C3S at lime concentrations from 12 to 27 mmol L−1, stopping hydration at acceleration period (left row) and at deceleration period (right row). The spectra show intensity coming from silicate monomers present in unreacted C3S (Q0 marked between vertical red lines) and C-S-H (Q1and Q2 marked between vertical blue lines)
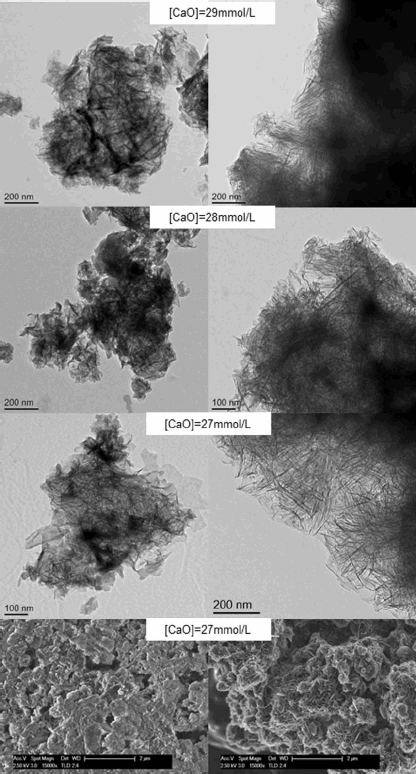
Micrographs (TEM and SEM) of C-S-H samples synthesised by controlled hydration of C3S with ultrasound vibrations (left images) and use of C-S-H precursor (X-SEED®) (right images). Lime concentration is indicated in micrographs. Micrographs (TEM) show thick foil-like particles (ultrasound) and mixture of foils and fibres (X-SEED®). Secondary electron micrographs (SEM) (bottom images) show flattened surface with ultrasound and rosette-like surface with X-SEED®
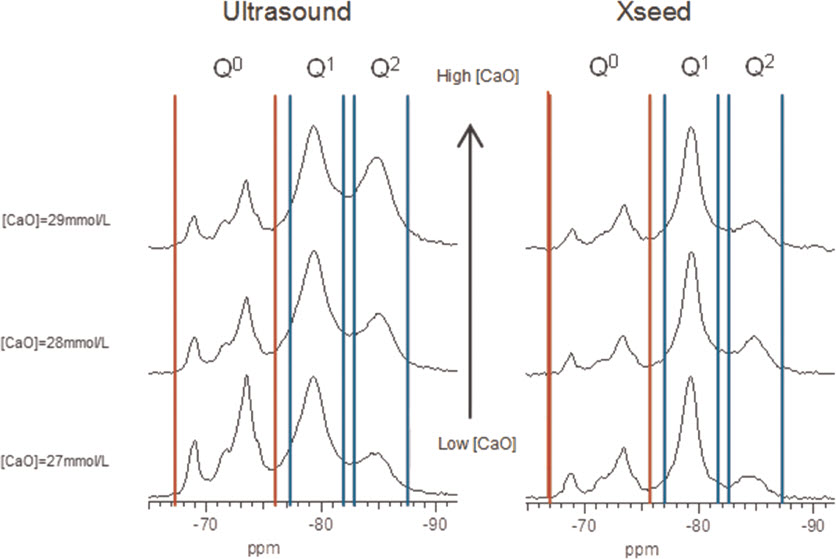
29Si MAS NMR spectra of C-S-H samples produced by controlled hydration of C3S at high lime concentrations of 27, 28 and 29 mmol L−1, with use of ultrasound treatment (left) and C-S-H precursor (right), showing intensity coming from silicate monomers present in unreacted C3S (Q0 marked between vertical red lines) and C-S-H (Q1and Q2 marked between vertical blue lines)
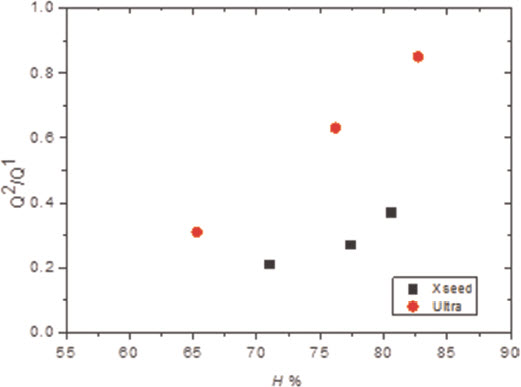
Graph showing ratio of silicate connectivities Q2/Q1 versus degree of reaction for C-S-H samples synthesised by controlled hydration of C3S with use of ultrasound vibrations (Ultra) and C-S-H precursor (X-SEED®)
Average Ca/Si ratios from TEM-EDX, number of EDX points, percentage of the silicate species, MCL and degree of reaction of the C-S-H samples produced via the controlled hydration of C3S stopped at the deceleration period (top), with the use of an ultrasound treatment (marked with *) and the use of a C-S-H precursor (X-SEED®) (marked with **). The values for Ca/Si of the samples stopped at the deceleration period are taken from Haas thermodynamic model, 25 while the rest of the values are given by TEM-EDX
Conclusions
The results indicate that it is the lime concentration in solution that drives morphological changes of the C-S-H phase rather than the kinetics of hydration. Samples synthesised at low lime concentrations in solution are foil like. The samples that fall into this group are those produced by the controlled hydration of C3S with [CaO]<22 mmol L−1 with a maximum Ca/Si ratio of 1.45 and the mechanochemical and the CaO-SiO2 solution series with maximum Ca/Si experimental ratios of 1.33 and 1.4 respectively (the lime concentration in silica-lime reactions should not exceed the saturation value for the precipitation of calcium hydroxide). Samples prepared at [CaO] = 22 mmol L−1 with Ca/Si≈1.58 are a mixture of foils and fibres. Samples prepared at [CaO] = 25 and 27 mmol L−1, with Ca/Si≈1.61 and ≈1.63 respectively, are fibrillar. The observation of increasing Q1 in the samples prepared with the C-S-H precursor with respect to the samples prepared via the ultrasound treatment is connected to a change in morphology from foils to a mixture of foils and fibres. This is associated with increasing edge effects with the appearance of fibres. Therefore, there is a link between silicate anion structure and morphology in C-S-H.
Footnotes
Acknowledgements
Thanks are due to the European Commission for funding from the European Union Seventh Framework Programme (FP7/2007-2013) under grant agreement 264448 and to J. Haas for assistance with the hydration of tricalcium silicate in controlled conditions and for providing a batch of C-S-H samples and the dialysed X-SEEDH®. J. Skibsted acknowledges the Danish Council for Strategic Research for financial support and to the LowE-CEM project and the Carlsberg Foundation for an equipment grant.