
Abstract
We report the observation of a novel structure at the point where two antiphase boundaries cross in a doped bismuth ferrite of composition (Bi0.85Nd0.15)(Fe0.9Ti0.1)O0.3. The structure was investigated using a combination of high angle annular dark field imaging and electron energy loss spectroscopy spectrum imaging in the scanning transmission electron microscope. A three-dimensional model was constructed by combining the position and chemistry data with previous results and assuming octahedral coordination of all Fe and Ti atoms. The resulting structure shows some novel L-shaped arrangements of iron columns, which are coordinated in a similar manner to FeO6 octahedra in maghemite. It is suggested that this may lead to local ferromagnetic orderings similar to those in maghemite.
Introduction
The possibility of creating workable room temperature multiferroic devices has led to extensive interest over the past two decades in bismuth ferrite1,2 since this material exhibits permanent magnetic3,4 and electrostatic 5 orderings. In addition to the practical interest in creating materials for devices, bismuth ferrite is a rich vein of unusual physics in oxides. This has included the discovery of the stabilisation of a super-“tetragonal” phase with a c/a value of ∼1.25 using compressive substrate induced strain in epitaxial growth, 6 as well as the discovery of a complex phase diagram on doping on the A site with rare earth ions.7–10 Additional doping of Ti on the B site can be performed to minimise the conductivity and allow the ferroelectric properties to be fully accessed. 11 Recently, we showed that co-doping with Nd and Ti can also create novel defects and structures in BiFeO3 including Nd and O rich nanorods,12,13 and planar and stepped antiphase boundaries (APBs), based on Ti and Fe rich structural units respectively.14,15 The cores of the APBs are negatively charged and result in a strong polarisation of the surrounding perovskite and stabilisation of a pseudotetragonal polar phase either side of the boundary in an otherwise antipolar matrix. 14 This provides further insights into the possibility to produce field induced crystal structure changes in BiFeO3 based materials and shows that such phenomena are not just caused by epitaxial strain. The structures at the core of these planar and step structural units are both formed from edge sharing BO6 octahedra (where B is Fe or Ti), in contrast to the perovskite structure, where all octahedra are connected at their corners. In the present paper, we report that such structures can become yet more complex where two APBs cross. The structure is analysed by scanning transmission electron microscopy (STEM) using high angle annular dark field (HAADF) imaging combined with electron energy loss spectroscopy spectrum imaging (EELS-SI). A three-dimensional (3D) chemically sensitive model of the APB cross is created by combining quantitative image analysis, prior information from the previously determined boundary structures, crystal chemical arguments and a Monte Carlo energy relaxation. This 3D model is validated by comparison of image simulations of the model with the experimental HAADF image.
Experimental
Ceramics of nominal composition Bi0.85Nd0.15Fe0.9Ti0.1O3 were prepared by a conventional mixed oxide procedure as described previously. 16 Samples were prepared for STEM by a conventional procedure of slicing, polishing, dimpling and ion beam milling. 14 Finally, the samples were coated with a few nanometres of carbon in order to prevent them from charging under the electron beam. STEM experiments were performed at the SuperSTEM facility using a Nion UltraSTEM equipped with a third generation quadrupole-octupole Cs corrector and operated at accelerating voltage of 100 kV. The probe convergence semiangle (α) was 30.5 mrad and HAADF imaging was performed with an inner detector angle of 76.5 mrad, while the effective outer radius was ∼185 mrad. Electron energy loss spectroscopy was performed using a Gatan Enfina Spectrometer, with the same probe angle, and a collection semiangle (β) into the spectrometer of 35.5 mrad.
HAADF image acquisition was performed in a rapid scanning mode using short dwell times of just 10 μs per pixel in order to minimise the drift effect on the individual images, and >20 images were acquired in a sequence. In order to align all the images after acquisition, as well as to remove local scan distortions, the image stack was processed by the SmartAlign software, which combines rigid and non-rigid registration. 17 The resulting undistorted and high signal to noise image was then quantitatively processed using two-dimensional Gaussian peak fitting with a prototype Image Analysis plug-in for Digital Micrograph provided by Dr Bernhard Schaffer (Gatan GmbH, München, Germany). Further analysis of the list of peak positions was performed using techniques similar to those in previous publications13–15 using spreadsheets and Matlab code.
Quantitative processing of the EELS-SI datasets was performed using the following procedure. First, the datasets were processed to remove any single channel “X-ray” spikes caused by stray scattering in the spectrometer or other stray radiation. 18 To reduce noise, a multivariate statistical analysis 19 plug-in was used to perform principal components analysis, 18 and datasets were then reconstructed from only those components containing real signals from the sample while excluding the pure noise components. In order to perform quantitative compositional mapping from core loss edges, a new modelling based elemental quantification routine for digital micrograph was used (courtesy of Dr Paul Thomas, Gatan UK Ltd). The fits were performed from ∼400 to 1050 eV, covering the Ti-L2,3, the O-K, the Fe-L2,3 and the Nd M4,5 edges.
Results and discussion
Figure 1 shows HAADF images of the APB cross with two different fields of view, after distortion correction and alignment. Figure 1a shows a larger field of view at a larger pixel size and reveals the APB cross in context of the surrounding material. The boundary above the APB cross is fairly planar, with just one step above the APB cross. The boundaries to the left and the right are heavily stepped, forming a descending staircase morphology. The boundary below the APB cross shows several steps but then has an overlapped appearance across two or three unit cells of the perovskite. Similar structures have been seen previously in such materials and examined using focal series; this corresponds to a curved boundary within the thickness of the specimen. 20 Although the depth of field of STEM imaging is short, it still spans several nanometres, resulting in the overlap contrast where the curvature of the boundary is sufficient.
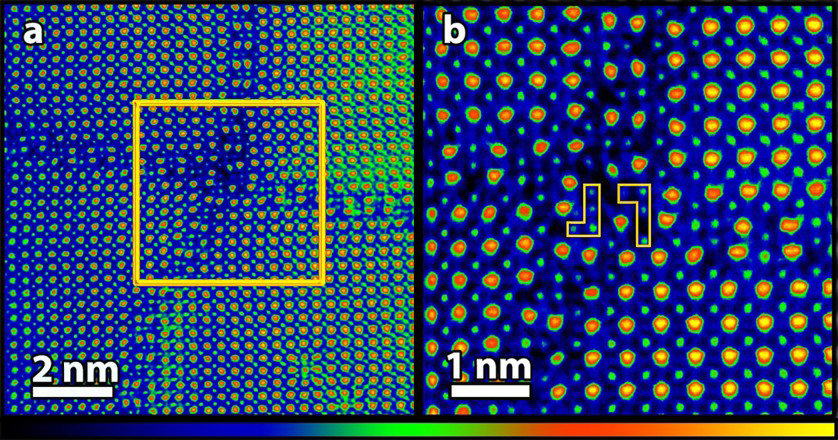
HAADF imaging of APB in BiFeO3. Images are represented on the false colour intensity scale shown below the images; brighter atoms are heavy A site atoms (Bi/Nd), whereas less bright atoms are B site atoms (Fe/Ti), oxygen atoms are not visible in this imaging mode. a field of view of ∼15 nm at pixel size of ∼0.15Å to show context of APB cross within ceramic; b higher magnification view of area of 5 nm at pixel size of 0.1Å showing detailed structure of APB cross. Two ‘L’ shaped structures are indicated
Figure 1b is recorded at higher magnification, giving a smaller field of view but finer pixel sampling showing more detail of the core of this APB cross. When this structure is compared with the images of terraces and steps previously recorded,14,15 most of the structure is still composed of these features. The structure only deviates from such previously studied features around the two ‘L’ shaped arrangements of B site atoms highlighted with yellow outlines. These features do not correspond to any features previously observed on such APBs. There are, however, some clear similarities with the appearance of the B site atoms in the cores of the step structures studied previously. 15
To understand the chemistry of this unusual structure, EELS mapping is shown in Fig. 2. These maps have been corrected for the effects of high frequency scan noise. 21 As observed previously, 14 where terrace structures occur around the edge of the APB cross, Ti is segregated to the APB, especially to the central site. In contrast to this, at every step, the elemental maps show a dearth of Ti and a large concentration of Fe (although not atomically resolved due to the nearness of the columns ∼2Å, as observed previously 15 ). At the core of the APB cross, it is very noticeable that there is a large concentration of Fe at the positions of the two ‘L’ shaped features, indicating that these are mostly composed of iron oxide.
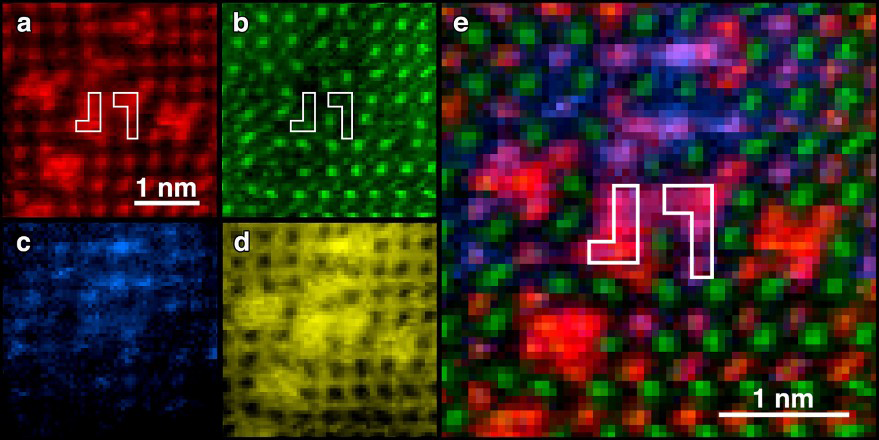
Elemental maps from EELS of intercept of boundaries (defects as APB cross shape). a–e chemical mapping of APBs showing intercept of boundaries: a Fe map; b simultaneously recorded HAADF image, which predominantly shows Bi positions; c Ti map; d O map; e RGB mixed map with red = Fe, green = HAADF (Bi), and blue = Ti. ‘L’ shaped arrangements of Fe atoms are marked in some maps
Unfortunately, it is not possible from just one projection to unambiguously determine the 3D structure of an object, unless additional prior information is available about the atomic ordering in such structures. For this particular structure, there is no second direction along which the structure could be viewed that reveals the atom columns individually without overlaps with some other part of the structure. Thus, in addition to the quantitative position measurements made on the image of Fig. 1b and the chemical identity of each column, inferred from the maps of Fig. 2, the following additional information was used in order to reconstruct the structure: I. The known structure of terraces
14
; II. The known structure of steps
15
; III. We assume that any structures in the APB cross also consist of BO6 octahedra. In line with observations of the structures of terraces and steps, these may be either corner sharing or edge sharing14,15; IV. The structure must always be geometrically compatible with the APBs on either side—i.e. the same shifts of the unit cell must happen in the core structure as in the neighbouring APBs; V. The oxygen positions in the structure are fully occupied, and there is no significant concentration of oxygen vacancies, even if this leads to a structure that is locally negatively charged. Any local negative charge will be compensated by an excess of ionised Ti4+ in the surrounding perovskite matrix. Such effects of local negative charge in APBs have been proven previously for flat APBs, where it was shown by image simulation that all O columns were fully occupied.
14
This will, of course, result in the polarisation of the surrounding perovskite, as was previously observed.14,15
In the terraces of the boundary, a vertical shift of one half of a primitive unit cell over the boundary is required along with the horizontal shift of one half of a primitive unit cell, to satisfy the requirements of being an APB. These shifts are created structurally by the incorporation of edge sharing octahedra. The edge sharing of octahedra is easily recognised in the image of Fig. 1b, since B site atoms are normally located a distance of a from each other, i.e. one primitive unit cell apart, where a ∼ 3.965Å for this composition. If octahedra share an edge, the B site atoms appear closer together since the atoms are now a/√2 ≈ 2.8Å apart. Thus, edge sharing in plane will result in two atoms imaged ∼2.8Å apart. If the edge sharing is happening between two atoms not in plane, then there is a shift of a/2 horizontally and a/2 vertically, and they appear ∼2Å apart.
After quantitative analysis of the atom positions using Gaussian fitting, a list of peak positions was determined for both A and B sites in the structure. The positions of the atoms in the
The resulting model after reconstruction is shown in Fig. 3a. This shows the edge sharing structures responsible for the two L shaped arrangements of Fe atoms. It should be noted that the two structures are similar in this respect, but different in their detailed structure, with the leftmost ‘L’ containing five edge sharing octahedra per layer in the
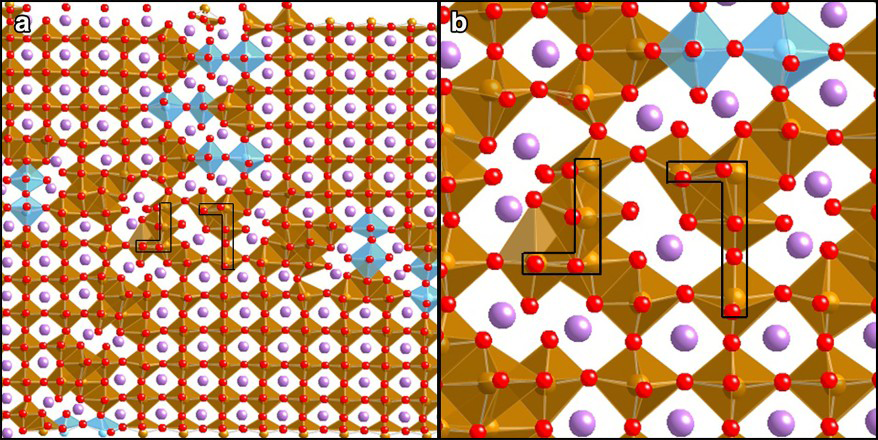
3D structural model for APB cross structure: a overall structure; b magnified view of core of APB cross showing two L shaped arrangements of edge sharing FeO6 octahedra
In order to confirm this structure, images were simulated using the Dr. Probe23,24 multislice software package. It was not possible to undertake a fully quantitative image matching as there were too many free parameters to allow a unique solution. Nevertheless, a simulation was carried out using the B parameters for BiFeO3 of Kubel et al. 25 of B(Bi) = 0.7 A2, B(Fe) = 0.5 A2, and B(O) = 0.7 A2. A good qualitative match was found to the experimental image for a thickness of 30 nm and a Gaussian effective source size of 0.45 Å half-width at half-maximum (including STEM source size, microscope and sample instabilities, and errors from image averaging). This thickness is not very precise, and reasonable matches could be found for a significant thickness range of 24–36 nm. The match of image to simulation is shown in Fig. 4.
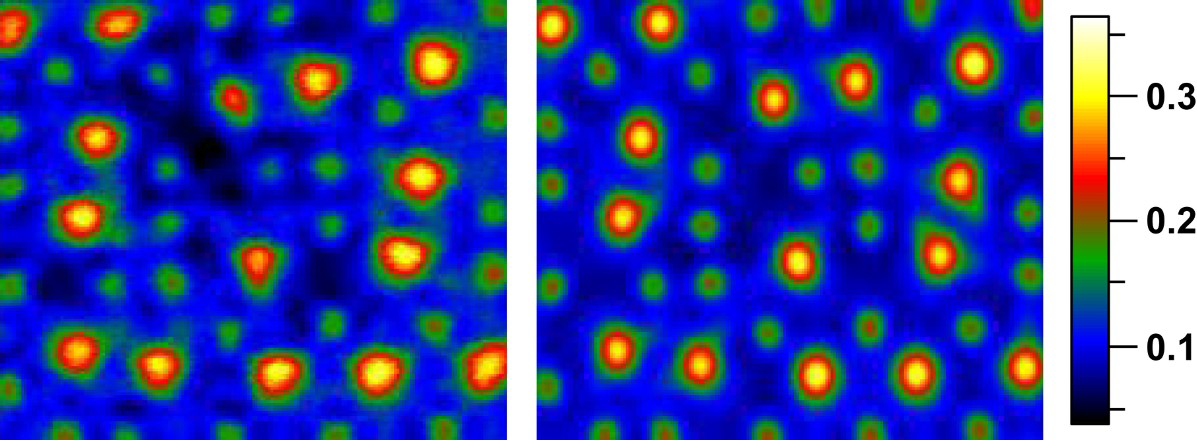
Comparison of simulation and image for core of APB cross showing good match to atom positions for all cation columns, although there are some minor discrepancies on intensities; colour scale runs from 0.06 I0 to 0.36 I0, where I0 is incident beam intensity
Since we are mainly interested in matching HAADF image contrast at this point, which depends principally upon cation locations, it is unlikely that any of the poorer uncertainties in oxygen site location in the model of Fig. 3 would have a significant effect on the simulation. The main discrepancies concern the intensities of some columns where the two Bi columns in the core and some of the Fe columns are weaker than in the simulation, suggesting that they may have been some vacancies or disorder on these columns, or that the structure is not quite perfect through the whole sample thickness. Nevertheless, in conclusion, these simulations broadly validate the model in Fig. 3, which has an estimated precision of 16, 17 and 25 pm for Bi, Fe and O site locations respectively.
As was previously noted for the steps, 15 this Fe rich APB cross structure can only be formed by a local excess of Fe, with the local diffusion of Ti away from this region. It seems that the complex arrangements of interlocking edge sharing octahedra needed to create the necessary unit cell shifts to match four shift related domains together are only possible with edge sharing FeO6 octahedra; we have never observed even two edge sharing TiO6 octahedra in all our work on this unique material. This structure of FeO6 octahedra sharing edges is seen on a larger scale in the γ-Fe2O3 structure, also known by its mineral name, maghemite. It is well known that maghemite supports ferrimagnetic spin orderings of the Fe3+ atoms. Specifically, the magnetic ordering of maghemite is such that it displays approximately parallel alignment of Fe3+ spins in edge sharing octahedra, with just the tetrahedrally coordinated Fe3+ ions having spins ordered antiparallel.26,27 (N.B. more detailed studies have revealed some spin canting from an ideal parallel spin alignment 28 ). Consequently, there is every expectation that these regions with maghemite-like edge sharing of octahedra will support parallel spin alignments between the Fe3+ ions; thus, these L-shaped regions, as well as steps on the APBs, 15 are likely to form columnar regions with a permanent magnetisation. It would be interesting in future work to probe this with high resolution techniques such as magnetic force microscopy and electron magnetic circular dichroism. 29
Conclusions
The 3D atomic chemistry and structure of the crossing of two APBs in Nd, Ti co-doped BiFeO3 has been determined using STEM. This was performed using a combination of quantitative atom position location in HAADF images, atomic resolution EELS spectrum imaging, prior knowledge from previous studies and sensible coordination of Fe atoms in octahedra connected either at the corners or edges. The model structure was qualitatively confirmed by comparison with multislice image simulations. The APB cross region contains two L-shaped structural units that are distinct from any structural units previously identified in APBs in this material. These were found to consist of clusters of edge sharing FeO6 octahedra, similar to the ordering in maghemite. Comparison to the spin ordering in maghemite suggests that such structures could support a locally ferromagnetic ordering.
Footnotes
Acknowledgements
We are extremely grateful to the EPSRC for funding large parts of this work. This included the materials synthesis at Sheffield (EP/G069069/1 and EP/G005001/1), the STEM work at SuperSTEM (EP/I000879/1 and EP/J009679/1), a DTA studentship for L.W., and the ongoing support for SuperSTEM as a national facility. J.M.S. is grateful to the Ministry of Higher Education and Scientific Research (Kurdistan, Iraq) for the provision of a KRG-HCDP scholarship. L.J. is grateful to the European Union Seventh Framework Programme under Grant Agreement 312483-ESTEEM2 (Integrated Infrastructure Initiative–I3) for funding the work on STEM image processing and distortion correction, which led to development of the tools used in this present work.