
Abstract
The complex microstructures of quenching and partitioning treated (QP980) steel have been investigated using two-step colour tint-etching method and further verified by X-ray diffraction, electron backscattering diffraction, magnetisation measurements and Mössbauer spectroscopy. The colour tint-etching method can quantitatively discriminate the ferrite, martensite and retained austenite by obviously colour differences. It is found that retained austenite was observed inside both martensite and ferrite, and the fraction of retained austenite in martensite was statistically higher but more scattering than that in ferrite. Moreover, the retained austenite in martensite is a little bit more stable than that in ferrite by comparing the change of volume fraction retained austenite in both phases after tension.
Introduction
It is known that retained austenite (RA) plays a critical role in the superior mechanical properties of advanced high strength sheet steels (AHSS) owing to the transformation induced plasticity (TRIP) 1 effect. Strain induced transformation 2 from RA to martensite increases the work hardening rate of TRIP-assisted steel, which delays the onset of necking and therefore increases the ductility. 3
Quenching and partitioning (QP) steel4,5 is a novel concept of heat treatment and its application to create a new generation of advanced high strength sheet steels has been extensively studied. In QP treated steels carbon would partition from martensite to austenite by isothermal treatment. This step will increase the austenite stability and then economically improve the TRIP effect in these steels.
The stability of RA in TRIP-assisted steel is affected by many factors, including chemical composition, 6 size/morphology,7,8 neighbouring microconstituents 3 and temperature. 9 It is crucial to exactly characterise and quantify the microstructures of multiphase steels for the understanding and optimisation of the mechanical properties of these materials.3,6,10,11
In order to describe the detail morphological features of RA in multiphase structures, a combination of different methods is necessary. Although the colour-tint etching technique has been applied successfully in TRIP steels, 12 it cannot distinguish the martensite and austenite. Santofimia et al. 10 studied the microstructures of QP steel by the same colour tint-etching method, but the differences among the three phases are not obvious and the volume fractions of RA calculated by an optical microscope (OM) are much larger than the values obtained by magnetic measurements. In addition, the neighbouring phases also affect the stability of RA, but there are few methods 3 to evaluate the volume fractions of RA in different phases simultaneously. Zhang and Findley 3 used a novel technique called the categorical chord length distribution to study this problem, but the statistical data they obtained are taken by SEM at a magnification of 6000, which is too small to reveal every phase.
In this study, the sheet steels provided by Baosteel consist of ferrite, martensite and RA. This steel is manufactured on the pilot product line and shows promising properties. In order to identify the RA accurately and completely, several experimental techniques are applied. A colour tint-etching technique is applied and adapted to discriminate the three phases based on the colour differences by OM and verified by other characterisation methods such as X-ray diffraction (XRD), electron backscattering diffraction (EBSD), magnetisation measurements and Mössbauer spectroscopy (MS). From the variation of austenite fraction before and after tension, the stability of RA inside different phases is also studied.
Experimental
QP 980 steels are supplied by Baosteel in the form of 1·6 mm thin sheets. The nominal chemical composition of the present steel is Fe–0·22C–1·40Si–1·80Mn (wt-). Microstructures are characterised by OM and EBSD. The volume fraction of RA is further determined using XRD with Cu Kα radiation, magnetisation measurements and MS, which are described in detail as below.
Tensile tests
Tensile test were prepared according to ASTM standard (E 8M-04) 13 with the long axes parallel to the rolling direction.
Tensile test were performed at a displacement rate of 0·0083 mm s−1 at 298 K using a Zwick (BTC-T1-FR020 TN.A50) universal testing machine. A standard knife-edge extensometer was used for all strain measurements. The gauge length is 25 mm.
OM
The samples are ground and polished at least down to 1 μm diamond paste. It is essential that the sample should be freshly polished in order to prevent any risk of peroxidation of the surface. After polishing, the surfaces are cleaned with soap solution, water and alcohol, and then blow dry with hot air. It is necessary to repeat several times to eliminate any trace of lubricant or impurities. 12
The samples are then etched first in a 4 picral solution (4 g of picric acid in 100 mL of ethanol) mixed with few drops of concentrated hydrochloric acid, to improve grain boundary etching, 14 for about 30 s and then wash thoroughly with water and dip immediately in a 10 aqueous solution of sodium metabisulphite for 8–10 s. The sample should be oscillated during etching. The sample surface is immediately flushed with ethanol and dried under a cool air flow after etching. This operation is also repeated a few times to ensure that no etchant remains on the specimen. 12 By the way, the second stage etching with sodium metabisulphite tints the martensite and the austenite remains unaffected. 14 The specimen is observed with a microscope equipped with a high-brightness halogen lamp (ZEISS AxidoCam MRC5).
For optimal contrast in light microscopy, the aperture iris diaphragm must be carefully adjusted to allow clear distinction of the different phases.
XRD
The amount of RA was measured by the Ultima IV X-ray diffractometer (Rigaku) from the integrated intensities of diffraction peaks (200)γ, (220)γ, (311)γ, (200)α, (211)α and (220)α by using Cu Kα radiation (ASTM: E975-13).
15
The samples were scanned and verified by 10 and 2° min−1 at a step size of 0·02°, respectively, and then calculated by the direct comparison method. The carbon content of RA was also simply estimated from the lattice parameter α0 measured by using the relation  .16,17
EBSD
Characterisation of microstructure was undertaken using AZTEC HKL EBSD instrument in a ZEISS SUPRA55 SEM. The samples for EBSD analysis were prepared on the rolling section and ground. A final electrolytic polishing with an electrolyte consisting in 5 perchloric acid and 95 glacial acetic acid at room temperature was performed before testing. EBSD micrograph is combined by band contrast map and phase map, in which bright grey is identified as ferrite, the dark grey laths cones are martensite and red corresponds to austenite. 18
Magnetisation measurements
Samples for magnetisation measurements were cut by wire-electrode with a size of 2× 2×1·6 mm and measured in a Quantum Design Physical Property Measurement System (PPMS-9T (EC-II)). The applied magnetic field was changed from 5 to 0 T in steps of 0·25 T at room temperature. Then the volume fraction of RA, fγ, is determined by a comparison of saturation magnetisation (Ms) values in the tested sample, Ms(c), and in the austenite-free sample Ms(f), which method was proposed by Zhao et al.,
19
MS
Mössbauer spectroscopy is said 20 to be a more sensitive (down to about 1 wt-) and accurate (better than ±0·5 wt-) method for determining the RA in steels. The sample size was 200×150×0·5 mm and the sample was first chemically thinned with 14 mL of HF in 100 mL of 30 H2O2 and 100 mL of distilled water to a thickness of about 0·4 mm; then mechanically polished down to 0·1 mm; the sample was finally electrolytic polished down to 70 μm with the same electrolyte used by EBSD. The spectra were recorded on the Wissel spectrometer (Wissel, Germany) with a 57Co source in a Pd matrix on a constant acceleration drive at room temperature and fitted by means of a least-squares iterative program.
Results and discussion
As mentioned above, the two-step colour tint-etching method can distinguish the three existing phases. As labelled in the Fig. 1a, martensite is puce, while ferrite appears white, thus each phase is easy to distinguish. The micrograph in Fig. 1b which is taken under the polarised light illustrates the identical microstructures in which ferrite appears light blue tinted as the samples contain Si, 12 martensite is observed as dark blue by intentional over exposure to the solution and RA shows differentiable white. By comparing Fig. 1a and b, though the RA in the ferrite may single out by the shape, it is found that only under the polarised light the RA, which in or adjacent to the martensite, can be separated, such as the red rectangle marked in Fig. 1a and b.
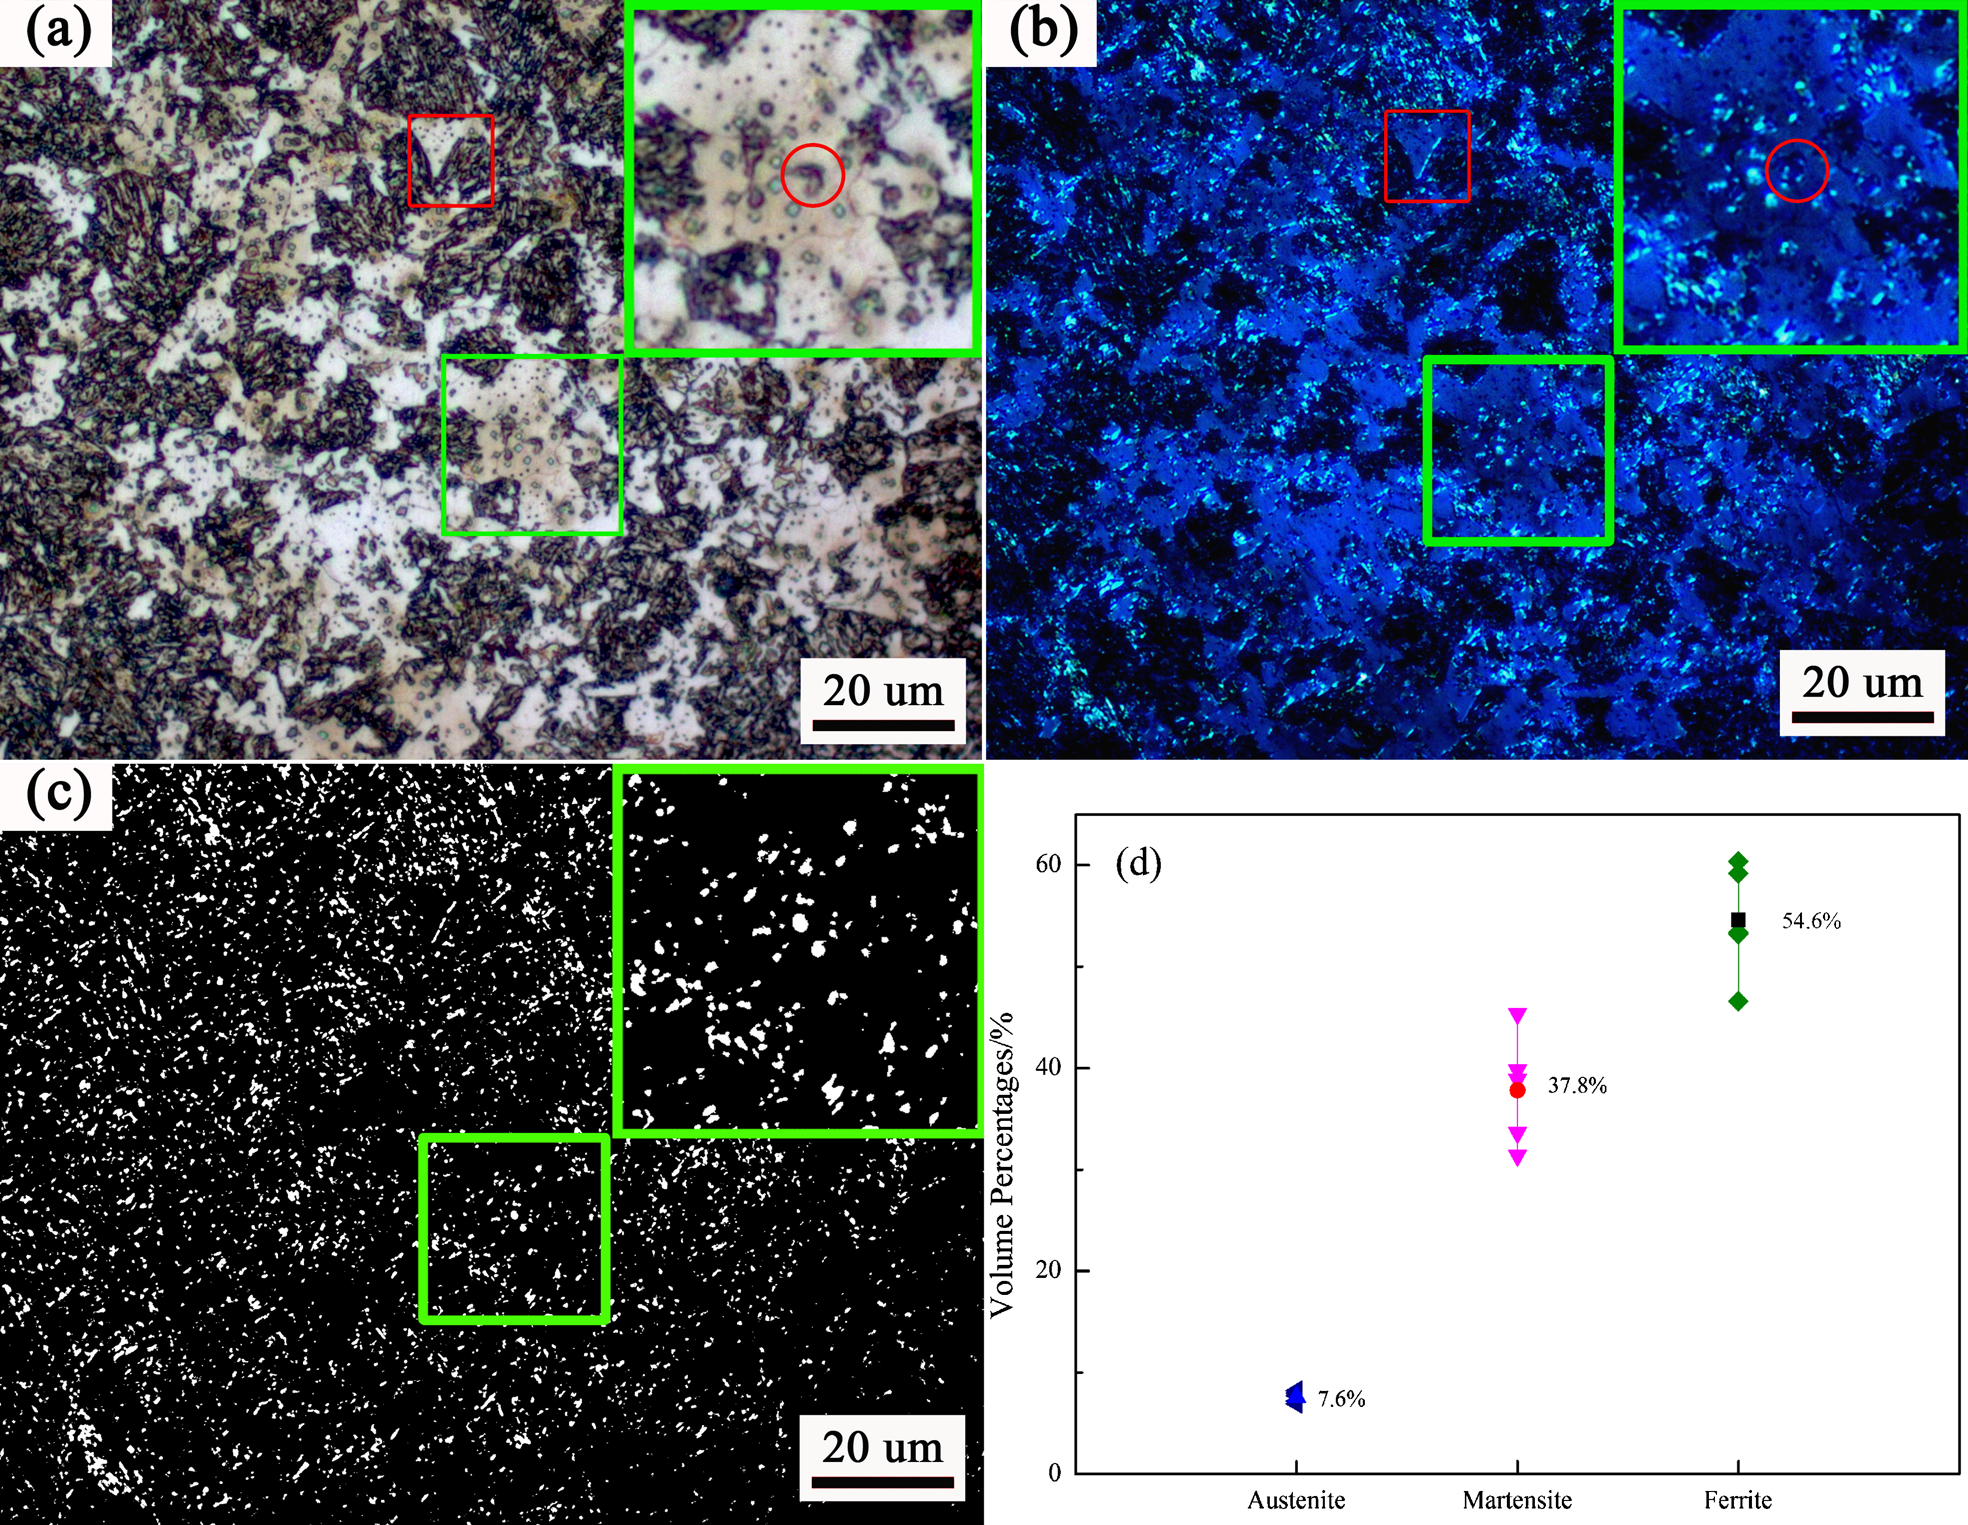
a normal pattern; b under polarised light; c binary map of whole RA; d the statistical results of three phases. Numbers indicates average fraction of each phase
Figure 1c is selected binary map of the whole RA that determined by the colour tint-etching image. As also both ferrite and martensite are easily distinguishable by the distinct colour contrast as shown in Fig. 1a and b, thus each fraction is evaluated through image analysis and the result is presented in Fig. 1d. Analyses are conducted based on detailed measurements of five microstructure regions, at a magnification of 1000.
The XRD profiles of as received, annealed and tensioned samples are shown in the Fig. 2a, in which the annealed sample refers to the anneal of as received QP sample at 600°C for 1 h. The volume fraction of RA is calculated by the direct comparison method. The average value of the volume fraction of RA of as received samples is 8·31, which is comparable to the colour tint-etching statistic result. The average carbon concentrations of RA of as received samples are also calculated and the mean value is about 1·2. As to the after-tensile test sample, which is ranked as (b) in the Fig. 2, the peaks of fcc are almost undetectable because of the low RA volume fraction and high background level. The profile marked (c) is the result of annealed sample which only shows bcc peaks.
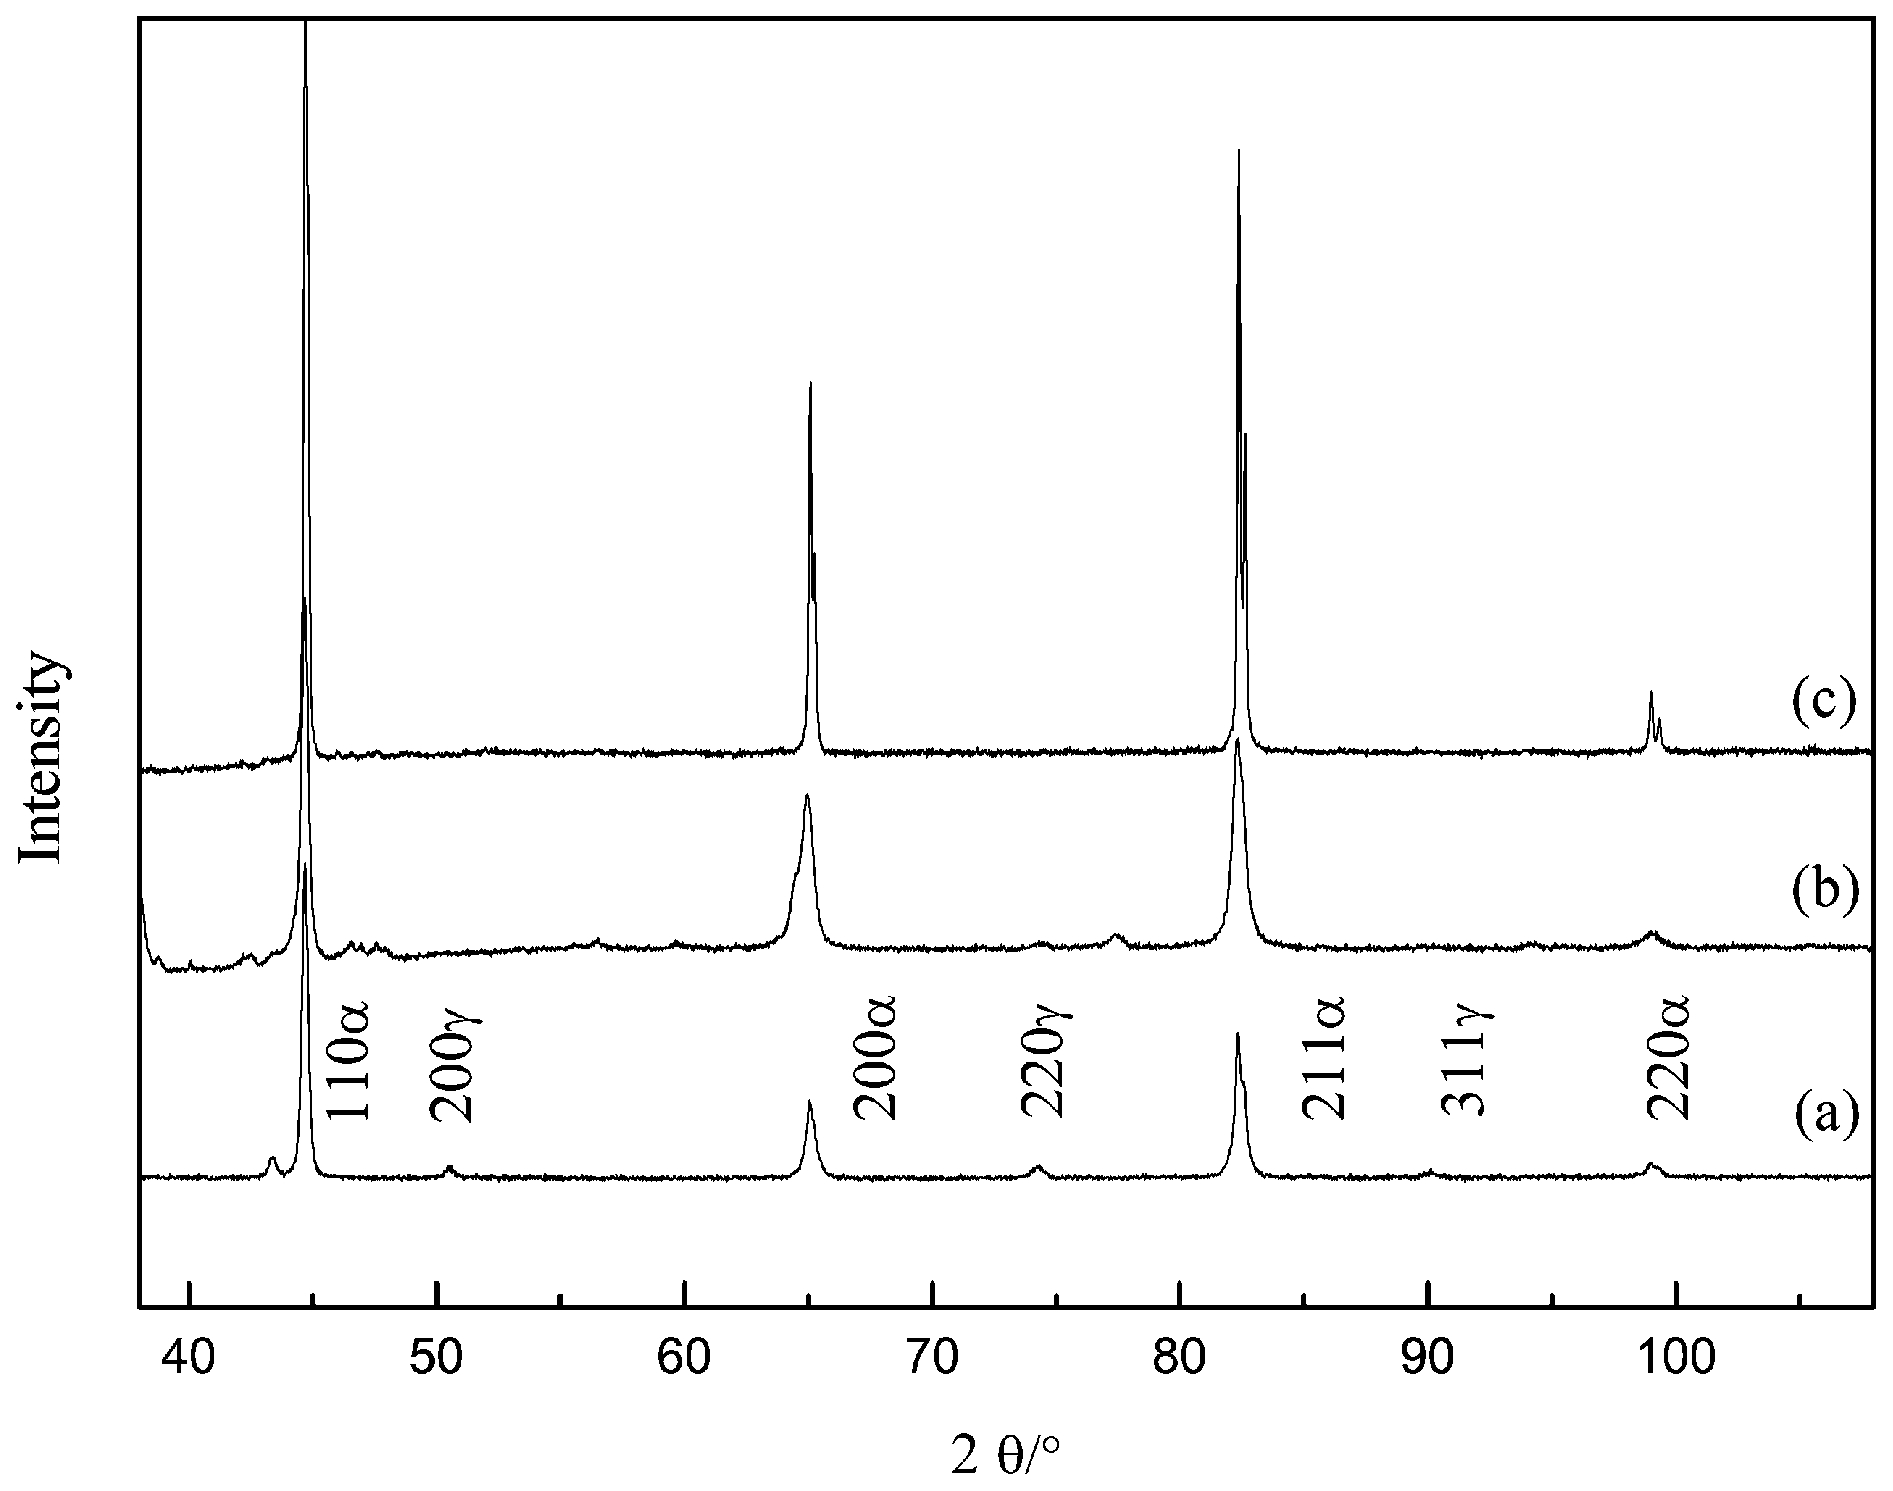
a as received sample; b after-tensile test sample; c annealed sample of as received
In order to quantitatively verify the phase identification with these OM and XRD observations, further analyses with EBSD, magnetisation measurements and MS are carried out.
The bcc and fcc microstructural components of the as received and after-tensile test as well as annealed of as received sample are recognised by the EBSD microscopy. The identified volume fractions of RA of as received and after-tensile test samples in Fig. 3a and c are 6·2 and 1·5, respectively. The unidentified percentages are 4·46 and 9·2 correspondingly. As the residual stress and lattice distortion accumulated, the unidentified content becomes larger. The difference between ferrite and martensite can be differentiated by the morphology. As marked by blue circle in Fig. 3a, there exists M/A islands, which is also observed in the colour tint-etching images. It is observed that the RA exists in both ferrite and martensite, which is similar to OM observation. Figure 3b is the annealed sample and shows little fcc phase.
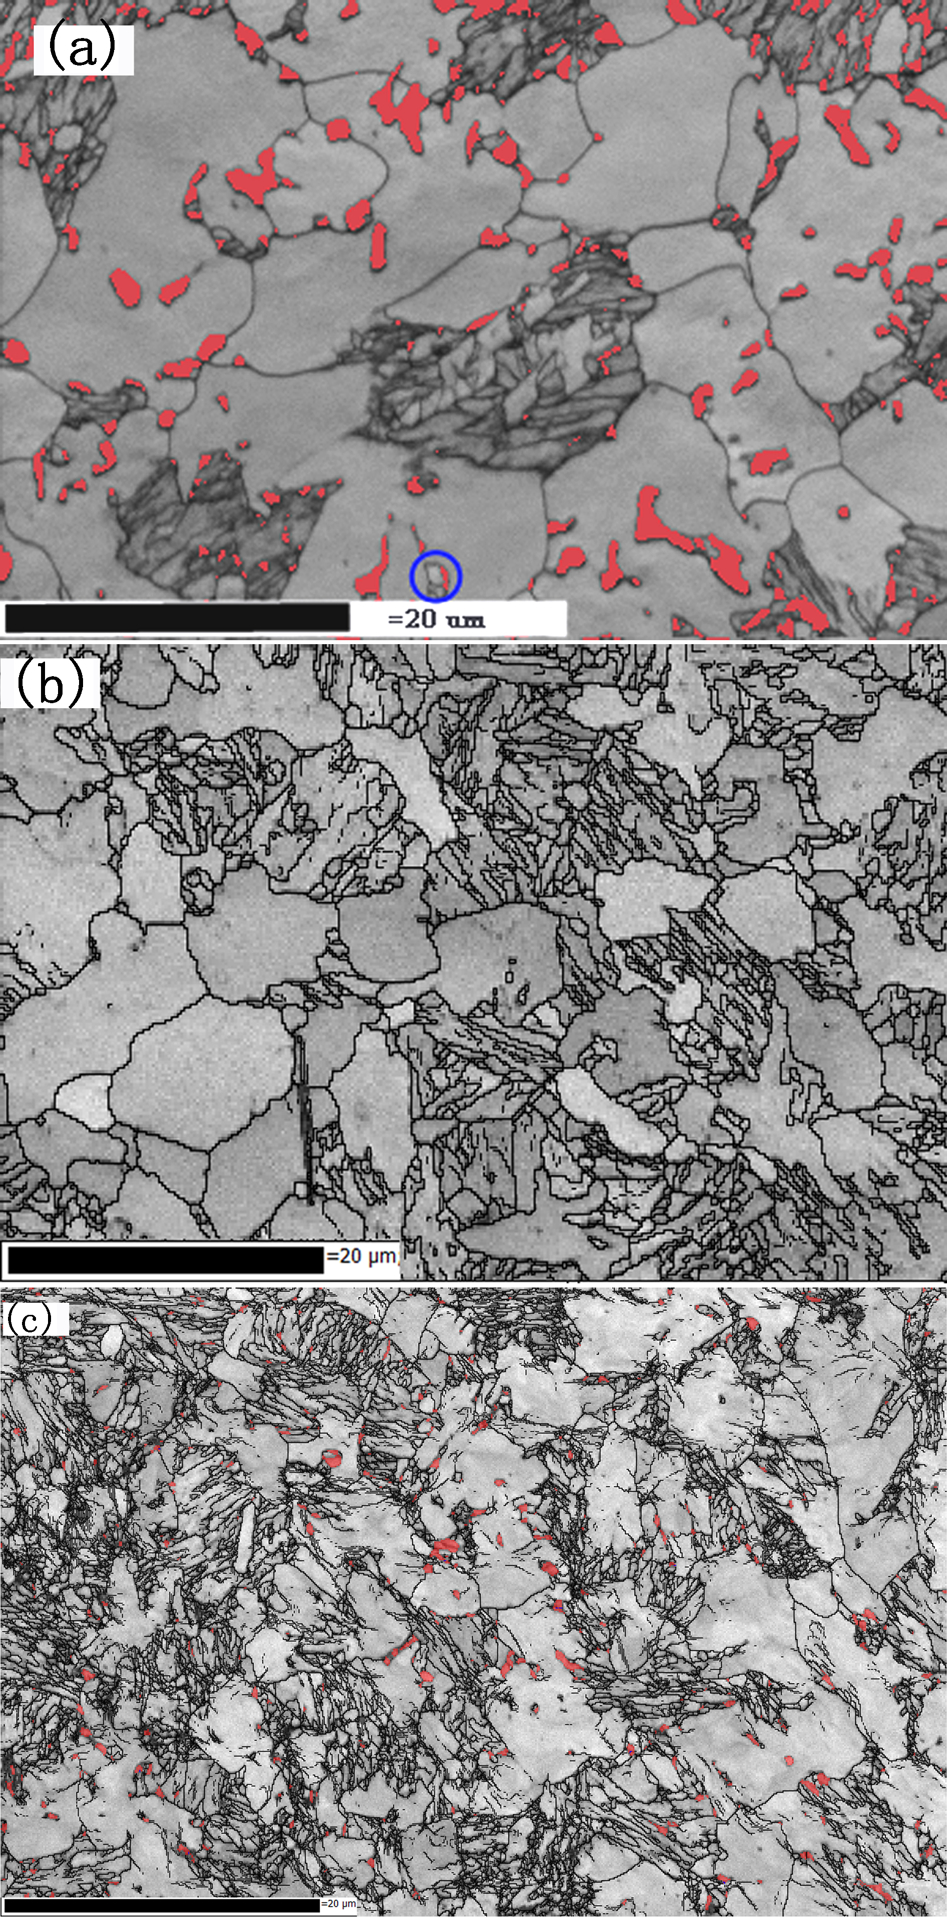
a as received sample; b annealed sample of as received; c after-tensile test sample; light grey is identified as ferrite, dark grey laths cones are martensite and red corresponds to austenite
However, EBSD microscopy reveals only a limited area of the whole specimen, which may make a quantification of the volume fraction of RA not accurate. In addition, part of the RA that could be ‘locked’ inside the martensite laths is also not detected by the EBSD technique. 10 Thus it will need large scale image with high resolution to obtain the statistical result, which is costly and time-consuming.
Figure 4 is the magnetic curves for the three different samples by combining the fitting curves with original data. As verified by XRD and EBSD, the annealed of as received sample contains no austenite, which is used as the reference specimen. The volume fractions of RA of as received and after-tensile test samples are estimated as 9·0 and 4·0, respectively. The calculated value of after-tensile test sample is quite in agreement with the statistical result obtained by colour tint-etching method. It is claimed 2 that XRD is inappropriate for measurement of RA if the fraction is lower than 0·05, especially when the sample contains much martensite or residual stresses. Magnetisation measurement is considered as a feasible and accurate technique to determine the fraction of RA.
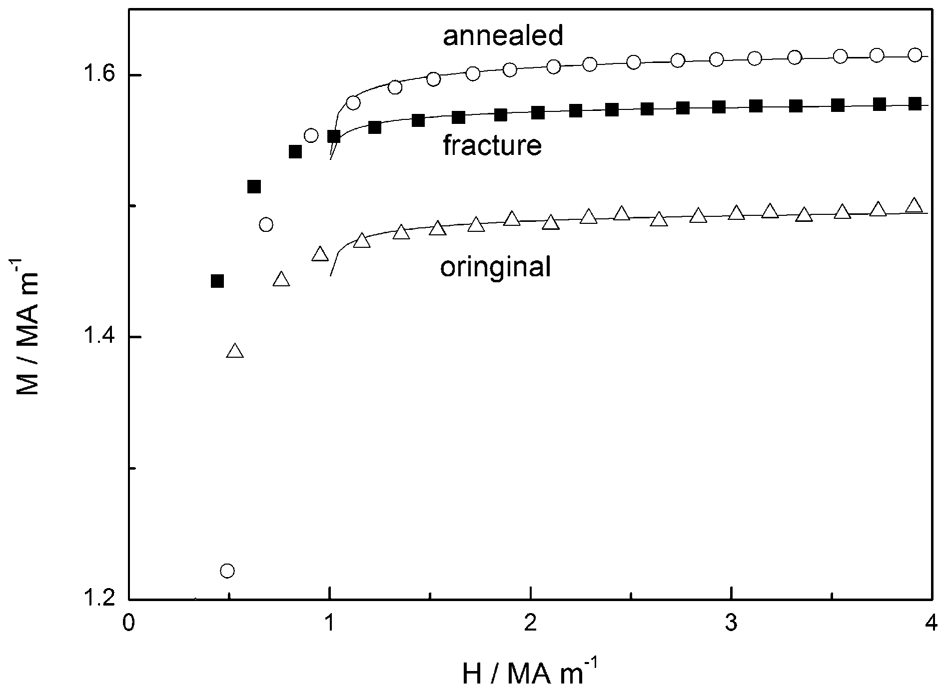
Measured magnetisation as function of applied magnetic field for QP980 steels. Open circles represent annealed sample, which is austenite-free, solid squares represent fracture sample, open triangle represent original sample. Line is fitting curve with equation (1)
The results of MS are shown in Fig. 5. The single peak of black line is the austenite peak component. The volume fraction of the RA of as received samples is calculated by the ratio of the area of the austenite peak to the total area of the spectrum. 20 The value is calculated as 10·6, which is slightly higher than the statistic results obtained by the colour tint-etching technique but closed to the magnetisation measurement.
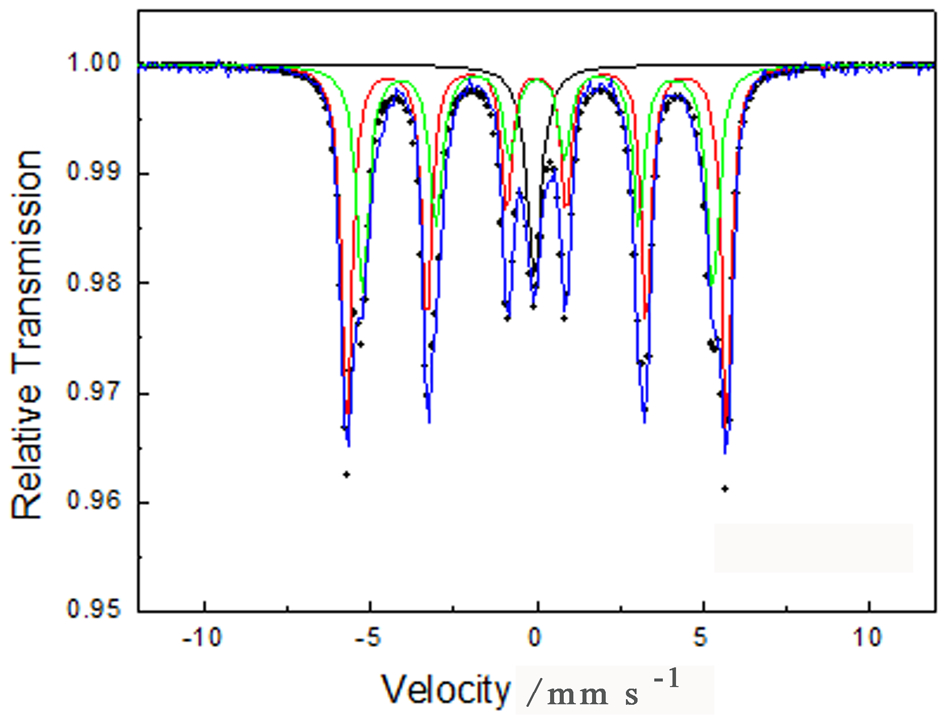
Typical Mössbauer spectrum of as received sample measured at room temperature. Single peak of black line is austenite peak component
As verified by the XRD, EBSD, magnetic measurements and MS methods, the two step colour tint-etching technique can be used as a simple and intuitive technique to quantify the three different phases, especially to the RA.
The method was applied to preliminary study the austenite stability upon tensile deformation. Figure 6 is a tensile engineering stress–strain curve of this QP treated steel. The ultimate tensile strength and elongation to failure are 1066 MPa and 22, respectively. The after-tensile sample was characterised by the colour tint-etching method. For both as received and after-tensile samples, each phase was extracted by the colour difference and was filled with different colours, and then by overlapping the different colour layers of the three phases in different orders, the volume fractions of RA in the different phases before and after tensile test could be evaluated. Figure 7a and b is image of colour etched specimen taken after the tensile test. In Fig. 7c, the red area in black represents the RA which is in martensite. Fig. 7d is the statistical results of RA inside different phases of as received and after-tensile test samples. The volume fractions of RA in the martensite before and after tensile test are 4·8 and 1·9, respectively; in the ferrite are 2·8 and 1·1, respectively. As seen in the figure, the volume fraction of RA in martensite is higher but more scattering than the RA in ferrite. This illustrates that the RA in ferrite distributes more uniformly than that in martensite. The relative fractions transformed of RA after tensile in martensite and ferrite are 57·8 and 63·9, respectively. Therefore RA in martensite is a little more stable than RA in ferrite. This can be explained by two possible mechanisms: local carbon partitioning and stress shielding. 3 As to the QP steels, during the heat treatment of partitioning, the RA in or adjacent to the martensite contains more carbon, which will stabilise the RA. Moreover, the martensite is much harder than the other phases, thus will make the RA in or adjacent martensite more stable. 21
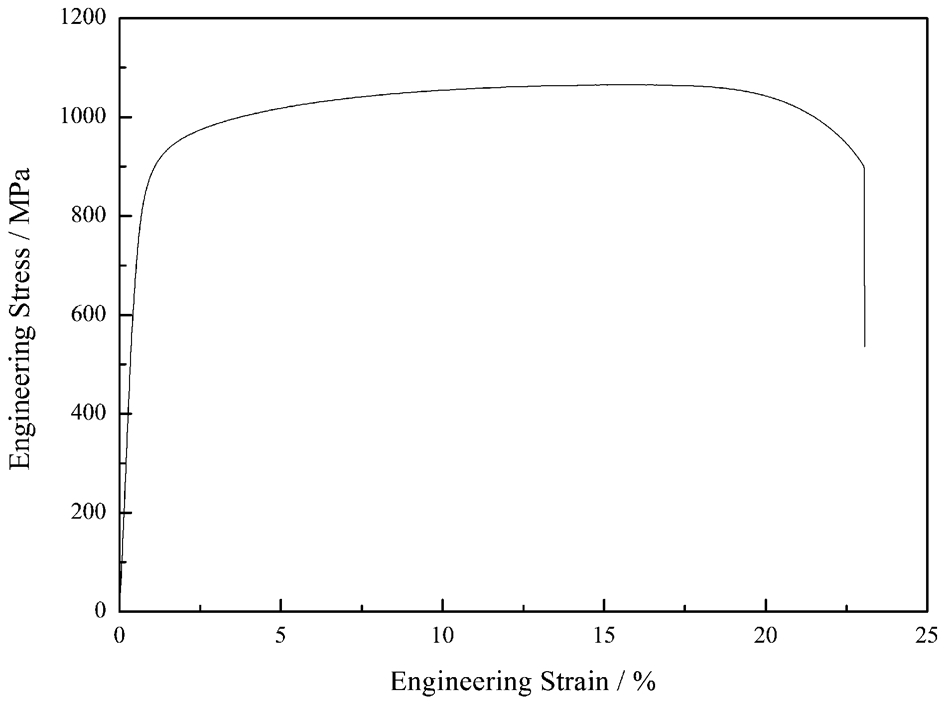
Representative engineering strain–stress curve at constant strain rate of 0·5 min mm−1 at 298 K
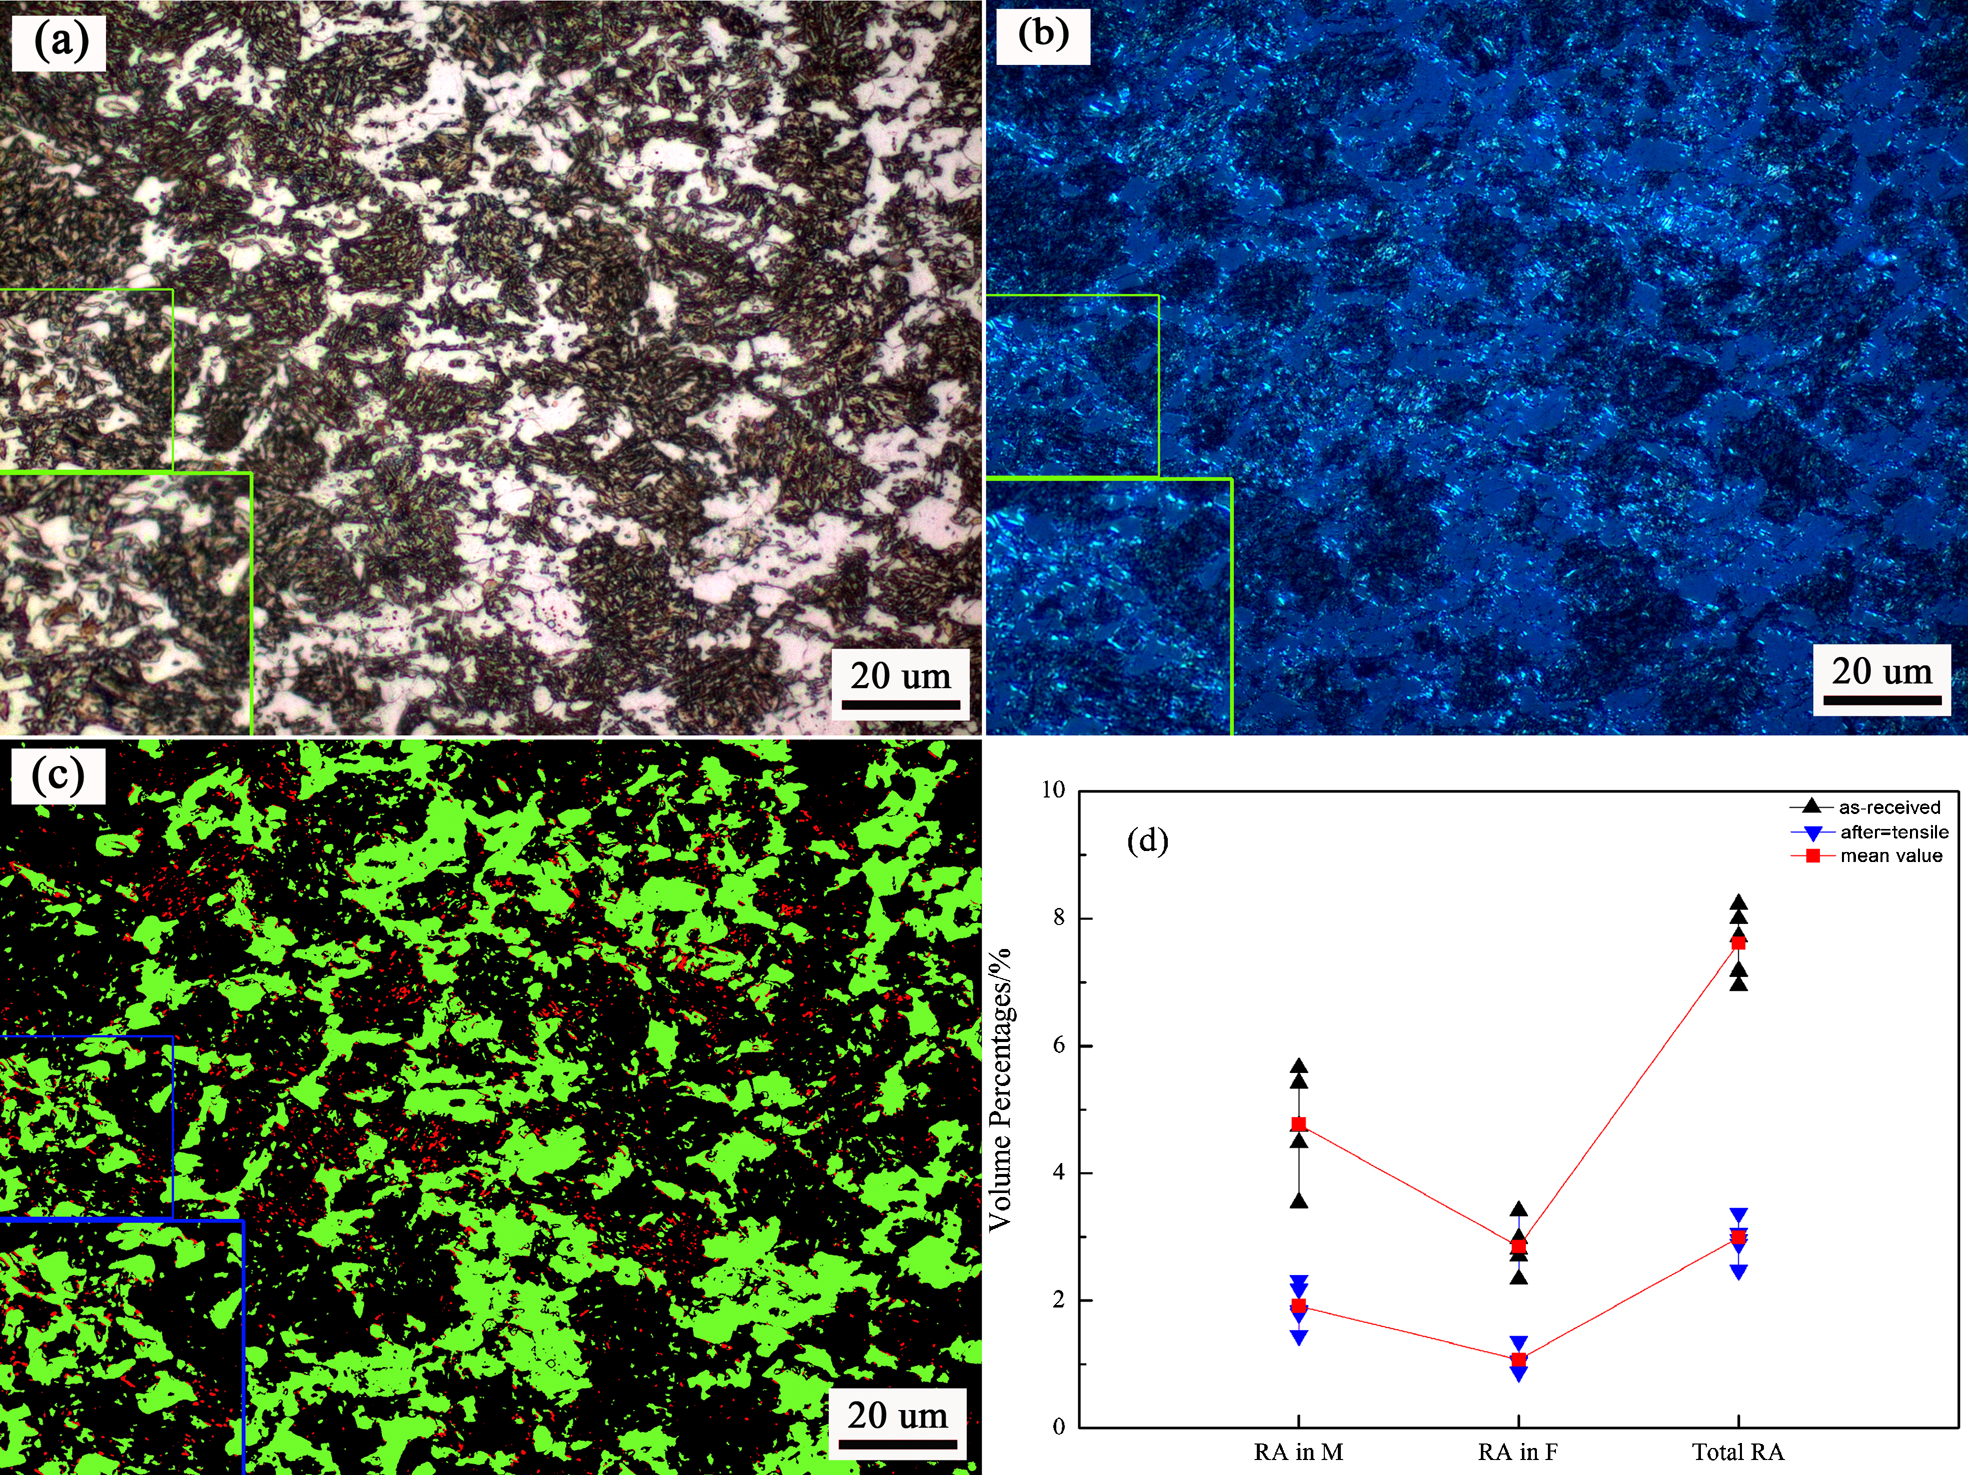
Colour etching morphology of after-tensile test sample and overlapping images; a and b are normal pattern and polarised light pattern at magnification of 1000, respectively; c overlapping image that presents RA in martensite; d statistical results of RA in different phases of as received and after-tensile test samples
The colour tint-etching technique is a relative simple, direct technique and easy to access. It is more intuitional by comparing other measurements like XRD or MS. The statistic results about the RA can be obtained with a magnification of 1000 under the OM. Therefore, the colour tint-etching technique is statistically meaningful and its values agree well with other measurement results, as listed in Table 1. Though light OM has its own disadvantages, for instance its resolution is limited, which makes it unsuitable for observing film-like RA in martensite. Sometimes the colour contrast of small size of RA is undetectable by the image analysis software, which makes the volume fraction underestimated. In general, the colour tint-etching technique can be used to study the effects of the size and neighbouring phases of the stability of the RA. Combining with results of other techniques, the morphology, fraction and other microstructural features can be obtained.
Fraction of RA measured by different kinds of methods
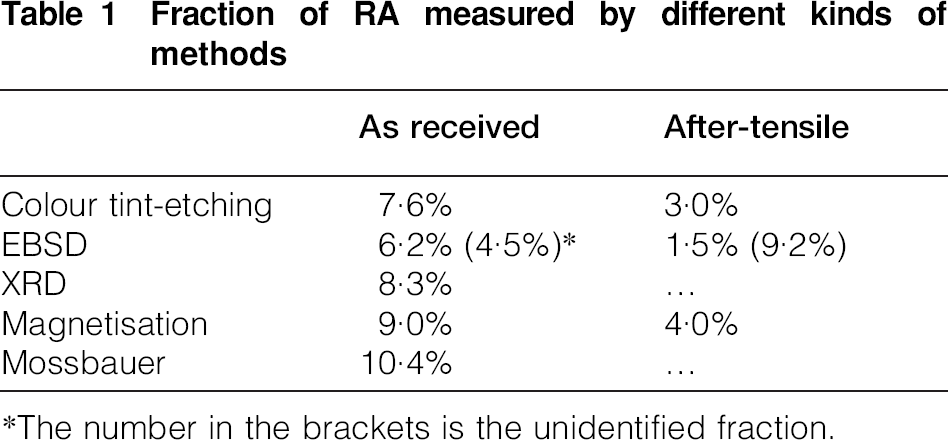
*The number in the brackets is the unidentified fraction.
Conclusions
The colour tint-etching technique can quantitatively distinguish three phases in a QP treated steel by obviously colour differences, which is further verified by other measurements such as MS and magnetic measurements. The method is simple and direct in evaluating the stability of RA in high strength QP steels.
For QP treated steel RA is found in both martensite and ferrite. The volume fraction of RA in martensite (4·8) is statistically higher but more scattering than that in ferrite (2·8).
The RA in martensite is somehow more stable than that in ferrite by comparing the volume change of RA inside different phases before and after tensile test.
Footnotes
Acknowledgements
This research was supported by the National Basic Research Program of China (973 Programs Grant No. 2010CB630803) and National Science Foundation of China (No. 51174251 and No. 51201105).