
Abstract
This study of Swedish road and rail project performance challenges understanding of project success and presents findings that run counter to the widely held position that transport infrastructure delivery performance and outcomes are persistently poor. Both road and rail investments proved economically profitable and were typically delivered to budget, evidence that questions theory claiming optimism bias and malicious agency dynamics such as strategic misrepresentation are endemic in decision-making during planning and persistently cause poor project performance. Summary findings on the performance of Swedish transport infrastructure projects are: 93% of road projects achieved intended benefits, 86% returned positive net present value, and cost overrun was typically 2.7%. Road projects typically achieve a net present value of 1.6 against an estimate of 0.6. 70% of rail projects achieved intended benefits, 63% returned positive net present value, and typical cost performance was -1.8% underrun. This contribution opens new avenues for research by scholars to explain this apparent success and why some projects, even in Sweden, fail.
Introduction
The Boston Big Dig became a poster child for an enduring and sorry tale of cost overruns in large transport infrastructure projects. Reporting 10 years after completion, the Boston Globe reminded its readers this project was, “the most expensive highway in US history,” and, “plagued by cost overruns, ballooning from $2.6 billion to nearly $15 billion ($24 billion, counting interest on the debt)” (Flint, 2015). Similar headline-grabbing examples include the Channel Tunnel rail link between France and the United Kingdom, which “cost £4.65 billion (equivalent to £12 billion today), 80 per cent more than expected” (Smith, 2019).
This focus on a particular case mirrors the format beloved by journalists of using first person narration to make a phenomenon memorable (Papeo et al., 2011). Negative news also attracts interest (Trussler & Soroka, 2014) and a failing transport infrastructure project can prove a gift that keeps giving, especially the sense of jeopardy evoked when lumbering toward then past an infeasible budget and unlikely opening date announced with fanfare at inception. The cumulative effect of these notable, headline-hitting projects is their contribution to an overall despondent narrative and serve to ease acceptance of general claims about the performance of infrastructure projects such as the “Iron law of megaprojects: Over budget, over time, over and over again” (Flyvbjerg, 2014, p. 11).
In contrast, few headlines were written about Denmark’s 1.7-kilometer Vejlefjord Bridge, part of the Trans-European Transport Network (TER-N) with national significance and local importance. Opened in 1980 13% below cost (Holm, 2000), the bridge met forecast usage and continues to achieve its primary aim of reducing traffic in the nearby regional center of Vejle. Likewise, little mention is made of the Forth Replacement Crossing, “The largest Scottish infrastructure project for a generation” that is “future proofing of the cross-Forth transport corridor so vital to the Scottish economy” possessing a visual appeal lauded as “iconic” (Institution of Civil Engineers, 2023) delivered for £1.34 billion, around 22% to 43% below its approved budget (Audit Scotland, 2018). Perhaps the achievements of these projects were outliers and among a lucky few?
Whatever the status of individual projects, ad hoc observation offers little to inform general conclusions. Concerted efforts that pool results and claim statistical validity for their conclusions can be impressive, however confidence in their findings is undermined by methodological issues including poor transparency of source data (McLeod, 2023) and lack of independent replication, two cornerstones of scientific enquiry. Topical concerns voiced over the validity of behavioral science studies where, “initial results that have not yet been replicated are often quickly recycled into sensational headlines, popular self-help books and business practice” (Jack & Hill, 2023) seem all too familiar when casting an eye over many studies into project delivery performance.
In an effort to bring light to the understanding of general performance of transport infrastructure delivery, this study presents the findings of an ex-post analysis of two populations of transport infrastructure projects: 228 road/highway projects and 96 rail infrastructure projects completed over 25 years between 1998 and 2022 and over 18 years between 2005 and 2022, respectively. This access to whole population data provides an opportunity to examine the delivery performance of these particular projects as well as an opportunity to revisit how transport infrastructure projects are evaluated in general.
This article begins by setting the work in context with a brief recap of the background before focusing on the literature on capital project evaluation. The analysis of the cost performance of the populations of transport infrastructure projects is then presented and discussed. The article concludes with policy, practice, and methodological implications of these findings.
Background
Transport infrastructure projects are important enablers of social and economic goals (Aschauer 1989; Infrastructure and Projects Authority, 2021) while also costing nationally significant sums of money, for example the USA’s Bipartisan Infrastructure Law provides US$350 billion over five years for highway programs (Federal Highways Authority, 2021). These characteristics situate these projects and their delivery in economic, social, and political domains as much as the engineering and technical domains needed to scope, design, build, and operate them. Transport infrastructure projects mirror characteristics found in other large engineering projects (Miller & Lessard, 2001a) such as being the product of negotiated compromise arising from the need to integrate with technical and social networks; facing contested externalities; being exposed to political risk; and presenting large, irreversible commitments.
A simple answer to identifying what good looks like on how to determine delivery success of these projects proves elusive, with conceptions having changed over time and a discontinuity existing between stakeholders (Davis, 2014) leading to exasperation in some quarters over a discipline that, “still appears mired in conceptual confusion around such basic principles as consistent generally-accepted definitions of ‘success’” (Ika & Pinto, 2023, p. 1). Viewing project success in terms of a series of criteria (Allport, 2008; Cooke-Davies, 2002; Ika & Pinto, 2022; Morris & Hough, 1987) offers some guidance, where these include: doing the right project (Cooke-Davies, 2004), aligned with policy/strategic objectives and priorities; effective project management in terms of delivering to budget, on schedule, and to technical specification; and project sustainability where the resulting project performs as expected and policy success is achieved. Even so, reducing the perspective on projects to a dichotomy of success and failure, however defined can for some seem “too rigid, inflexible, and unnuanced” (van Marrewijk et al., 2024, p. 131).
With an eye to wider considerations, this article considers project management effectiveness “doing projects right” and project effectiveness “doing the right projects” (Cooper et al., 2000, p. 18). To assess project management effectiveness this work considers a seemingly age-old topic that remains stubbornly topical where, “One of the key challenges that has remained underexplored thus far and holds opportunities in this field of study, is the frequent failure of projects to meet their goals” (van Marrewijk et al., 2024, p. 131). In particular, the focus of this work rests on an issue of interest to transport infrastructure funders, clients that commission them, organizations that build them, and citizens who use them, which is the extensively reported tendency for these projects to experience cost overruns (Cavalieri et al., 2019; Chen et al., 2023; Cooke-Davies, 2004; Denicol et al., 2020; Flyvbjerg, 2014, 2021; McLeod, 2023; Merrow et al., 1988; Merrow & Yarossi, 1990; Miller & Lessard, 2001b; Odeck, 2004) where a main conclusion from this literature is one of, “almost all projects tending to have cost overruns” (Catalão et al., 2019, p. 225). Cost overrun is also a topic of interest to the academic community where its nature and causes receive regular attention (Chapman & Quang, 2021; Cavalieri et al., 2019; Denicol et al., 2020; Holweg & Maylor, 2018; Odeck, 2014) and experiences energetic debate (Flyvbjerg et al., 2019; Love et al., 2019; Pinto, 2021).
Transport infrastructure projects are undertaken for a variety of reasons and aim to achieve a range of objectives, such as travel time reduction, capacity increase, safety improvement, and environmental effects, so effectiveness is assessed in terms of whether a project achieved the intended benefits stated at its outset. While cost performance is important to understand, understanding project effectiveness is an arguably more critical dimension of performance though one underreported in the literature where “Ex-post evaluations of benefit-cost analyses (BCAs) of transportation projects are scarce” (Odeck & Kjerkreit, 2019, p. 227). Notwithstanding, and encompassing both project management effectiveness and project effectiveness, measuring economic profitability using net present value allows a cost-benefit analysis of a project that considers the cost of a project against a monetized measure of benefits delivered, where anytime an organization is, “using today’s dollars for future returns, NPV is a solid choice” (Gallo, 2014).
Ex-Post Evaluation of Transport Infrastructure Projects
Noting the lament of observers over the insufficient rigor of project management research (Ika & Munro, 2022) the method followed and data sources are set out below. The standard metric for measuring project delivery performance is to compare outturn performance of a project relative to the objectives set out in the final business case, against which the final decision was made to commit investment to the project (Pellegrinelli et al., 2007; Pickrell, 1989). Benefits are assessed after the project has been completed and the delivered capability is in use. Common practice is to undertake an assessment after a set period of time such as one year, three years, and/or five years. Reviews undertaken a longer period after completion have the advantage of the delivered capability being evaluated when it has bedded in and become business as usual with adoption issues resolved and lag effects unwound. In contrast, reviews relatively soon after completion have the advantage of recency, so understanding the project’s purpose is more likely to be clear and people and documentation should be more accessible, while a shorter time frame can also allow a quicker turnaround of lessons learned to invest in future projects. As a key measure of project management efficiency, the use of the final business case cost estimate made at the time of decision to build as the baseline against which to compare outturn cost has been described as, “the international standard for calculating cost development.” (Flyvbjerg, 2007, p. 13) that is, “followed by academics, governments, and national audit offices around the world” (Flyvbjerg et al., 2019, p. 410).
Dealing with Costs Incurred in Different Years
Assessment of a capital project delivered over a series of years requires costs to be measured at “constant prices, and against a consistent baseline” (Flyvbjerg et al., 2018, p. 188). This requires adjusting nominal costs in current year prices to a constant, or real basis as per guidance from, among others, the U.S. Government Accountability Office (GAO, 2009), UK Government Treasury and Department for Transport (Department for Transport, 2018), and the World Bank (Independent Evaluation Group, 2012).
The usual means of adjusting nominal costs incurred on an infrastructure project is by using an index (Royal Institution of Chartered Surveyors, n.d.), and on transport infrastructure projects the UK Department for Transport advises: “Analysts should consider current and forecast inflation from industry sources appropriate for their scheme” (Department for Transport, 2017, p. 2). This approach to deflating nominal costs to real costs using indices that track changes in sector-specific prices is employed by the U.S. Federal Transit Administration to assess project costs in their mandated in law Before-and-After Studies (Federal Transit Administration, 2017). The choice between alternative indices raises the issue of “inflation shopping” (Chapman, 2021, p. 1) but guidance is clear that “Because all inflation indexes measure the average rate of inflation for a particular market basket of goods, the objective in making a choice is to select the one whose market basket most closely matches the program to be estimated” (GAO, 2009, p. 103).
Evaluation of a Project Population/Portfolio
The central tendency of a distribution, colloquially termed its average, usually refers to the arithmetic mean, though could refer to other calculations such as the mode or median. These calculations coincide for a population with a normal distribution; however, they differ in a skewed distribution. Where outliers exist and need to be accommodated, then robust methods are required. In this situation “The median is a nonparametric statistic, [and therefore correct for a large class of distributions] but it is also a highly robust estimate for estimating the center of a symmetric distribution as a central model” (Portnoy & He, 2000, p. 1332). The median therefore provides the most robust choice of measure for the central tendency given its suitability for both symmetrical and non-symmetrically distributed populations. The median is calculated by rank ordering a dataset and identifying the middle number, with half the values less than this value and half the values greater than this value.
Criteria for Selecting a Study Population
While project type is not viewed as having an influence on cost performance by some, for example “we do not need to distinguish between rail, fixed link and road projects” (Flyvbjerg et al., 2004, p. 7), a mix of projects has at the very least the potential to be distracting so data was sought on projects from specific transport infrastructure sectors. The criteria set out for choosing a data source was that it needed to demonstrate the following two features:
Reliable, in that data comes from a reputable organization known to possess subject matter expertise and experienced personnel that operates a policy of internal review and their methods and data are subject to external, independent audit. Available, with data publicly available that allows the measurement of the (in)accuracy of estimates in line with “international convention” (Flyvbjerg et al., 2002 p. 281), in other words, for each project:
The planned business case at the time of final decision to build, including the ex-ante, estimated cost of the projects and estimate of benefits and outcomes; and The outturn performance, including the final cost of the completed project and ex-post assessment of benefits and outcomes.
Swedish Transport Infrastructure Projects
Applying the reliability criteria, Trafikverket, the Swedish Transport Administration was identified as a suitable data source. Sweden has very low corruption (fifth lowest internationally, [Transparency International, 2022]) and high public trust in government (fourth highest internationally [Organisation for Economic Co-operation and Development (OECD), 2023]), which sets an expectation of public sector integrity. Trafikverket is subject to periodic review by Riksrevisionen, Sweden’s national audit office under its remit to carry out both performance and financial audits. Trafikverket is responsible for the long-term planning of infrastructure as well as for the construction and operation of state roads and railways, with a history stretching back to 1841, suggesting it possesses the institutional capability to undertake its remit effectively.
Applying the availability criteria, Trafikverket and its predecessor organizations Vägverket (roads) and Banverkets (rail) monitor all Swedish road and rail projects above a cost threshold of SEK50 million for national projects and SEK25 million for regional projects. Data is published on planned cost and outturn cost of individual projects as well as economic profitability of each scheme’s planned net present value as well as net present value recalculated with the final cost of the scheme and an additional recalculated net present value five years after completion. Trafikverket also monitors benefit realization five years after completion and publishes an assessment of benefits achieved compared against estimated benefits. Data was collated for all road projects completed between 1998 and 2022 and all rail projects completed between 2005 and 2022, except for projects completed in 2006 due to inconsistent treatment of some costs that year, which meant this data was unreliable.
Data Limitations
Assembling data from a single organization has the benefit of being collected on a broadly consistent basis and allows a comprehensive dataset to be brought together that is not subject to selection bias. Utilizing this resource does however introduce the potential for systematic error, such as data may be subject to a methodological issue or inherent bias or there may be unusual features of the setting—be they technical, socioeconomic, political, or temporal—that cause the performance of these projects to be atypical and therefore not generalizable.
Trafikverket publishes road and rail project costs on a real basis using weighted building indices for road and for rail projects, where “The rail and road index uses the E84 building index that has been specially weighted for labor operations and product groups that are specific for rail and road work” (Trafikverket, 2010, p. 20). The potential for misalignment between the indices and project inputs is also recognized where “costs can be under-estimated or over-estimated as a result of the weighted index’s composition not corresponding with the composition of the actual project” (Banverket, 2007, p. 26).
Evaluation of Project Delivery Benefits Realization
Evaluation of benefits assesses whether the intended benefit of a project has been realized. This is determined by comparing the intended benefit recorded in a project’s plan with the actual benefit achieved five years after project completion and reported by Trafikverket as either yes, where planned benefits are deemed to have been achieved or no, where planned benefits are deemed not to have been achieved. To administer collation of these evaluations, in this study they are termed “data point 1.”
Evaluation of a Project’s Economic Profitability
To assess project performance in terms of economic profitability, data on net present value was collated for each project, as shown in Table 1. Paraphrasing into English from the original Swedish, Trafikverket describes net present value in the following terms: The net present value ratio is used to assess the cost-effectiveness of a measure. A net present value ratio of 0.5 means that for every 100 kroner bet you get back this plus another 50 kroner in return, seen over the entire life of the project.
Economic Profitability Data Collated for Each Project
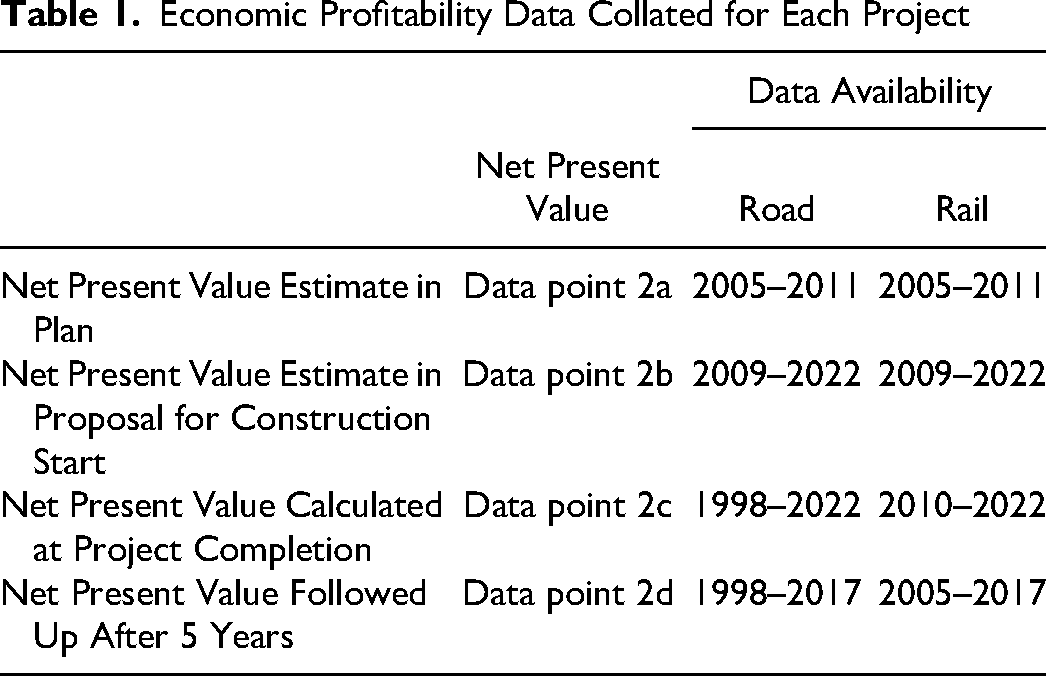
Estimates of economic profitability are made at two stages in the project life cycle: (1) at the planning stage and (2) at the construction start decision, as stated in the Swedish Transport Administration’s proposal for construction start. Evaluations of economic profitability are made at a further two points, (3) at project completion and (4) five years after project completion. These data points and the availability of data are summarized below.
Net present value data for road projects is fairly comprehensive, especially for ex-post evaluations. The ex-ante forecasts were amalgamated with the net present value estimate in plan used for years 2005–2008, and net present value estimate in proposal start used for years 2009–2022. Availability of net present value data for rail projects was much less complete. Ex-ante forecasts were amalgamated as per the road projects. Ex-post evaluations were also amalgamated and, where both data points were available, the follow up after five-year figure was used.
Evaluation of Project Delivery Cost Performance
For each project, two assessments of project delivery cost performance were made. First, cost overrun was calculated using the formula (Gao & Touran, 2020):
The second assessment was a simple calculation to determine whether there was a cost overrun or not by reviewing whether the outturn cost was greater than the planned cost, in other words:
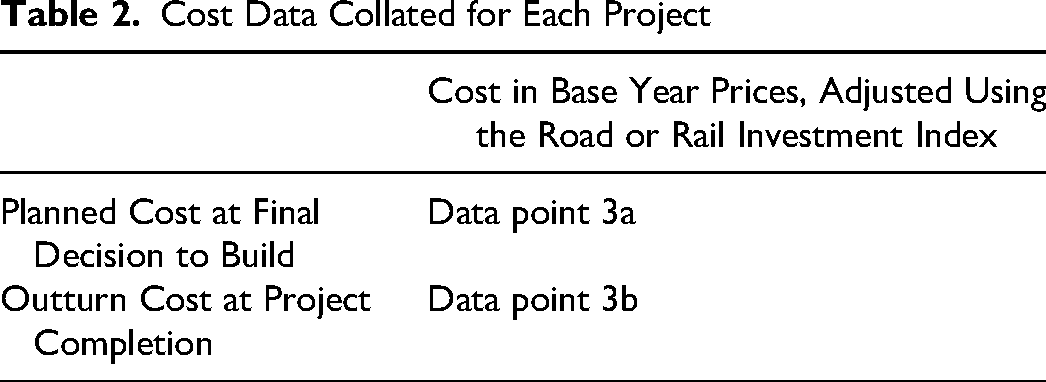
To determine project delivery performance, two cost data points were collated for each project, as shown in Table 2.
Cost Data Collated for Each Project
Swedish Project Delivery Performance
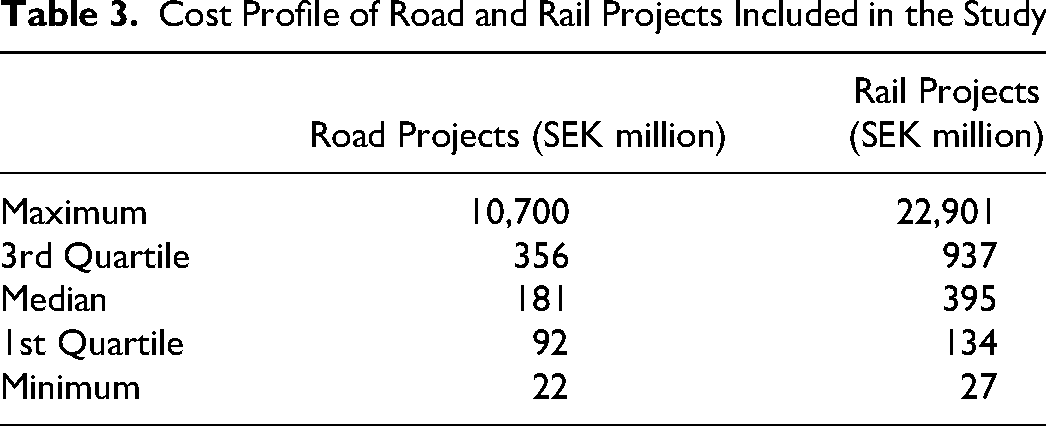
To provide some context, the outturn cost profile of the two project populations is shown in Table 3 below.
The cost profiles show that rail projects are typically more than twice the cost of road projects, SEK395 million versus SEK181 million and, while the majority of projects cost in the hundreds of millions of Swedish krona, both sets of projects include projects that cost in the multi billions of Swedish krona.
Cost Profile of Road and Rail Projects Included in the Study
Evaluations are presented below for the three performance criteria:
Benefits realization Economic profitability Project delivery cost performance
Benefits Realization Performance
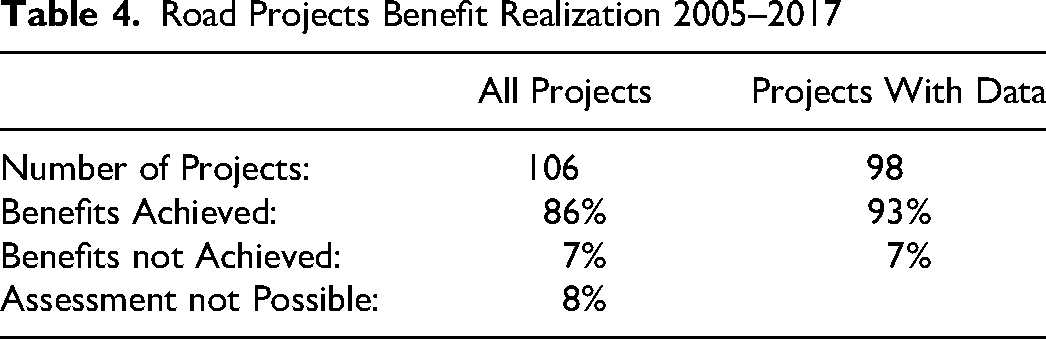
Trafikverket’s policy for ex-post evaluation of benefits is to report data from an assessment undertaken five years after project completion with data available for road and rail projects completed between 2005 and 2017. Ninety-three percent of road projects had benefit realization data available, whereas this data was available for only 53% of rail projects. Projects were reviewed to determine whether their intended benefits had been achieved and the result reported as a binary: yes or no. This information is summarized in Table 4 and Table 5.
Road Projects Benefit Realization 2005–2017
Rail Projects Benefit Realization 2005–2017
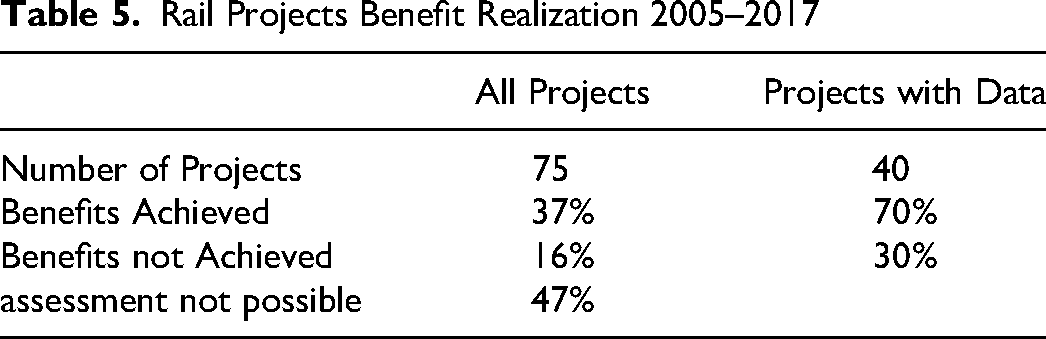
Summarizing the findings on benefits realization performance, where data is available, 93% of road projects and 70% of rail projects are assessed as having achieved their intended benefits.
Economic Profitability Performance
To be economically profitable a project requires both project effectiveness, in other words, delivers economically valuable outcomes and also project management effectiveness, in other words, the project is delivered at a viable cost. Trafikverket uses net present value as a measure of economic profitability, where a figure greater than zero indicates a net return and a measure of one indicates a return of 100% on the amount invested.
The decision to commission a project typically requires a project to exceed a hurdle rate (National Research Council, 1994) for returns on investment determined by the sponsor body, which in the public sector typically reflects opportunity cost rather than cost of capital (Zeckhauser et al., 1975). However, it remains possible for individual projects to be approved that have a lower or negative net present value on account of non-economic outcomes they aim to achieve, or it may be that approving individual projects takes into account overall net present value at a portfolio level. In the case of Swedish transport infrastructure project investments, the decision to proceed with construction of 19% of road projects was undertaken with a negative net present value, and 24% of rail projects also had a negative net present value at decision to proceed. The availability of data on the net present value of Swedish transport projects not only allows their economic profitability to be determined but as information is available ex ante and ex post this also allows the accuracy of net present value forecasts to be assessed.
Ex-Post Assessment of Road and Rail ProjectsS Economic Profitability
For road projects, an ex-post evaluation of net present value was undertaken three years after opening for projects completed from 1998 to 2004 then, from 2005 to 2017, the ex-post evaluation of net present value was undertaken five years after opening. For rail projects, information on ex-post evaluation of net present value is limited but was able to be assembled for 63% of projects by pooling evaluations undertaken either at the time of project completion or five years after completion. Summary information on ex-post assessment of road and rail projects economic profitability is presented in Figure 1 and Table 6.
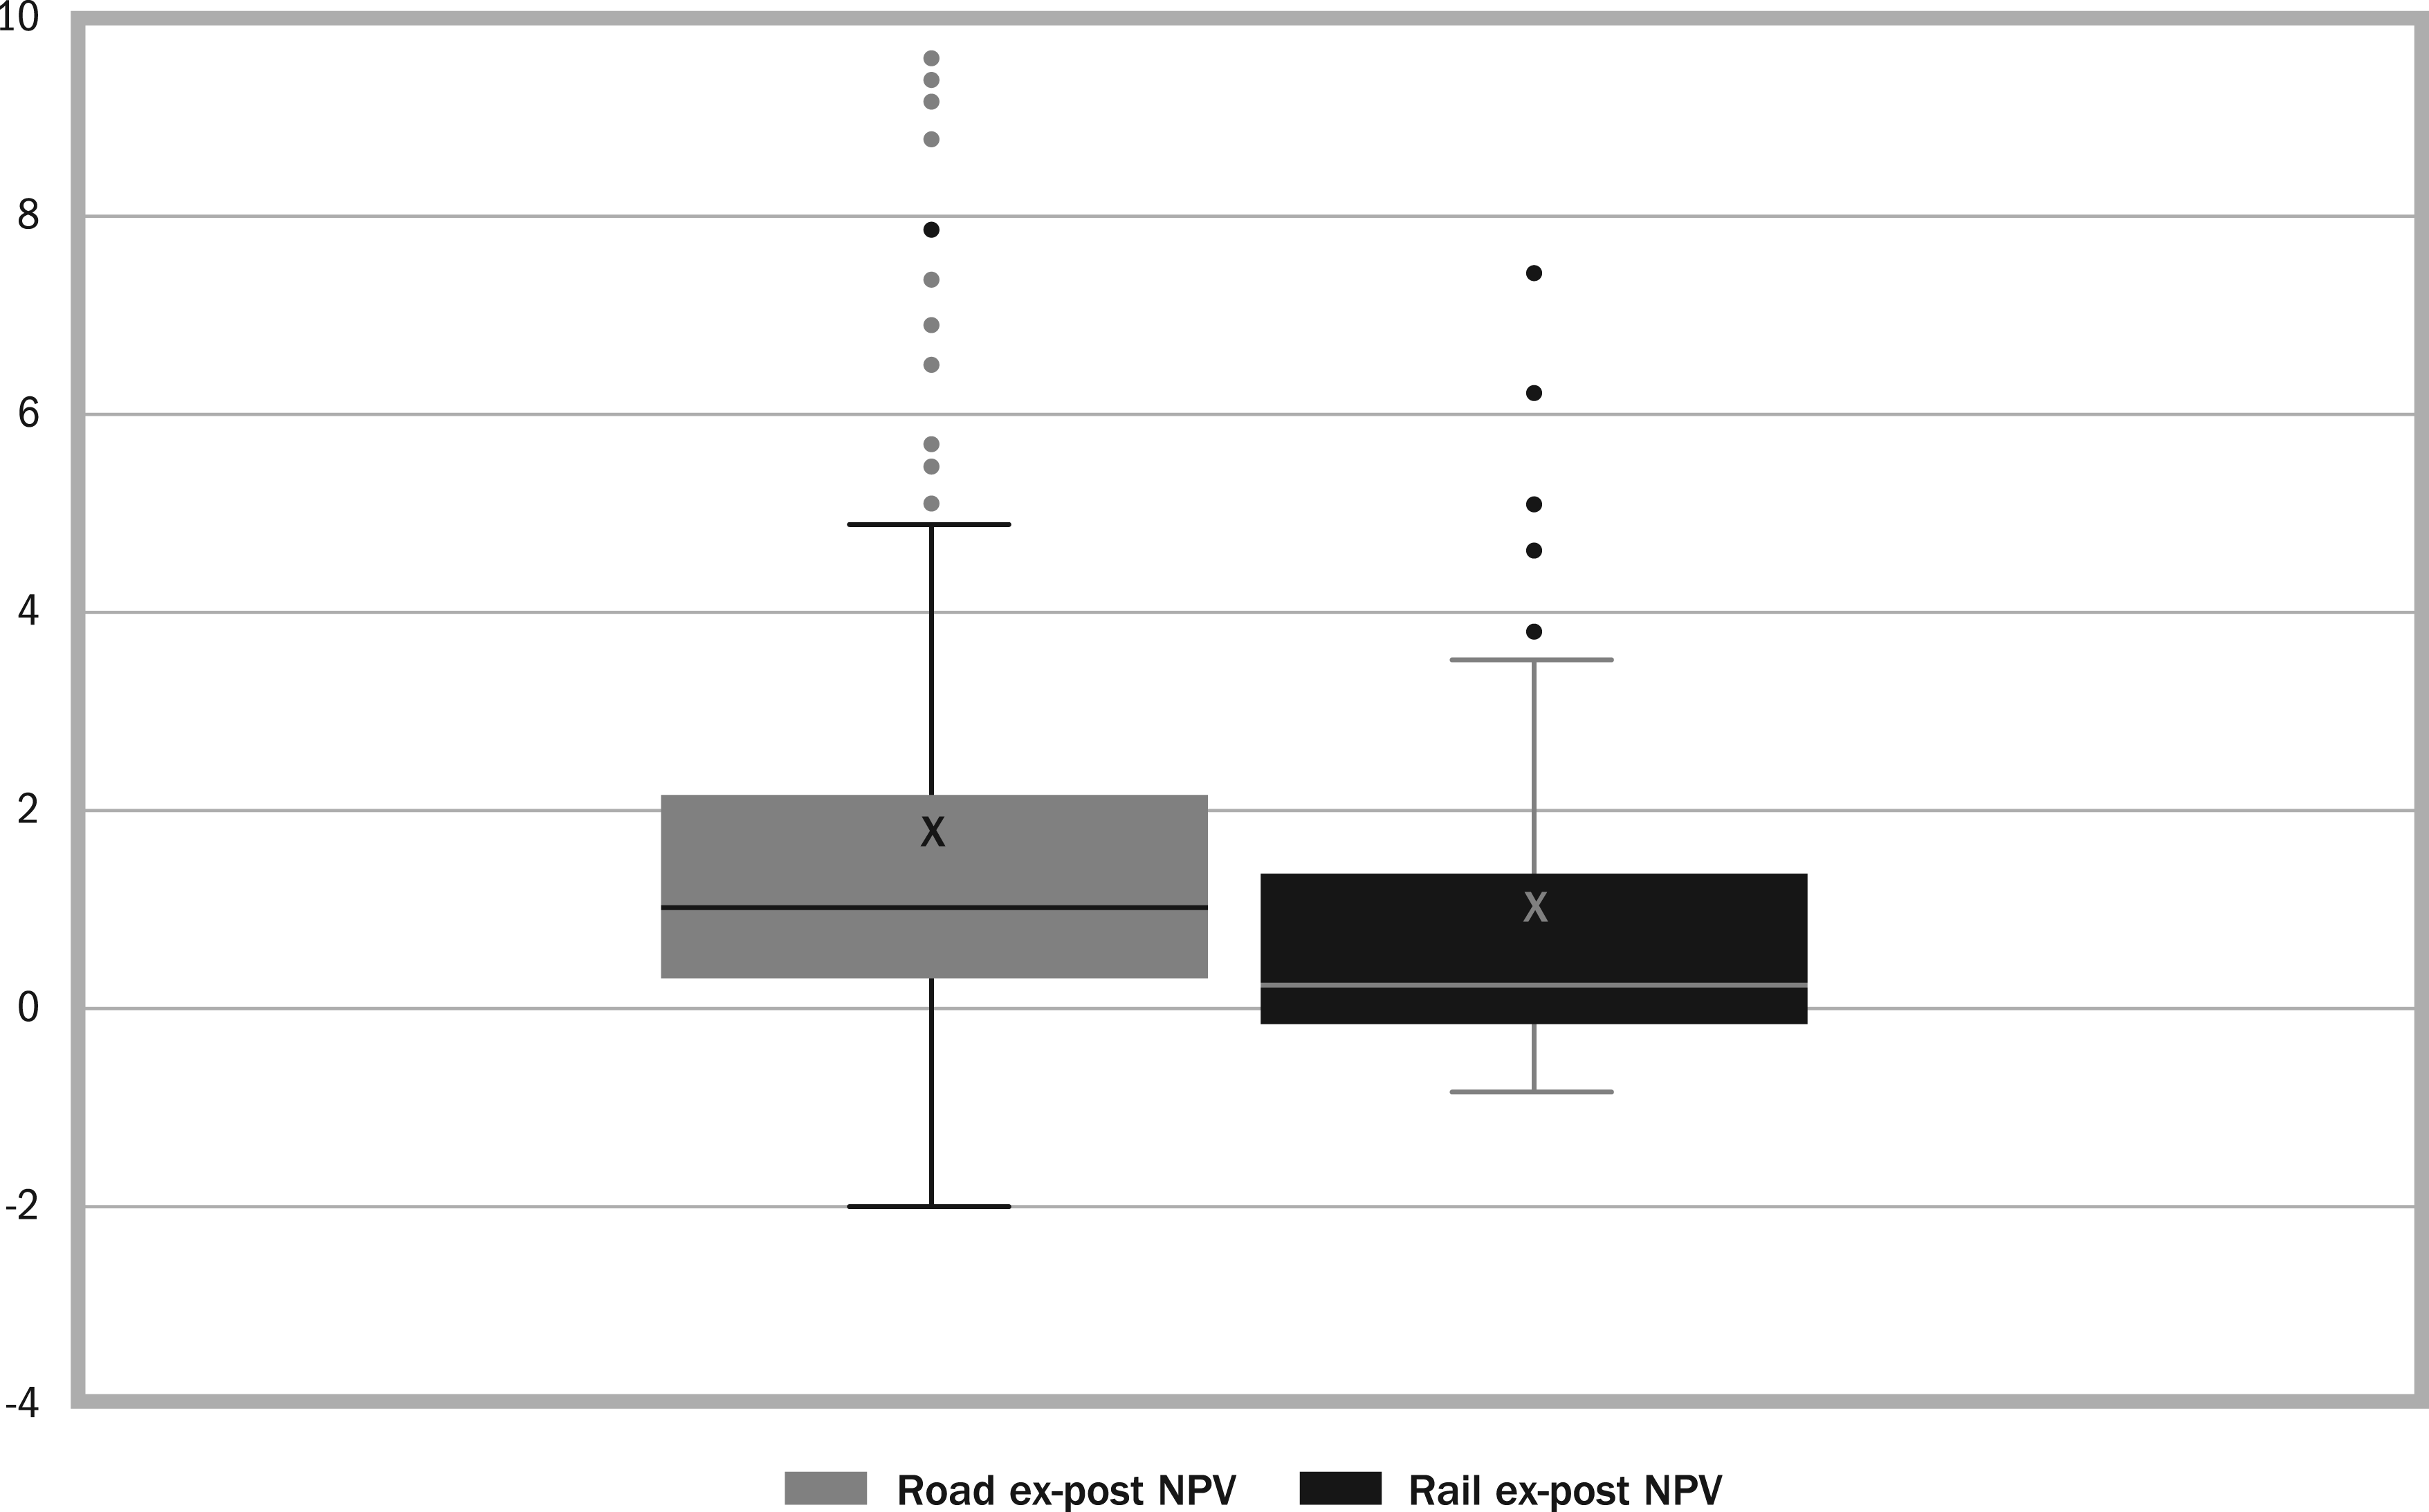
Economic profitability of Swedish road and rail projects.
Economic Profitability of Swedish Road and Rail Projects
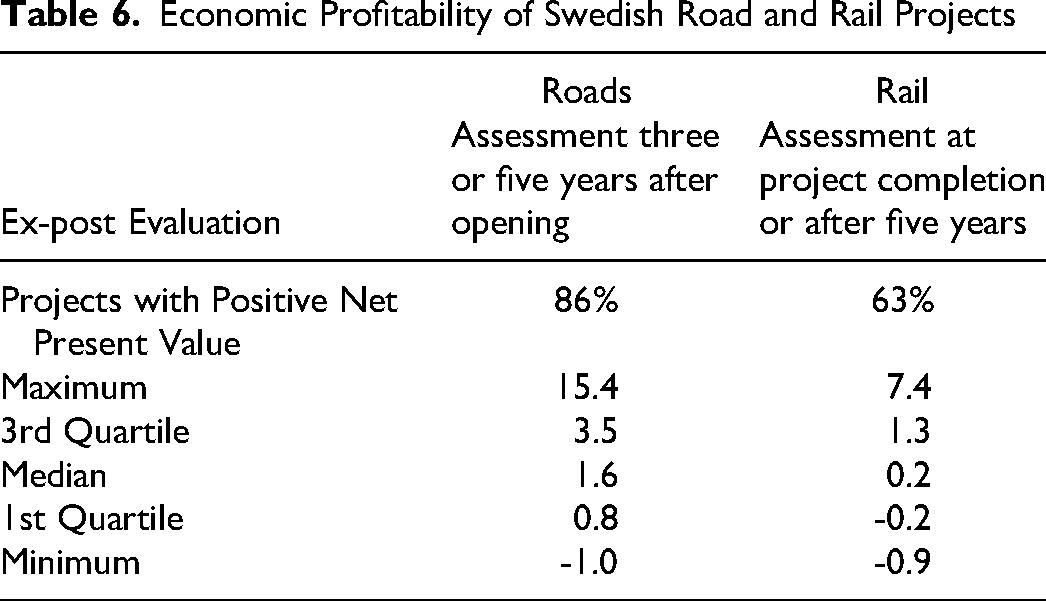
The data for ex-post evaluation of economic profitability shows that road projects typically have a net present value of 1.6, which means that for every SEK100 invested, projects typically return the SEK100 invested plus a further SEK160. The proportion of projects with a positive net present value is 86%, which means that a sizable majority of road projects are economically profitable. After 2005, data on net present value estimates is available. This is useful as it allows five years after performance assessment data to be compared against the estimate. Taking into account those projects approved with negative net present value estimates, 95% of road projects were found to have either positive economic profitability outcomes, or a negative net present value that was the same or greater than the estimate at approval.
Analysis of the net present value data shows that 63% of rail projects are economically profitable and, overall, these projects typically achieve a positive net present value of 0.2. Eighty percent of rail projects were found to have either positive economic profitability outcomes or a negative value that was the same or greater than the estimate.
Project Delivery Cost Performance
Ex-post evaluation was conducted separately on the road projects and the rail projects using costs in base year prices, adjusted using the road or rail investment index, so specifically:
Data point 3a: Planned cost at final decision to build Data point 3b: Outturn cost at project completion
Data for 201 completed road projects was available. Estimated cost was missing for 27 projects, and the eight projects completed in 2006 were excluded. Data for 67 completed rail projects was available. Twenty-six projects delivered during this period were missing data on their estimated cost and could not be included in this analysis, and the four projects completed in 2006 were excluded.
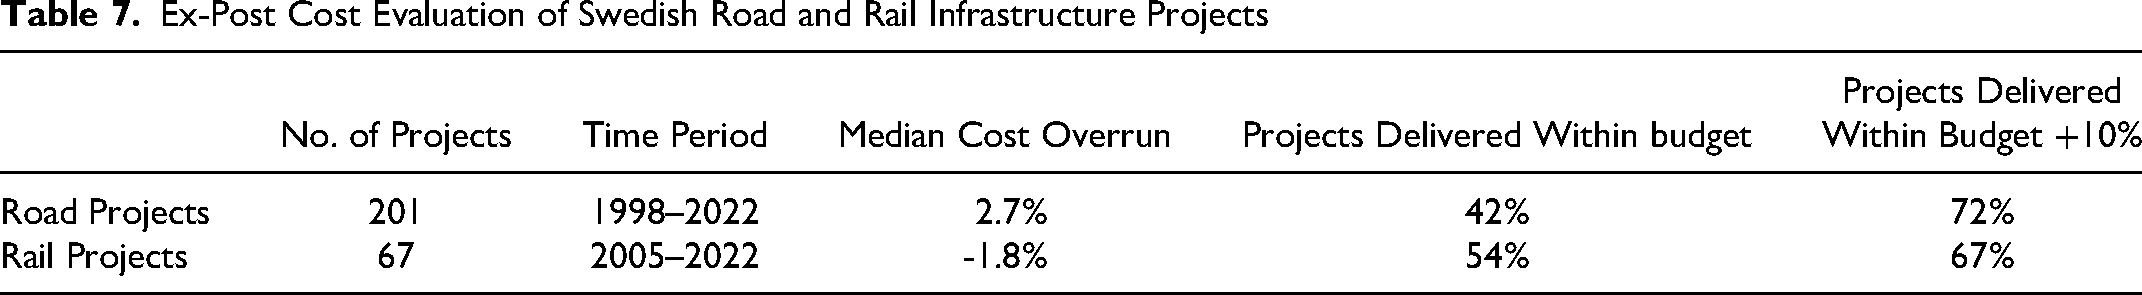
Comparing outturn cost against estimated cost for individual projects and compiling this data allowed overall project delivery cost performance for the populations to be determined, and in particular: (1) median cost overrun, (2) proportion of projects delivered within budget, and (3) proportion of projects delivered within +10% of their budget. The summary findings are presented in Table 7.
Ex-Post Cost Evaluation of Swedish Road and Rail Infrastructure Projects
Road Project Delivery Cost Performance
Figure 2 shows the distribution of cost overrun for the 201 road projects delivered in Sweden between 1998 and 2022.
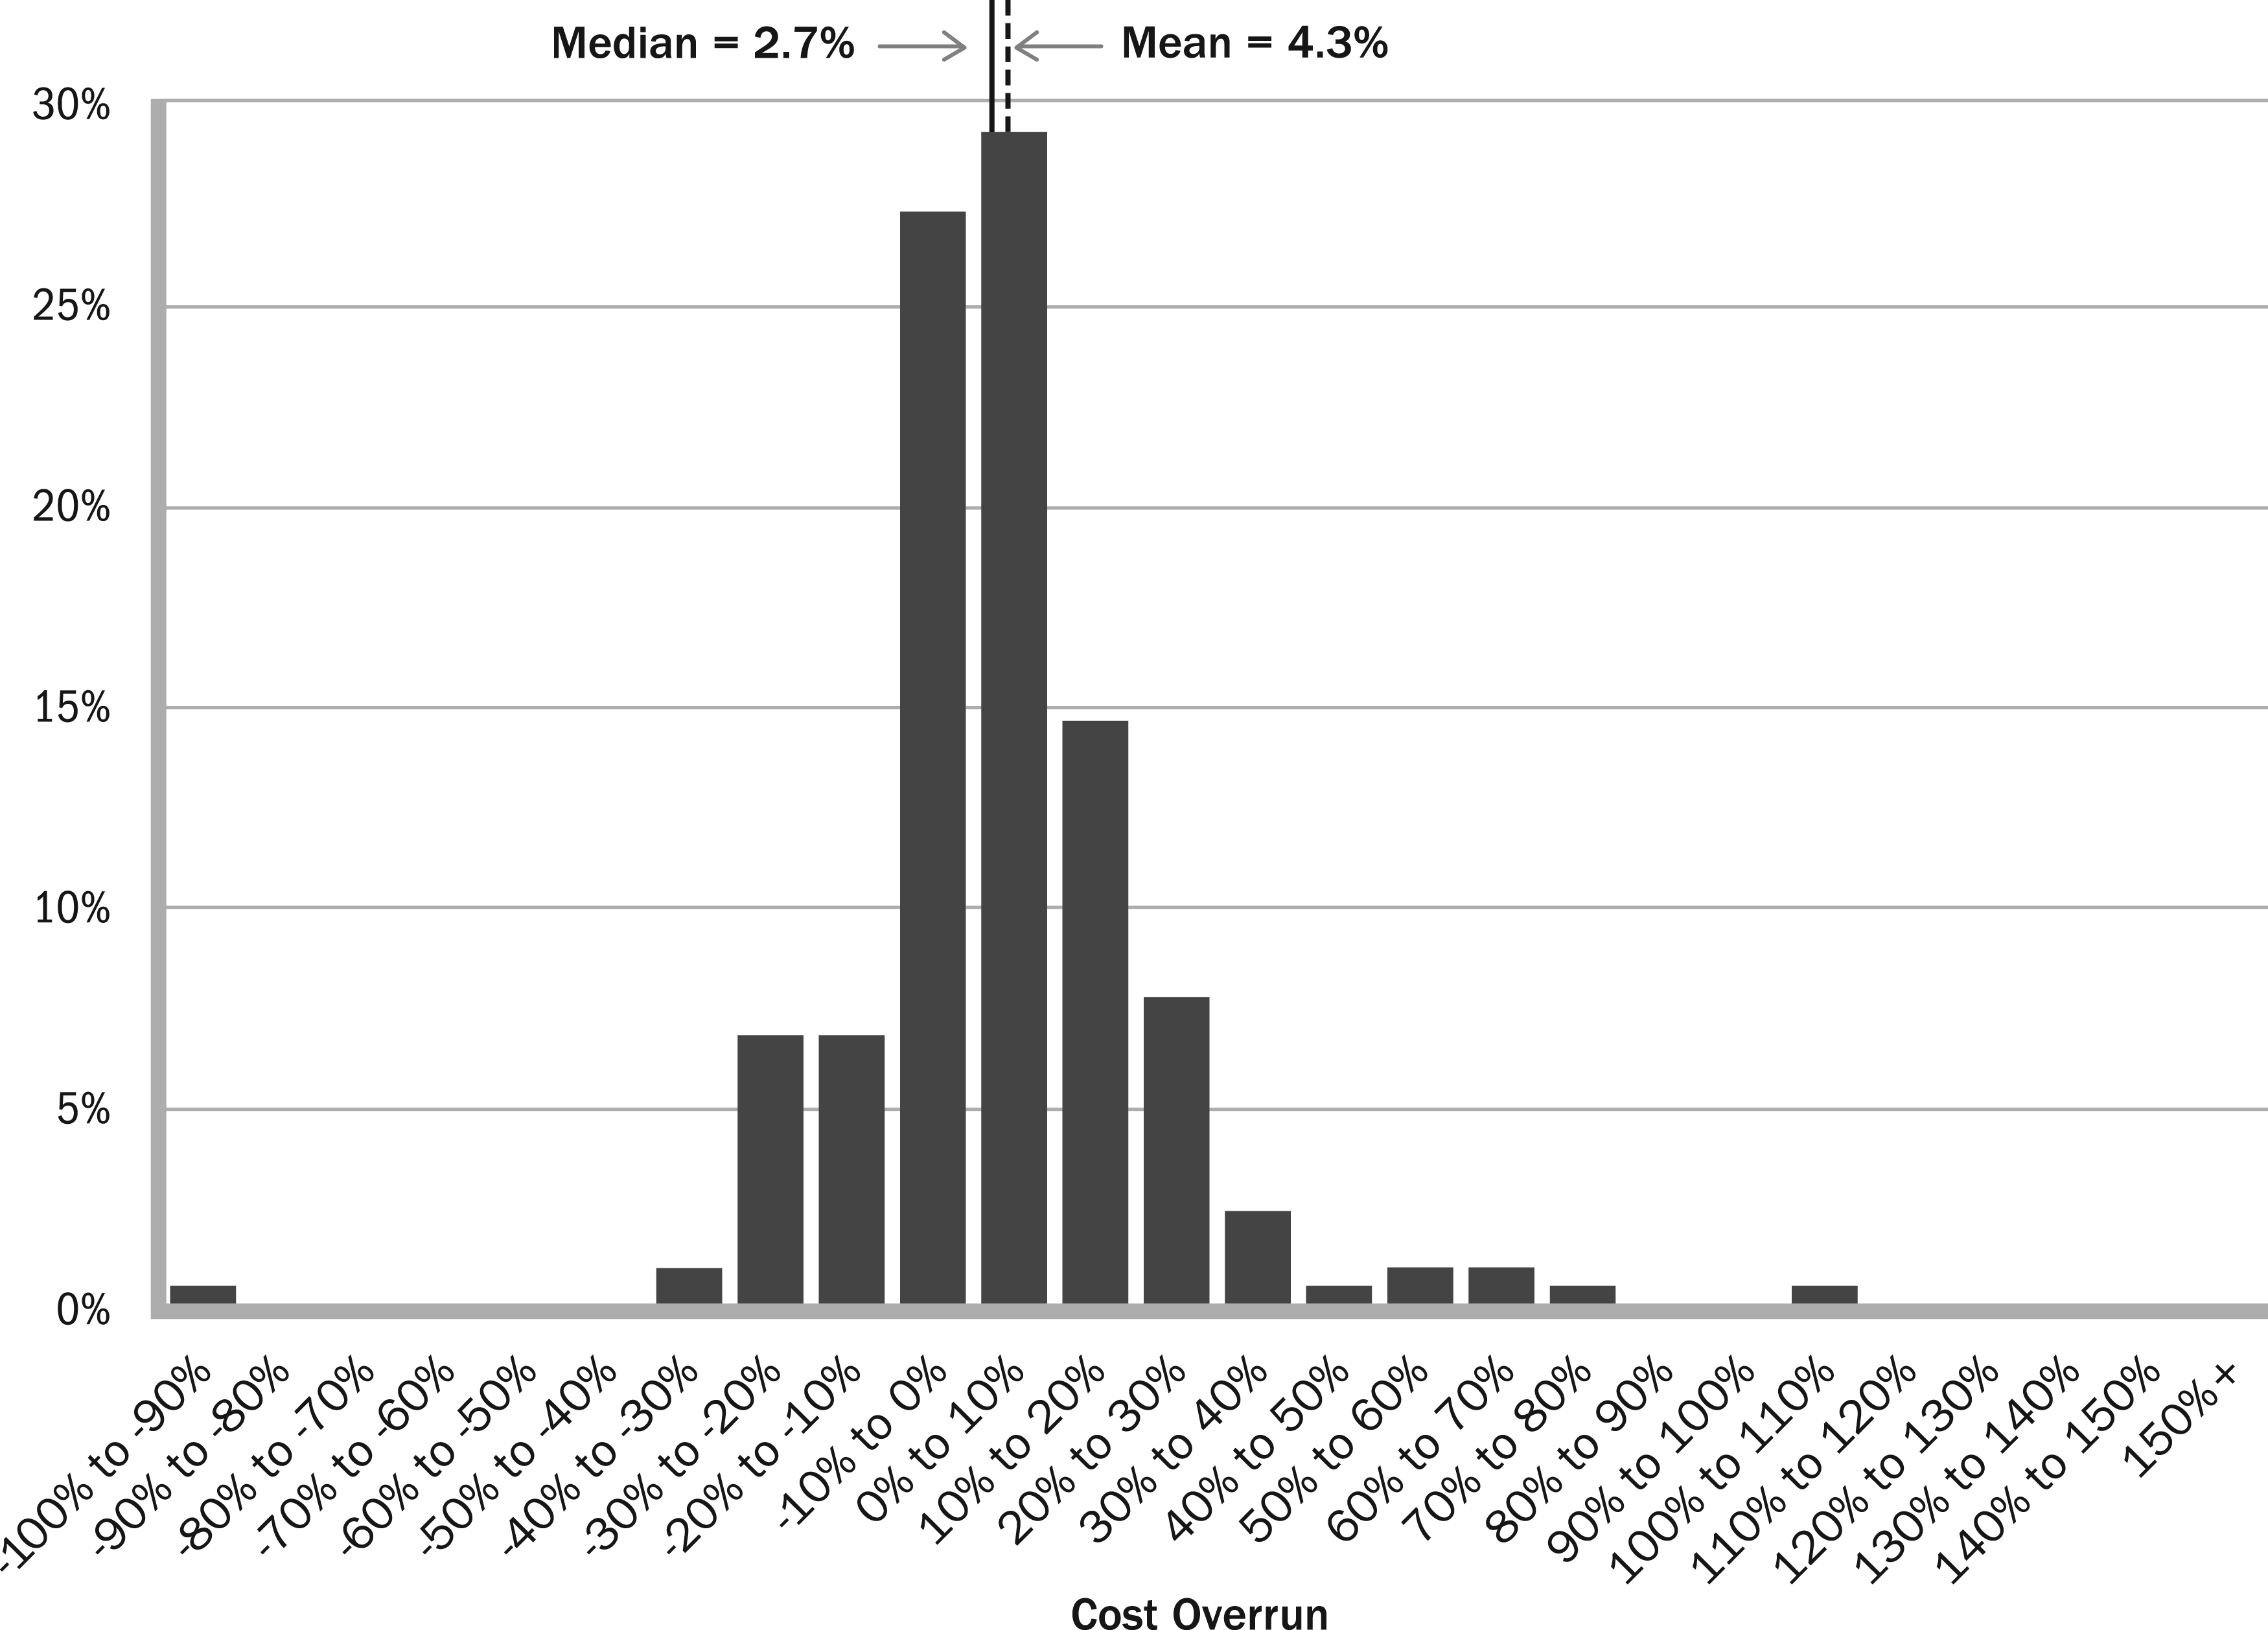
Distribution of Swedish road infrastructure projects cost overrun between 1998 and 2022 (n = 201).
Broadly speaking, this profile shows a distribution approximating to a normal distribution centered a few percentage points above zero, with a typical cost overrun of 2.7%. Forty-two percent of these projects were delivered on or under the budget assigned at the time of decision to proceed with construction. Taking the common industry perspective, 72% of projects were delivered on or within +10% of their budgets.
Rail Project Delivery Cost Performance
Figure 3 shows the cost overrun distribution for 67 rail projects delivered in Sweden between 2005 and 2022.
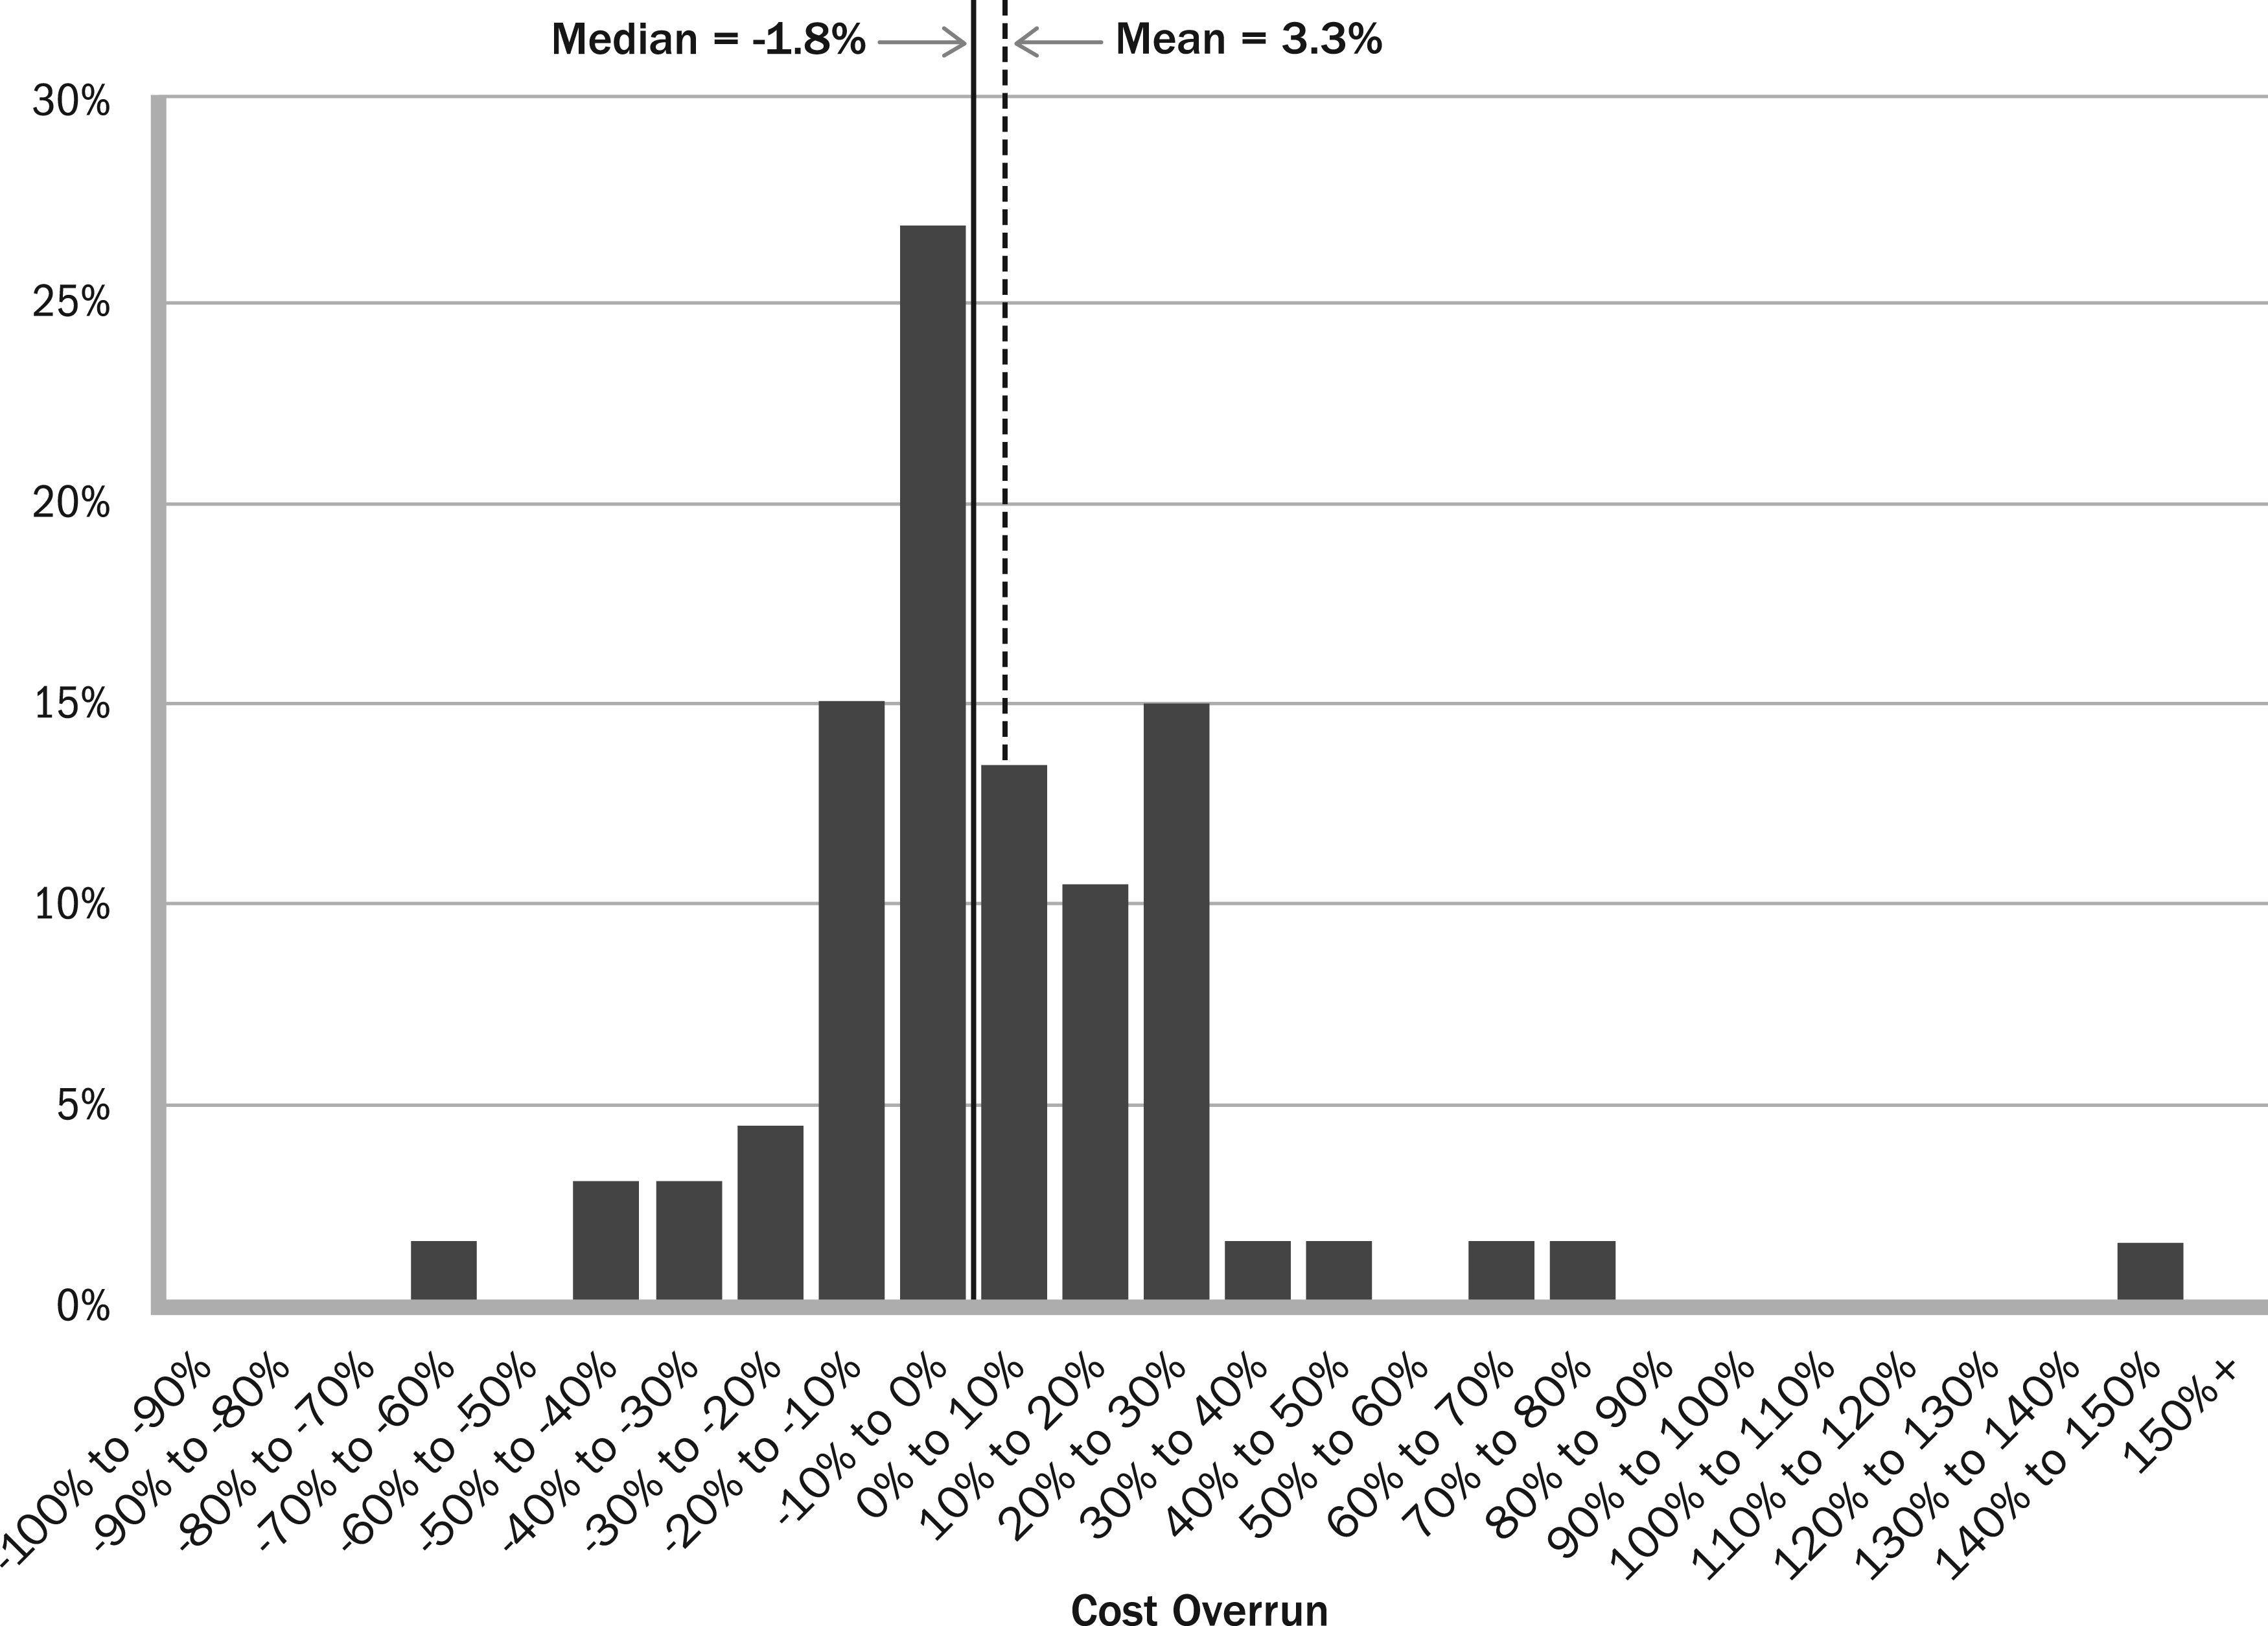
Distribution of Swedish rail infrastructure projects cost overrun between 2005 and 2022 (n = 67).
This distribution of outturn cost performance results approximates to a normal distribution but lacks the usual symmetry. Notwithstanding, a notable feature is rail projects were typically delivered for -1.8% below their budget. Overall, 54% of these projects were delivered on or below budget cost, and 67% of projects were delivered for a cost less than or equal to their budget +10%.
Analysis of Cost Performance
The size and duration of the two sets of data allow cost performance temporal and scale characteristics and trends to be examined, specifically:
Is cost overrun changing over time? Do higher cost projects risk greater cost overrun?
Is Cost Overrun Changing Over Time?
Data for road and rail projects cost overrun over time is shown in Figure 4 and Figure 5.
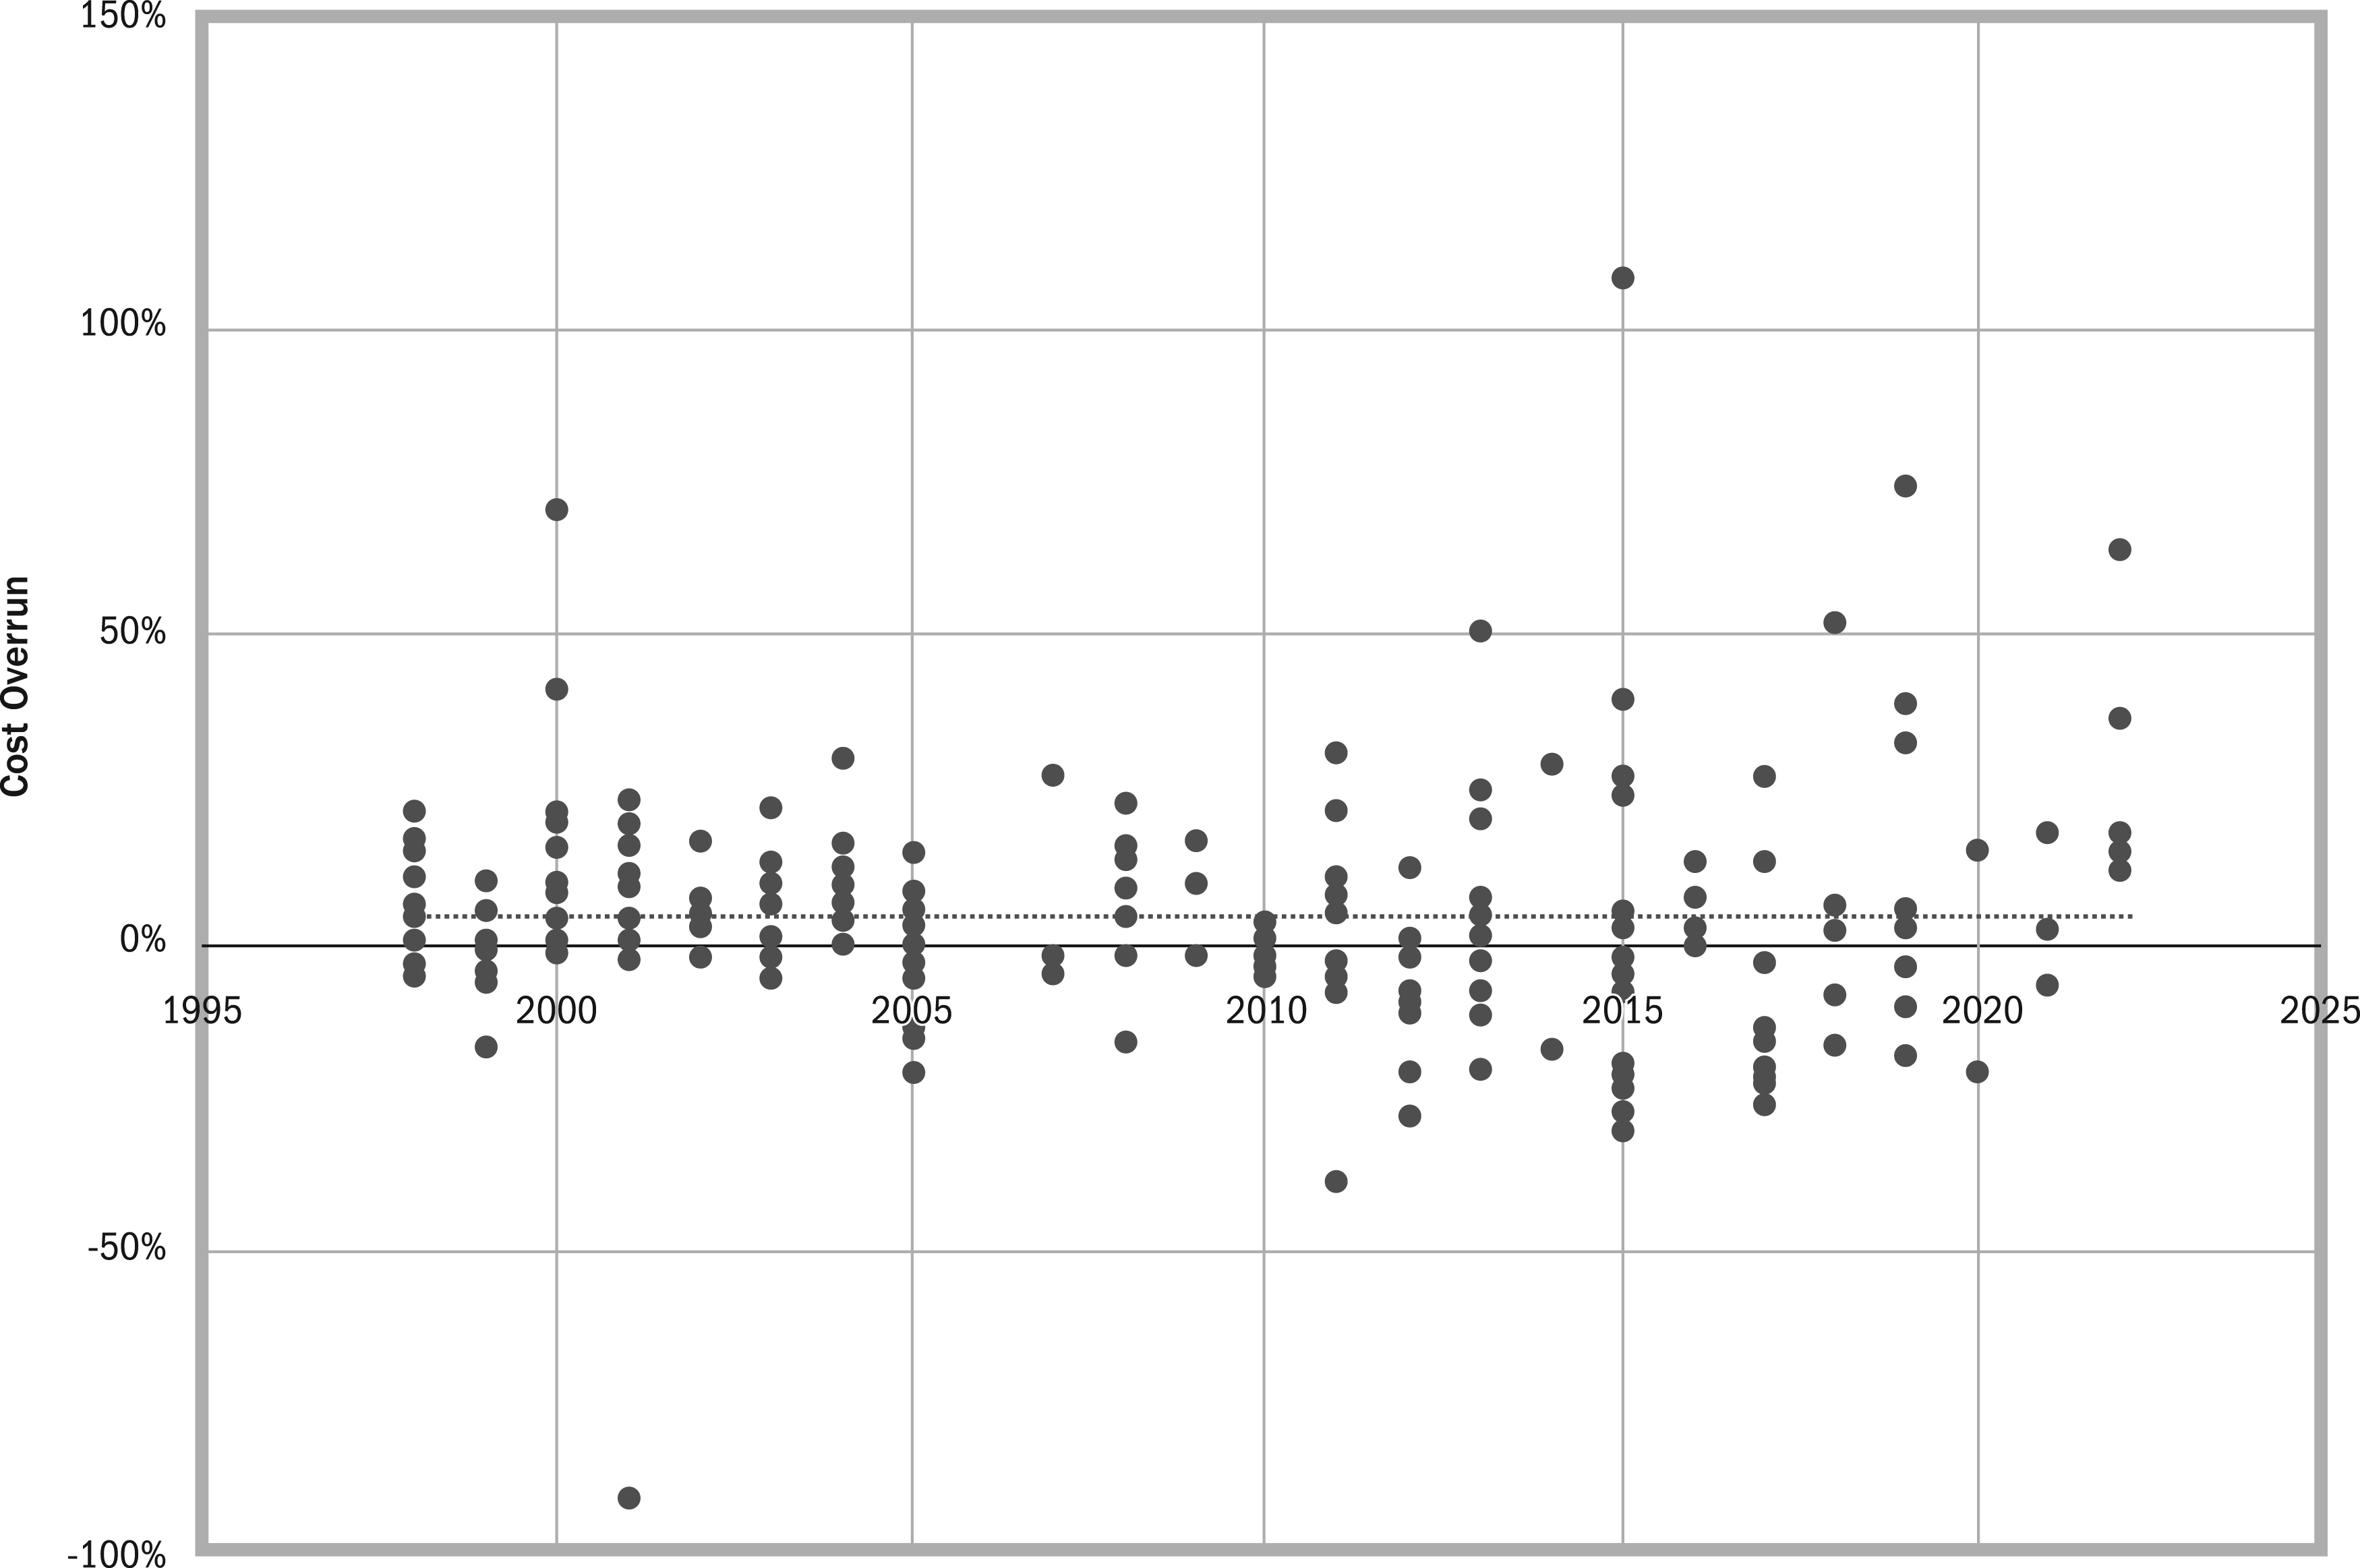
Swedish road projects cost overrun between 1998 and 2022 (n = 201).
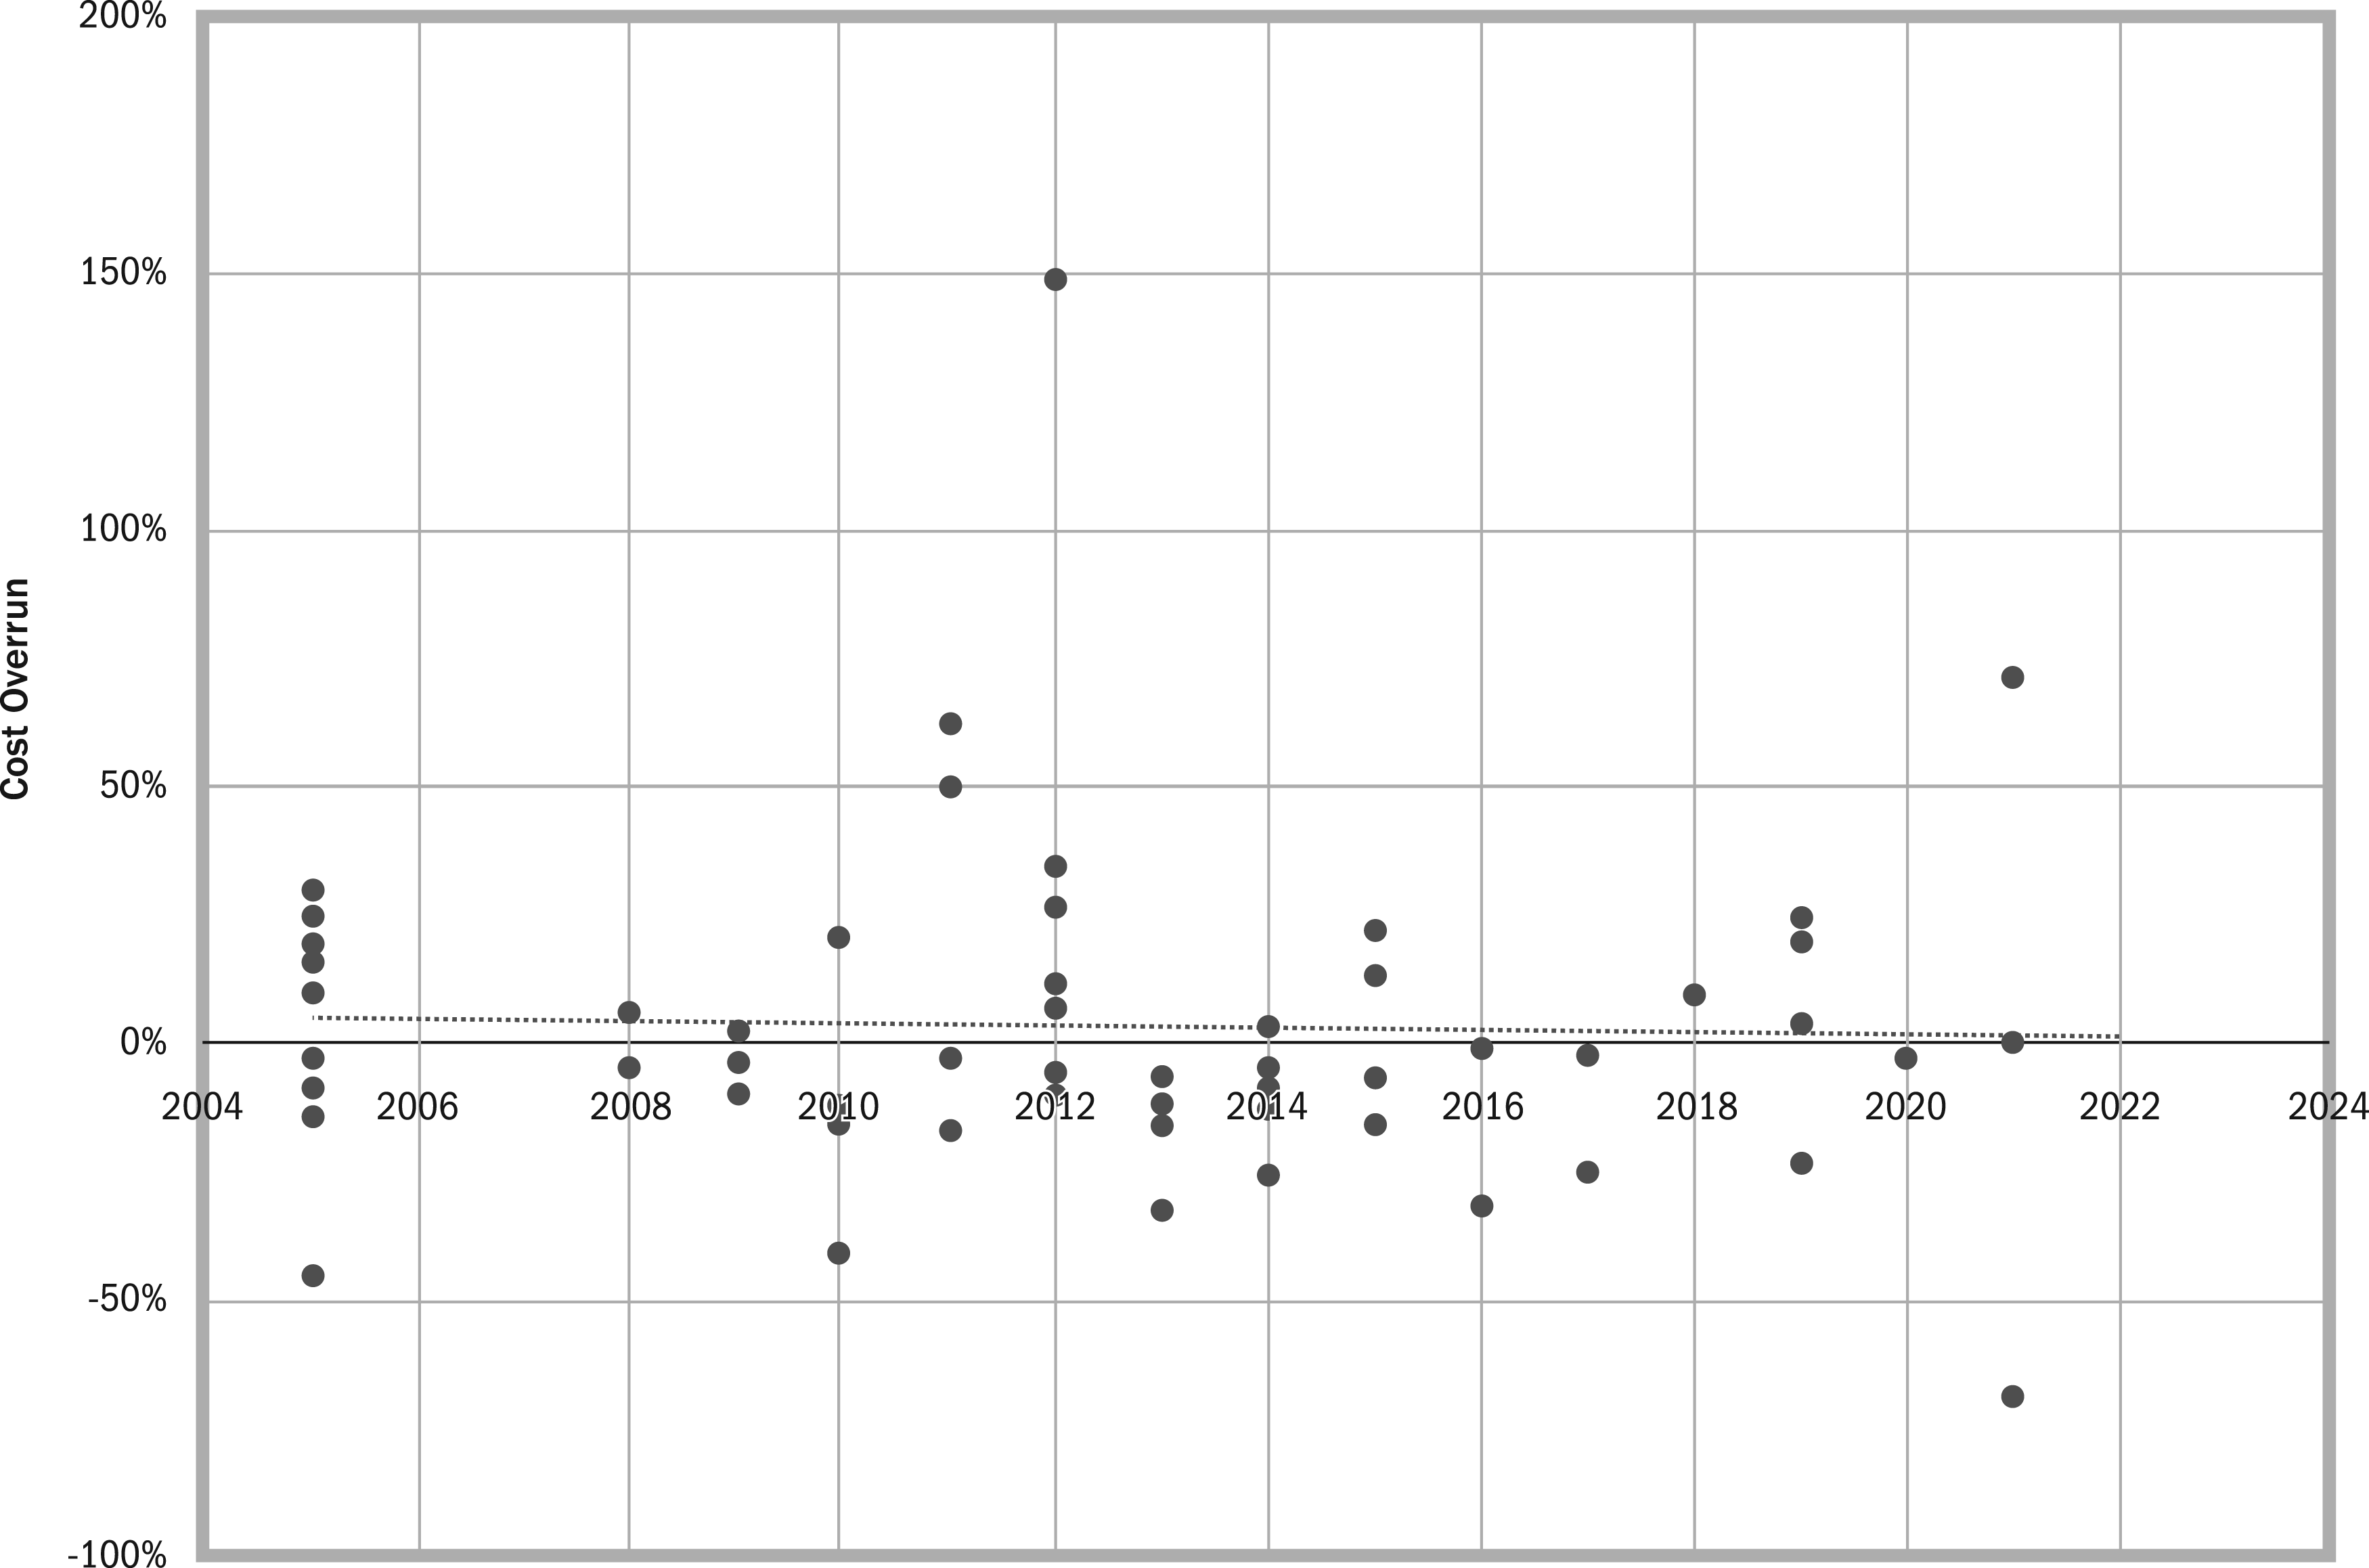
Swedish rail projects cost overrun between 2005 and 2022 (n = 67).
Considering cost performance over time shows both populations present a range of variability, but the trend is fairly consistent. For road projects the performance trend is flat, whereas for rail projects there appears to be a slight negative trend. This evidence suggests that typical cost overrun has not changed over time, remaining a few percentage points adjacent to zero.
Do Higher Cost Projects Risk Greater Cost Overrun?
Data for road and rail projects cost overrun against outturn cost is shown in Figure 6 and Figure 7. Both populations have a few high-cost projects while the majority cost less than SEK1 billion, so the figures show the full population in the top right and a pop out, magnified view of projects up to SEK2 billion (road) or SEK3 billion (rail) in the bottom left.
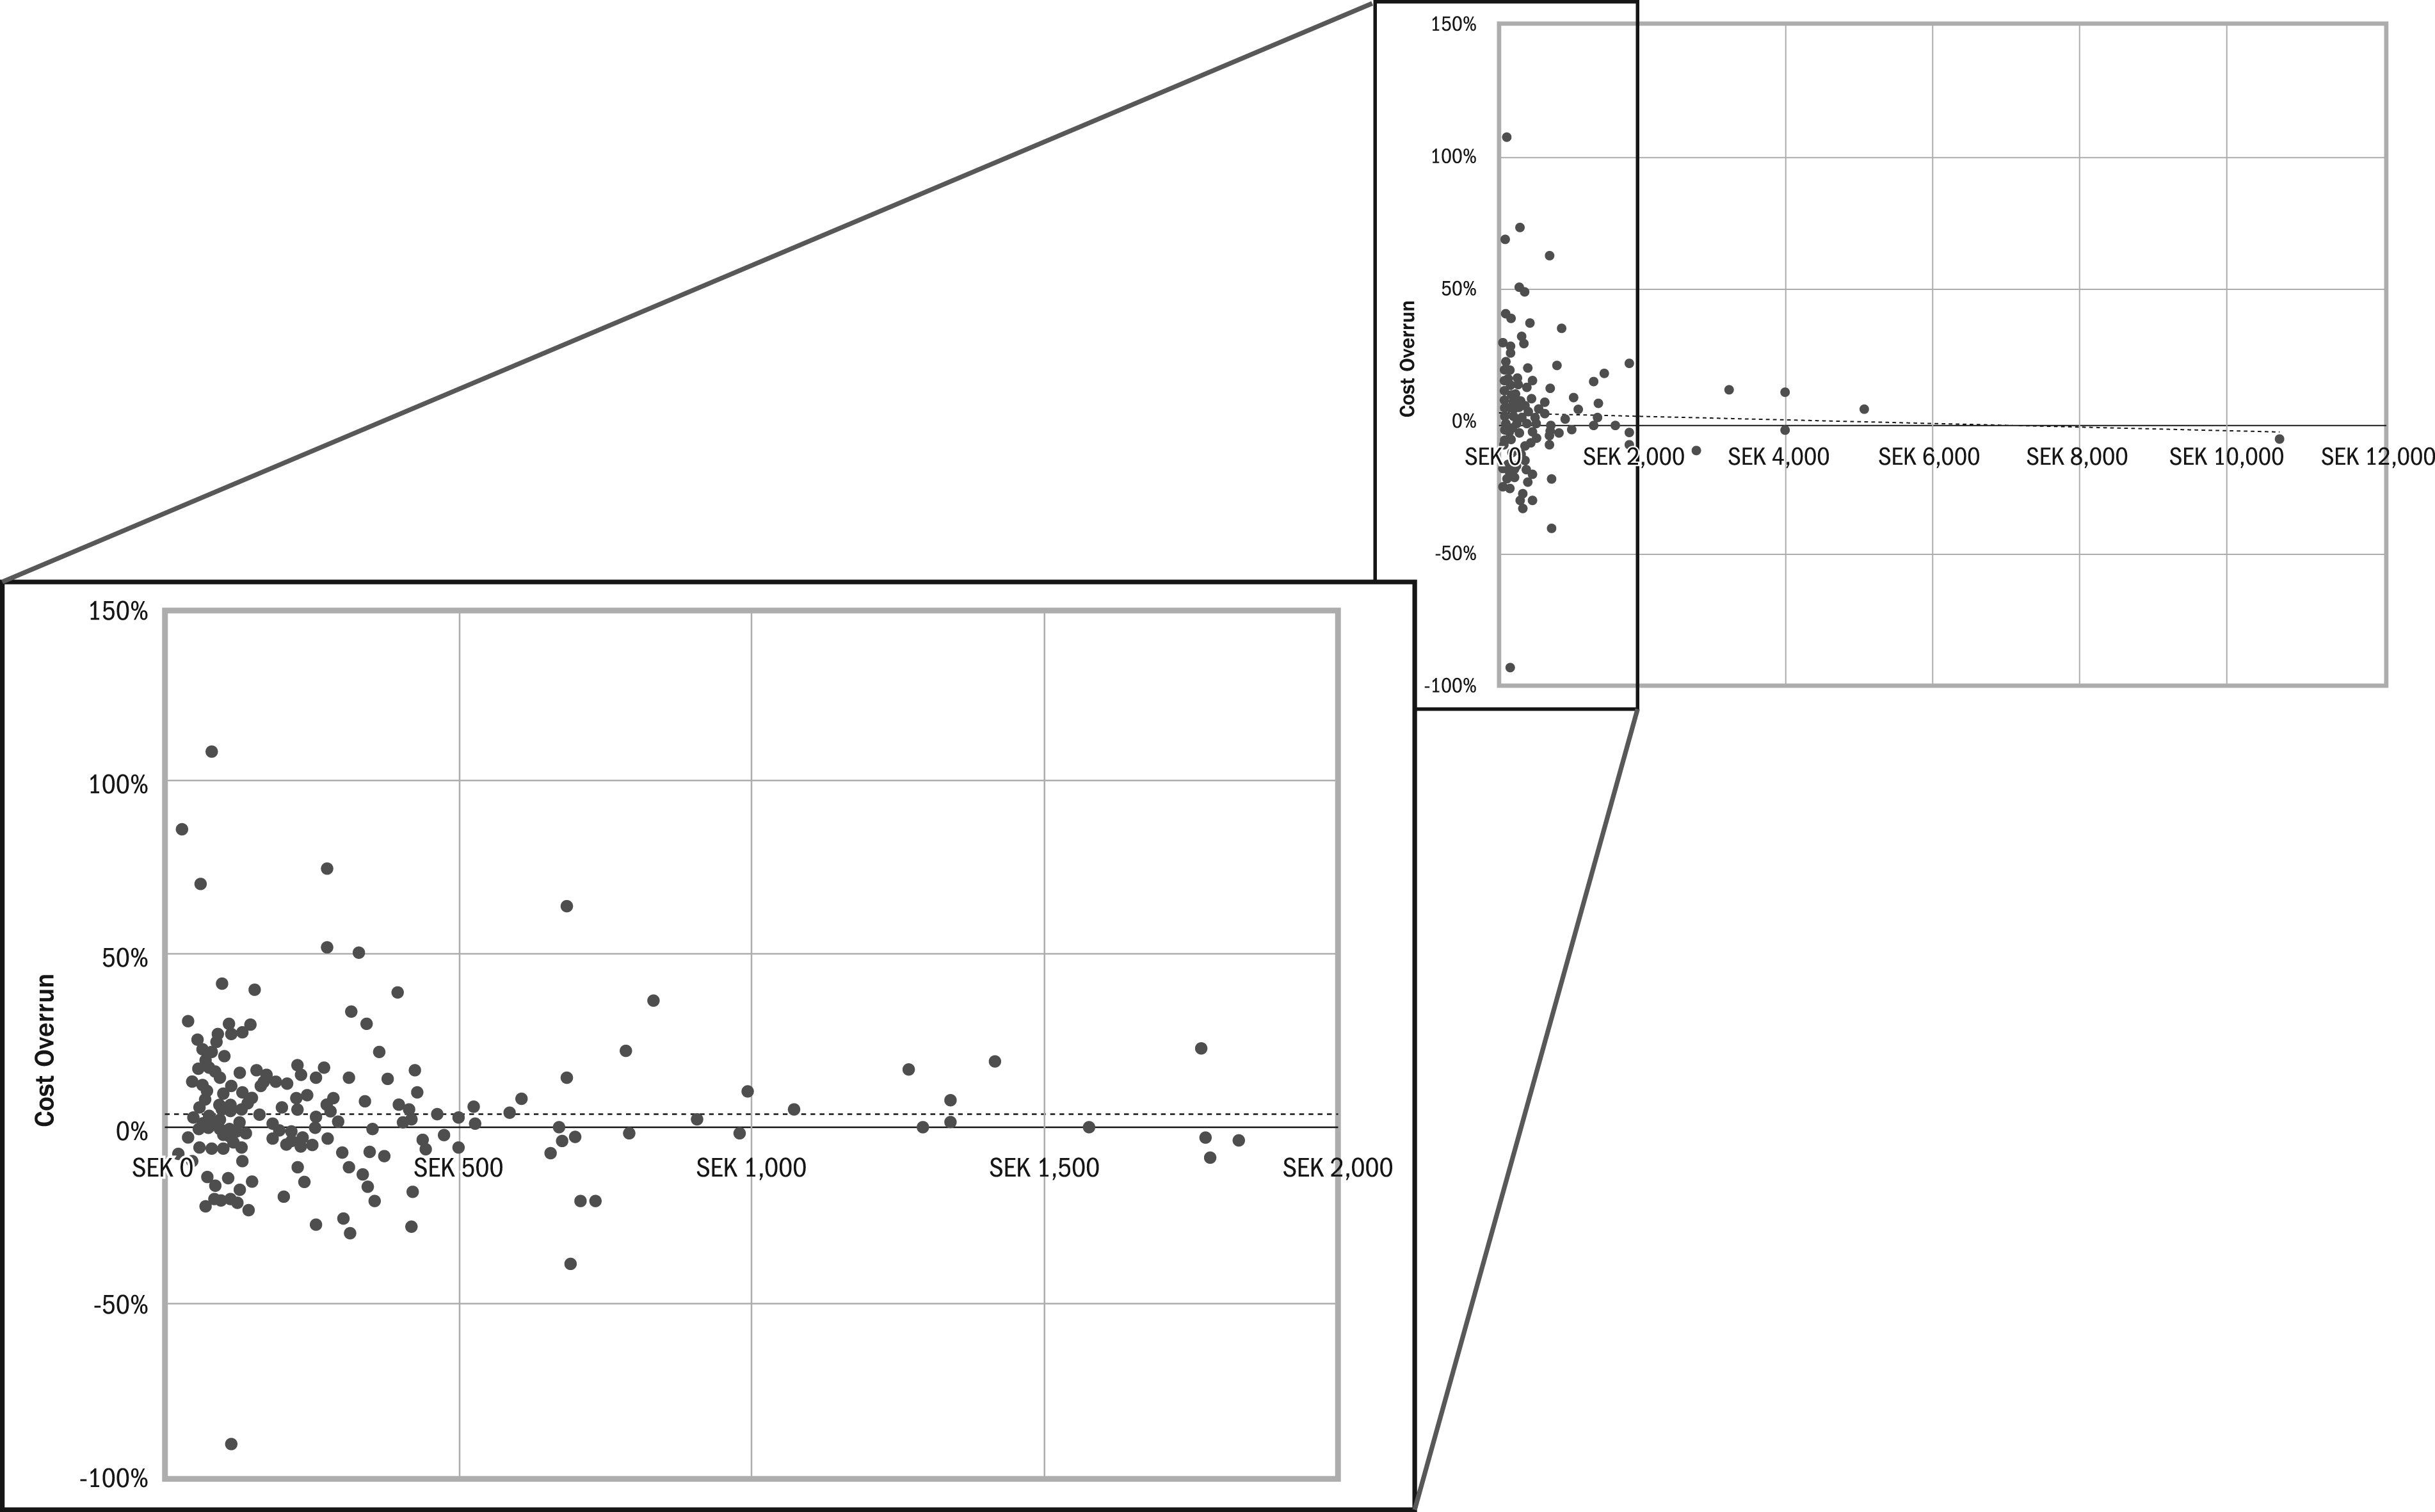
Swedish road projects cost overrun by outturn cost.
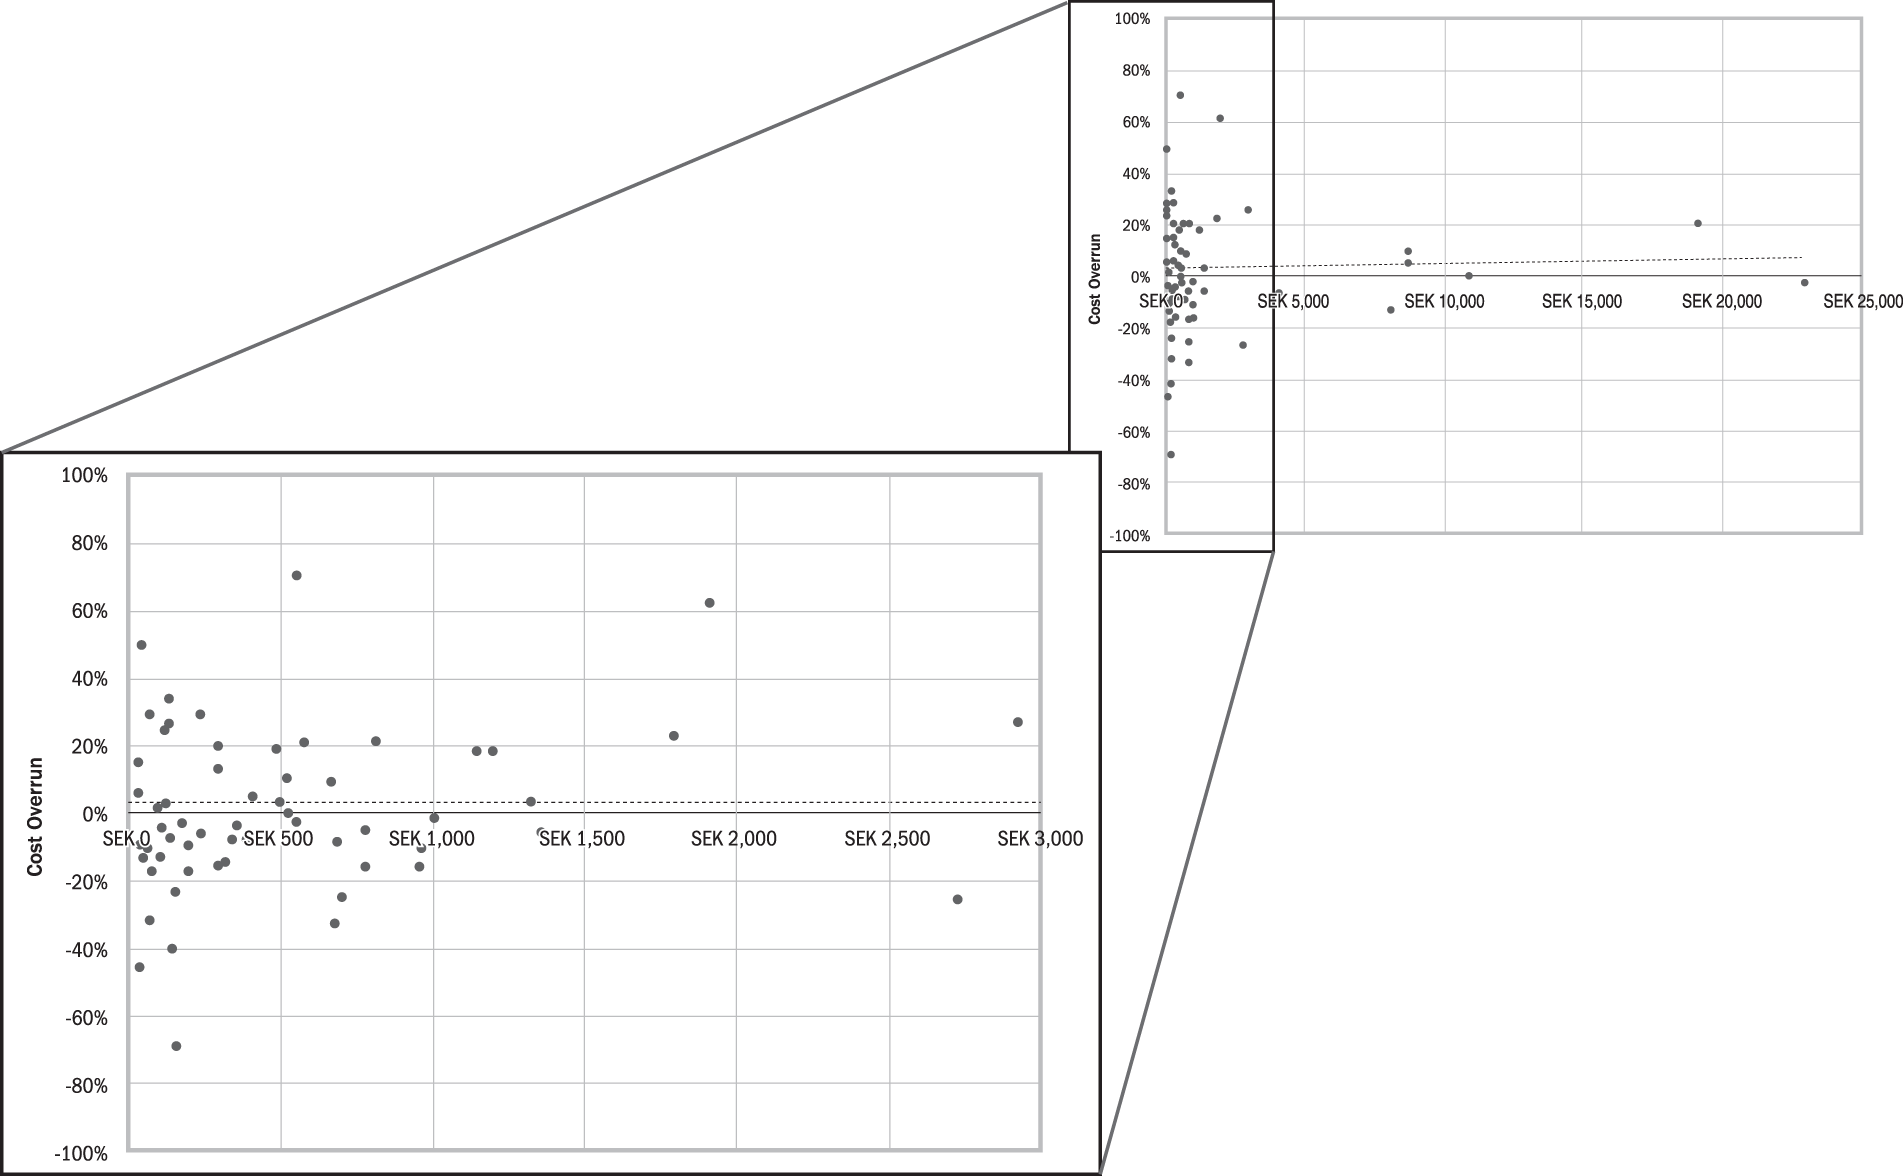
Swedish rail projects cost overrun by outturn cost.
Both populations show that cost overrun is fairly consistent by outturn cost, which means that higher cost projects are not at greater risk of cost overrun.
Analysis
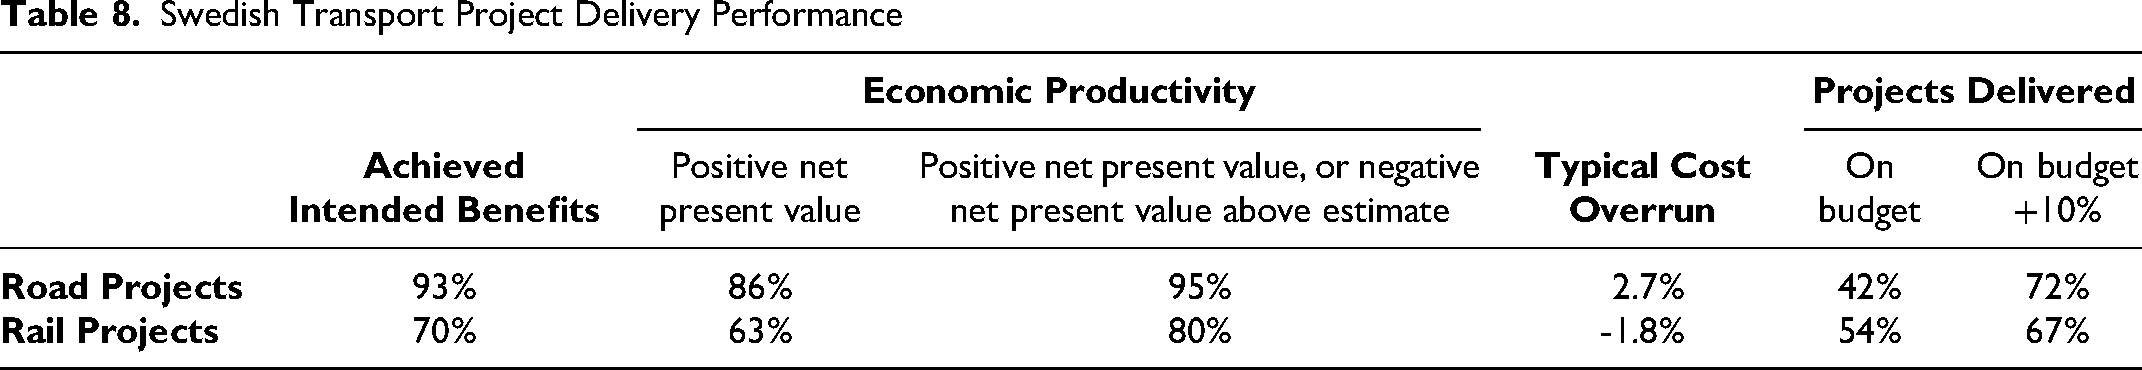
Data on the project delivery performance of Swedish transport projects is assembled and summarized in Table 8.
Assembling and summarizing the data on project delivery performance provides evidence that runs contrary to the popular narrative that projects fail to achieve their intended benefits, are not economically productive, and are delivered over budget. Instead, the data on performance of Swedish transportation projects shows they mostly achieve their intended benefits, they prove to be economically productive investments, and individually are typically delivered under, on, or close to budget while, collectively, the additional cost of projects that are over budget is compensated for by the lower cost of those delivered under budget.
Swedish Transport Project Delivery Performance
Project Delivery Performance Against Combinations of Multiple Criteria
Interesting though they are, individual performance measures provide a narrow view, and a richer sense of project delivery performance can be achieved through considering multiple criteria. While the available information from the two populations of Swedish transport projects is not comprehensive, it is sufficient to allow some performance criteria combinations to be examined, including:
What proportion of projects are economically productive and delivered in line with their budget? What proportion of projects achieve their intended benefits and are economically productive and delivered in line with their budget? What proportion of projects achieve their intended benefits and are economically productive?
Economic Productivity and Delivery to Budget
Table 9 presents results from combining measures of economic productivity and delivery to budget. Economic productivity is measured in terms of net present value. For road projects there was good availability of data from ex-post assessments of net present value undertaken three or five years after project completion. For rail projects ex-post net present value assessment used data from the assessment five years after project completion or, if that was not available, then the data from the assessment made at project completion was used. Delivery to budget is measured as the difference between cost estimate made at final decision to undertake the project and the outturn cost and considered in terms of (1) delivery on or under budget and (2) delivery on or under budget plus 10%.
Data on Economic Productivity and Delivery to Budget
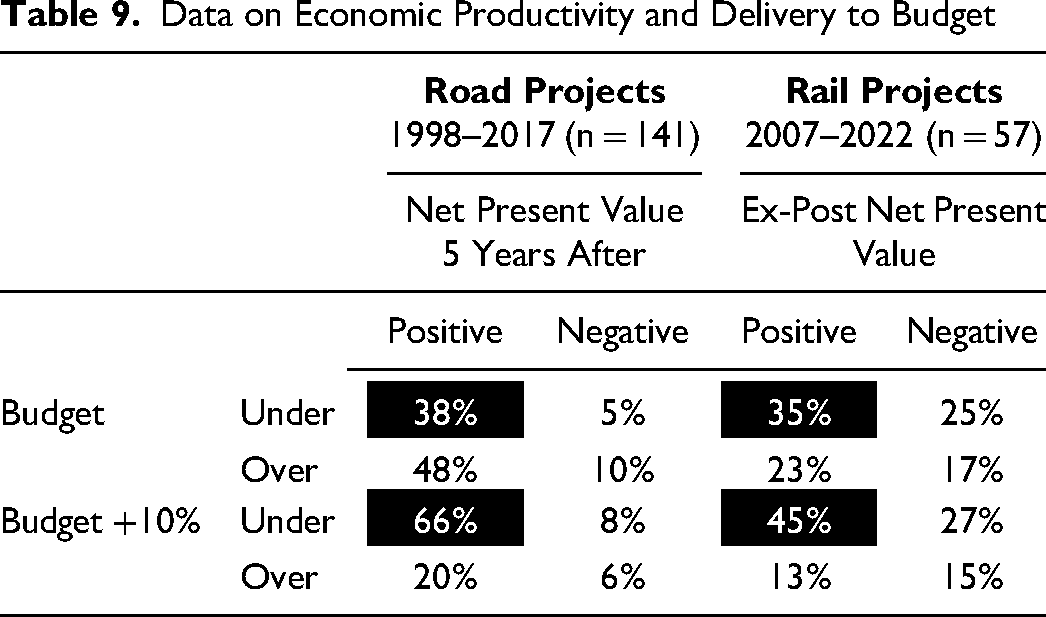
Combining data on economic productivity and delivery to budget shows that 38% of road projects are delivered on or under budget and are economically productive, which rises to 66% when assessed against budget +10%. For rail projects, 35% were delivered on or under budget and are economically productive and 45% are delivered on or under their budget +10% and are economically productive.
Benefit Achievement and Economic Productivity and Delivery to Budget
Data against all three criteria was not available for all projects, which puts some constraints on the analysis. That said, 75% of road projects had this data, which gives a degree of integrity to the findings. Less than one-third of the rail projects had this data available, which means the results need to be viewed with less certainty. The results from this combination of performance measures are shown in Table 10.
Data on Benefits Achievement and Economic Productivity and Delivery to Budget
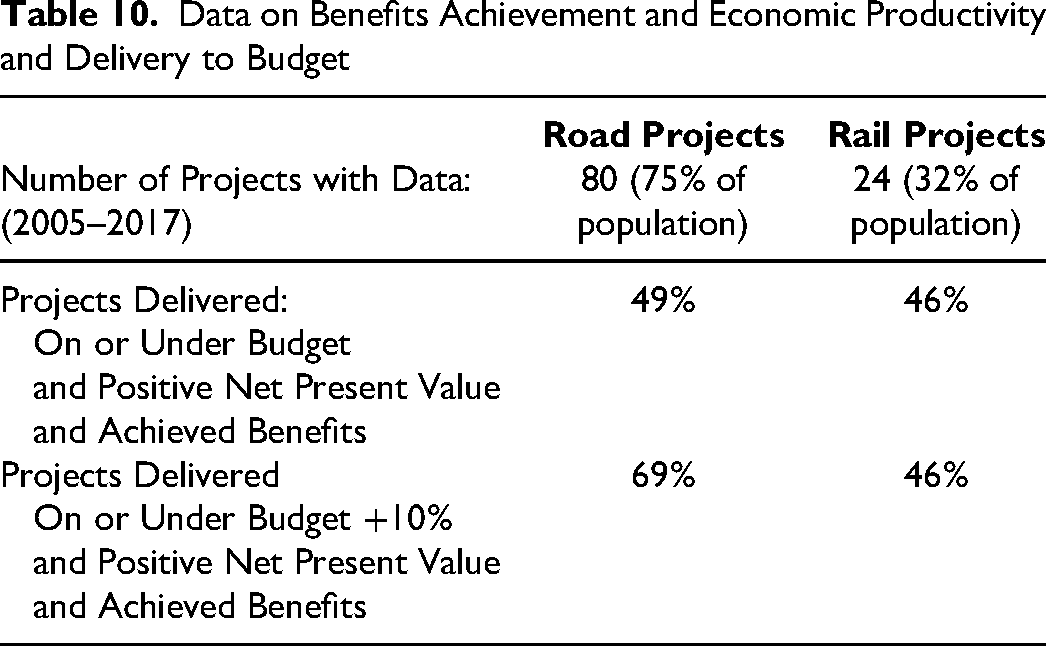
For road projects, approximately one-half achieved their intended benefits, are economically productive, and were delivered on or under budget. Relaxing the budget measure to include projects delivered on or under their budget plus 10%, more than two-thirds of projects met all three performance criteria. For rail projects, a little under one-half of the projects met all three performance criteria and achieved their intended benefits, are economically productive, and were delivered on or under budget.
While performance against individual measures is encouraging, taken together they show that around one-half of the projects fail to achieve intended performance against at least one of these important outcomes. Looking into why, failure to deliver within budget is the main contributor to lower performance against the three metrics combined. As noted previously, individual project cost overruns generally balance out against cost underruns so at the population level delivery cost performance is not of undue concern and indicates that, in this case, including cost in the assessment of overall performance is distracting.
Benefit Achievement and Economic Productivity
Benefit achievement and economic productivity are conceptually key measures of project delivery performance and have turned out to be in practice in this case. Here net present value of a project is taken as being positive when a positive return is measured or when a scheme with a negative outturn net present value met or exceeded its estimated net present value. The results from combining measures of benefit achievement and economic productivity are presented in Table 11.
Data on Benefit Achievement and Economic Productivity
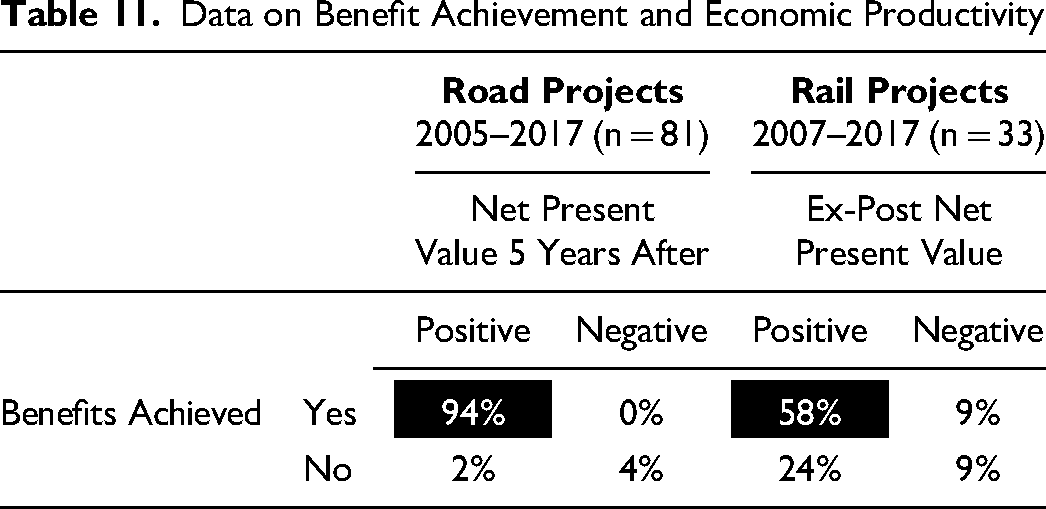
The result of this assessment is that most road projects, 94%, were found to have achieved their intended benefits and were economically productive. For rail projects a smaller majority, 58%, were found to have achieved their intended benefits and were economically productive.
Net Present Value Estimation Accuracy
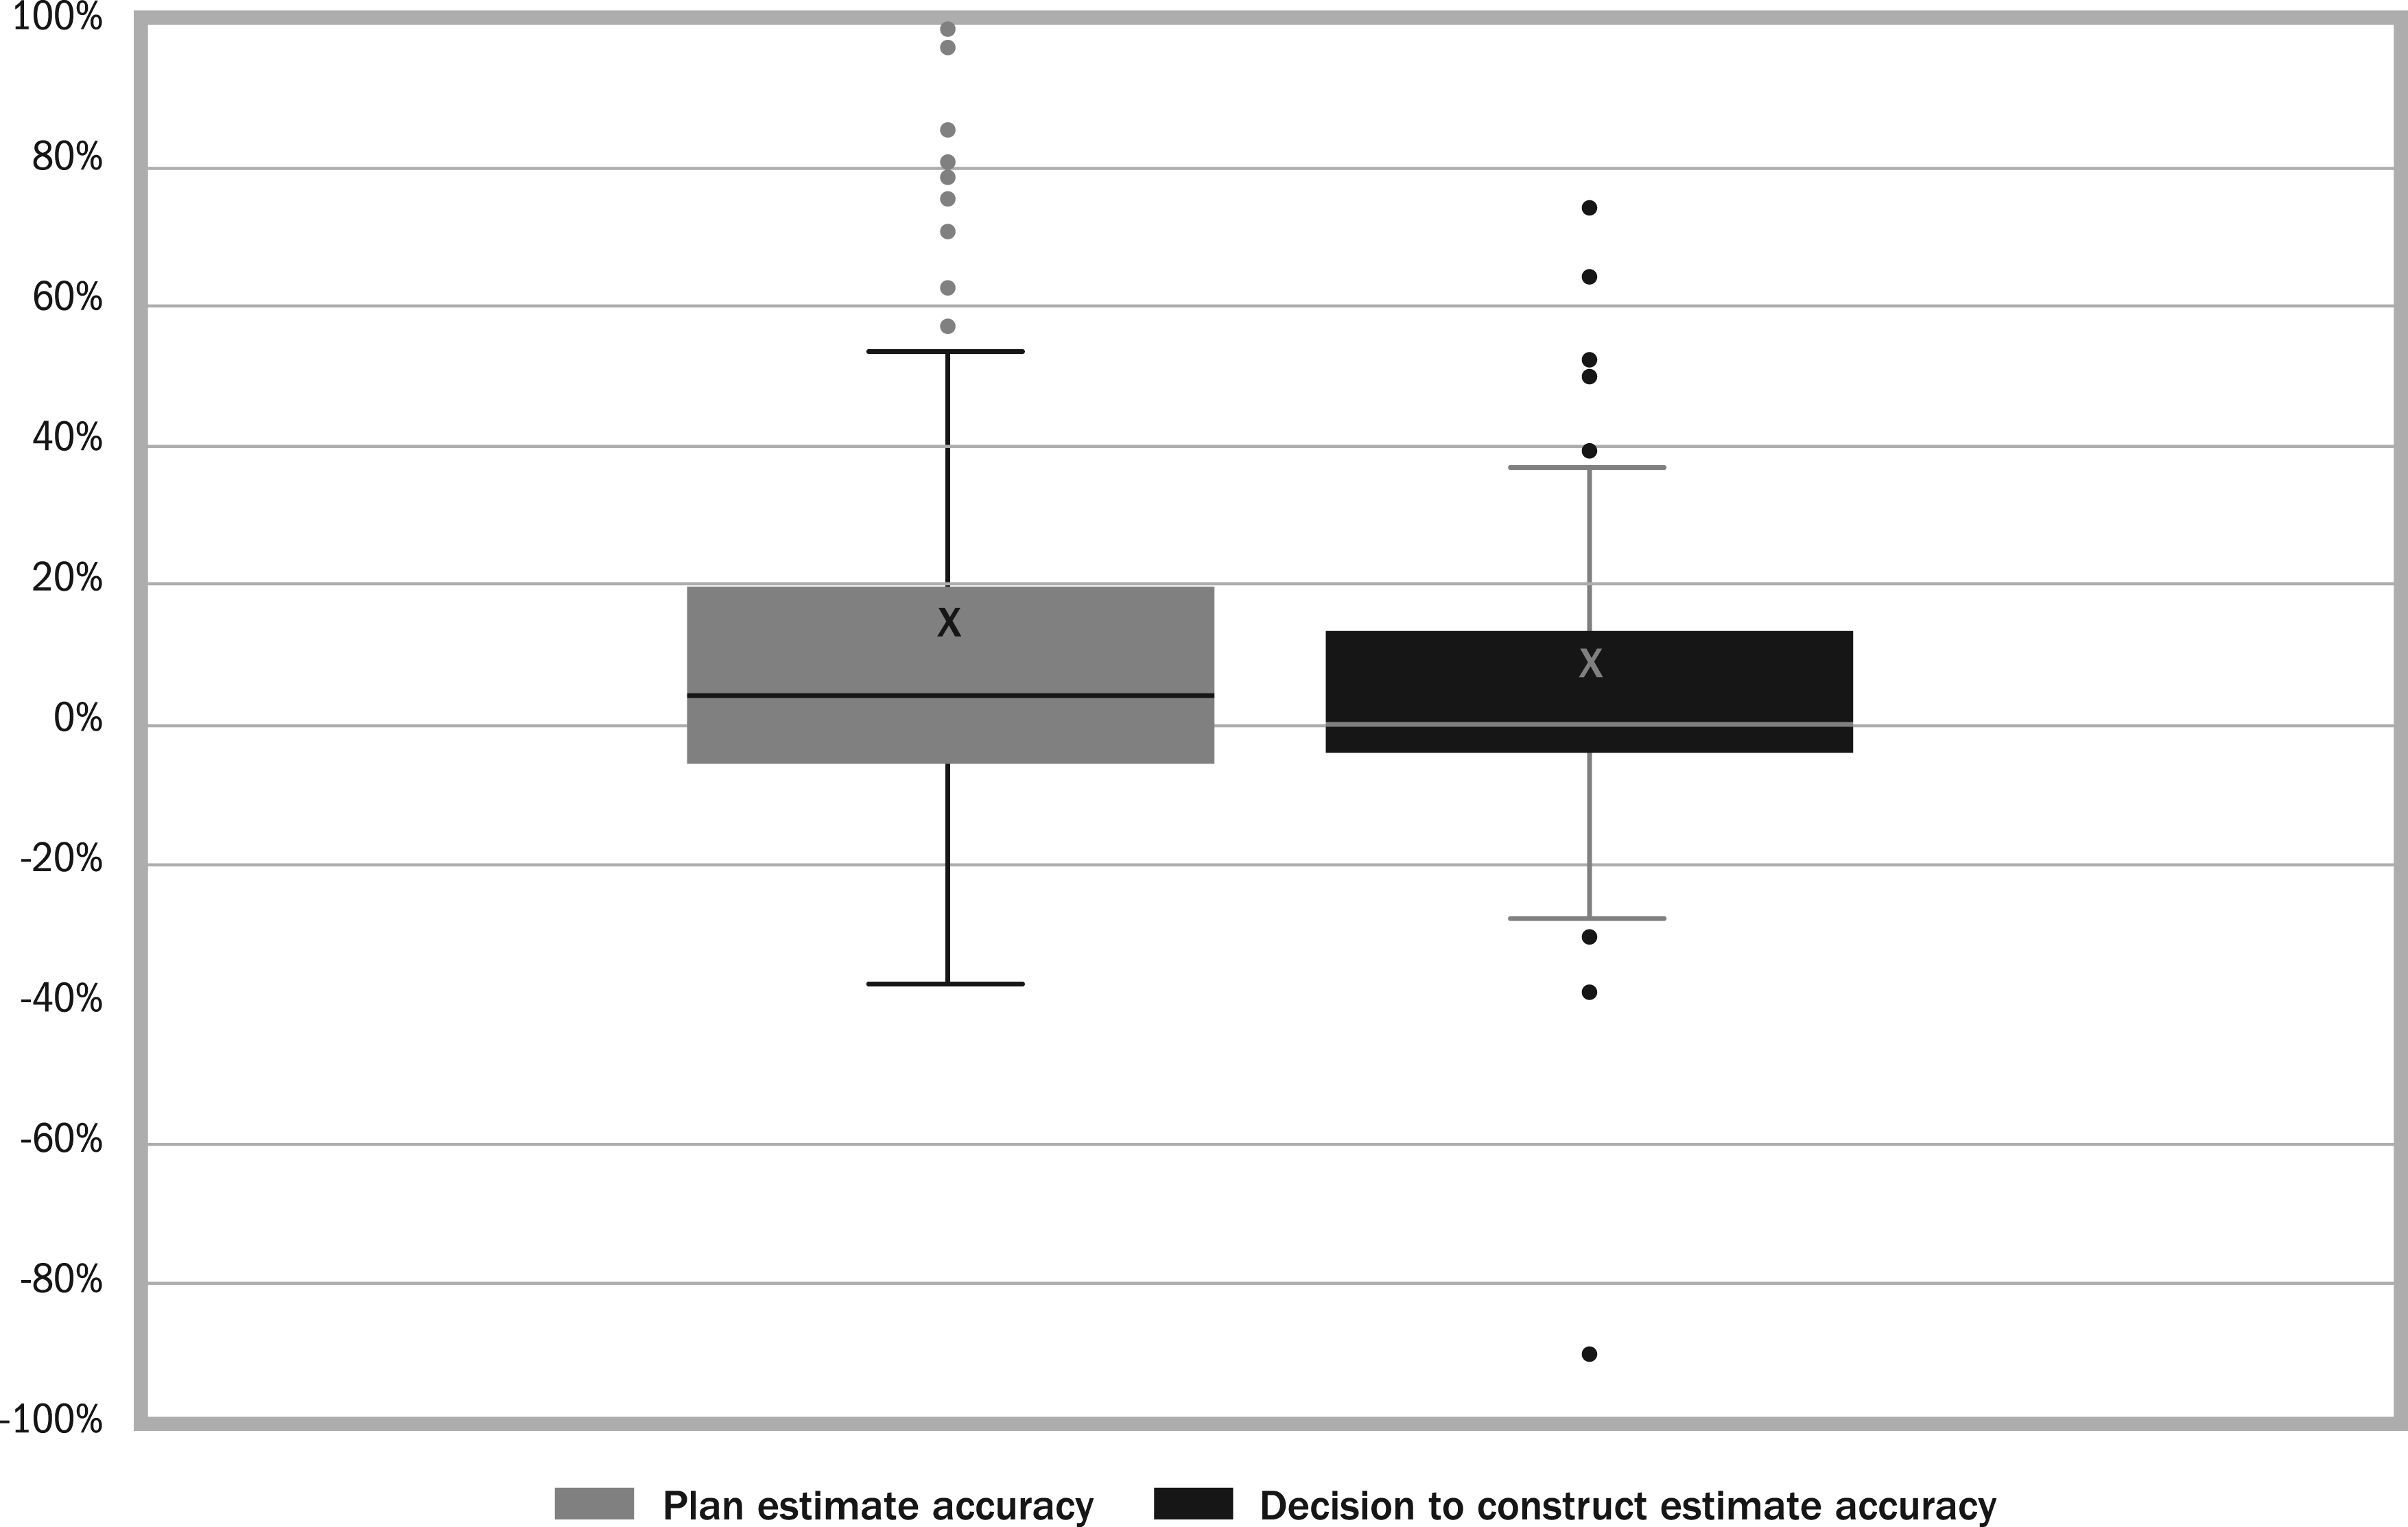
Seventy-five percent of rail projects do not have data on net present value in the five years after evaluation, so only the road project population is used to assess net present value estimation accuracy. For road projects, an ex-post evaluation of net present value taken three years after opening is available for projects completed between 1998 and 2004, and between 2005 and 2017 the ex-post evaluation of net present value is undertaken five years after opening. Ex-ante net present value estimates are available from 2005, where initially these were the plan estimates; then in 2009 the estimate at the time of decision to construct was added and in 2012 data on the plan estimate was discontinued. This data was amalgamated to create a compiled estimate where for the years between 2005 and 2008 the plan estimate is used, and between 2009 and 2022 the estimate at decision to proceed with construction is used. Between 2005 and 2017, 82 road projects were completed where net present value data is available at all three stages, in other words, ex-ante estimate, ex-post evaluation at project completion, and ex-post assessment five years after completion. This data is shown in Figure 8 and in Table 12.
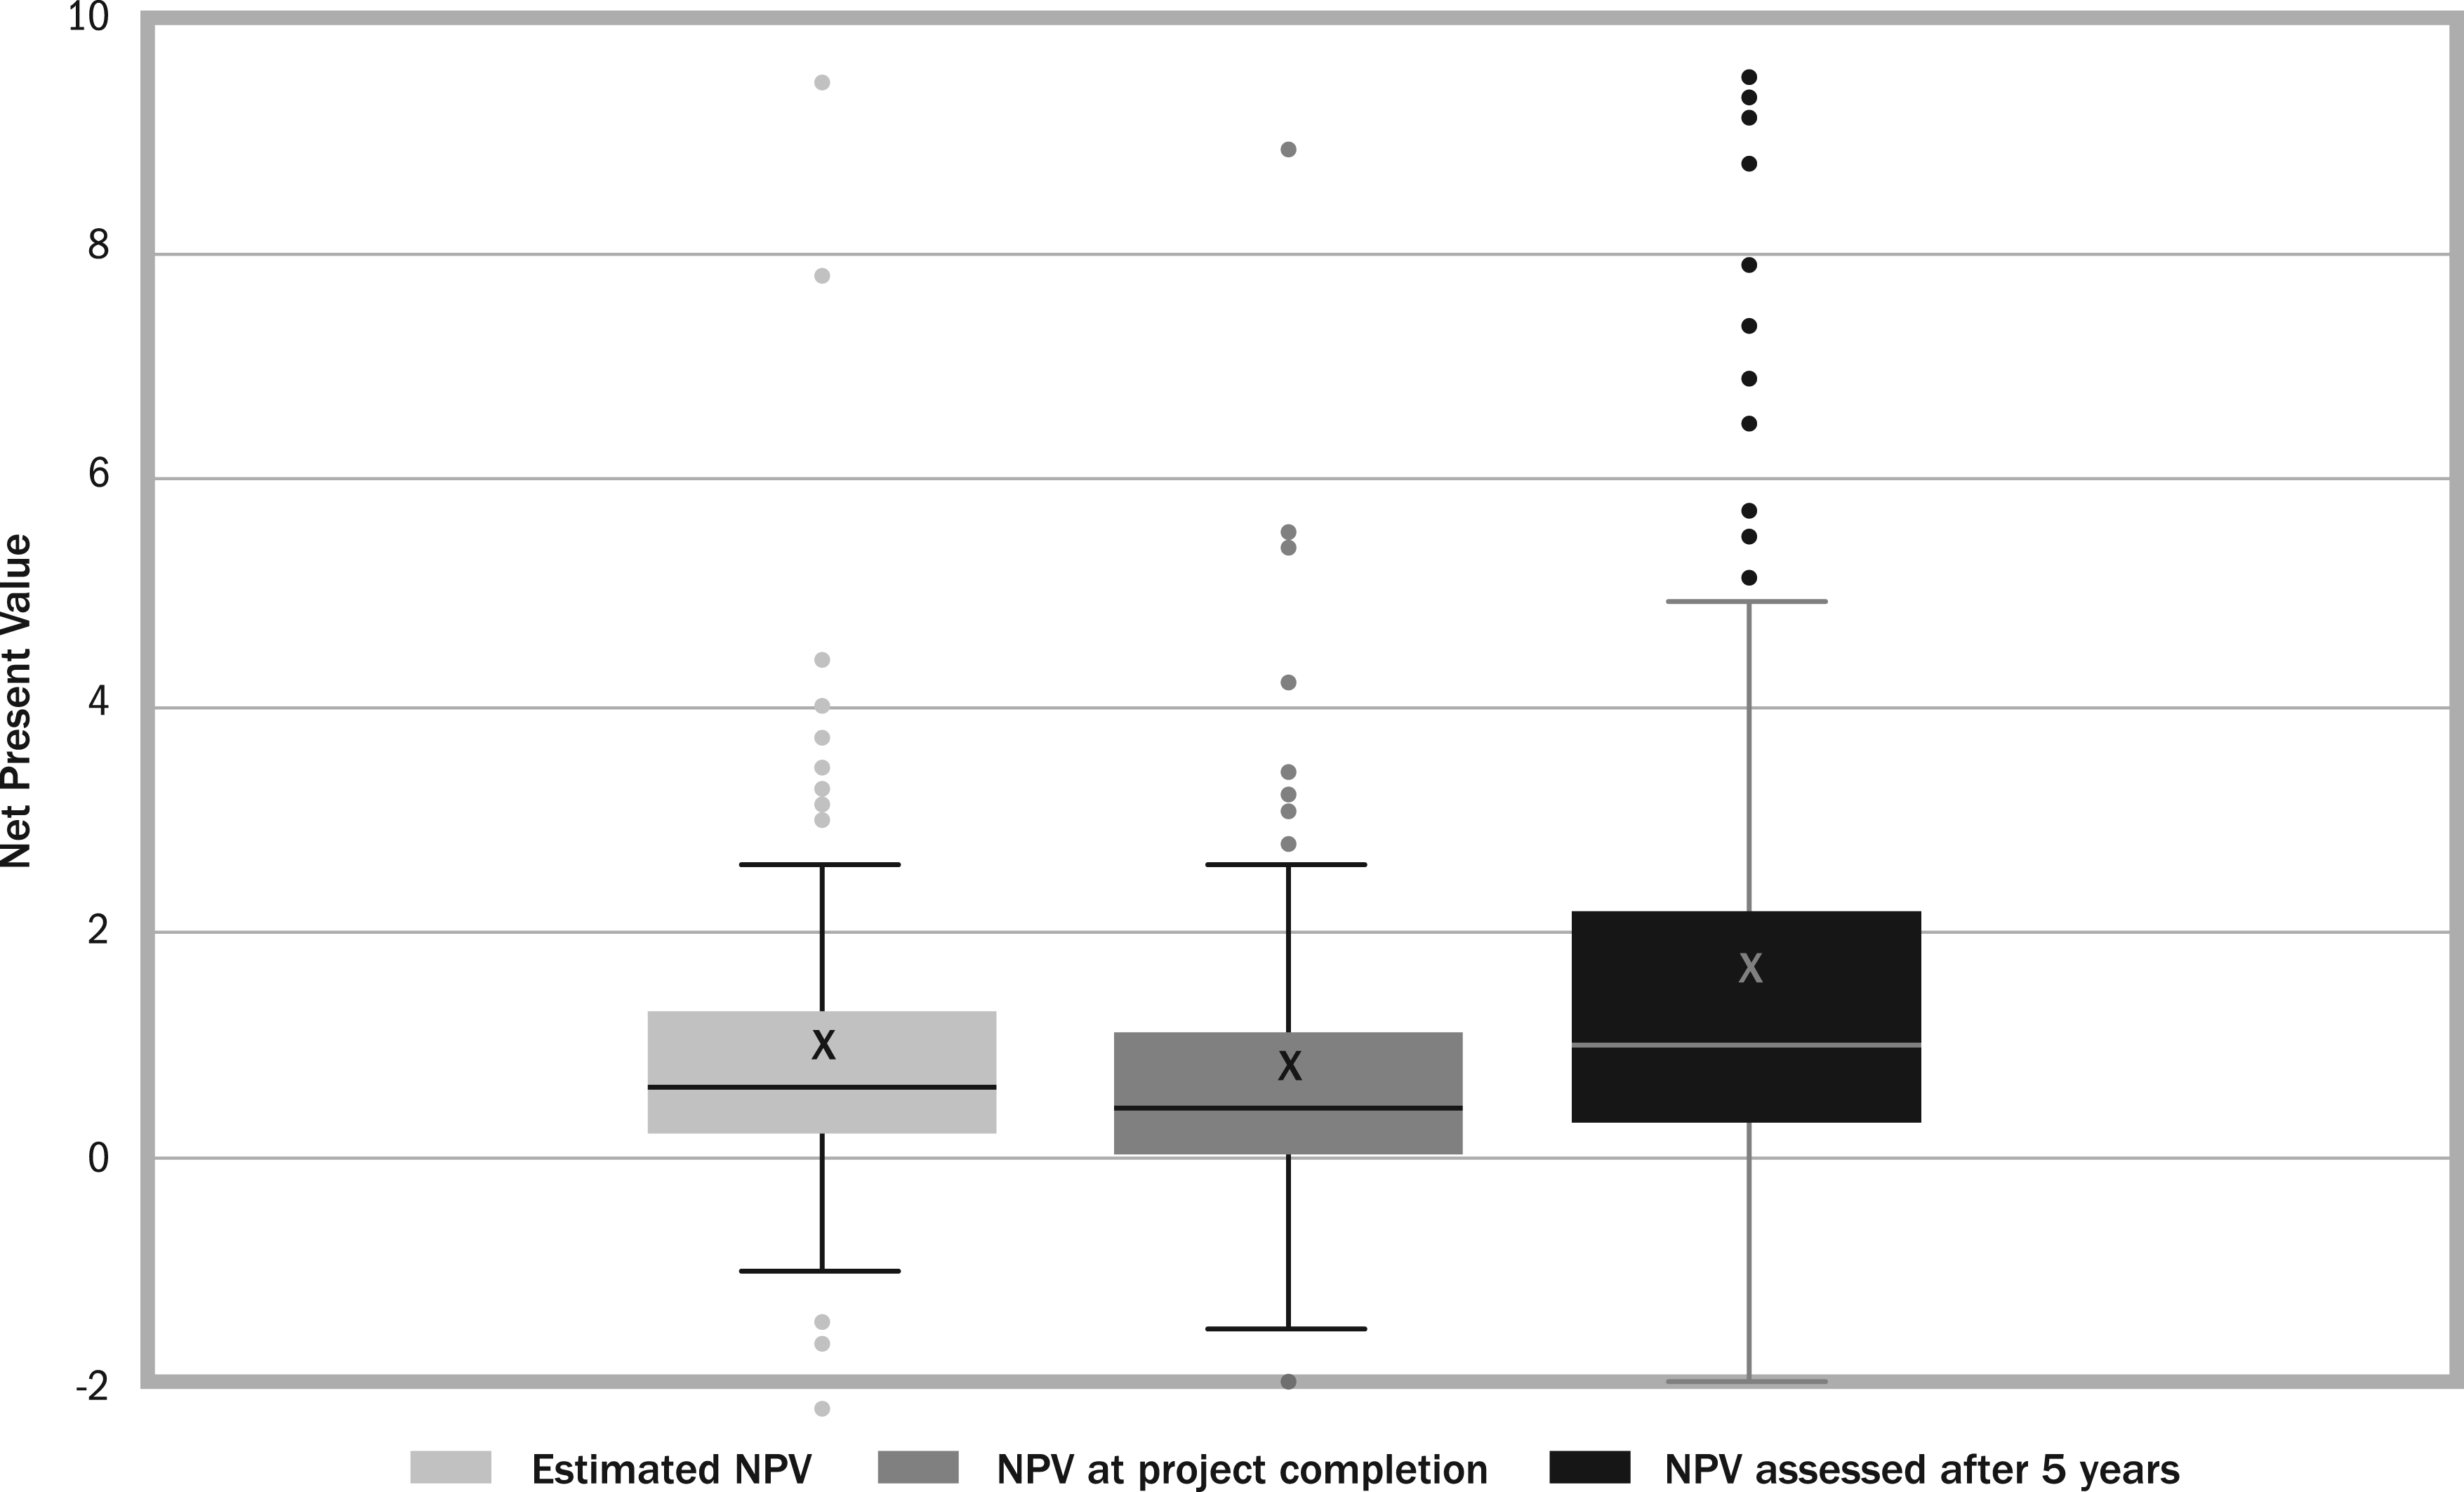
Net present value ex-ante and ex-post data for Swedish road projects (n = 82).
Net Present Value Ex-Ante and Ex-Post Data for Swedish Road Projects (n = 82)
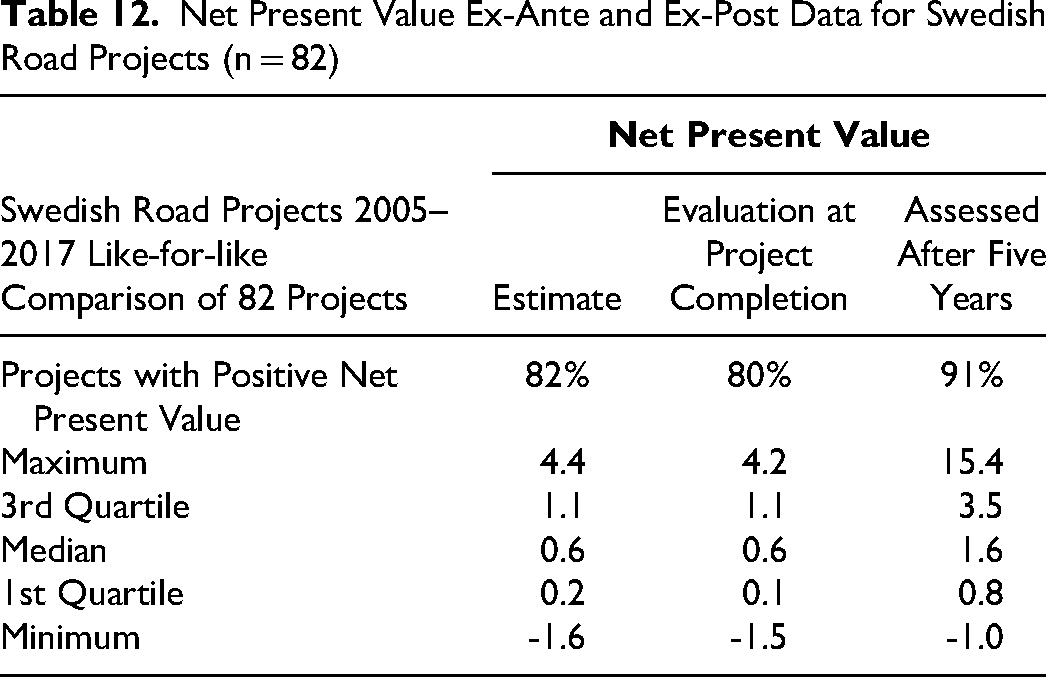
This data presents a like-for-like comparison between net present value estimates that inform decisions to construct against ex-post net present value assessments undertaken at project completion and five years after completion, which allows the accuracy of net present value forecasts to be assessed. The estimate of net present value would have been made using forecast cost, while the evaluation at project completion would have used the actual outturn cost of the project, with an updated estimate of future return. The assessment made after five years will also have used the actual outturn cost of the project and will have five years of data on outcomes to inform its assessment as well as being able to use this data to update the estimate on future returns.
Comparing the net present value estimate against the evaluation made at project completion shows a high level of consistency. If anything, there is a small drop in net present value seen in the number of projects evaluated as having a positive net present value reducing from 82% to 80% and the first quartile level dipping from 0.2 to 0.1. This suggests that estimated cost and outturn cost figures used in the calculation were generally similar, which is consistent with the evaluation of project delivery cost performance presented previously in this article.
Comparing the net present value estimate against the assessment made five years after completion there is a notable difference. The typical outcome, the median, changes from 0.6 to 1.6, an increase of over 160%. The proportion of projects assessed as having a positive net present value increased from 82% to 91%. As this change is unlikely to be due to changes in outturn cost, otherwise this would have affected the evaluation at project completion, this suggests the difference in net present value recorded five years after project completion results from a higher value of outcomes observed as having been achieved and/or estimated for subsequent years. For road projects, comparing the net present value assessment made five years after opening against the net present value estimate, 69% of projects achieved a higher net present value, while net present value was the same for 18% of projects and lower for 13% of projects.
Cost Estimation Accuracy
Where data is available on a project’s (1) plan cost estimate, (2) construction decision cost estimate, and (3) outturn cost, this allows the accuracy of the two estimates to be analyzed. The two populations of road and rail projects were reviewed to identify projects with all three data points to allow like-for-like assessment.
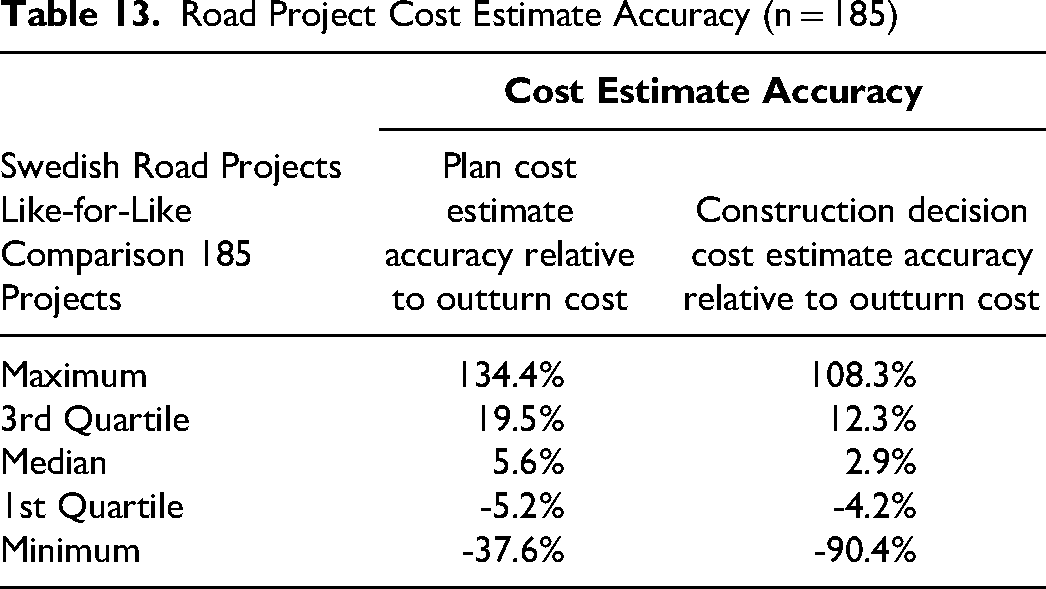
Road Project Cost Estimate Accuracy
One hundred eighty-five road projects had data on plan cost estimate, construction decision cost estimate, and outturn cost. The results of this analysis are depicted in Figure 9 and presented in Table 13.
Road project cost estimate accuracy (n = 185).
Road Project Cost Estimate Accuracy (n = 185)
Rail Project Cost Estimate Accuracy
Sixty-seven rail projects had data on their plan cost estimate, construction decision cost estimate, and outturn cost. The results of this analysis are depicted in Figure 10 and presented in Table 14.
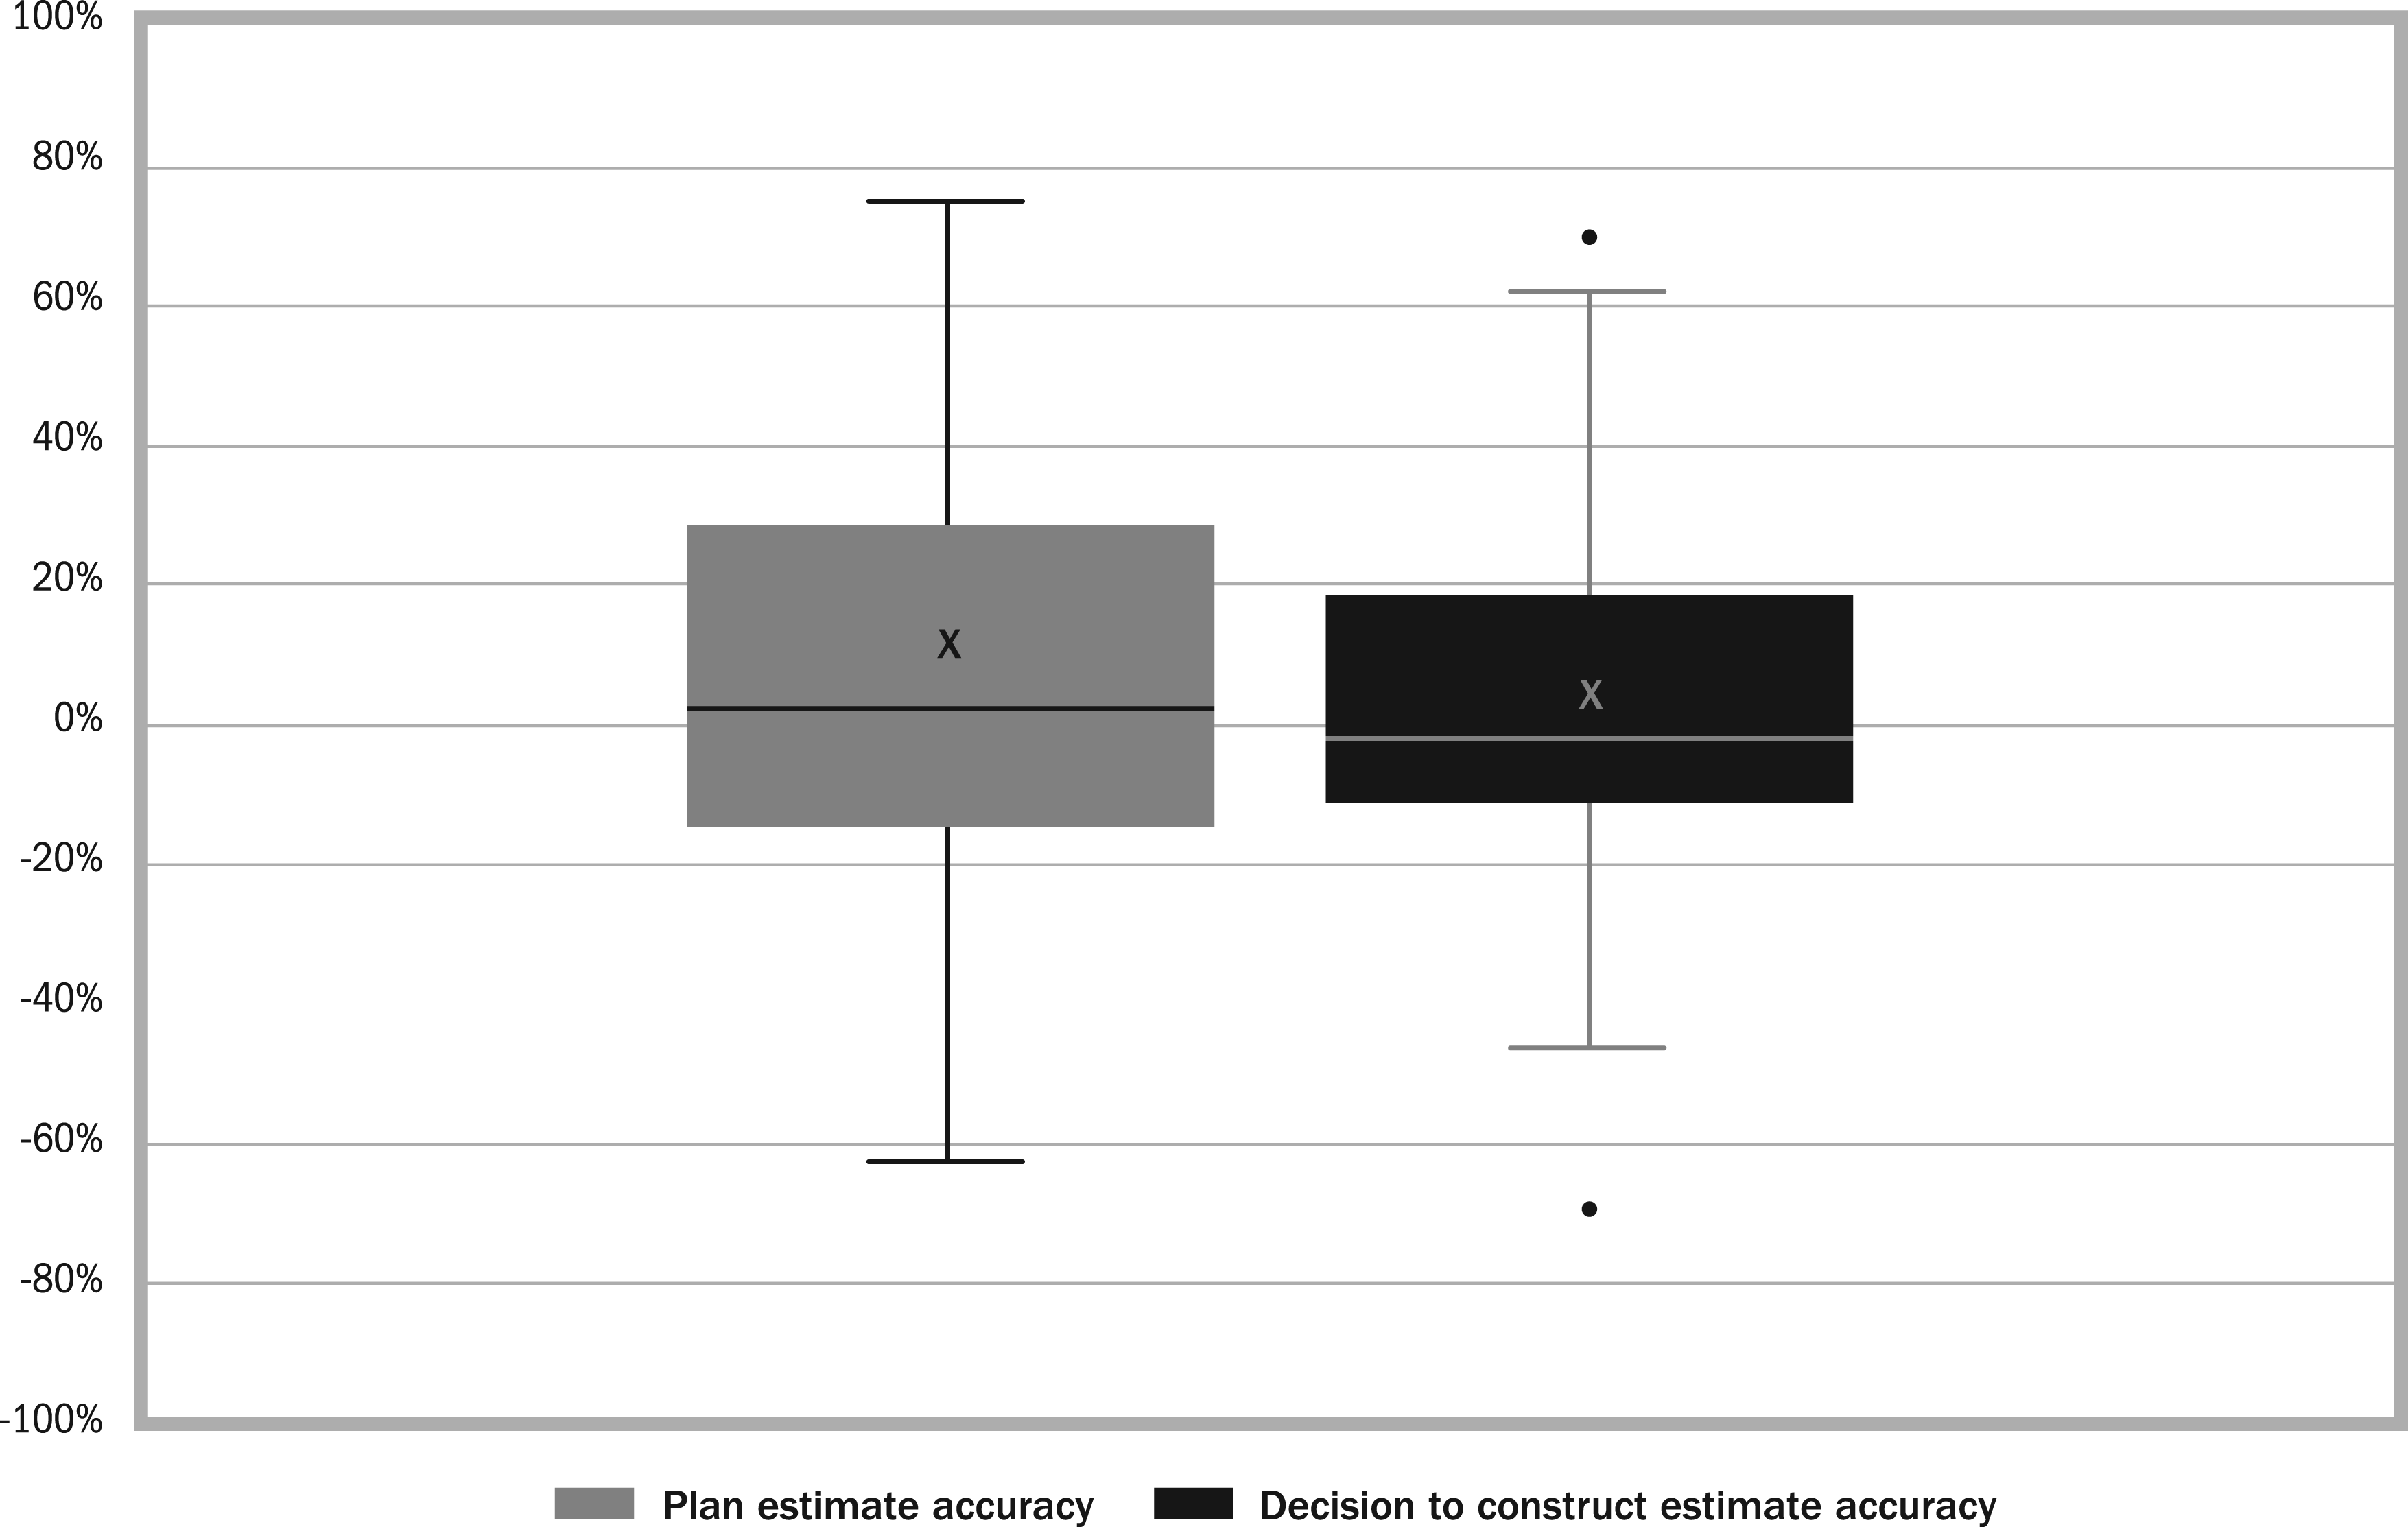
Rail project cost estimate accuracy (n = 67).
Rail Project Cost Estimate Accuracy (n = 67)
For both road and rail projects, cost estimate accuracy can be seen to improve from the plan estimate to the estimate used to inform the decision to construct with the median value moving closer to zero. In both cases the range of inaccuracy reduces with the spread between first quartile and third quartile narrowing and the distribution of results centering more symmetrically.
Discussion
The findings show that the project delivery performance across the headline measures is better than results reported in the literature and as is popularly understood. Typical cost overrun on road projects is 2.7% with 42% of projects delivered on or below their forecast cost, while for rail projects typical outturn cost is -1.8% below the estimate made at the final decision to proceed with 54% of projects delivered on or below their forecast cost. Viewed at a population level, the overall cost performance was close to neutral with the projects delivered under their budget balancing out the projects delivered over their estimated costs. The majority of projects were found to be economically profitable, and the vast majority achieved their intended benefits. Taking these two performance measures together, 94% of road projects and 58% of rail projects were economically profitable and achieved their intended benefits.
The risk of cost overrun on individual projects remains. These findings reveal there was a broad range of cost outcomes for projects within these populations. While the typical cost overrun is close to neutral, some projects experienced substantial cost overruns: Between 2012 and 2022, 28 of the 205 road projects (14%) and 8 of the 39 rail projects (21%) experienced cost overruns greater than 20%. The implication is that success is far from guaranteed so there continues to be a requirement for professional practice and managerial support. The granularity of data collated to establish population level performance lacks the ability to explore various questions that emerge from this work, including why the variation in performance exists. It may be that cost and benefit outcomes are achieved while performance is compromised on other important parameters that are not reported. For example, the scope of schemes is not reported with the performance data, so the potential exists for projects to be truncated without the baseline business case being reappraised and proportionately rebaselined. The possibility that cost targets are surreptitiously achieved through scope change, however, seems not to be the case given achievement of intended benefits and economic profitability are both likely to diminish with scope change and this is not borne out in the data. Alternatively, it may be that complexity (Maylor & Turner, 2017) impacts performance. For example, across Sweden’s 290 municipal regions, 12 have a population density of more than 1,000 people per square kilometer, whereas 21 have a population of less than two people per square kilometer (Statistics Sweden). There is also varied typography to contend with across the nation ranging from the mountainous land of the Norrland terrain to the more fertile central Swedish lowland, which together with other factors combine to present a range of technical and sociological challenges. The implications of this complexity on project delivery lies beyond the remit of this article, however the performance levels reported here provide benchmark metrics against which further research can be conducted to test the effect of these components of complexity on project performance.
Evidence of Systematic Error/Bias
With typical cost overrun close to zero and variation balanced evenly between underrun and overrun, and with cost overrun risk not being associated with size of project budget, viewed at a population level there is no evidence of systematic error in the estimation of project cost. There is however evidence of systematic error in estimation of economic productivity. For more than two-thirds of road projects, the value they delivered was under-forecasted, and the amount of value achieved was also underestimated where the typical net present value forecast was 0.6, whereas the outturn assessed five years after completion was 1.6.
Implications for Researchers
Debates on the role and impact on project delivery of behavioral decision-making, cognitive bias, and complexity rest on project delivery performance being poor and persistent. If the findings observed in this study were found to exist elsewhere, perhaps even being widespread, where projects typically achieve their intended benefits, are economically productive, and are delivered against their budget, it would undercut much of that work. Without evidence of projects being systematically delivered over cost, over and over again, support evaporates for general explanations anchored in behavioral decision-making and agency dynamics such as optimism bias and strategic misrepresentation.
Notwithstanding the finding of positive project delivery performance, other findings that do not support explanations anchored in behavioral decision-making are that the analysis of cost estimation accuracy showed that accuracy increased from the plan estimate to the estimate used to inform the decision to proceed with construction. If these cost estimates are, as claimed, subject to optimism bias and/or strategic misrepresentation, then either those influences evaporate with time or there is a successful approach employed to countering them prior to reaching the final decision to proceed. Analysis of economic productivity showed that ex-ante net present value estimates were consistent with ex-post assessment at project completion, however ex-post net present value assessment five years after completion showed far higher levels of economic productivity. Here the findings indicate that rather than proposed behavioral/cognitive bias or agency dynamics exaggerating outcomes at the planning stage, in this case at least, the opposite occurred.
The suggestion that these findings may exist more broadly is however a big if and highlights the need for similar investigation in other settings to uncover and analyze publicly available data of project populations. Should the findings observed in this study prove to be an exception that runs counter to performance elsewhere then the exceptional results achieved points to an obvious area for further study, which is to understand the policies and practices employed in Sweden that cause this success.
Implications for Practitioners
Practitioners could repeat this work on their own project populations using the relatively straightforward approach and analysis undertaken in this study. The approach taken is systematic, which means it is likely to provide practitioners with a reliable assessment of their project delivery performance. These results can then be compared against the results reported here and by peers to reveal areas of similarity and difference to explore. Having established a baseline of performance, subsequent changes to project delivery approaches can then be assessed and compared against historic performance to determine effectiveness.
Methodological Considerations
The use of publicly available data means this research into project delivery performance is highly unusual in being replicable. Should other researchers follow suit and replicate this work, despite best efforts to collate, manage, and analyze data, it is near inevitable they will uncover errors in the data collection, assembly, and analysis undertaken here, where so doing will improve the reliability of findings and is welcome. Different decisions on how to accommodate gaps in the records will test the sensitivity of the findings, and that is no bad thing. Most usefully, other minds will ask different questions of the data and use different methods to tease out novel features and uncover new findings. This open-source approach with transparency of data and method does, however, risk undermining the business case of a growing cottage industry in project performance analysis by academics and affiliates that operate as consultancies. Honest discourse requires improved (some!) transparency on these conflicts of interest so claims on proprietorial insight can be considered against such commercial interests.
Reporting the findings of an evaluation of the performance of a portfolio, or indeed a sample from a population, of transport infrastructure projects generally involves describing the central tendency of the distribution. While the mean (average) is a well-understood statistical descriptor, it lacks robustness in describing the central tendency of nonsymmetrical distributions. This is not the case with the median value, which as well as being a robust statistical descriptor also enjoys layperson understanding when employed to describe the typical value of a population’s performance. Reporting the median value therefore proves methodologically superior as well as proving an accessible term understood by people who are not statistical specialists.
Conclusion
The findings from this research indicate that stakeholders in Swedish transport infrastructure can have confidence that investments are typically delivered effectively and achieve intended benefits and economic profitability, and that project management is effective in terms of cost performance. While some projects were delivered at a cost exceeding their budget, and 20% of projects are delivered at a cost 20% greater than their budget, at a population level cost underruns balanced out cost overruns. This performance—this success—achieved by Trafikverkets, the Swedish Transport Administration, and its predecessor organizations is notable in having been sustained for an extended duration, 25 years in the case of road/highway projects and 18 years for rail infrastructure projects. This study presents findings that run counter to the widely held position in scholarly works, consultancy reports and the media that transport infrastructure delivery performance and outcomes are persistent poor. This challenges theories that postulate projects are afflicted by malignant agency dynamics and inherent bias in decision-making. Without the largely unverified assertions presented in the literature that most projects fail, the case is diminished for the claim that optimism bias and strategic misrepresentation during planning is widespread.
While overall performance typically achieved intended outturn goals, this was not ubiquitous across the population and room remains to improve performance. Having established a robust project performance baseline, there is the opportunity to direct attention and effort to better understand what factors influence project performance within the population and to employ this understanding to inform future project delivery policies and practices. This work can also be extended to study other project populations with publicly available data to investigate project delivery performance in a similar manner. Doing so opens the potential to benchmark respective performances of organizations and to assess the effect their differing policies and practices have on outcomes.
Footnotes
Declaration of Conflicting Interests
The author(s) declared no potential conflicts of interest with respect to the research, authorship, and/or publication of this article.
Funding
The author(s) disclosed receipt of the following financial support for the research, authorship, and/or publication of this article: This research received grant funding from the Saïd Business School, University of Oxford Faculty Research Fund. The funding source had no involvement in the conduct of this research or preparation of this article. No further funding was received.
Author Biography
Paul supports the project delivery profession as Vice President of the Association for Project Management (APM), the chartered body for the project profession, having previously completed a six-year term as board director and chair of the Professional Knowledge and Standards Committee. He can be contacted at