
Abstract
We present a novel framework to assess 27 earned value management system (EVMS) environment factors and investigate their impact on project performance. A study of the EVMS literature, a survey of practitioners, and focus group meetings with 36 EVMS industry and government experts, supported the development of the framework. Focus groups involving 80 practitioners refined and tested it. We analyzed performance data from 35 completed projects/programs representing over US$21.8 billion in total cost; a project demonstrating a positive environment could save up to 25% in cost versus baseline. Practitioners can develop an effective EVMS environment by following the provided guidance.
Keywords
Introduction
An earned value management system (EVMS) is a project management system, within an organization, that integrates work scope, schedule, and cost, to achieve effective planning, performance, and management control. By using the EVM information produced from the EVMS, project managers can plan, control, and forecast the project cost, schedule, and technical performance. To ensure accurate information on work performed, and to estimate future work, teams typically follow well-recognized EVMS technical standards and guidelines (e.g., NDIA, 2018) when implementing the technical EVMS subprocesses on a project, such as organizing, contracts management, risk management, and so on. These guidelines entail first setting a realistic performance measurement baseline (PMB) that the stakeholders use to systematically control their project by making effective decisions. This means that as the project progresses the EVMS is influenced positively or negatively by an environment where human inputs, decision-making, and engagement are necessary. Since the EVMS is a socio-technical system, its success requires both its technical subprocesses and its social aspects to be addressed (Cho et al., 2020; Project Management Institute [PMI], 2018). The technical aspect of the EVMS socio-technical system is referred to as EVMS maturity, which measures the effectiveness and compliance of the system’s subprocesses and deliverables to relevant standards and guidelines. Studies have shown that the EVMS maturity level can impact the outcomes of projects (GAO, 2021; PMI, 2018). Enhancing the reliability of the EVMS and increasing the chances of project success can be achieved by addressing both its technical aspect and the surrounding social environment (Cho et al., 2020). This study focuses on the social aspect of using EVMS in integrated project management. The technical aspect has already been addressed in another study (Aramali et al., 2022a).
EVMS environment is defined in the literature as “the conditions (people, culture, practices, and resources) that enable or limit the ability to manage the project and program using the EVMS, serving as a basis for timely and effective decision-making” (Aramali et al., 2022b, p. 2). It incorporates environment factors that are qualitative and related to project culture, team, resources, and business practices. An EVMS environment factor is one of the circumstances, facts, or elements that contribute to the result or outcome of an EVMS. The domain of research in project management has extended its focus to the way an organization uses projects to achieve organizational goals (Bryde et al., 2018; Andersen & Jessen, 2003; Kim et al., 2003), and the general focus of project management is on single projects that make up a portfolio. Therefore, the boundaries of the EVMS environment in this study are around a given project, regardless of its geographical location and organizational structure, where project leaders are engaged physically or virtually in using EVMS. The subject stakeholders represent the customer or the contractor organization that follows procedures and uses EVM information directly influencing the project outcomes and culture to achieve the project goals (for example, project control analyst, control account manager). The terms “project” and “program” are both addressed in this study; however, we use the term “project” for brevity.
Based upon the state-of-the-art study of EVMS, there is currently a lack of a data-driven assessment or rating system that could measure the EVMS environment consistently across owner and contractor organizations (Aramali et al., 2022b). Clear definitions for EVMS environment factors, in consensus with experienced practitioners, do not exist. Quantified evidence around the impact of a comprehensive listing of environment factors on project outcomes when applying EVMS also does not exist. Furthermore, projects continue to suffer from social challenges when applying EVMS and face a long history and growing trend of cost overruns and delays (Stout et al., 2020; Edwards & Kaeding, 2015; Flyvbjerg, 2013; Chidambaram et al., 2012; Meier, 2010). Accordingly, the U.S. Department of Energy formed a research team to study the EVMS environment and investigate its impact on project performance. The purpose of this research is to create methods to improve integrated project management practices. The team was composed of 36 individuals representing contractor, owner, and consultant organizations. Their role in steering the research was vital in achieving the research goal. Together, we addressed the gaps in the study of EVMS from an interdisciplinary perspective, and informed by the social sciences, where the social context is manifested in the processes, influenced by the relationships between groups of people (Blau, 2017). The significance of the social aspect of EVMS within its state of practice, the desire to develop a novel method to assess it, and the lack of evidence of impact on project outcomes are the leading motivators of this research investigation.
Together with the research team and data collected from industry practitioners, we identified 27 environment factors crucial for a high-performing EVMS. As a major contribution to the body of knowledge, we developed a novel EVMS environment assessment framework that includes these crucial factors. It can be applied to diversified types of projects (construction, environmental, energy, science, and so on) and used by project owners, contractors, and consultants. The assessment was tested on 35 projects, using quantifiable EVMS environment measures and with empirical evidence showing the relation between the EVMS environment and project performance.
The objectives of this article are (1) to present the novel assessment framework that gauges an EVMS environment; and (2) to quantify the impact of the EVMS environment on project performance, looking at several key metrics. The research hypotheses tested in this article are that: (1) an EVMS environment can be well defined; (2) an EVMS environment can be measured; and (3) an EVMS environment is correlated with project performance. These hypotheses were developed based on previous literature, which found that various social factors influence EVMS and that EVMS, in turn, affects project performance and success (McNamee & Immonen, 2019; AACE, 2014; Marshall, 2007). Secondly, they were refined based on the experience and observation of the EVMS practitioners in the research team and were worked out in relation to the data collected from the field as elaborated on in the methodology section.
Literature Review
The comprehensive literature review was a foundational research step in this investigation as it helped situate the research hypotheses and identify gaps in the existing body of knowledge. It also helped the authors in collecting and defining a comprehensive list of environment factors that can have a high impact on EVMS effectiveness and others that have been deemed as essential to project success. Additionally, to study the impact of an EVMS environment on project performance when testing the third hypothesis, we identified the performance metrics with the help of the research team and built on past studies focusing on project success. The following sections of the literature review examine EVMS, focusing on its social elements and project performance in more detail.
Social Components of EVMS
The essence of EVMS is that it is a technical system operating within a social environment. The principles of the socio-technical theory are relevant to the application of EVMS because its success depends on both the technical design of the system and the human interventions within it (Hyer et al., 1999; Appelbaum, 1997). Although Coiera (2007) emphasizes the importance of the technical aspect in socio-technical systems, studies have shown that social variables are often more significant in determining system effectiveness (Hyer et al., 1999). This article focuses on the social aspect of EVMS and its social components, as it helps address the first two hypotheses of the study. The technical aspect of EVMS is explored elsewhere. In the exploration of project management, social factors, and human behavioral aspects cannot be ignored (Jitpaiboon et al., 2019). The special issue of the Project Management Journal® on project behavior serves as a testament to this fact (Unterhitzenberger, 2021). This special issue has been published emphasizing the lack of understanding of the social context of projects and their success. Recent articles have emerged with a focus on addressing individual social aspects such as culture, organizational dynamics, management, and power structures (for example, Shafi et al., 2021; Wynn et al., 2021). A project, using EVMS, is “any endeavor involving planned action” that helps project managers make informed decisions (Najafi & Azimi, 2016, p. 63). Project work using EVMS incorporates a human dimension and amplifies social interactions (Darling & Whitty, 2021).
There are two types of studies in the literature related to social components of EVMS: those that have solely focused on one factor and those that represent a broader study of diverse factors. Examples of the first are inclusive of project leadership (Turner & Müller, 2005), skills and knowledge (AACE, 2014), and communication with stakeholders (McNamee & Immonen, 2019). An example from the second type of study is by Besteiro et al. (2015), who gathered a list of 57 factors. In general, the studies claim that the success of the project performance is hindered by challenges relating to the improper use of resources, poor business practices, and lack of leadership support (Jitpaiboon et al., 2019). However, tangible data-driven evidence is lacking. Since it is very difficult to relate success to any specific factor (Besteiro et al., 2015), our recent literature review gathered a comprehensive list of EVMS environment factors using publications since 2000 (Aramali et al., 2022b). In summary, we found gaps in environment factor identification and definition, with a lack of subject matter expert knowledge from EVM practitioners, as well as little investigation of their impact on project performance. Next, since our third hypothesis is related to understanding the relationship between social components and project performance, we determine various project performance metrics that could indicate successful project outcomes, based on the literature.
Project Performance
A major goal of project and program management is to meet cost and schedule targets. Rani et al. (2021) argue that this is a traditional way to measure project success. However, project management success is an integral part of the project’s overall success (Shenhar et al., 1997). A survey revealed that there is a balance between practitioners who believe that a successful project is the same as successful project management and those who think that this association is not always true (Shokri-Ghasabeh & Kavousi-Chabok, 2009). An EVMS project control system offers an overall picture of project performance based on which actions are triggered (Colin & Vanhoucke, 2015). It is essential to adopt further project performance success metrics that show the impact of improving project control and EVMS effectiveness, as stated in the literature (Christensen, 1998). These project performance metrics will be used as the dependent variables later in this study.
Organizations aim to complete their projects within budget and schedule, two important project success measures based on the literature (Oakley, 2020; Lipovetsky et al., 1997). However, projects may finish on time and under budget, yet be considered failures in the market (Aronson & Lechler, 2021; GAO, 2021; PMI, 2018; Rad, 2003; Belassi & Tukel, 1996; Pinto & Slevin, 1988), because budget and schedule are not considered the only two measures of project success. The literature contains a wide variety of other factors that constitute a successful project. To determine successful outcomes, other factors such as project changes, contingency reserves, and the cost performance index (CPI) are also often considered in the literature. Project changes (Shrestha & Fathi, 2019) are disruptions that may increase or decrease the project cost; thus, we considered the absolute value of a change, as well as project cost growth excluding change orders (Ibrahim et al., 2020). Isolating the cost growth from change orders could inform on the impact of the latter. As projects may encounter unpredictable events, contingency reserves are provisions allocated to mitigate such risks (PMI, 2017). Contingency is separate from project costs and the project outcome is tremendously impacted by it (Hammad et al., 2016). Finally, this study also considers the CPI, a measure of cost efficiency, as an additional criterion to measure performance (PMI, 2017; Kim et al., 2015).
Our third hypothesis evaluates the possibility of enhancing project performance metrics through a well-structured and well-implemented social environment in EVMS. Although there is a lack of research on this specific topic, previous studies have shown that effective EVMS implementation leads to successful projects (Marshall, 2007; Kim et al., 2003). Based on this literature, there is a need to establish a framework that outlines social components and examines their impact on project performance.
Methodology and Framework Development
A multistep and multimethod research approach was developed and followed during the overarching study (Esbjörn-Hargens, 2006; Green et al., 2002). In the initial stages of the research, a literature review and an industry survey were performed to gather a baseline understanding of the topic; these are mentioned briefly in the next section (Aramali et al., 2022b, 2021) and have already been published elsewhere. The new steps documented in this article are covered and reported here specifically to answer the study’s hypotheses. As a first step covered in this article, an initial environment framework was drafted. In the second and third steps, industry workshops were conducted to collect data as well as refine and test the framework. The workshops followed a novel focus group data collection method that had proven to be effective in past research efforts and that engages industry knowledge in a real-time, structured manner; this method, adopted from the literature, is called “remote research charrettes” (Gibson et al., 2022; Lennertz et al., 2017). In the final step, the collected data were analyzed.
Past Steps: Literature Review and Industry Survey
The literature review and industry survey formed an essential foundation for this work and were published previously. An extensive literature review was conducted in which existing resources published by academic researchers and industry practitioners on the topic of EVMS were examined in depth (Aramali et al., 2022b). We also led a large industry survey, which received 294 responses from participants representing an average of 20 years of career experience in project management (Aramali et al., 2021). The findings of these two steps informed the development of the framework discussed next. Specifically, the responses from the survey helped draft the definition of EVMS environment and identify critical factors that impact the EVMS environment. The literature review specifically investigated the published literature from a new perspective, looking at issues affecting the EVMS environment and identifying the gaps, as previously discussed. Building on the past work, the following Steps 1 to 4 are the focus of this article.
Step 1: Initial Framework Drafting
In this step, we drafted the EVMS environment assessment with the support of the expert practitioner research team and with extensive input gained over a number of meetings. The EVMS environment variable is a construct in framework development research methods that cannot be directly measured (Rao et al., 1999). To address this construct, a list of factors was identified, and measurement scales were discussed to quantify it. The authors initially proposed 33 factors, which were then decreased to 27 factors, as described next.
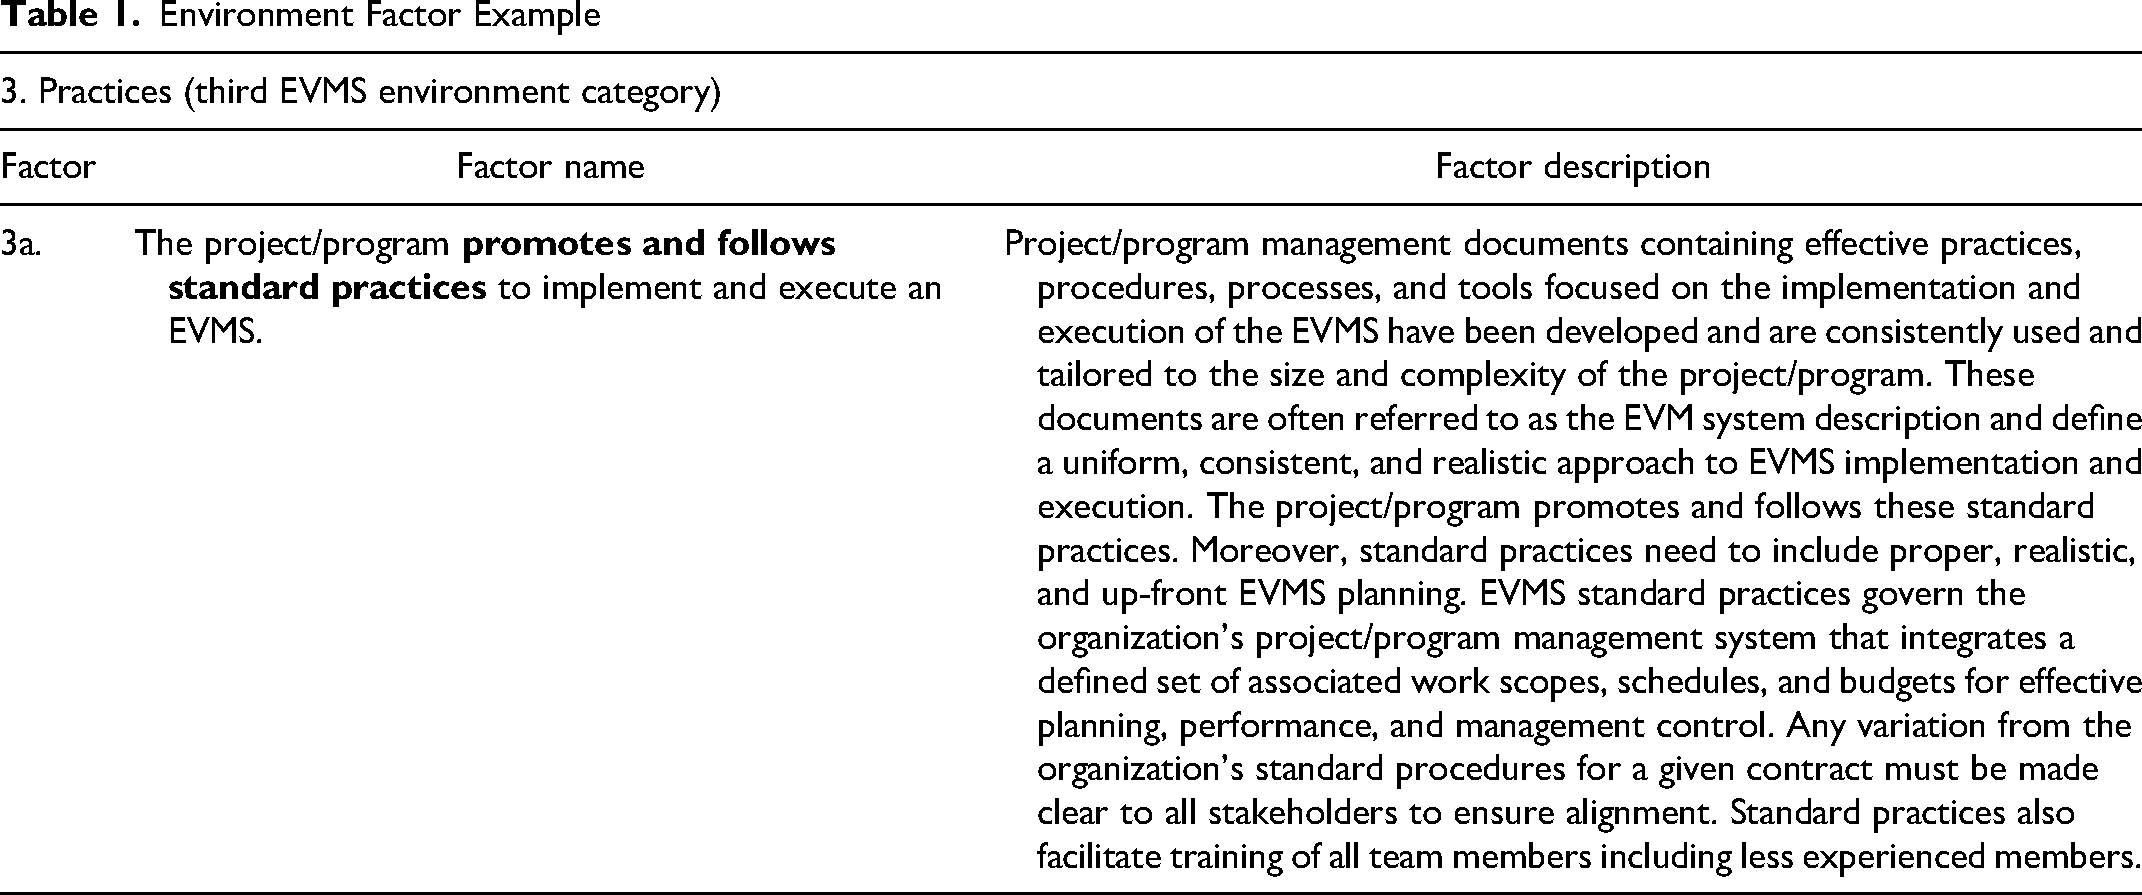
First, we formed a list of 33 environment factors critical to the EVMS environment, grouped into four categories (Culture, People, Practices, and Resources) based on the literature, the industry survey, and the research team meetings (Aramali et al., 2022c). Grouping the factors into these four core categories or themes that form the EVMS environment was a fundamental step (Alhojailan, 2012). The definitions of each environment category were taken from the literature and then refined in conjunction with the research team. Each factor was given a short narrative (factor name) and a more detailed explanation that provides its full description. Table 1 shows an example of an environment factor (factor 3a).
Environment Factor Example
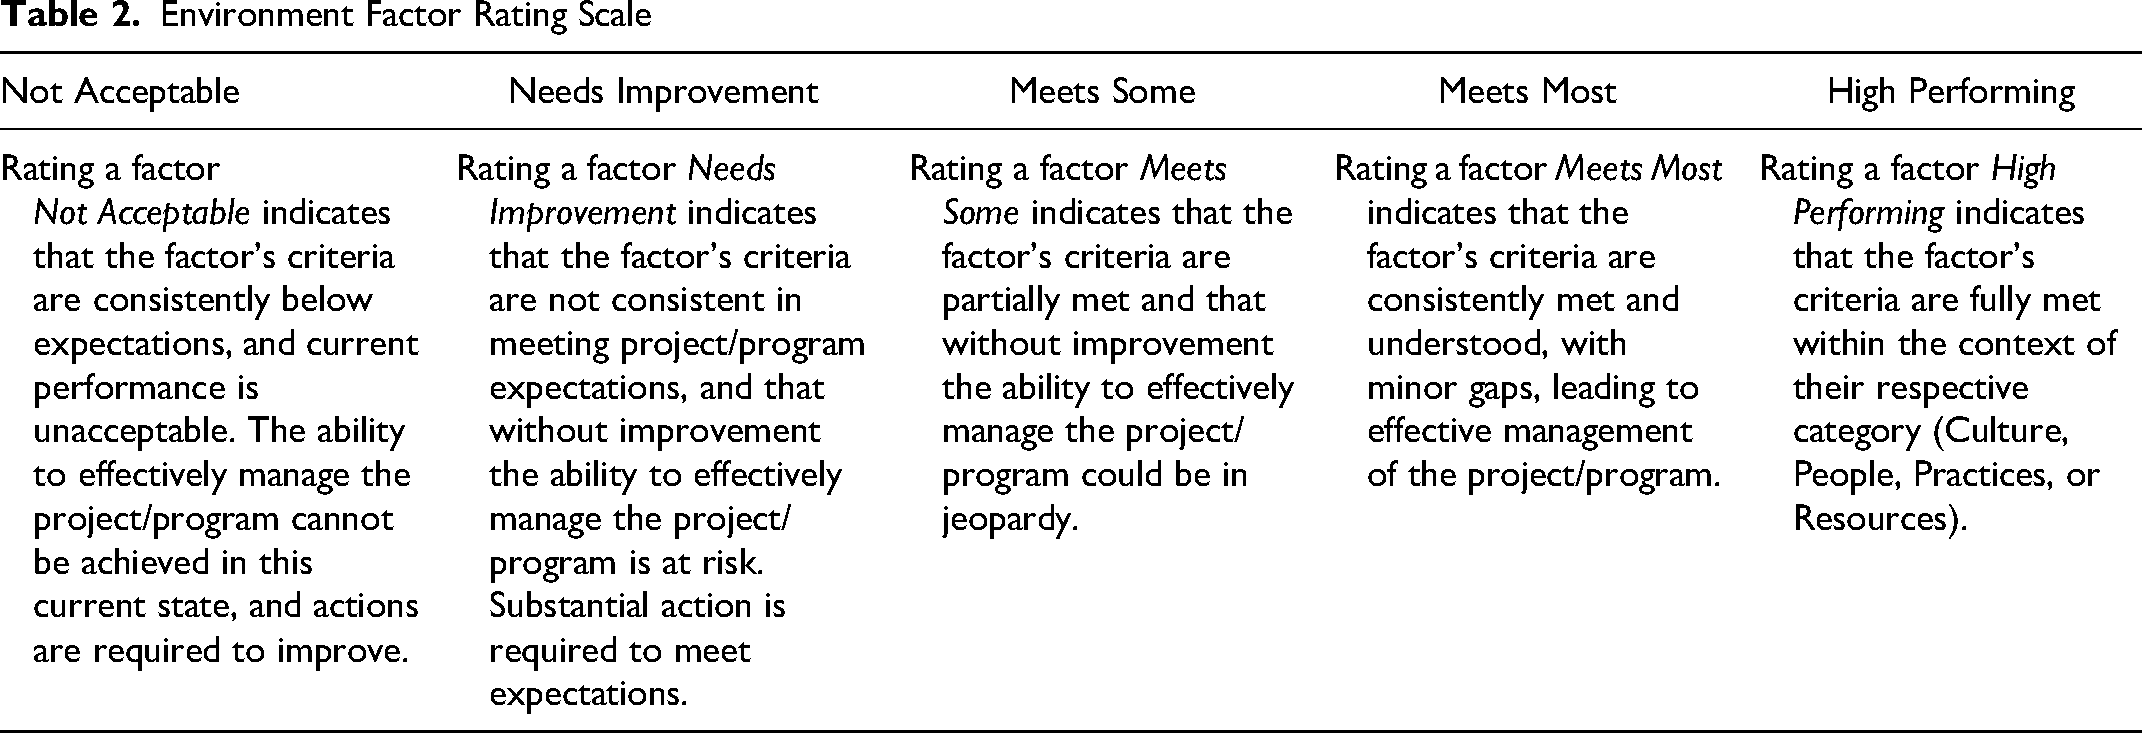
Over a period of eight months and more than 1,000 person-hours, the research team worked together and iteratively refined the draft framework, until consensus was reached. The rating scale to evaluate each factor was also drafted, and it ranges from Not Acceptable through Needs Improvement, Meets Some criteria, and Meets Most criteria, to High Performing. Each rating level also has a concise description associated with it, as shown in Table 2. Finally, we arranged the factors into a scoresheet format by factor name and rating levels.
Environment Factor Rating Scale
Step 2: Framework Weighting and Development Workshops
Next, we hosted four framework development and factor weighting workshops using the remote research charrettes method (1) to receive feedback on the factor names, detailed descriptions, and rating scale; and (2) to develop relative weights for the factors to complete the scoresheets (since not all factors are equally important).
The relative weight of each environment factor represents its importance relative to the others in the overall EVMS environment, as assessed by the workshop participants. These relative weights are also called “scores” associated with the High Performing environment factor rating level. When providing feedback on the factor weights, the workshop participants were first asked to select an anchor project to use as a reference point for their responses. Then, depending on the number of factors available under each environment category, they were asked to rank the top four or five factors based on their relative importance in this anchor project (Belton et al., 2019; McMillan et al., 2016). Afterwards, they were asked to allocate 100 points across the four environment categories based on relative levels of importance (higher points for higher importance) (Fontenot et al., 2007). For instance, if a participant believed that Culture was as important as the other three categories combined, then they would allocate 50 points for Culture, and spread the remaining points across the other three categories.
The environment factor ranks assigned by the participants were then converted to importance scores; the factors that were ranked first were assigned a score of 5, factors ranked second were assigned a score of 4, and so forth (Aramali et al., 2022c, 2021; Fontenot et al., 2007). The reason behind this was to convert the collected ranking data to the same unit of measurement used for the environment categories (importance scores, also referred to as weights), and to have higher values denoting more importance, as a common basis for data analysis.
The first two workshops used the initial list of 33 environment factors. Weights were collected, and 368 comments were gathered as feedback. Using these inputs, we reviewed the importance scores received for each factor versus the maximum possible factor score that could be achieved. Six environment factors were then dropped from the initially proposed factors because each of these factors received less than 15% of the possible factor score. The research team addressed the comments received, and the final remaining 27 environment factors were utilized in the final two workshops. In total, 675 comments concerning factor names, descriptions, and rating scales (see Table 2) were addressed to ensure framework efficacy and practicality. This iterative process of defining factors, collecting and analyzing the data and comments, and refining the framework along the way allowed us to improve the quality of the findings and reduce biases that may have existed (Strauss, 1987).
A total of 47 data sets were collected from the four workshops. First, the mean score for each environment category (an average of 47 responses) was calculated from the participant-provided weights. Then, an outlier analysis (Morrison, 2009) on the category level was applied, resulting in the removal of three responses (deemed as extreme outliers) out of 47. The next step included an outlier analysis on the factor level, identifying one outlier response. The remaining 43 data sets were used to calculate the High Performing rating level scores in the scoresheets. After outliers had been removed, a normalized weighted average for each factor was calculated by applying the following formula: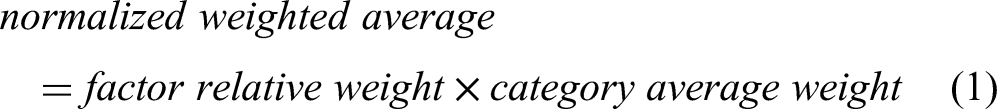
Then, the scores were expressed on a 1,000-point scale. In the above example, 4.41% is expressed as 44.1‰, rounded down to 44‰, or 44 out of 1,000, which is finally the High Performing rating level factor score. This process was repeated for all factors.
At this stage, we finalized a list of 27 environment factors across four categories shown in Figure 1, with their High Performing rating score, which is the maximum score that could be achieved on that factor. The High Performing scores sum up to 1,000 points. The bold text is the summary factor name. The categories and factors are arranged in order of importance. For example, Culture comes first in the list, because it was weighted by the participants as the category that has the highest relative impact on the EVMS environment versus the rest of the categories (the maximum scores are shown at the end of each category name and factor).
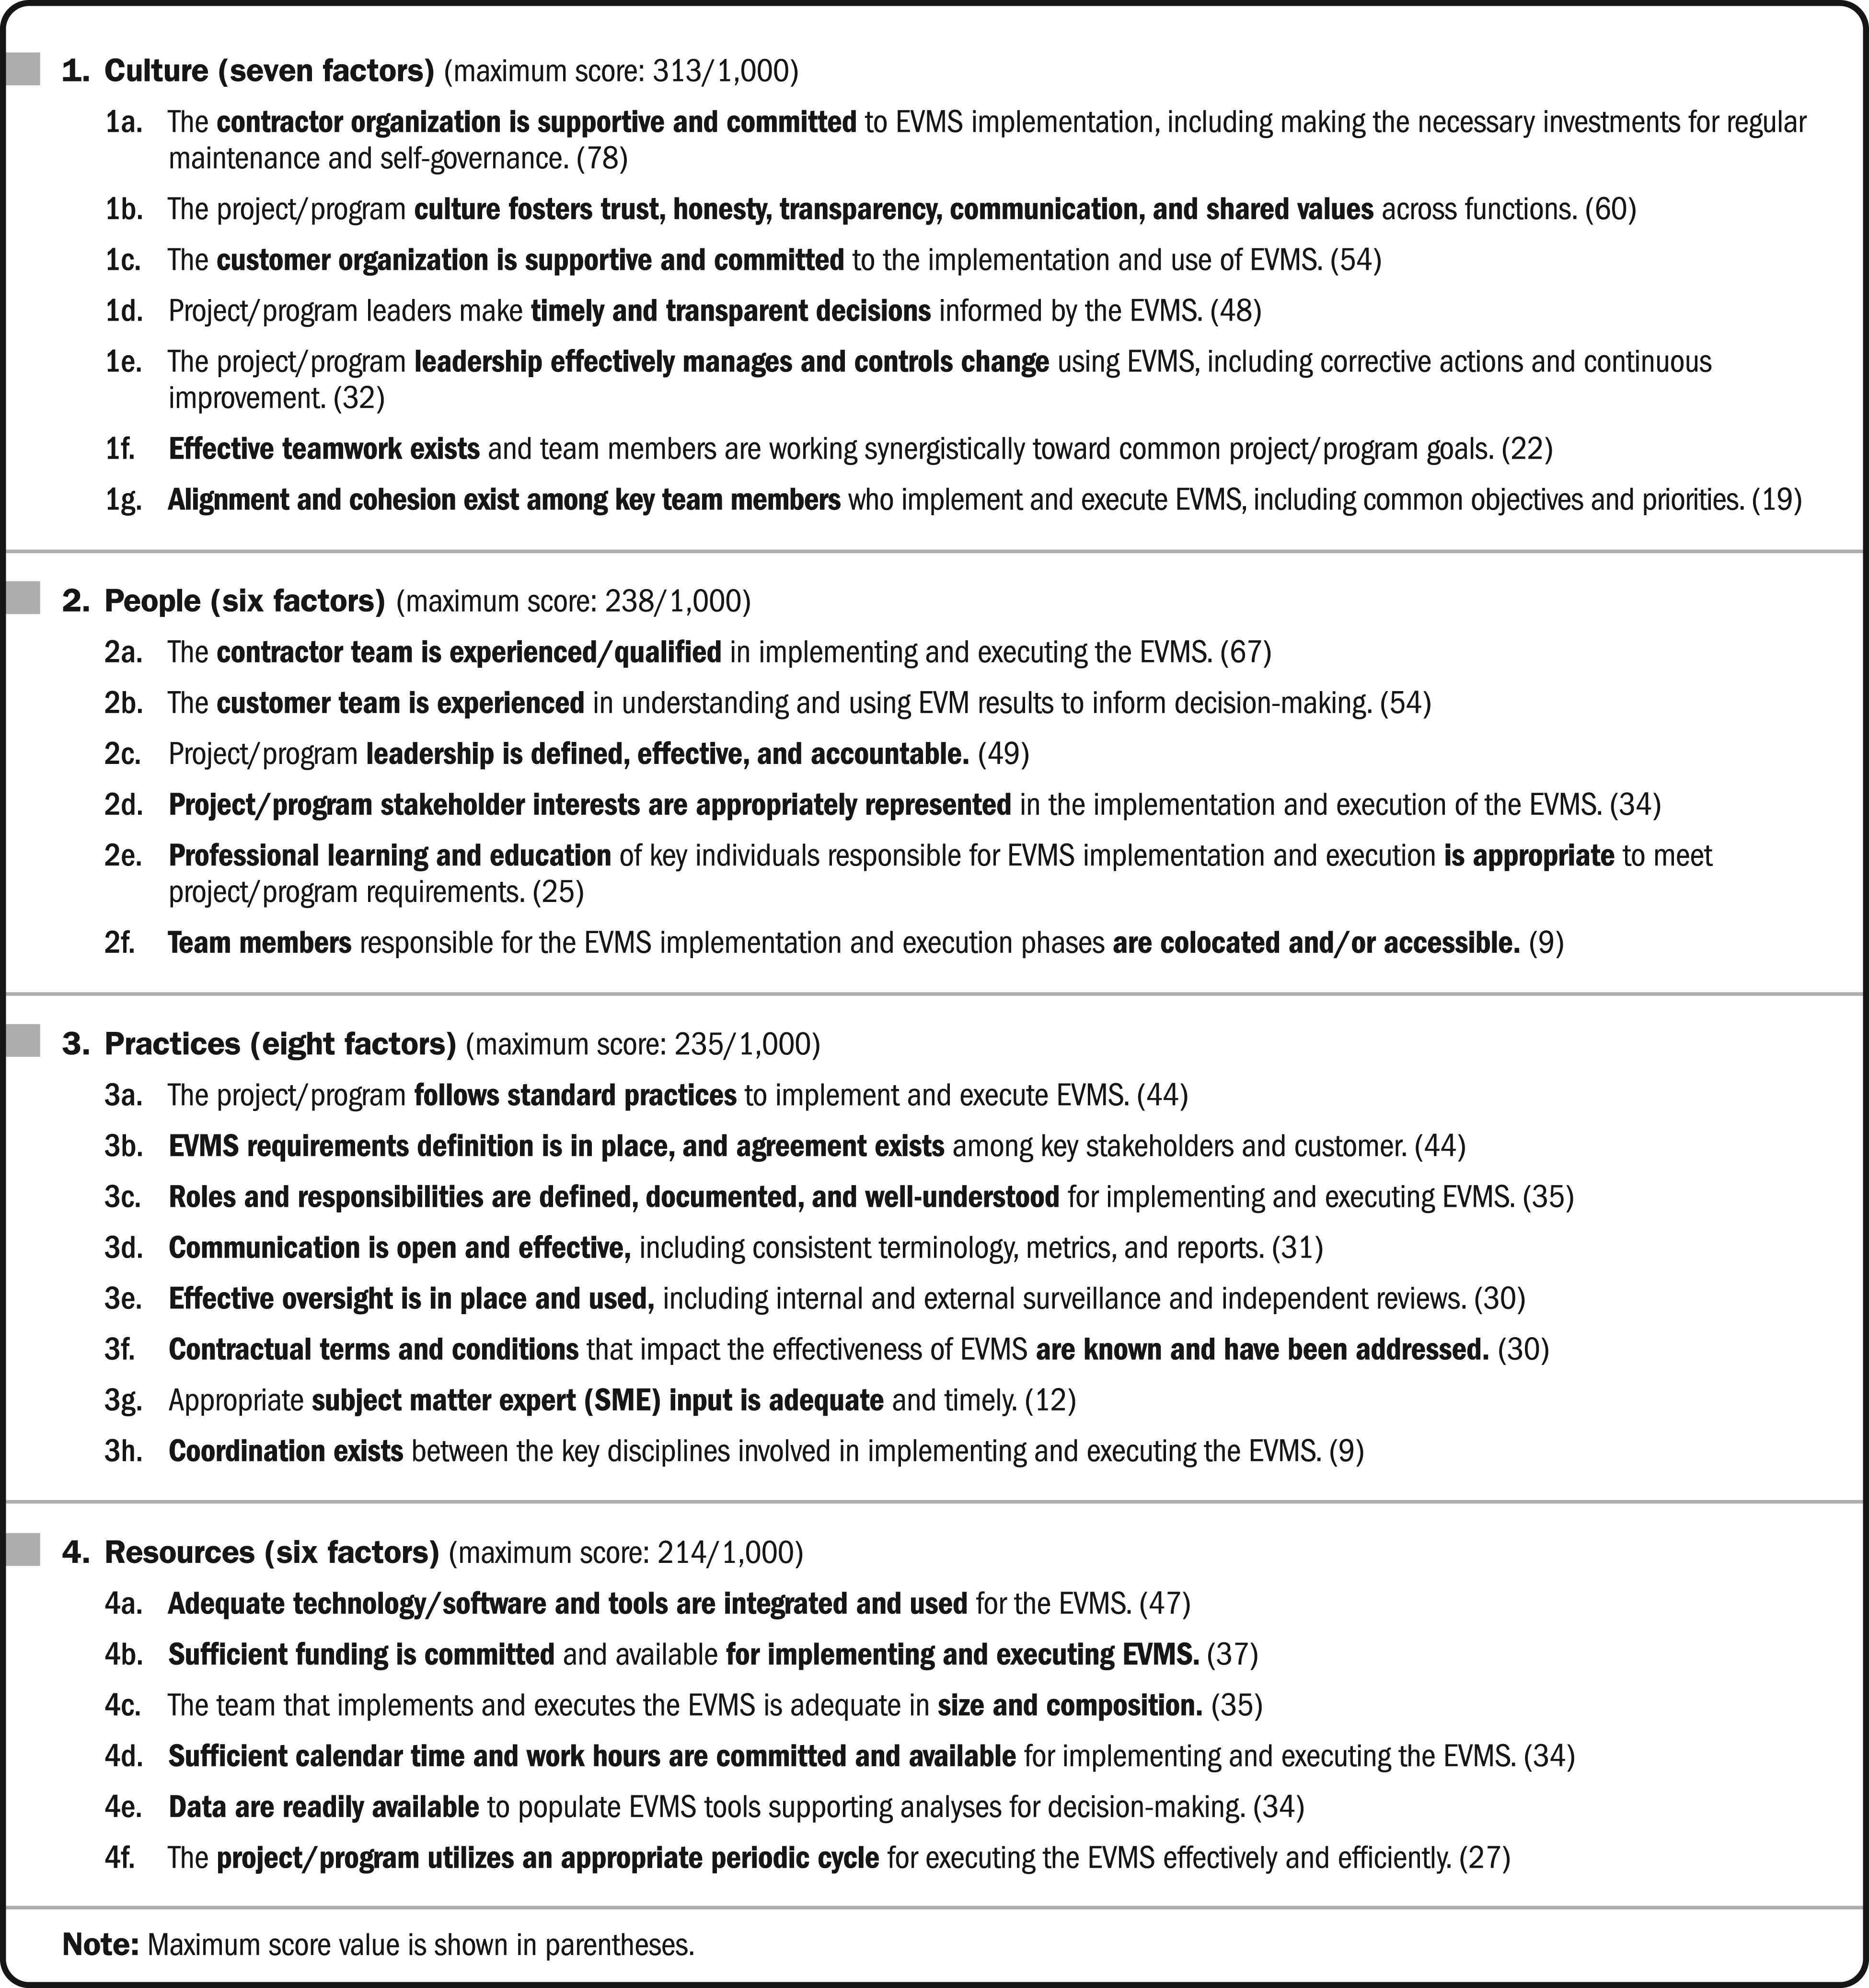
Environment categories, factors, and scores.
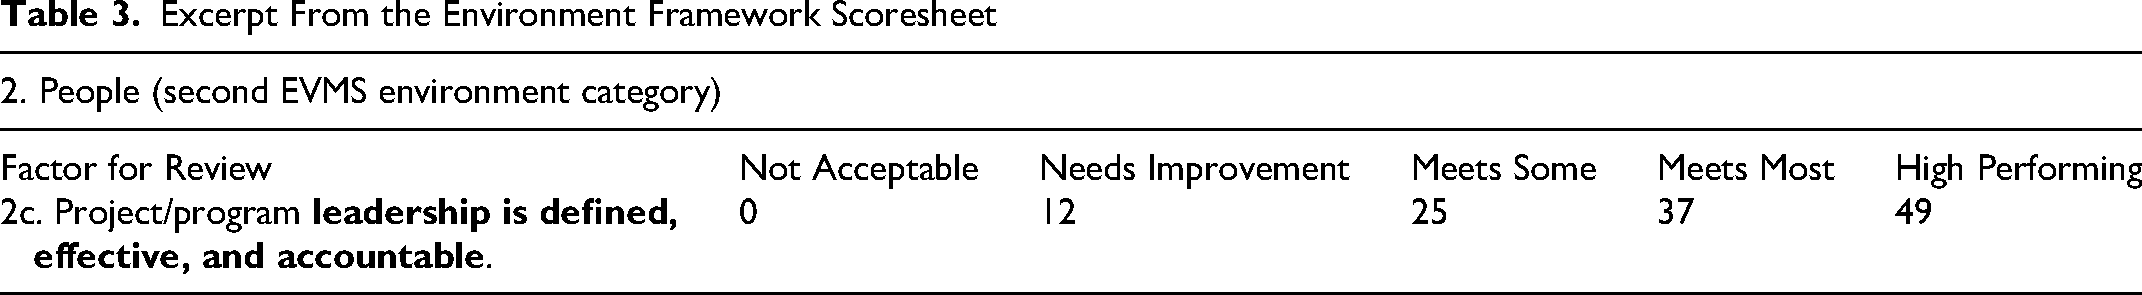
For each factor, the scores for the lower rating levels were calculated by linear interpolation between zero and the High Performing rating level factor score (Barron & Barrett, 1996). In this step, we finalized the scoresheets from the collected data and an excerpt is shown in Table 3. For instance, if a factor Meets Some of the criteria mentioned in the factor description, it receives the score of Meets Some, or 25 in this case.
Excerpt From the Environment Framework Scoresheet
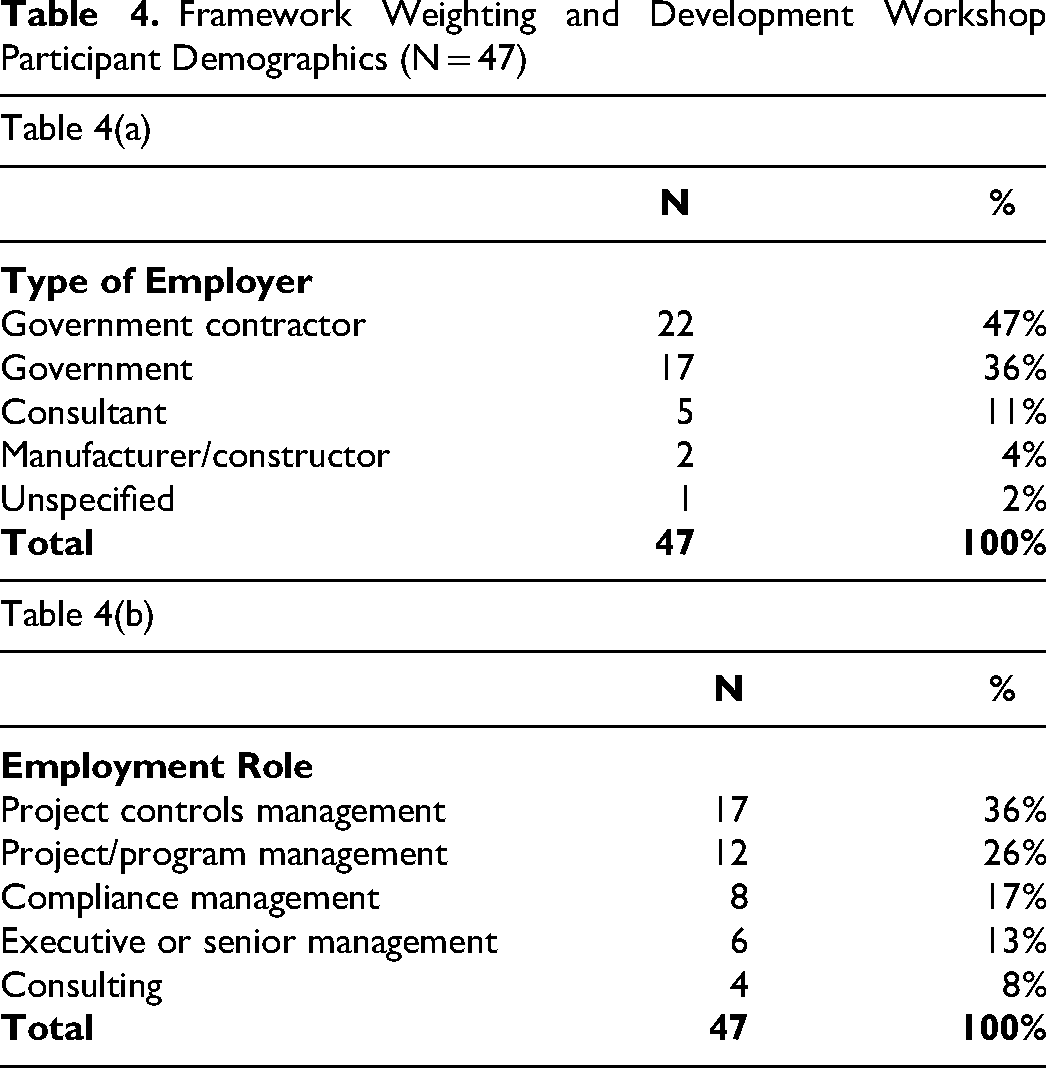
As a result of Step 2, the framework was developed in a unique manner, incorporating feedback from industry practitioners and refining it based on weights assigned by professionals. Dellinger and Leech (2007) equate such framework validation with quality improvement. This validation process increased the framework’s quality and reduced ambiguity, resulting in improved understanding among professionals (Rao et al., 1999). The total number of participants in the four workshops, excluding the authors and the research sponsor representative, was 47, with 10 participants in the first workshop, 11 participants in the second workshop, and 13 participants in both the third and fourth workshops. The workshop participant demographics are shown in Table 4. The data came from individuals with a wide variety of employment roles, adding multiple perspectives to the EVMS environment framework. Almost half of the individuals represented contractor organizations, which is valuable since the contractors are the primary implementers of EVMS on a project. Participants have an average industry experience of 19 years.
Framework Weighting and Development Workshop Participant Demographics (N = 47)
Step 3: Performance Workshops for Data Collection and Testing
Expert practitioners were invited to four additional virtual workshops to test the EVMS environment assessment framework. All the participants from the initial industry survey and previous workshops, as well as experts suggested by the research team, were invited to provide data. Data were collected from those who attended workshops, where the authors administered a Qualtrics questionnaire to capture data in real-time during the session. The questionnaire was developed with the support of the research team who provided insights from career-long experiences with EVM. During each workshop, participants rated the 27 factors individually as applied to their completed projects, retroactively looking back at 20% project completion, a comparable point in time selected based on the literature (Christensen & Templin, 2002; Christensen & Heise, 1993; Christensen & Payn, 1992). The questionnaire also collected from the participants their names, organizations, and contact information in case of the need for follow-up. Further data were provided voluntarily as follows.
Demographics: type of employer, employment role, years of experience working with EVM; Project information, in addition to name, scope, and location:
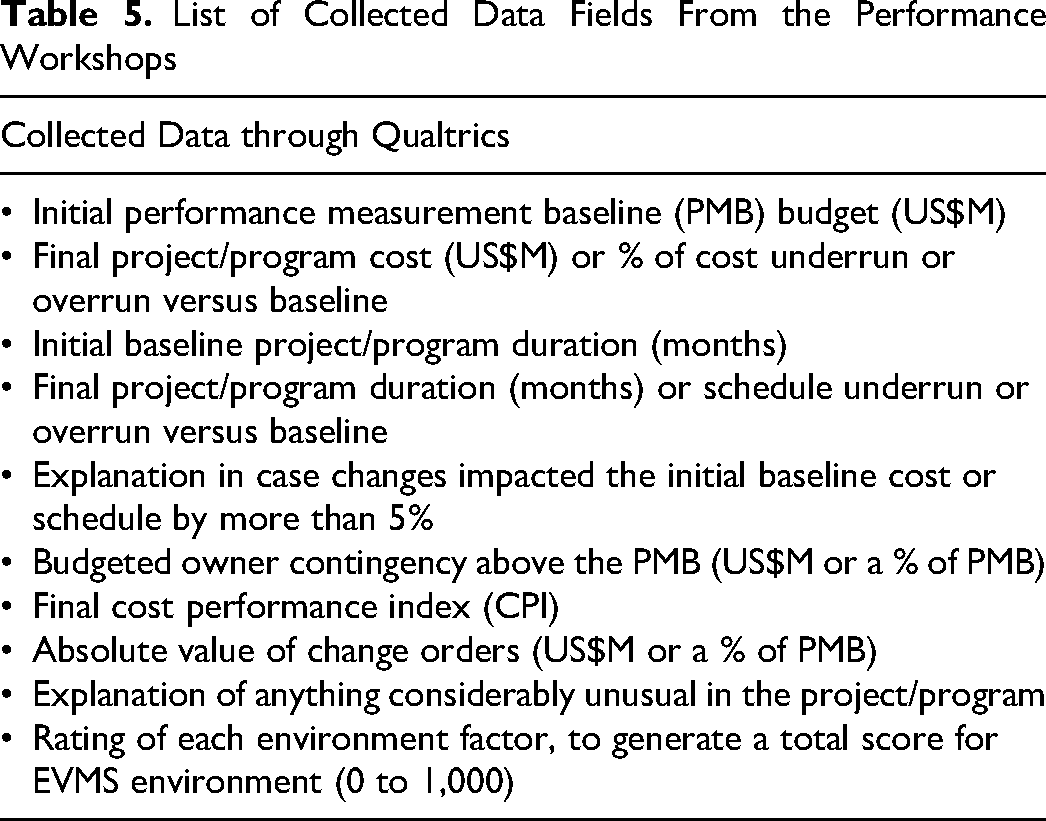
Whether the environment evaluation is for a project or a program. The perspective that the participant is bringing to the evaluation: owner, contractor, consultant, or other. Project performance-related information (Table 5), verified with the research team and modified based on their feedback and career experience. Assessment of each environment factor at 20% project completion. Note that the summation of all factors’ scores resulted in a single EVMS environment score (from 1 to 1,000 points, with higher scores being better).
List of Collected Data Fields From the Performance Workshops
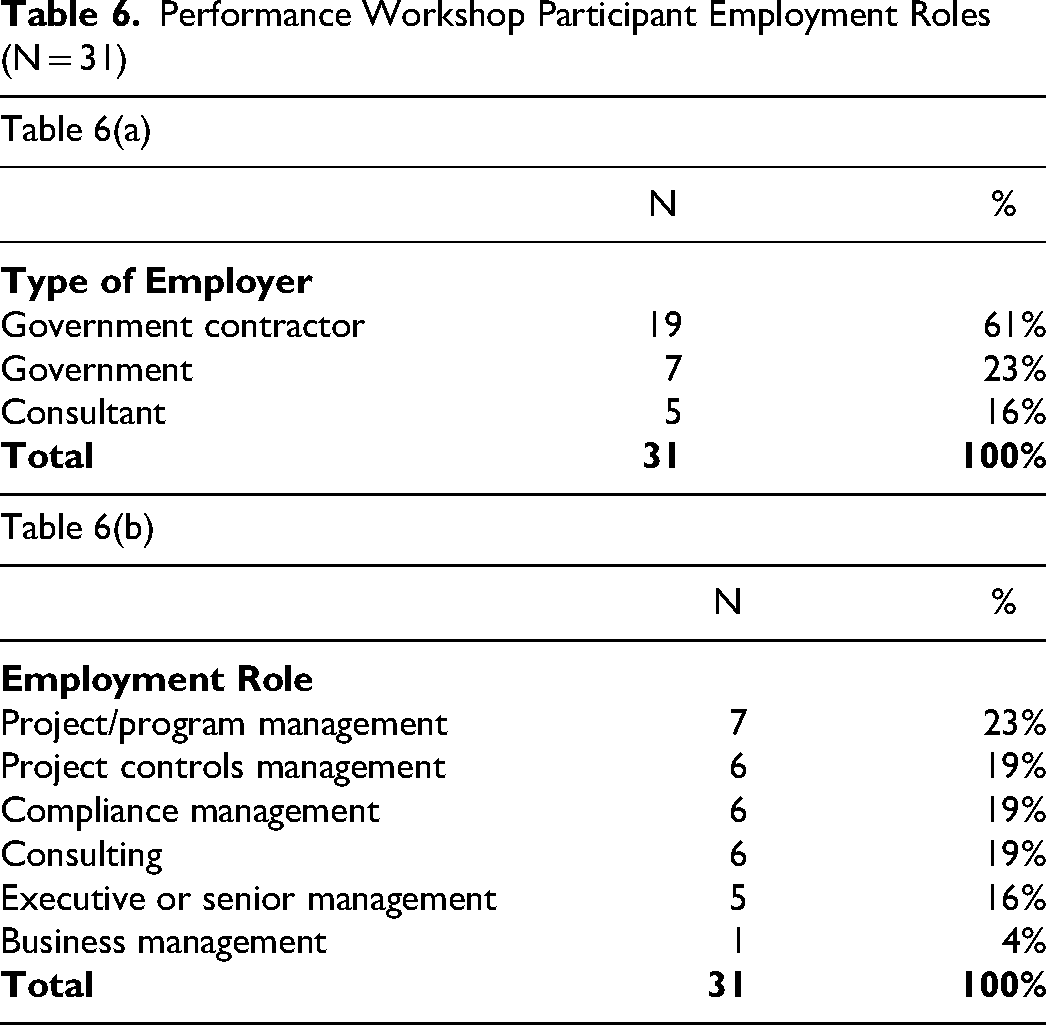
Overall, 31 individuals with an average industry experience of 19 years tested the framework and provided data from 35 completed projects through four facilitated performance workshops. The participants’ diverse employment roles are shown in Table 6.
Performance Workshop Participant Employment Roles (N = 31)
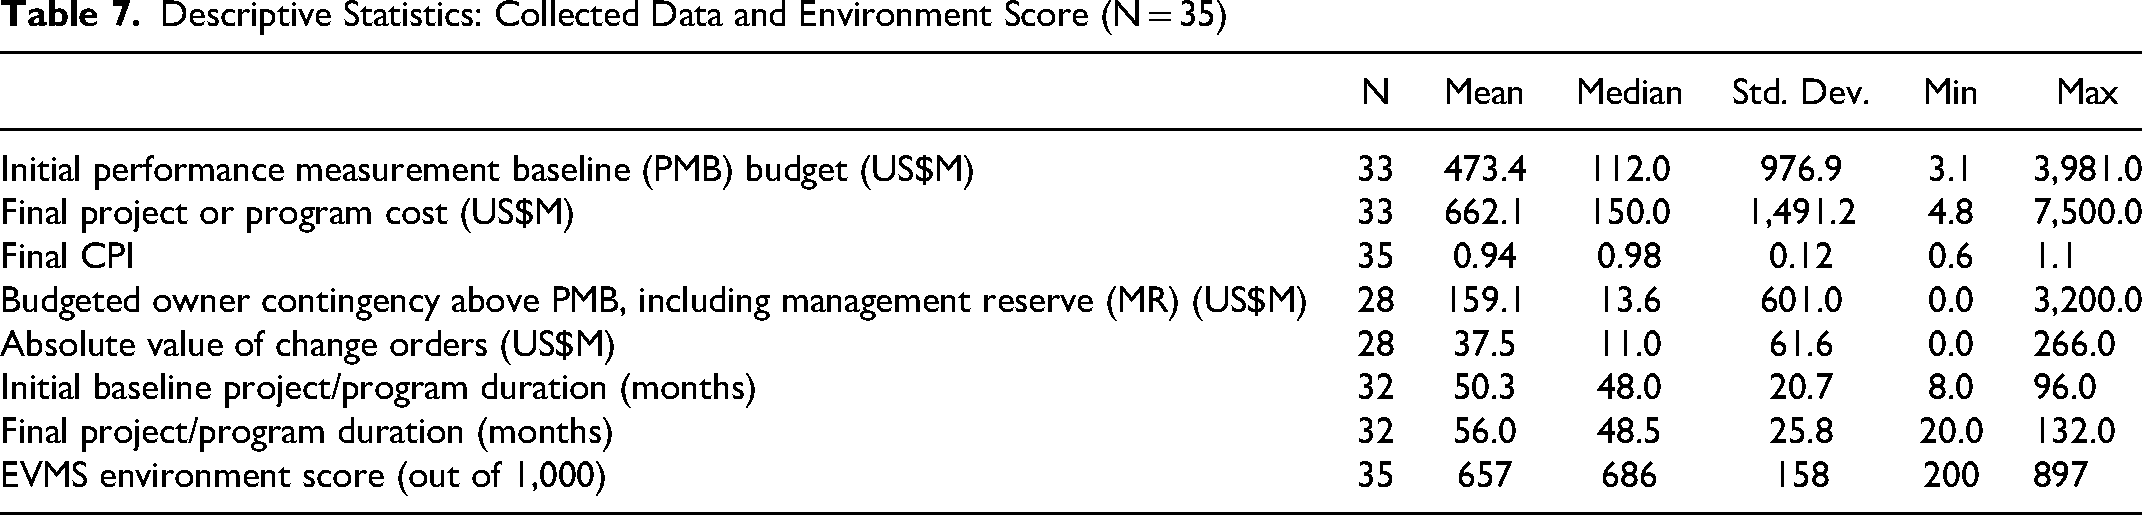
Some of the requested project information had missing data, as in some cases participants were not permitted to disclose values for their projects, and in others, data were not available. All available data were analyzed. Overall, data from 35 completed projects and programs (28 projects and 7 programs) were collected, totaling an approximate US$21,848 million in project costs and having an average of 56 months’ duration. The descriptive statistics of the collected data and environment score are provided in Table 7. These 35 projects and programs are located in 17 territories in the United States. They apply to a diverse array of industries: construction (34%), defense (26%), environmental (17%), software (9%), aerospace (9%), and science (5%). Their EVMS environment scores had an average of 657 (of a possible 1,000), ranging from 200 to 897. This indicates that the framework was able to measure the EVMS environment across a wide range of scores for this sample.
Descriptive Statistics: Collected Data and Environment Score (N = 35)
Step 4: Performance Data Analysis
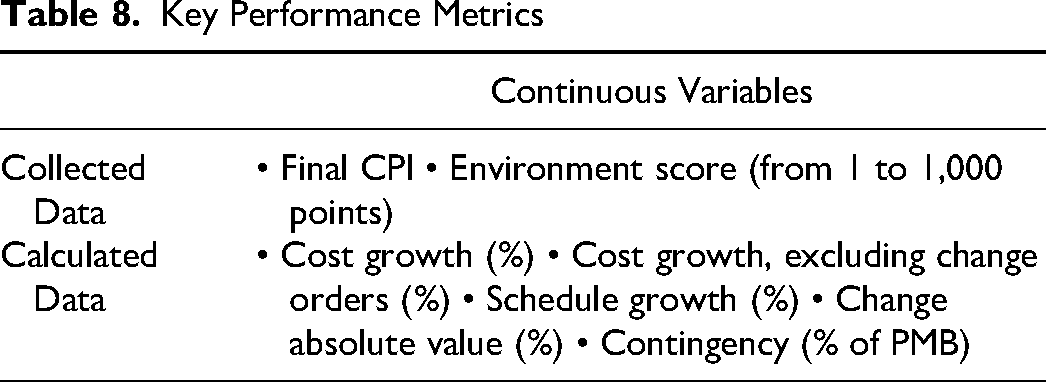
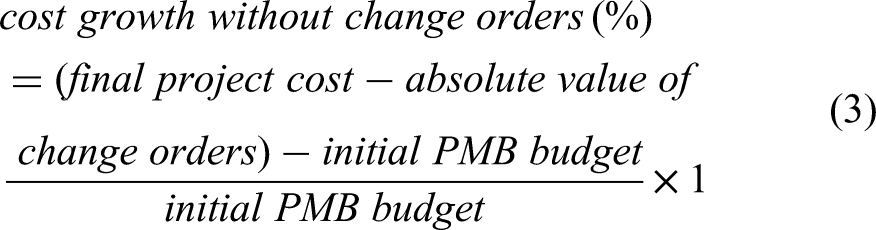
The data collected from the performance workshops were compiled and performance metrics were calculated (Table 8). Seven metrics were collected, including the EVMS environment score.
Key Performance Metrics
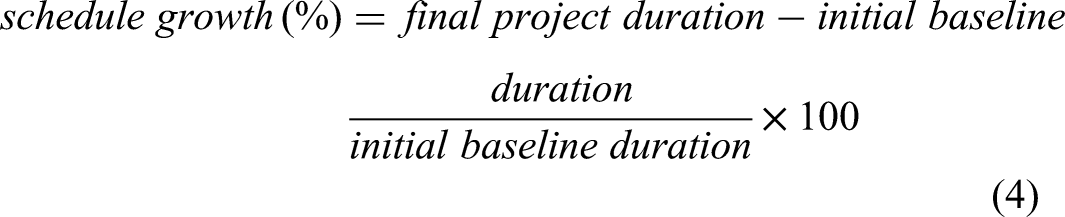
The five performance metrics were calculated using the following equations that were identified in the literature (Aboseif & Hanna, 2023; Yussef et al., 2019; Grau & Back, 2015):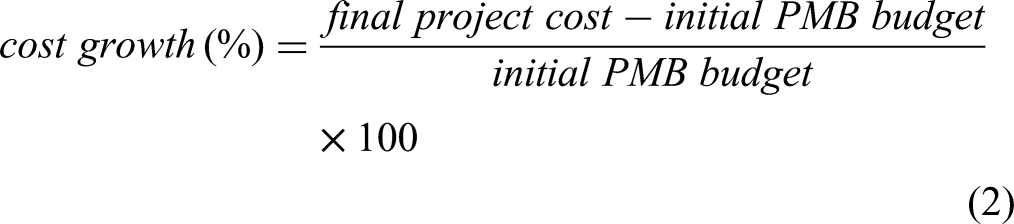


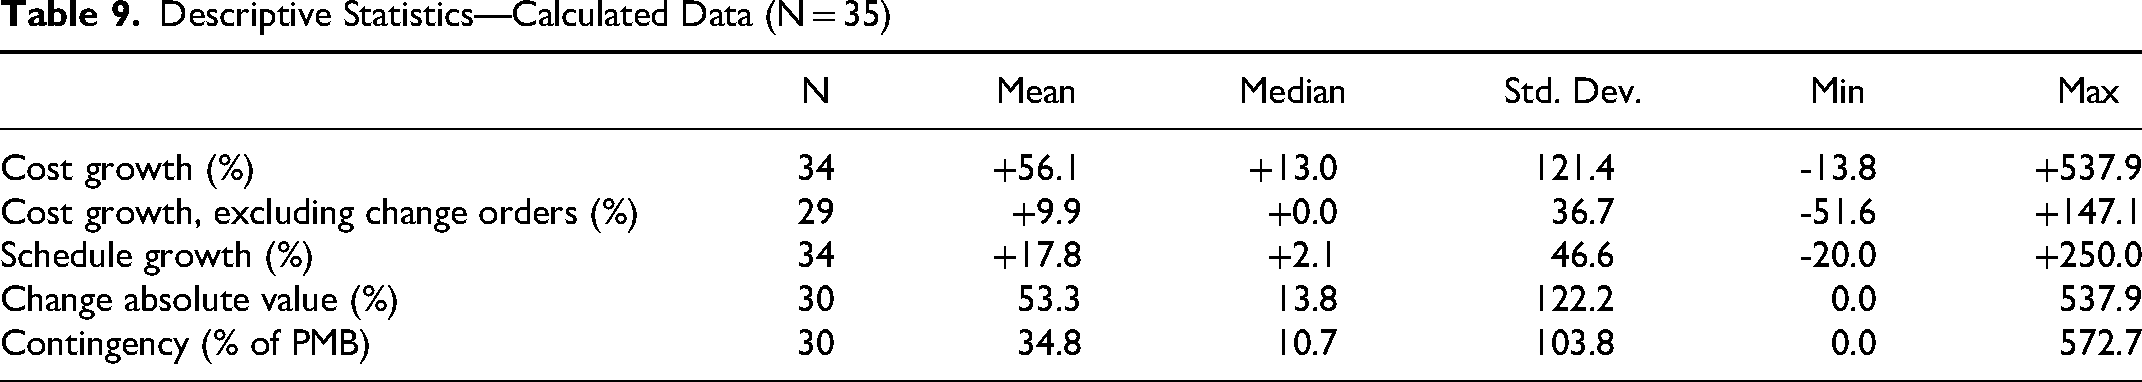
The descriptive statistics of the calculated data are provided in Table 9.
Once the data were compiled and the calculations performed, the authors proceeded with the statistical analysis. A stepwise analysis was first performed to set a score threshold between poor and good environment scores, as will be detailed later in the results section. This approach was adopted from the past literature to set maturity and accuracy score thresholds around the topic of front-end engineering design (FEED) (Yussef et al., 2019; El Asmar et al., 2018). Therefore, the projects were split into two subgroups, those with a “good” environment (GE) and those with a “poor” environment (PE). For brevity, we use the term
Descriptive Statistics—Calculated Data (N = 35)
Additional statistical analyses were performed, based on various data characteristics. First, the perspectives of project owners were compared with those of contractors and consultants. Second, the responses of participants with career experience greater than 25 years were compared with those of less experienced participants. Third, the EVMS environment scores of construction and environmental projects were compared with those of other project types (defense, software, aerospace, and science). As a final step, the authors analyzed the frequencies of the factors that were rated as Not Acceptable or Needs Improvement, as well as the frequencies of factors that were rated as Meets Most criteria and High Performing in the sample. The results of the latter are shared in the Appendix.
The remainder of this article is structured as follows: first, the article analyzes the EVMS environment framework. Then, the framework testing results are discussed, along with an analysis of the impact of the EVMS environment on project performance.
Analysis of the EVMS Environment Framework
As shown in Figure 1, showing the key results in the EVMS environment framework, the commitment of the contractor organization to EVMS implementation, including with regard to self-governance, represents the most important environment factor (factor 1a, score = 78). It is followed by the contractor team’s experience and qualification in implementing and executing the EVMS (factor 2a, score = 67) and the project’s culture of trust, honesty, transparency, communication, and shared values (factor 1b, score = 60). These key results match past research where lack of commitment and support for EVMS (Aramali et al., 2021; Zhan et al., 2019), poor culture (King, 2018), and lack of knowledge of EVMS (Kim et al., 2003) are identified as top barriers to effective EVMS application.
Interestingly, the only two factors that were explicitly attributed to the contractor organization represented the top two factors in the level of importance (factors 1a, score = 78, and 2a, score = 67). The reason for this is most likely that the contractor has the important task of generating the EVM results and presenting them to the customer. In contrast, the colocation and/or accessibility of team members responsible for EVMS (factor 2f) and coordination between key disciplines involved in implementing and executing the EVMS (factor 3 h) represent the environment factors that have the equally lowest score of 9 in terms of importance. Based on past literature, issues related to teamwork and coordination between members of key disciplines erode with improved leadership commitment and support (Jitpaiboon et al., 2019). Then, fixing the support and commitment to EVMS, which were found as the most important factors, may be able to help address these factors with the lowest scores. Based on the results, rating 10 factors as High Performing resulted in a score of 545 out of 1,000 (factors 1a, 2a, 1b, 1c, 2b, 2c, 1d, 4a, 3a, and 3b), which indicates the higher importance of these factors versus the remaining 17 factors.
Performance Results of the EVMS Environment Framework Testing
Environment Score Threshold
In order to allow for comparative analyses related to the EVMS environment, we determined a “threshold score” that segregates the sample into two subsets (those with “good” environment scores and those with “poor” environment scores), based on the most significant differences in performance outcomes. The median environment score for the sample was 686, which we initially considered as a potential threshold. Then, the stepwise sensitivity analysis was performed by arranging the EVMS environment scores from low to high along with their corresponding and available cost growth data. Then a comparative analysis was conducted, splitting the scores into two subsets successively and comparing the cost growth between these two subsets, starting with the lowest environment score, and stepping up to the next project’s environment score. This process was repeated, and each subset comparison generated a p-value (p). The p-values were plotted versus the EVMS environment score as shown in Figure 2.
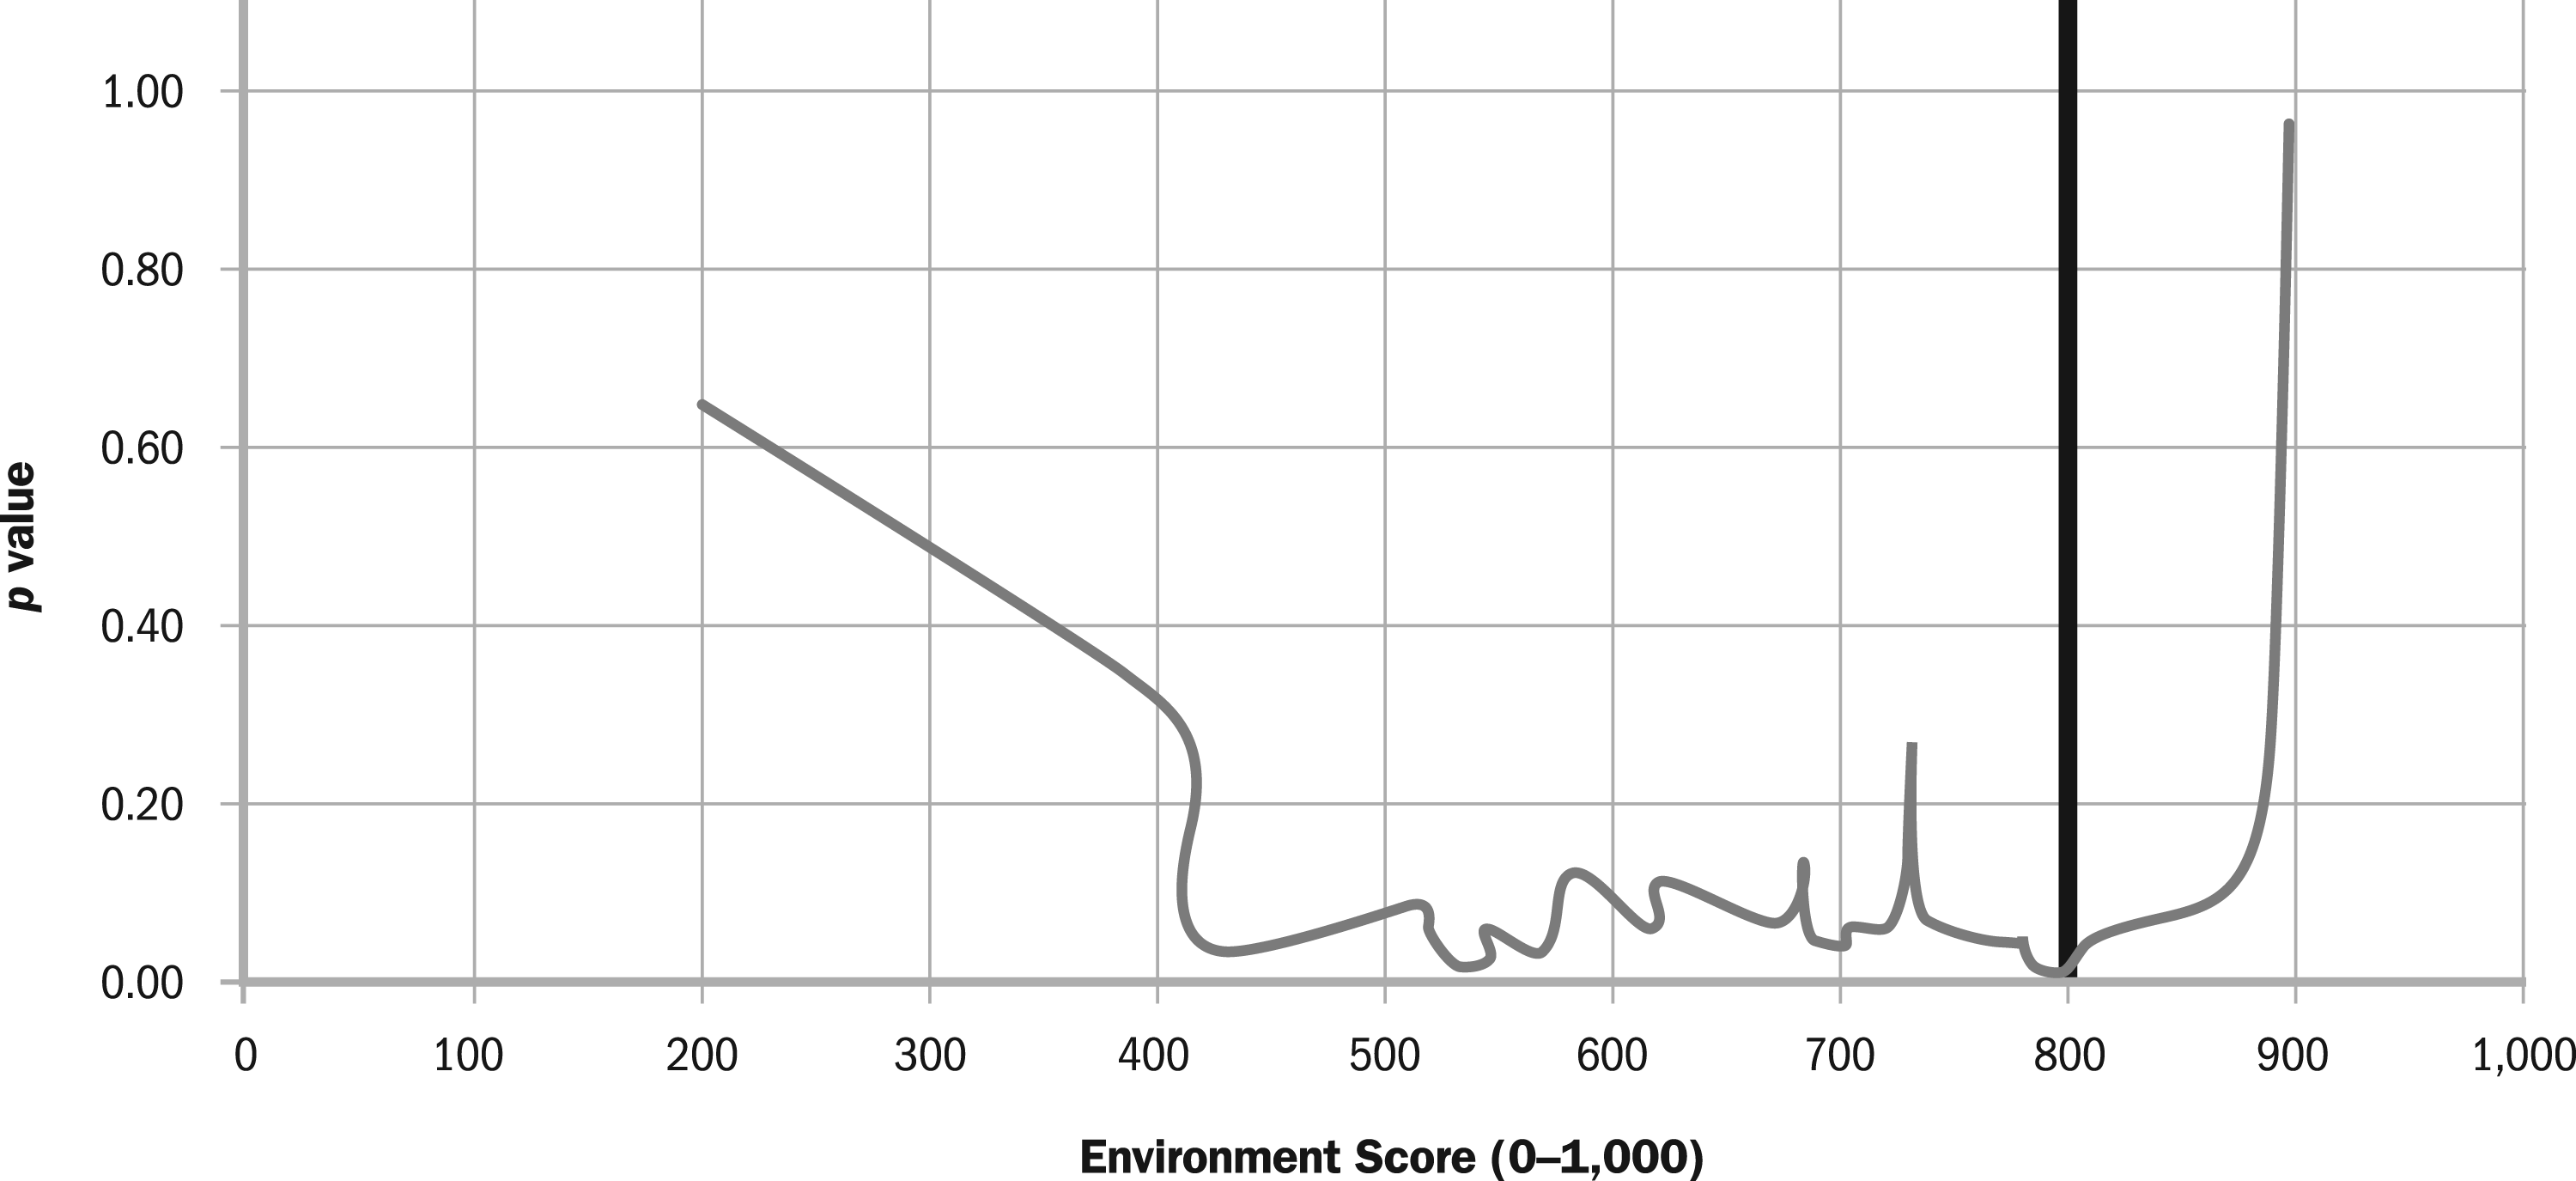
Stepwise sensitivity analysis results.
The lowest p-value of 0.0038 corresponded to an environment score of 794. This means that a score between 794 and 800 splits the projects into two subsets, resulting in the most statistically significant difference. We compared the project performance differences considering several thresholds, including the median score and the stepwise analysis results. After analyzing the data and feedback from the research team, we decided to set the threshold at 800 for practical reasons and in line with proven methods from the literature mentioned earlier. This threshold is indicated by the vertical bold line in Figure 2, where the projects with environment scores equal to and greater than 800 were considered to have “good” environment (N = 6), versus those with less than and equal to 794 (N = 29).
Analysis of the Performance Metrics
The impact of good and poor EVMS environment on the performance metrics is investigated: cost growth with and without change orders, schedule growth, change absolute value, contingency, and final CPI. Shapiro–Wilk normality tests were performed for each dataset. The results for these steps are presented in Table 10. Shapiro–Wilk normality tests showed that the GE project data followed a normal distribution for all the metrics and showed smaller subsample sizes ranging between four and six projects. Conversely, the PE project data failed the normality tests. Since the parametric test assumption of normality in one of the comparison groups failed, Mann–Whitney–Wilcoxon (MWW) tests were conducted that compare the medians of the metrics between the two subgroups, GE and PE (Corder & Foreman, 2014; McCrum-Gardner, 2008). Hence, the medians are calculated per subgroup (GE and PE), and the difference between the two medians is calculated, as shown in Table 10. The results showed a statistically significant difference between the two metrics. First, the observed differences between PE projects (median = + 21.0) and GE projects (median = –3.90) in terms of cost growth were statistically significant at the 0.05 level, U-value = 20.00, p = 0.004: the projects with high environment scores outperformed those with low environment scores by approximately 25% in terms of cost growth. Second, the differences were statistically significant at a 0.1 level, in terms of cost growth excluding change orders: isolating the impact of change orders on cost growth, the projects with GE have better cost performance (median = –3.20%) by 3.2% than PE projects (median = + 0.00%), U-value = 26.50, p = 0.053. No statistically significant differences were found in terms of schedule growth, absolute value of changes, contingency, or final CPI (p > 0.1).
Descriptive Statistics and Normality Test Results for Performance Metrics per Environment Subgroup
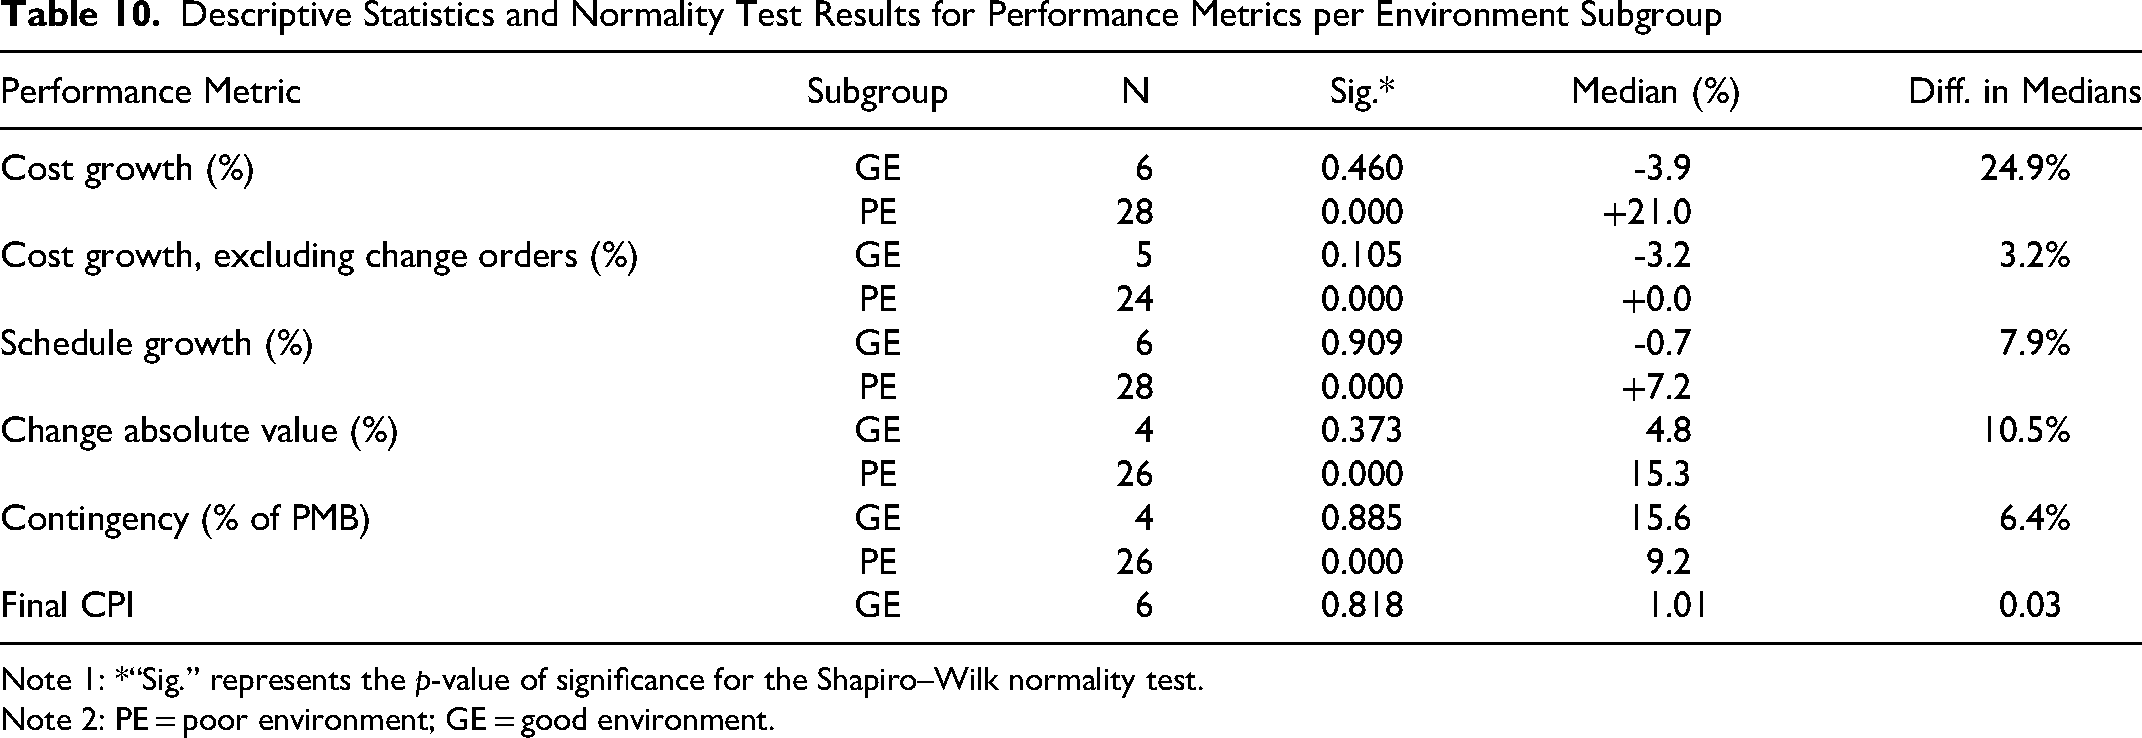
Note 1: *“Sig.” represents the p-value of significance for the Shapiro–Wilk normality test.
Note 2: PE = poor environment; GE = good environment.
Comparing the results with those of past studies that are closely related provides many insights. First, with respect to the impact of the EVMS environment on cost and schedule, the analysis of 40 mission projects by Emmons et al. (2007) showed that the majority of the reasons behind cost growth included factors that are related to management problems and inefficient use of resources needed to complete the projects on time. These reasons were related to the EVMS environment and deemed to be within the project’s management influence (Emmons et al., 2007). Second, lessons gained from the historical experiences within the project management domain show large cost savings resulting from effective teamwork, hiring experienced people, and effective resource planning (Cooper et al., 2002), all of which are environment factors included in this article. Based on the rationale of these past findings, addressing environment factors could reduce cost. Therefore, the results of this article are aligned with past research.
We also looked at past studies versus analysis results around the cost of changes (in absolute value), contingency, and final CPI, all of which did not lead to significant differences between PE and GE projects. First, change orders are found to be related to project characteristics and complexity and not to EVMS environment (Safapour et al., 2018; Kermanshachi et al., 2016). Second, the literature provides various guidelines for establishing contingency reserves (e.g., Emmons et al., 2007), therefore the projects in this sample seem to be well aligned with such guidelines. Finally, the CPI calculations result from forecasting processes and management actions do not directly impact CPI (Batselier & Vanhoucke, 2017). We think further indicators, such as forecasting and risk management processes, need to be examined relative to the impact of EVMS environment in relation to the final CPI in the sample.
Consistency in EVMS Environment Assessment
Differences in EVMS environment assessment when testing the framework were investigated in terms of perspective, career experience, and industry type of the 35 completed projects. Almost half of the projects were assessed from a contractor’s perspective (46%), and the remaining ones were assessed from an owner’s perspective (31%) or a consultant’s perspective (23%). When the scores were compared based on the assessor perspective, there were no statistically significant differences found in EVMS environment evaluation scores between owner perspectives (mean = 645, SD = 145) and others such as contractor and consultant perspectives (mean = 670, SD = 173). Concerning the career experience of participants who assessed their project EVMS environment, more than half of the projects (57%) were evaluated by individuals with less than 25 years of EVM experience, resulting in environment scores with mean = 675, SD = 130, and the remaining projects (43%) were evaluated by those who were more experienced, with mean = 630, SD = 191. No statistically significant differences were found when comparing EVMS scores based on career experience. Finally, we looked closely at the industry sectors of the projects. The environment scores were compared based on the industry type, and the results did not show any statistically significant differences in scores between construction and environmental projects (mean = 670, SD = 173) versus others, namely defense, software, aerospace, science (mean = 644, SD = 145). These results indicate that the evaluation of the EVMS environment was not influenced by the demographics of the evaluators (perspective, career experience, industry field).
Correlation Between EVMS Environment and Project Performance
We tested for correlation between the environment score and each of the performance metrics separately: cost growth with and without change orders, schedule growth, change absolute value, contingency, and final CPI. The correlation coefficient r varies between +1 and -1 and indicates the strength of the linear relationship between two tested variables (Sheskin, 2003). The results are shown in Table 11.
Pearson’s Correlation Test Results for Comparisons Between the EVMS Environment Score and Each of the Performance Metrics
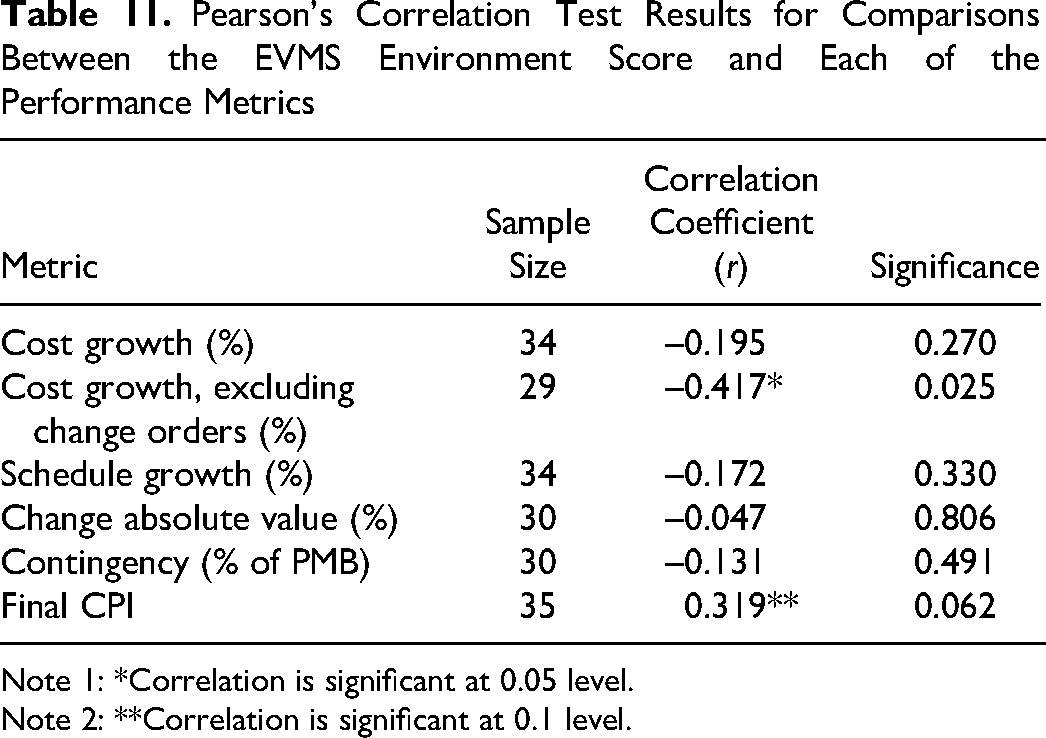
Note 1: *Correlation is significant at 0.05 level.
Note 2: **Correlation is significant at 0.1 level.
As shown, the correlation coefficients between the environment score and each of the cost growth, schedule growth, change absolute value, and contingency ranged from r = –0.195 to r = –0.047, indicating that a very weak and negative linear relationship exists between the environment score and each of these metrics (p > 0.05), and demonstrating weak reliability of the correlation. A significant, moderate, and negative relationship was found only between environment score and cost growth excluding the value of change orders (r(29) = –0.417; p < 0.05), whereas the relationship between environment score and final CPI was found to be weak, significant at 0.1 level, and positive (r(35) = 0.319; p < 0.1).
Summary and Discussion of Results
The development and the analysis of the EVMS assessment framework validated the first two research hypotheses. (1) An EVMS environment can be well defined and agreed upon—as the industry practitioners showed a supportive attitude toward the research and provided valuable feedback to define each factor so that it added value to the EVMS practice. They also agreed on the practicality of the framework. (2) An EVMS environment can be measured—as the efforts resulted in an assessment of 27 factors, inclusive of the relative weight of each factor. These factors were measurable through the assessment scoring system. To test the third hypothesis (3), that EVMS environment is correlated with project performance, data from 35 completed projects were collected and a series of analyses performed. The stepwise sensitivity analyses showed that the projects that have an effective environment in place have scores above 800 in the sample. This threshold split the projects into two subgroups: those with good environment scores versus those with poor scores. The statistical analysis between them showed a statistically significant difference in two metrics: cost growth and cost growth excluding change orders. The correlation analysis between the environment score and the performance metrics showed weak to moderate correlation in two metrics: cost growth excluding the value of change orders and final CPI metrics.
We think that the project performance seems not to be solely dependent on the dimension of environment based on the statistical analysis results: a better EVMS environment was associated with lower cost growth; however, many other performance metrics were not impacted by it. The reasons behind this finding could be traced from past studies. According to past annual reports on program outcomes, the weapon programs persistently reported undesirable project outcomes where high cost and schedule growth were due to business processes that have low maturity (GAO, 2021). According to the Project Management Institute’s 2018 report and research over six years, the top drivers of project success include the maturity of project delivery capabilities that lead to better project performance (PMI, 2018). Many past studies have also found that maturity in project management is an essential element in cost savings and competitiveness (e.g., Yazici, 2009). Customers were more satisfied and higher business returns were experienced when process maturity assessments supported the projects (Goldenson & Gibson, 2003). Therefore, there seems to be a complementary piece that needs to be investigated for these projects; past research suggests that the maturity of processes is an additional dimension that also impacts project performance as introduced earlier in the article (Aramali et al., 2023), therefore testing this hypothesis in concert with environment would add value to this investigation.
Conclusion and Future Work
We presented a novel EVMS environment assessment framework and investigated the impact of an EVMS environment on project performance in terms of six performance metrics. The article’s key contributions to the body of knowledge include definitions of key environment factors for effective earned value management systems and quantifying the impact of an EVMS environment on project performance, where a project that demonstrates a better environment could save up to 25% in terms of cost growth versus its performance measurement baseline.
The framework was developed with the help of a research team of 36 EVMS industry experts, based on a literature review, an industry survey, and feedback from 47 industry professionals with an average industry experience of 19 years, through four workshops. The results identified 27 critical environment factors that make up the EVMS environment, classified into four categories. Rating the factors results in an overall project EVMS environment score (out of a possible 1,000). Akin to a team sport, the Culture category was found to be critically important in terms of its high impact on the EVMS environment, followed by People, Practices, and Resources. The results demonstrated that the three most important factors were: (1) contractor support to EVMS; (2) contractor experience and qualification in EVMS; and (3) a culture of trust, honesty, transparency, communication, and shared values.
The framework was then tested on 35 completed projects totaling US$21.8 billion, using data from 31 individuals with an average industry experience of 19 years, obtained through four performance workshops. The assessment resulted in an average of 657 environment score and a median of 686 out of a possible 1,000 points, indicating that there is an opportunity for improvement in EVMS environment at least for this sample. The stepwise sensitivity analysis of this sample determined that the score threshold between projects with a good environment (GE projects) or a poor one (PE projects) is 800. These two groups were statistically compared in terms of six performance metrics. With a better EVMS environment, organizations could realize cost savings of up to 25% despite a large number of change orders. Another important finding was the need to investigate EVMS maturity, revealed by past studies as having a potential impact on EVMS. Also, the EVMS environment assessment was deemed credible without specific influences, in terms of the assessor (owner versus contractors and consultants), the career experience, and the industry type of the project. Finally, guidelines for professionals on how to set up a good EVMS environment are shared in the Appendix.
A few limitations exist in this study. When analyzing cost and schedule growth, we did not isolate possible reasons related to technical scope and/or unrealistic cost and schedule estimates. A causality between the EVMS environment and project performance could not be established. The framework was tested on completed projects that were all located in the United States, which made the study regional rather than global. Furthermore, the framework was tested through self-evaluation, where a completed project was evaluated by an industry expert or a team of experts who had been closely involved with the project until completion. We ensured clarity with the evaluator(s) by emphasizing the selection of projects in which they had been significantly engaged and possessed comprehensive knowledge of all pertinent details. While the evaluator(s) may have had biases based on their role(s), the final outcomes of each completed project were documented and quantified, and the evaluator assessed the EVMS environment of the project retrospectively. To this end, we sought to collect a large data sample from a diverse group of respondents representing both project owners and contractors. Furthermore, our findings showed that the evaluation was consistent, irrespective of whether the evaluator held the role of an owner or a contractor. The resultant sample included projects with both poor and good EVMS environments.
Previous research using self-evaluation or self-rating across various contexts has provided valuable insights despite potential biases. For instance, Gouvinhas et al. (2016) applied self-evaluation to elevate sustainability maturity within engineering companies; Yussef et al. (2019) validated a front-end engineering design framework through self-evaluation; and Ringen et al. (2018) employed self-rating to assess construction safety culture. In the future, an opportunity lies in delving more deeply into understanding the relationship between self-evaluation in framework validation and its impact on the research outcomes, to potentially improve the research findings. Moreover, collecting project/program data points from different samples of project teams (contractor and owner), and conducting the analysis for each set of project teams, can support the findings and reduce bias that may be introduced by self-ratings.
When this framework is put into in practice, an EVMS environment assessment asks a number of project participants to gauge the same project anonymously in order to identify the real issues related to its environment. Alignments are noted, and misalignments are also uncovered. This is actually how the tool is currently being used by several organizations, including large government organizations, with positive feedback on the manner in which the EVMS environment is able to be assessed using this framework, in part because these multiple anonymous evaluations help provide a more accurate picture of the most important issues, many of which were not uncovered prior to the assessment. Therefore, the framework is recommended for use on ongoing projects using multiple evaluators and an overall analysis of their anonymous inputs. At the time of this writing, this framework was also being tested on a number of large ongoing projects with the participation of multiple team members, and the results are consistent with what has been found and documented in this article.
Finally, the findings are representative of the studied data pool and may not represent every project outside this sample. However, the resulting framework remains valid and can be applied to further projects. To address any limitations related to sample size, the authors’ future work is expected to include collection and analysis of more data from an even larger sample of projects.
The findings of these research efforts will assist in addressing various risks that lead to poor project performance in an integrated project/program management, viewing EVMS as a socio-technical system. This research also helps stakeholders identify the key most impactful environment components of EVMS, leading to improved project performance.
Footnotes
Acknowledgments
We would like to thank the U.S. Department of Energy for supporting and funding this study through a project entitled “Improving the Reliability of EVMS Compliance Reviews and EVMS Maturity Level Assessments.” We also would like to thank all the government and industry professionals participating in the research team for their valuable input throughout the research process.
Author Biographies
Appendix: Guidance and Recommendations to Practitioners
By identifying key environment factors, the authors provide practitioners with guidance to assist them in setting up an effective environment. The key environment factors are identified by listing the top five poorly rated and well-performing environment factors from the sample of the 35 completed projects.
The five most poorly rated environment factors (Table A12) in the sample involved both the customer and contractor. The relevant issues are: lack of demonstrable support for EVMS implementation (factors 1a, 1c), weaknesses in decision-making (factors 2b, 1d), and weaknesses in oversight (factor 3e). This result generally agrees with industry survey results by Aramali et al. (2021) in which 277 industry practitioners ranked leadership support, timely decision-making, and compliance reviews as the top three challenging aspects when using EVMS.
The projects that had high EVMS environment scores in the sample demonstrated success in the top five key environment factors shown in Table A13.
More information about each one of these factors is provided by Aramali et al. (2022b). We recommend that the project team discusses them before the start of a new project. Open communication and proactive actions around environment factors are key. Tracking the environment score throughout the project life cycle is another strategy we suggest. It allows identification of the gaps that exist in the EVMS, leading to opportunities for continuous improvement.