
Abstract
Objective:
The aim of this study was to determine the extent of agreement on the measured echographic ejection fraction measured by emergency medicine (EM) residents compared with a cardiologist.
Materials and Methods:
This study was conducted with cardiac patients admitted to a hospital emergency department in Tehran, Iran. A total of 156 patient cases were reviewed. A group of trained EM residents evaluated the ejection fraction (EF) of these patients utilizing three different methods: Simpson’s method (N = 50), E-Point Septal Separation (EPSS, N = 56), and a visual technique (N = 50). A final assessment was made for all patients by a cardiologist.
Results:
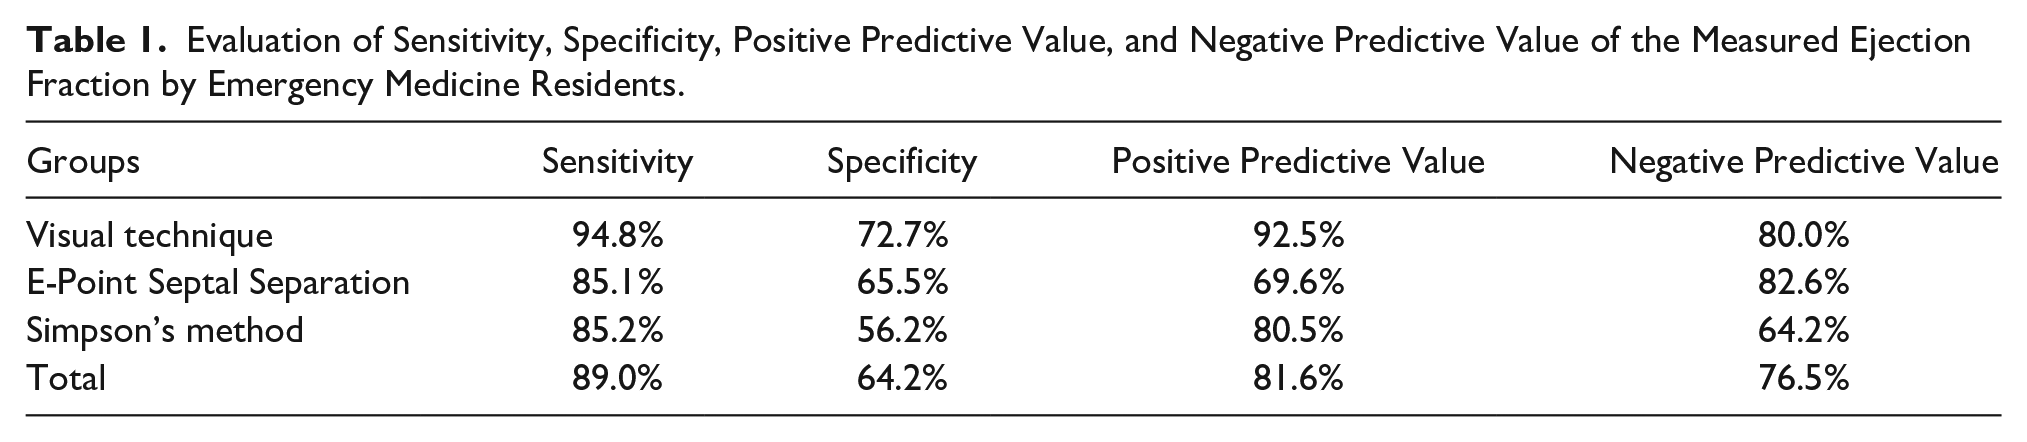
In 69.3% of these patient cases, there was a significant correlation between the EM residents’ report and the cardiologists, with Cohen’s Kappa coefficient of .746 (P < .001). The Kappa coefficient for the visual technique, Simpson’s method, and EPSS was .697, .467, and .487, respectively. The sensitivity, specificity, positive and negative predictive values of EF measurements, provided by the EM residents, were 0.89%, 64.2%, 81.6%, and 76.5% compared with the cardiologist, respectively.
Conclusion:
This description study was done to determine the agreement of echocardiographic measurement of EF, assessed by trained EM residents, compared with a cardiologist’s review. In this case, the results demonstrated moderate to good agreement.
Keywords
In this recent decade, the mortality rate caused by cardiovascular diseases has increased drastically in Middle Eastern countries compared with other parts of the world. Studies have also revealed that the mortality caused by cardiovascular disorders in the Middle East increased by 171% from 1990 to 2020. The epidemiological studies in Iran and the United Arab Emirates reflect an estimated prevalence of 5.9% for cardiovascular diseases in the future. 1 In response to this rise in cardiovascular disease, goal-directed, emergency medicine departments (EDs) have used a point-of-care ultrasound (POCUS) curriculum to try to increase a physician trainee’s self-confidence and performance. 2
As the most important indicator of cardiac function, obtaining the cardiac ejection fraction (EF) is vital in deciding on an at-risk patient’s clinical management, daily clinical examinations, and ultimate prognosis. 3 The cardiac EF serves as reliable evidence of total heart function, and changes in EF can indicate various congenital and acquired heart disorders. 4 The advantages of obtaining this measurement include easy implementation, safety, the minimal need for preparing the patient, repeatability, noninvasiveness, and cost-effectiveness. Hence, physicians highly use echocardiography a noninvasive diagnostic tool to measure EF. 5
A heart attack or other cardiac disease can negatively influence the EF. 6 The accurate assessment of left ventricular ejection fraction (LVEF) is essential for managing patients with acute diseases, such as those with chest pain, cardiogenic shock, or severe respiratory distress. 7 Physicians who are not cardiologists can learn to conduct a basic echocardiogram and assess cardiac EF. 8 An echocardiogram allows emergency medicine (EM) physicians to obtain diagnostic information on many acute cardiovascular diseases, such as tamponade, pulmonary embolism (PE), cardiogenic shock, and cardiogenic pulmonary edema. 9 Currently, the rapid ultrasound for shock and hypotension (RUSH) examination can be conducted in the ED, at the bedside of critically ill patients, to determine the cause of cardiogenic shock. This exam includes an assessment of EF, while can assess cardiac function and the probability of PE, tamponade, and pericardial effusion.8,10 However, only a few studies have been conducted to validate the accuracy of EF calculations in the ED. Therefore, this study was composed to determine the reliability and potential accuracy of these measurements, made in the ED. To this end, a reliability and accuracy test was conducted, of the echographic EF measurements, made by EM residents compared with a cardiologist.
Materials and Methods
Study Design
This study was designed to determine concordance between diagnostic test results and a gold standard. The study design was presented to the Ethics Committee of Iran University of Medical Sciences and was approved (ethics code: IR.IUMS.FMD.REC.1398.070). After providing a complete explanation of the study, informed written consent was obtained from all patients. It was important stress to the patients that participation in the study was optional and medical services would still be provided regardless of their willingness to participate in the study. There were no additional expenses charged to the patient for additional interpretations. The researchers abided by the Helsinki Convention principles during this study. Each patient provided verbal consent and was assured of medical confidentiality.
Study Cohort and Sample Size
This study was conducted, in 2020, with qualified patients between the ages of 18 and 80 years of age and presenting with dyspnea, to the ED at Rasoul Akram Hospital. Exclusion criteria included those patients who were intubated, pregnant, elevated cardiac biomarkers, hemodynamically unstable, and patients with atrial fibrillation. These exclusions were made due to the possible influence on echocardiographic EF measurements.
In this study, sample measurements were gathered using a convenient sampling technique. A total of 156 participants were enrolled in the study.
Measurement Technique
In this study, five senior EM residents received theoretic content (4 hours) and practical training (5 hours on 15 patients) from a skilled and experienced echocardiologist.
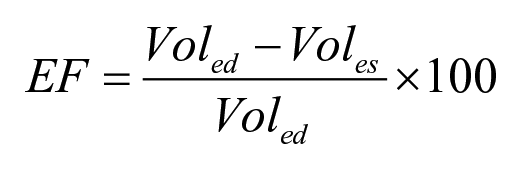
Following the referral of patients, eligible individuals underwent an echocardiogram that was conducted on a Samsung HM70A ultrasound equipment system (Samsung Healthcare.com). Each EM resident measured the LVEF using one of the following three diagnostic methods: Simpson’s method, E-Point Septal Separation (EPSS), and a visual assessment. Simpson’s method requires tracking the endocardium in apical four-chamber and two-chamber views, during end-systole and end-diastole. The left ventricle’s end-diastolic volume (EDV) and the end-systolic volume (ESV) were calculated. Afterward, the left ventricular EF is calculated via the following formula
Normal function is defined as an EF of more than 55%. Mild dysfunction is an EF between 45% and 54%. Moderate and severe dysfunctions are considered 30%–44% and less than 30%, respectively.
The EPSS is an M-mode method measured in the parasternal long-axis (PLAX) view. The shortest distance between the apex of the anterior leaflet of the mitral valve and the ventricular septum is measured in millimeters, called EPSS. A distance less than 8.0 mm is defined as a normal function (EF >55%), between 8 and 14 is mild dysfunction (EF = 45%–54%), between 14 and 17 is moderate dysfunction (EF = 30%–44%), and more than 17 is considered as severe dysfunction (EF <30%).
Using a visual method (sometimes referred to as “eyeballing”), the EF was estimated based on personally detecting LV contraction in the PLAX view. Each resident looked for an inward movement of the endocardium, thickening of the myocardium, the motion of the anterior mitral valve leaflet, and geometry of the left ventricle (e.g., size and aneurysms). This method classified dysfunction in comparison with Simpson’s and EPSS method of measurement.
Finally, a cardiologist assessed all the patients using the same offline approach and device to assess the LVEF. The cardiologist’s report was considered the diagnostic gold standard for interpretation. It is also worth noting that the cardiologist was unaware of the results reported by the EM residents. Also, one cardiologist conducted all the echocardiographic readings. There was a maximum interval of 1 hour between two echocardiography examinations conducted by the EM resident and the cardiologist. As mentioned, all patients were in stable condition, and two echocardiograms did not hinder or postpone the diagnostic or therapeutic measures. All the cardiac function information was recorded as well as their age, gender, blood pressure, heart rate, respiratory rate, and body mass index (BMI). These data were all collected on a predesigned checklist. Finally, all data points were analyzed statistically.
Data Analysis
The analysis was conducted using SPSS statistical software (IBM Corp., Armonk, NY, USA). The quantitative data were descriptively defined by the mean and standard deviations. The qualitative data were described using percentages and frequency. Cohen’s Kappa coefficient, Mann-Whitney U test, and Spearman’s correlation tests were performed on this data set. The diagnostic sensitivity, specificity, positive and negative predictive values of the resident’s measured EF were preformed (see Table 1). As previously mentioned, the reported measurements made by the cardiologist were considered the diagnostic gold standard. The statistical significance was set a priori at P < .05.
Evaluation of Sensitivity, Specificity, Positive Predictive Value, and Negative Predictive Value of the Measured Ejection Fraction by Emergency Medicine Residents.
Results
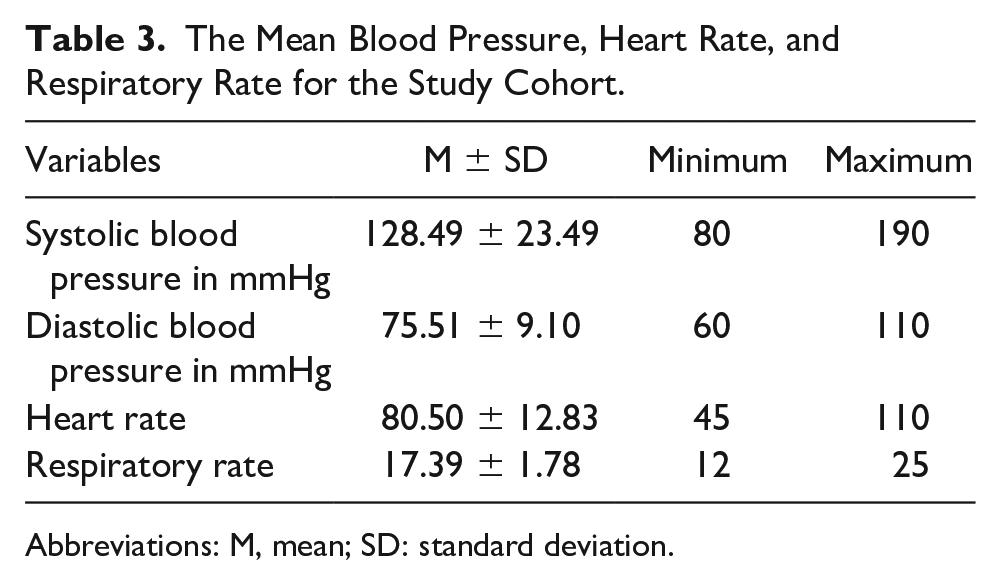
The aim of this study was to determine the extent of agreement on the measured echographic EF measured by EM residents compared with a cardiologist. The study participants included 156 patients. According to the cardiologist’s report, 57 patients had normal cardiac function based on their EF measurement. Demographic characteristics are provided in Table 2. The mean blood pressure, respiratory rate, and heart rate values are also provided (see Table 3).
The Study Cohort’s Demographic Characteristics.
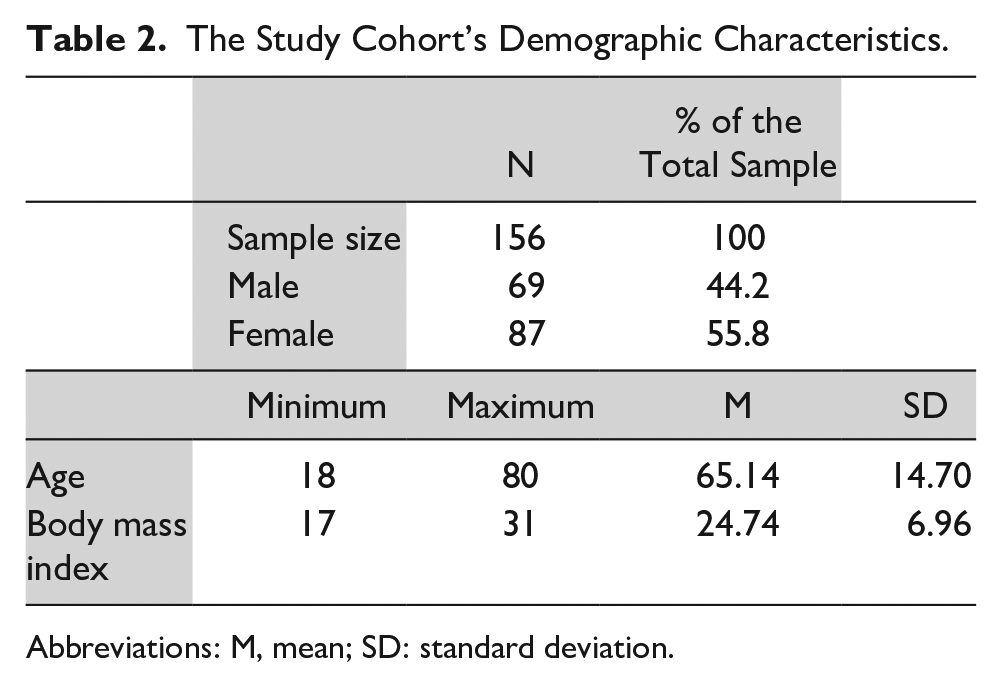
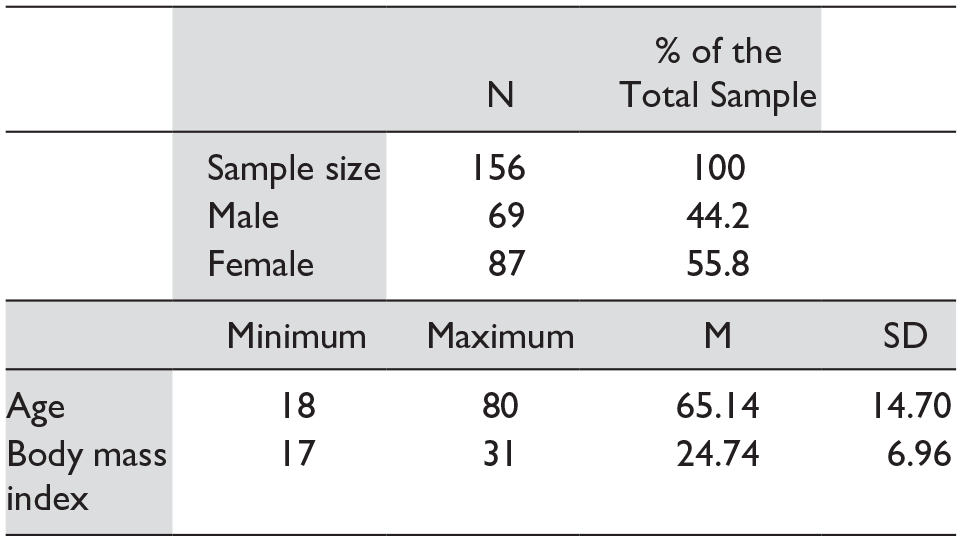
Abbreviations: M, mean; SD: standard deviation.
The Mean Blood Pressure, Heart Rate, and Respiratory Rate for the Study Cohort.
Abbreviations: M, mean; SD: standard deviation.
As shown in Table 4, the comparison between the EF measurements made by the EM residents and the cardiologist was analyzed qualitatively and quantitatively.
The Correlation Coefficient Between the Ejection Fraction Measured by Cardiologists and Emergency Medicine Residents.
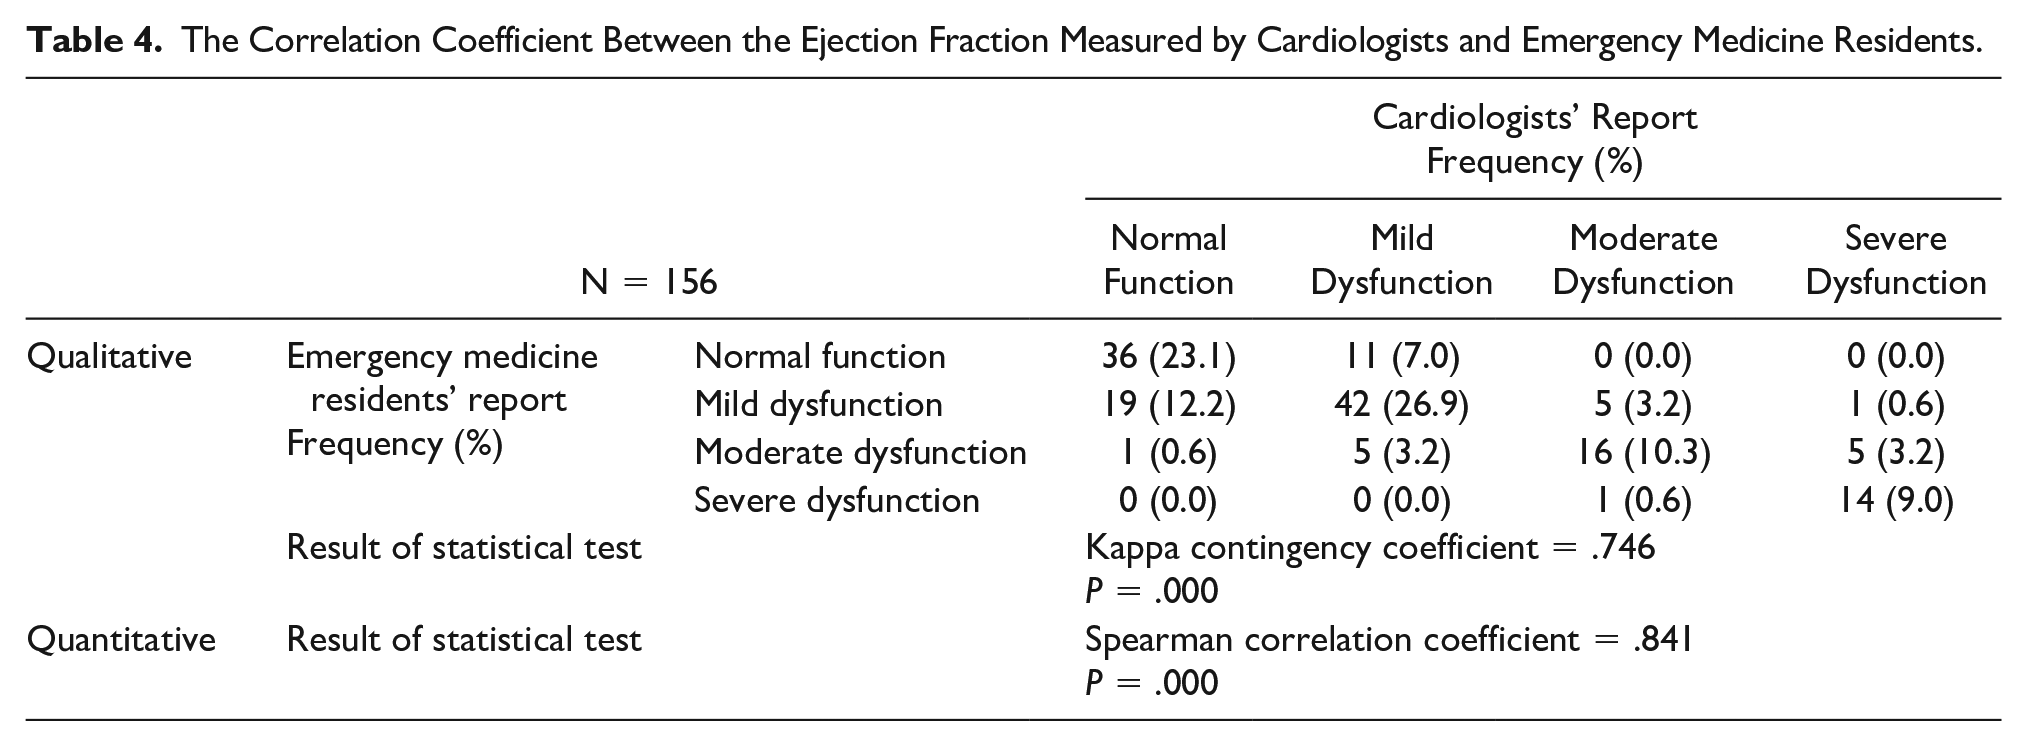
In the qualitative section, the agreement between the EM resident and the cardiologist reports was at 69.3% for all the cases. A moderately strong Cohen’s Kappa coefficient of .746 (P < .001) was statistically significant. The results of the quantitative analysis were also compared with moderately strong comparison between the EM residents’ reports and the cardiologist’s reports (P < .001).
The Kappa contingency coefficient and Spearman’s coefficient for each diagnostic method are shown separately in Table 5. In this cohort of patients, there were significant Cohen’s Kappa coefficient and high correlation between the EM residents and the cardiologist based on all the diagnostic techniques to measure EF.
The Kappa Contingency Coefficient and Spearman Correlation Coefficient for Each of the Diagnostic Methods to Assess Cardiac Ejection Fraction.
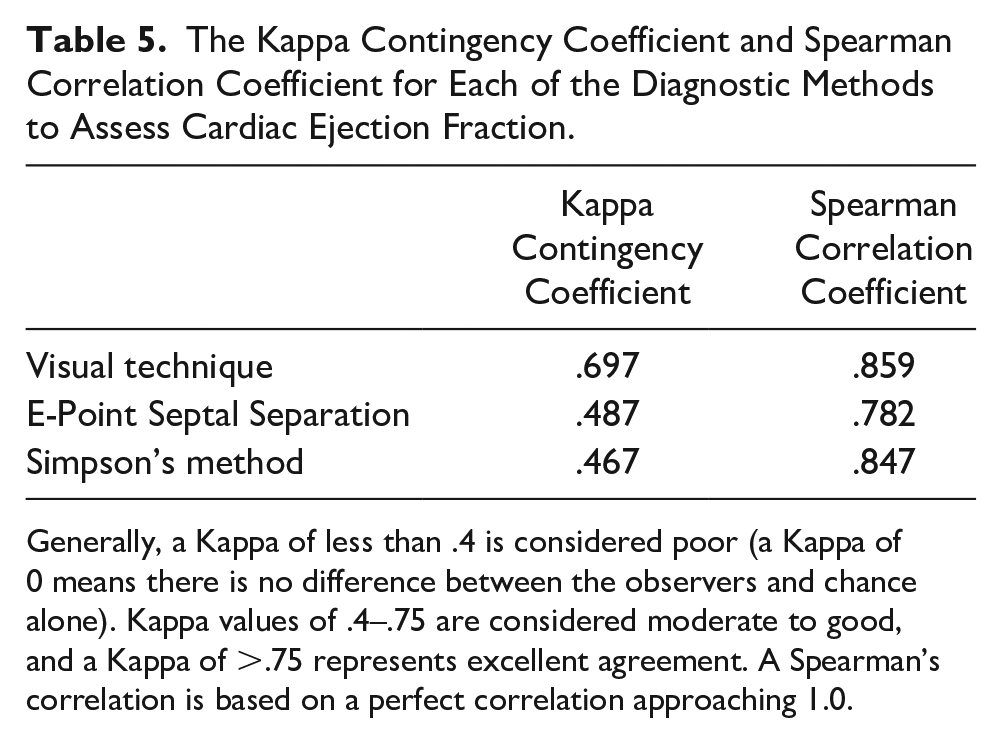
Generally, a Kappa of less than .4 is considered poor (a Kappa of 0 means there is no difference between the observers and chance alone). Kappa values of .4–.75 are considered moderate to good, and a Kappa of >.75 represents excellent agreement. A Spearman’s correlation is based on a perfect correlation approaching 1.0.
Based on these reported findings, the highest agreement and correlation between the EM residents and the cardiologist’s measurements, as well as the highest specificity, sensitivity, and positive and negative predictive values, were reported when using the person visualization technique. In addition, investigating the agreements between EM residents and cardiologists indicated that for all five trained EM residents, the agreements were significant and very similar (81.3%, 80.6%, 83.8%, 77.4%, and 77.4%, respectively).
Discussion
Based on the findings of this study, the overall agreement between the EM residents and the cardiologists was 69.3%, which was significant. Besides, the sensitivity, specificity, and positive and negative predictive values of the EF measurements by the EM resident were 89.0%, 64.2%, 81.6%, and 76.5%, respectively, compared with the cardiologist’s report, which was considered the gold standard.
In an investigation, Unlüer et al. studied the visual (eyeballing) technique for assessing echocardiographic EF. In that study, the sensitivity, specificity, and positive and negative predictive values of the patient’s bedside EF measurements, made by an EM specialist compared with a cardiologist, were 98.7%, 86.2%, 90.4%, and 90.4%, respectively. In the Unlüer et al., study, the reported values were also higher than the total values in this study. However, Unlüer et al. 11 only used the visual technique for assessment and used EM physicians to provide the reporting. The sensitivity, specificity, and positive and negative predictive values resulting from the visual technique in this study were 94.8%, 72.7%, 92.5%, and 80.0%, respectively. These values are almost similar to the values reported by Unlüer et al. 11 Similar to the study by Unlüer et al., the lowest value reported in this study was the specificity of the bedside EF calculation. In both studies, the highest level of disagreement was in patients with a normal left ventricular EF diagnosed with dysfunction or low EF by the EM residents/specialists.
In a study by Randazzo et al., the sensitivity of the left ventricular EF in the EPSS method was 100%. However, its specificity was below 51.6%. 12 Unlike this study, Randazzo et al. observed the highest level of agreement between the EM specialists and echocardiography specialists in the normal function category. This difference between these studies could be attributed to the difference between their inclusion and exclusion criteria and their patient selection methods. In the study by Randazzo et al., 12 most participants were patients suffering from low blood pressure, and only 5.7% of the 115 participants had dyspnea. In contrast, one of the inclusion criteria in this study was the presence of dyspnea.
A meta-analysis conducted by Albaroudi et al. assessed the visual estimation technique by EM physicians, using point-of-care echocardiography, compared with expert sonographers. The sensitivity, specificity, and positive and negative likelihood ratios of 89%, 85%, 5.98, and 0.13, respectively, were between clinician sonographers and expert sonographers for normal and abnormal left ventricular systolic function. 13 These findings compare very nicely with the results of this study.
In comparison with this study, the work published by Weekes et al., 14 van Royen et al., 15 and Amico et al. 16 demonstrated that the visual technique was superior to the other relevant diagnostic methods in estimating the EF. Jensen-Urstad et al. 17 and van’t Hof et al. 18 indicated that the visual technique offered a high level of accuracy in the estimation of EF. Gudmundsson et al. indicated that the visual technique was like all the other EF calculation methods, including Simpson’s method. None of these evaluative methods for detecting EF is considerably superior to the others. 19 In addition, a systematic review by McGowan et al. 20 indicated that Simpson’s method, EPSS, and the visual technique have similar advantages and disadvantages.
In the study by McKaigney et al., they reported that the visual technique has a weak correlation with the actual output of the left ventricle. In contrast, the EPSS method strongly correlates with the actual LVEF. Unlike this study, in that report, the EPSS method was considerably superior to the visual technique. They also referred to its advantages, including faster deployment, less need for the patient’s cooperation, and fewer views. 21
In another study, Rasooli et al. compared the echocardiography results between an EM resident and cardiologists. The study showed an acceptable agreement between the results of the EM resident and cardiologists’ echocardiography in assessing regional wall motion abnormalities in acute coronary syndrome. 22
One of the distinguishing features of this study was the assessment of the EF by five different EM residents, which indicated that well-trained EM residents could provide acceptable measurements of EF, within a short time in the ED. As for all five trained residents, the agreements between the residents and the cardiologists were significant and almost similar.
Limitations
The major limitation to this study was the research design and as such the pre-experimental nature and nonrandomization of the patient’s evaluated hamper the results due to threats to internal and external validity. These reliability results are unique to these EM residents and the patients that they examined. Another concern was that this was a single-center trial that used convenience sampling for patient selection. Future work in this area should be conducted across multiple health care centers with a variety of EM residents.
In addition, further limitations exist due to the difference in the time of assessment by EM residents and cardiologists. Although it is very unlikely, the patient’s systolic function may change through long intervals in some cases and due to changes in the patient’s condition, such as the development of acidosis, electrolyte derangements, or the intake of vasopressors. Therefore, future reliability studies should account for the time interval between the bedside EF assessment and the measurement by a cardiologist as a determining variable. In addition, EPSS is an M-mode method that is no longer a reliable measure to assess the EF. Although, in this study, “eyeballing” provided the highest correlation between physicians, it is not considered a scientific method. Moreover, the inclusion criteria of this study did not include a wide range of patients with different conditions.
Conclusion
The results of this reliability study showed acceptable agreement between the diagnostic measurement of EF by trained EM residents and a cardiologist. Furthermore, this study also revealed that that the visual technique had more consistency between EM residents and a cardiologist. Thus, an effort should be considered to educate EM residents on conducting cardiac sonogram and how to make reliable measurements of EF in patients presenting to the ED. Care should be taken in educating residents on using the visual technique for assessing EF, as published study results may not be generalizable or applicable in certain patient populations. Although, in general, the goal would be to promote Simpson’s method because of its accuracy. Therefore, there may be value in instructing and using different diagnostic methods for the measurement of EF among EM residents and ED physicians. Further research with more rigorous methodologies is needed to confirm the results of this study.
Footnotes
Declaration of Conflicting Interests
The authors declared no potential conflicts of interest with respect to the research, authorship, and/or publication of this article.
Funding
The authors received no financial support for the research, authorship, and/or publication of this article.
Ethics Approval
The study design was presented to the Ethics Committee of Iran University of Medical Sciences and was approved (ethics code: IR.IUMS.FMD.REC.1398.070).
Informed Consent
Informed consent was not sought for the present study because all case data were de-identified and/or aggregated and followed ethics committee or IRB guidelines (also referred to as the Honest Broker System).
Animal Welfare
Guidelines for humane animal treatment did not apply to the present study because no animals were used during the study.
Trial Registration
Not applicable.