



Abstract

We love data! I believe the love for data naturally comes from those who have worked as a sonographer and/or as a vascular technologist. As a clinician, there is always a focus on perfecting the ways of measuring anatomical structures, distances, and pathology. Besides creating diagnostic data, sonographers and vascular technologists are well trained in recording and reporting the data collected. Research data are a bit more nuanced but are nested in this same type of workflow and are very well planned. No matter your personal level of involvement in collecting research data, it is important to understand the entire research data process continuum from planning to collecting and analyzing.
Planning
The planning of a research project is a critical step in the data collection process. This phase begins with conducting a rigorous search of the published literature. The careful search of the literature preempts any sort of data collection. In Latin, the term “a priori” is used to refer to being without examination or analysis, and being conceived beforehand. 1 To have consulted the literature is vital as it helps to crystalize the actual research question. It also allows for determining the type of data collection tool that could be used as part of the research process. Pulling relevant published articles that relate to the proposed research allows for assessing how impactful other research studies have been. This established impact, based on curated research studies, helps to determine the power and effect needed to execute a compatible research study. This also provides clues as to the selection of salient variables by which to measure. Variables are categorized as nominal, ordinal, interval, and ratio. Based on this classification, varied kinds of data can be expected to be collected. When a previous data collection tool is reused, it requires permission to replicate; however, it will add to the proposed study’s rigor. Most importantly, the data collection tool has already demonstrated that it works and collects the data needed. It is possible to add questions or measures to further strengthen the tool. In addition, looking at the amount of data collected previously and the amount of participants is a great way to determine the statistical power needed for a future study. This is referred to as a power analysis.
Power refers to the probability that a significant effect is successfully detected assuming that the effect truly exists. Researchers could determine the minimum sample size required to achieve the desired statistical power (usually ≥80%) at the planning stage of a research project, which is referred to as an a priori power analysis. Researchers are able to calculate the sample size based on the desired alpha level, statistical power, appropriate statistical test (eg, t test, proportion test), and effect size (could be extracted from preliminary data). G* Power represents a convenient and publicly available tool for researchers to calculate sample size in a point-and-click manner, and it covers the most commonly used statistical tests for differences in means or proportions. 2
This in-depth review of previous research and their analysis allows for determining what type of statistical tools might be appropriate to answer the proposed research question. It also informs of next steps for collecting data, which is often referred to as the sampling plan. 3
Collecting
Once the sampling plan is set for the upcoming research project, it is now time to collect data for the variables of interest. The data collected can be either quantitative metrics or qualitative information. Like a river, the data will flow from the plan to the point at which it will be analyzed (see Figure 1). 4 It is important to put some thought into the mechanics of collecting the data. 5 The data can be recorded on a worksheet, Excel spreadsheet, or directly into a computer software (eg, REDCap). The manner in which data are recorded is important as the less copying of data from one collection method to another avoids entry errors. It is also important to build in a process of data “scrubbing” or verification. Invariably data can get transposed or missing cells can inadvertently be created. In our work, we like to use a new graduate student to carefully review and scrub the data collected. It is also important for that checking process to include going back to the original source, especially if a data collection form was used. 5
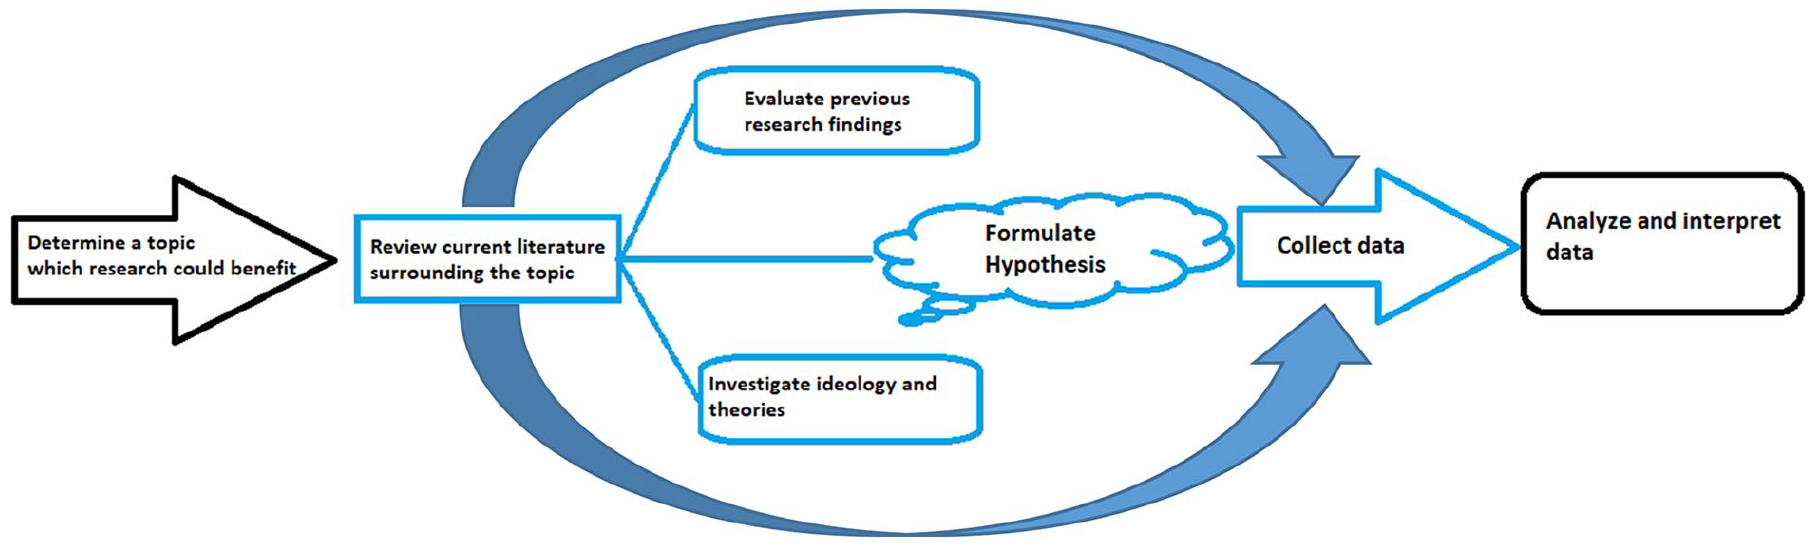
An adapted flow chart for how research data flow from conception to execution. The blue arrows denote the importance of an a priori power analysis from review of literature to final analysis.
After all the data have been verified, it is wise to review all the data as a research team and look at the overall collection. In our lab, we often create a frequency table of all the variables that were measured. This is a more involved step; however, it can help the team to spot mistakes in the data entry process.
Data Analysis
We feel that a very important first step in analysis is to just review and think about all of the data that have been collected. Personally, we refer to this as “sitting with the data” or “allowing the data to wash over you.” Allowing the researchers to contemplate the data in aggregate helps to gain comfort working with the data and builds familiarity. A biostatistician colleague recently asked us, “What is the story that the data is telling you?” Having studied the literature allows the researcher to discover what important story is being formulated. How does this new data collection compare or contrast with what was previously published? If you have achieved the power, size, and effect that were planned, the team is ready to use statistical tools to explore the data and possible relationships. It is vital to seek statistical support and preferably the same statistician who helped a priori.
Summary
Having invested the time, effort, and forethought into collecting research data pays huge dividends. I had a PhD student who had 18 variables, so you can imagine the massive amount of data that was collected. Regardless of the type of project or its size, it is important to follow these important steps for planning, collecting, and analyzing data. Although this advice may seem recursive, it establishes for the reader and the community at large that statistical rigor was embedded in the entire research process.