
Abstract
Objective:
This study was conducted to assess the diagnostic value of sonography in detecting carpal tunnel syndrome (CTS) in patients with rheumatoid arthritis (RA) and to compare the results with a normal control group.
Materials and Methods:
In this three-arm cross-sectional study, the sonographically measured median nerve cross-sectional area (MNCSA) was compared in three groups: RA patients with CTS, RA patients without CTS, and normal subjects (no RA, no CTS). A nerve conduction study (NCS) was performed for all enrolled participants, across the three study arms.
Results:
In this study, 38 RA patients (17 in CTS group and 21 in no CTS group) and 19 healthy subjects were recruited. The MNCSAs were 11.86 (±1.87) mm2 in RA patients with CTS, 10.16 (±1.71) mm2 in RA patients without CTS, and 9.42 (±1.46) mm² in healthy control patients. The accuracy of sonography in detecting CTS was 0.79 (95% confidence interval, 0.67–0.91), with a sensitivity and specificity of 88% and 57%, respectively. The MNCSA in CTS group was significantly higher than the control group (P = .02).
Conclusion:
In this cohort, the sonographic measurement of MNCSA was an accurate and sensitive method for the diagnosis of CTS, especially in its early stages. In addition, in this cohort, RA without CTS did not increase the MNCSA.
Carpal tunnel syndrome (CTS) is caused by compression of median nerve, in the carpal tunnel, located in the wrist. The main symptoms of CTS include pain, paresthesia, or numbness in the hands. The prevalence rate has been reported to be 0.6% among males and 9% among females. 1 More recently, a prevalence of 14.4% (95% confidence interval [CI]: 13.0%–15.8%) was reported for symptoms of pain, numbness, and/or tingling, in the median nerve distribution.2,3 The annual incidence of CTS has been reported to be 2.1% in general population. 4 CTS can present primarily (without an underlying disease or pathology) or secondarily (as a comorbid condition in diseases like diabetes or rheumatoid arthritis). Considering the inflammatory nature of rheumatologic diseases, it may predispose those patients to CTS. Studies have shown that the prevalence of CTS is higher in patients afflicted with rheumatoid arthritis (RA). 5
Diagnosis of CTS is usually made clinically, based on symptoms and physical examination. Paraclinical studies can be used to confirm the clinical diagnosis and to rule out other pathologies. Among these tests, electrodiagnostic studies (EDx), which enables direct evaluation of peripheral nerves and muscles, remain the most popular and reliable diagnostic methods.6,7 This is based on EDx having a high sensitivity (85%) and specificity (95%), for the diagnosis of CTS 8 ; however, these tests have some shortcomings. False positive and negative results have been reported for this diagnostic method. 9 In addition, it is a relatively expensive and a time-consuming diagnostic test that should be performed by a trained specialist. Moreover, EDx does not provide any anatomical image of nerves. In the recent years, the noninvasive and more available method of diagnostic sonography has rapidly improved, and several studies have been conducted to evaluate its application in CTS diagnosis.10,11 Multiple studies have demonstrated that measuring the median nerve cross-sectional area (MNCSA), at carpal tunnel level, has very good sensitivity and specificity for the diagnosis of CTS. 12
The usefulness of sonography in diagnosis of primary CTS has been reported in literature,7,13–19 but there are few studies evaluating sonography to detect CTS, secondary to predisposing conditions, attributed to RA. It can be hypothesized that the inflammatory nature of RA may result in different sonographic and EDx findings, in this group of patients. 15
The present study was designed to determine the diagnostic value of sonography to diagnose CTS in RA patients. In addition, these results were compared with EDx findings, both in RA patients and healthy subjects. This study also investigated whether MNCSA in RA patients, with or without CTS, was different from the normal population.
Materials and Methods
Study Design
This three-arm cross-sectional study was designed to assess the diagnostic value of sonography in detecting CTS, in RA patients, as well as compare the results with EDx findings for this group of patients and a normal healthy comparison group. The study was approved by the internal review board (IRB) of the Shahid Beheshti University of Medical Sciences. All recruited patients signed a written informed consent.
Patients aged 18 to 70 years suffering from RA and attending the rheumatology clinic of the host hospital were recruited. Those with a medical history of diabetes, hypothyroidism, pregnancy, polyneuropathy, and history of injury or prior surgery of the wrist were not included. Considering the exclusion criteria, six subjects were excluded which allowed 38 patients to be included in the study.
Twenty healthy individuals, screened for the inclusion criteria, were age and sex matched and included in the study as the control group. These volunteers were composed of ten hospital staff volunteers and nine were patient companions. The control group participants were questioned about CTS symptoms and declared no history of pain, numbness or paresthesia, in their hands. Unfortunately, one subject was excluded due to having had an abnormal EDx result.
The case selection was generally based on a nonrandom sequential process and eligible patients were recruited. The demographic data including sex, age, height, and weight were recorded at the time of consent. All subjects including RA patients and the healthy control volunteers underwent sonography of median nerve, followed by EDx. Both diagnostic tests were performed in a center staffed by an expert physical medicine and rehabilitation specialist. The final diagnosis of CTS was made by EDx result. Subjects in RA group were assigned to either RA with or RA without CTS, based on EDx findings. Participants in the control group were excluded if they had evidence of CTS in EDx findings (one participant was eliminated).
Electrodiagnostic Studies (EDx)
All the EDx was performed by a physical medicine and rehabilitation specialist. Both motor and sensory median nerve conduction pathways were evaluated according to the American Association of Neuromuscular & Electrodiagnostic Medicine (AANEM). 20 The EDx results included sensory nerve action potential (SNAP), compound muscle action potential (CMAP), and nerve conduction velocity (NCV), within the median nerve. To obtain a SNAP response, the recording electrode was attached to the third finger and the median nerve was stimulated, on the wrist, 14 cm away from the recorder. Regarding CMAP, the recorder was fixed on the thenar muscles and the median nerve was stimulated, on the wrist, 8 cm away from recorder. The settings for recording SNAP included a 2 ms/Div sweep speed and 20 microV/Div sensitivity. The settings for CMAP comprised a 5 ms/Div sweep speed and 4000 microV/Div sensitivity. According to AANEM, the median SNAP peak latency of at least 3.6 ms and CMAP onset latency of at least 4.2 ms is considered as the diagnostic cutoff point for CTS. 21 See Table 1 for the grading system of CTS severity.
The Diagnostic Grading of the Severity of Carpal Tunnel Syndrome.
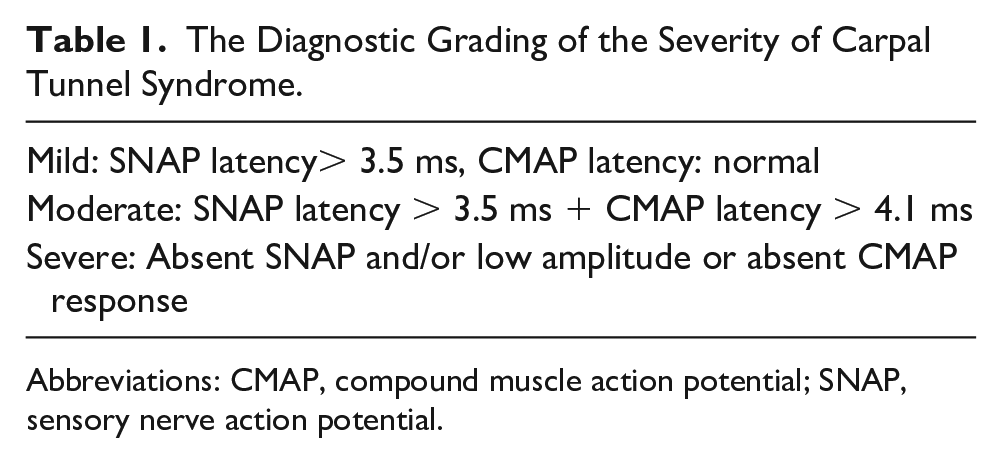
Abbreviations: CMAP, compound muscle action potential; SNAP, sensory nerve action potential.
Recording CMAP, with elbow stimulation, NCV, and needle electromyography of thenar muscles were also performed to rule out other causes of median nerve neuropathy such as pronator teres syndrome.
Sonography
Sonography was performed by the same physician who performed EDx and he used a Philips HD6 ultrasound equipment system (Phillips Healthcare, Bothel, WA) and a 3 to 12 MHz linear transducer. Subjects were examined in the sitting position with their forearms, wrists, and fingers in supination, semi extension, and in the resting position, on a table (see Figure 1). Initially, the linear transducer was placed on the distal wrist crease longitudinally. To confirm and identify the median nerve, from flexor digitorum profundus or the flexor digitorum superficialis tendons, the patients and volunteers flexed their fingers. Both tendons and the median nerve would move with finger flexion; however, the median nerve moved significantly less than tendons. Subsequently, the transducer was rotated into the transverse view at the distal wrist crease to visualize the median nerve, at the entrance of carpal tunnel. The transducer barely touched the skin, through acoustic couplant, to avoid any change in the nerve diameter and allowed the least possible pressure to be applied. To standardize the amount of pressure, no standoff pad or any other technique was used.
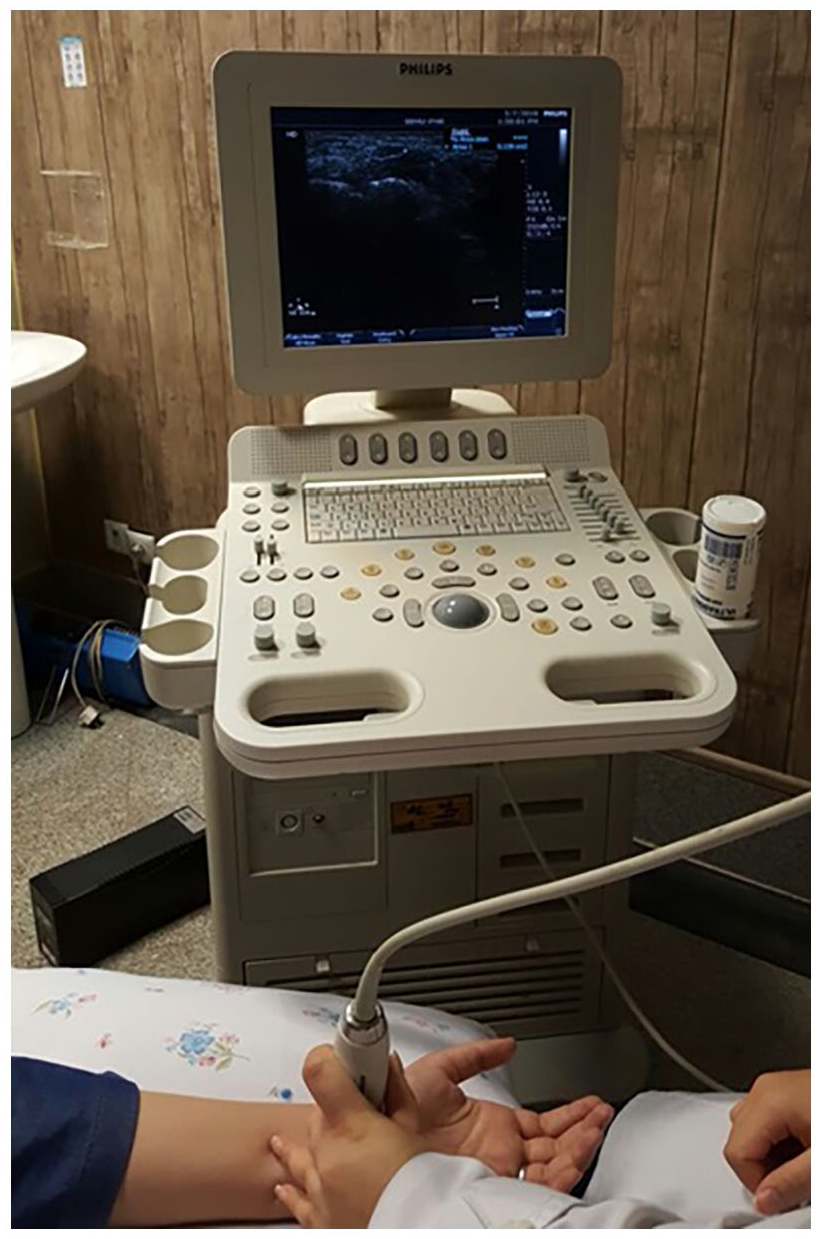
Participant set up for sonographic imaging of the carpal tunnel.
A primary sonographic view of the lunate bone was used as an indicator for measuring the cross-sectional area (CSA) of the median nerve. A static image, at this location, was captured and the MNCSA was measured in mm2. A direct method was used for tracking the intersection of hypoechoic nerve fascicles and hyperechoic nerve sheet, as margin of the nerve, and the placement of the electronic calipers (see Figure 2). The measurement of the median nerve was performed three times for each patient and volunteer. Average values were calculated and recorded for final analysis. In cases of bifid nerve (e.g., four individuals), the measurement was obtained by summing CSAs of the two branches, according to the Bayrak et al 22 method. For each branch, the area inside the nerve sheet was measured. The intersection of hyperechoic nerve sheet and hypoechoic nerve fascicles was considered as the margin of the nerve (see Figure 3).
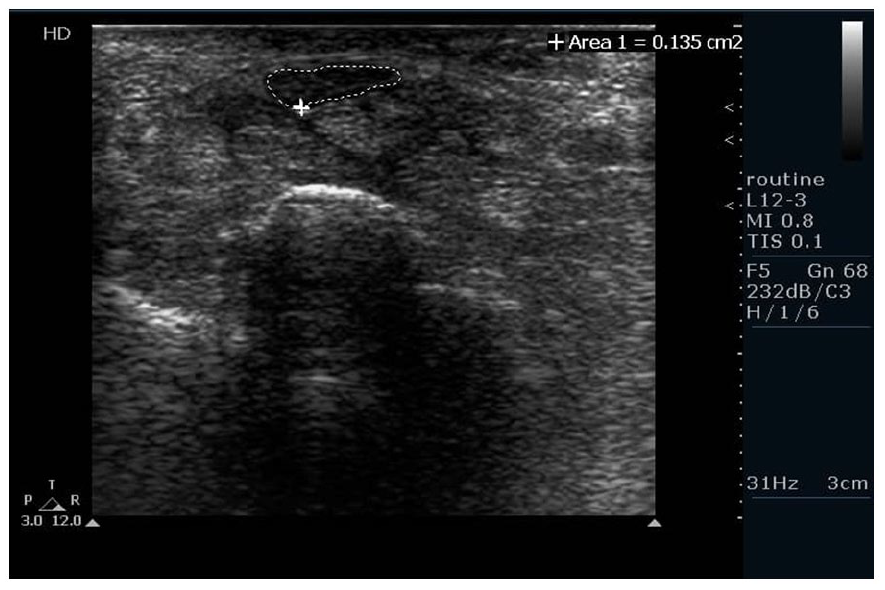
The method of measurement for median nerve cross-sectional area.
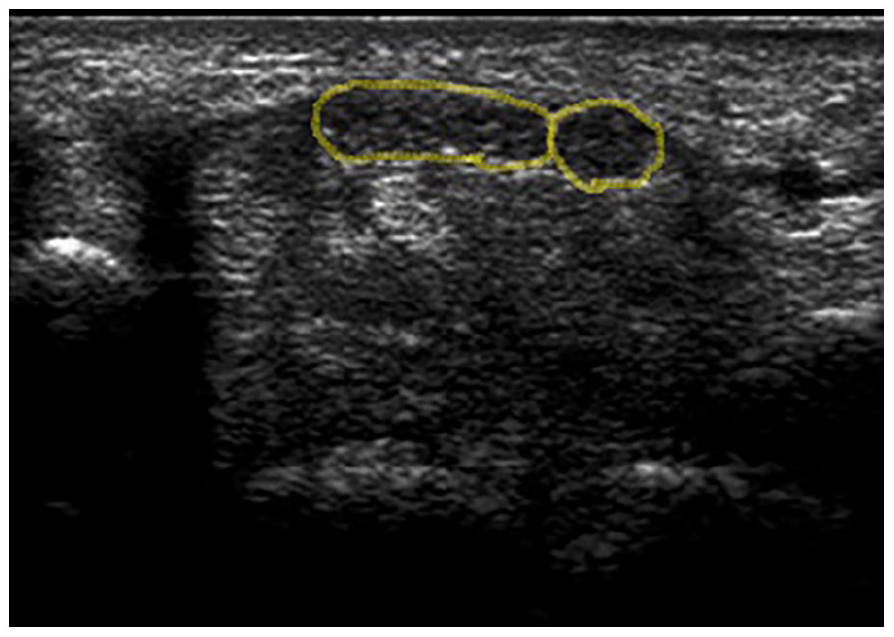
The method of measurement of the cross-sectional area for a bifid median nerve.
The EDx and sonography, of both wrists, were performed for all participants. Although participants across all three arms were matched as much as possible, there were likely other nonrecognized, nonmatched confounding factors, especially in the RA group. Conversely, the pathologic involvement rate was not equal across all participants; as most participants had bilateral involvement, while some had unilateral CTS. Analyzing data from both hands could duplicate the impact of the underlying condition in participants with bilateral involvement. In order to prevent this error and homogenize the effect of underlying conditions, considering possible confounding factors, only data for one hand were selected for in each participant. Considering the consequent functional impairment, the hand with longer median sensory latency was chosen for the final analysis. If both hands had equal latencies (e.g., four individuals), the dominant hand was chosen.
Statistical Analysis
The statistical analysis was performed using IBM SPSS Statistics version 19 software. The MNCSA was described as mean ± standard deviation (SD). The quantitative data were analyzed using analysis of variance, with least significant difference levels (LSD), as well as a post hoc Scheffé test. The differences between qualitative data were analyzed using chi-square test. To calculate the cutoff point for a CTS diagnosis and to evaluate the sensitivity, specificity, positive predictive value (PPV), and negative predictive value (NPV) for sonography, a receiver operating characteristic (ROC) curve was used. The cutoff point accuracies were also determined. The cutoff point for the ROC curve was determined as the point with the most specificity and sensitivity. P values less than .05 were considered statistically significant, a priori.
Results
Forty-four RA patients and 20 healthy volunteers, who formed the control group, were enrolled in the study. Six patients in RA group and one volunteer in control group were excluded from the study. The final analysis was based on the data from 38 RA patients and 19 normal volunteers. The characteristics of all the participants are provided in Table 2.
The Baseline Patients and Volunteers’ Characteristics.
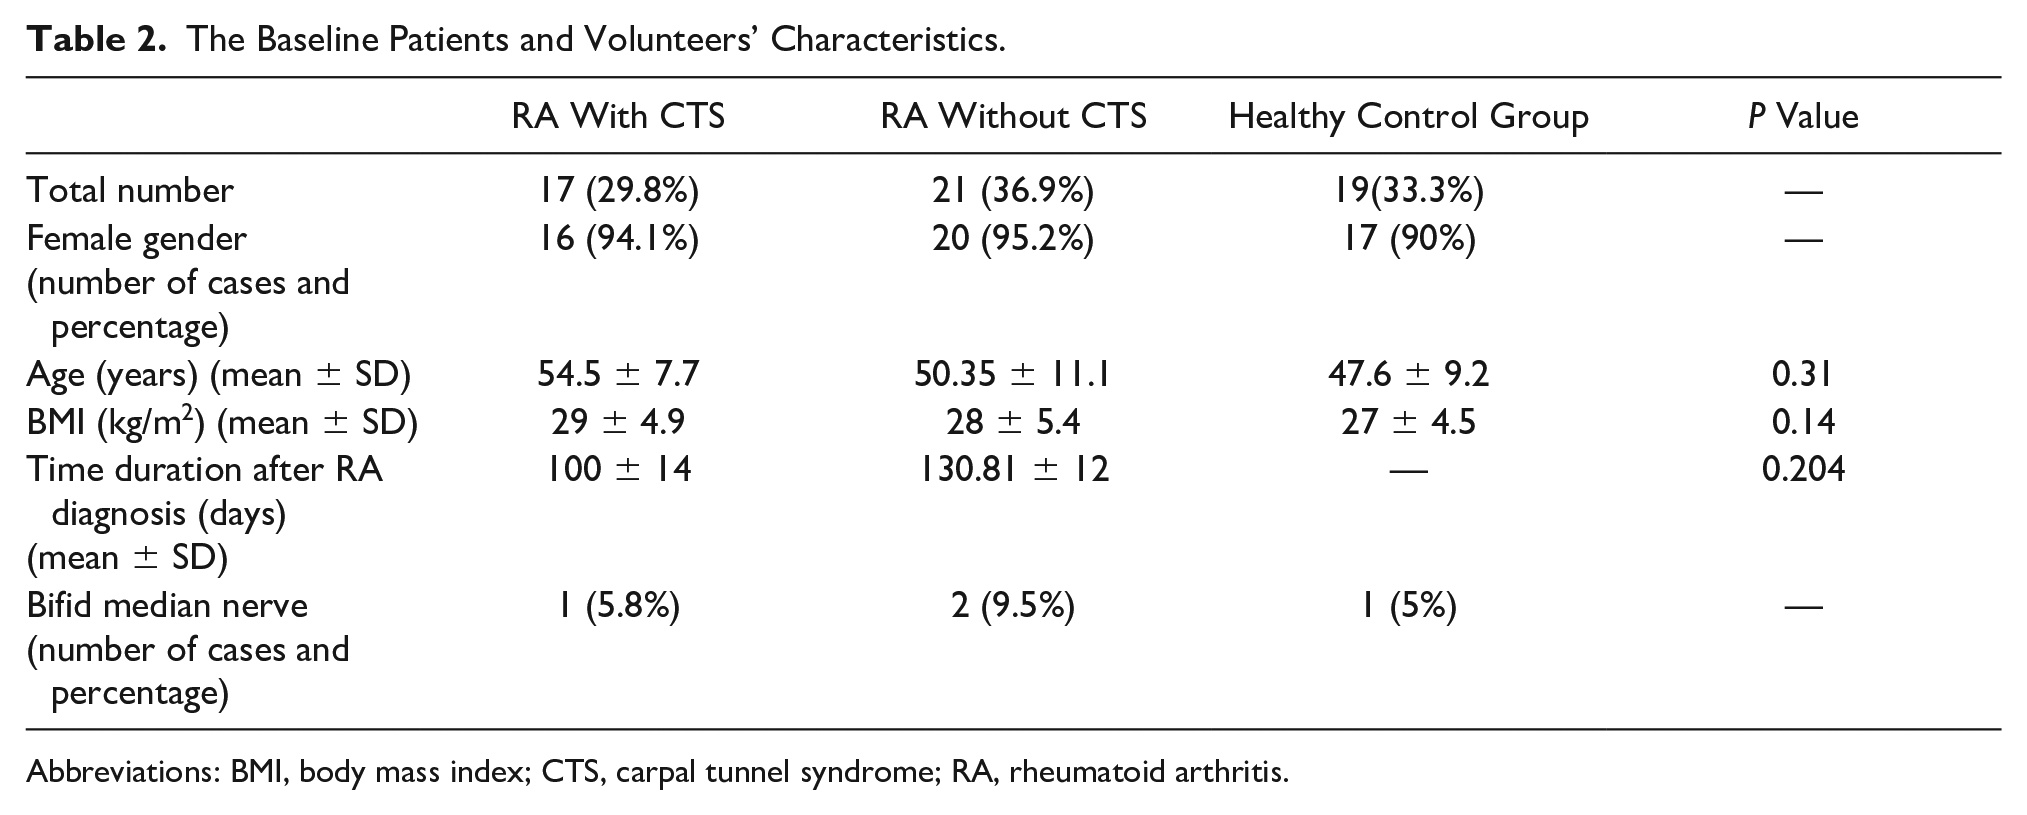
Abbreviations: BMI, body mass index; CTS, carpal tunnel syndrome; RA, rheumatoid arthritis.
Among the 38 RA patients, 17 cases were diagnosed with CTS based, on EDx findings and 21 patients had a normal EDx. According to CTS grading system, among the 17 RA patients with CTS, there were seven mild cases, nine moderate cases, and one severe case of CTS. The mean MNCSA of participants with RA and CTS was 11.86 (±1.87) mm2. This value was 10.16 (±1.71) mm2 for RA participants without CTS, and the measurement among healthy patients was 9.42 (±1.46) mm2 (see Table 3). A significant association was found between the mean MNCSA and median sensory and motor latency in the healthy control group (e.g., median sensory latency: R = 0.379, P = .016 and median motor latency: R = 0.369, P = .019). This correlation was not observed in RA cases (e.g., RA with CTS group R = 0.290, P = .259) (e.g., RA without CTS group R = 0.298, P = .189). There was no significant correlation found between CTS severity (in RA with CTS cases) and mean MNCSA (P = .23). There were four participants (6.8%) with a bifid median nerve. There were two patients who had RA without CTS, and they were split between the healthy control group and the RA with CTS group.
The Values of MNCSA and Comparison With a Sonographic Cutoff Point.
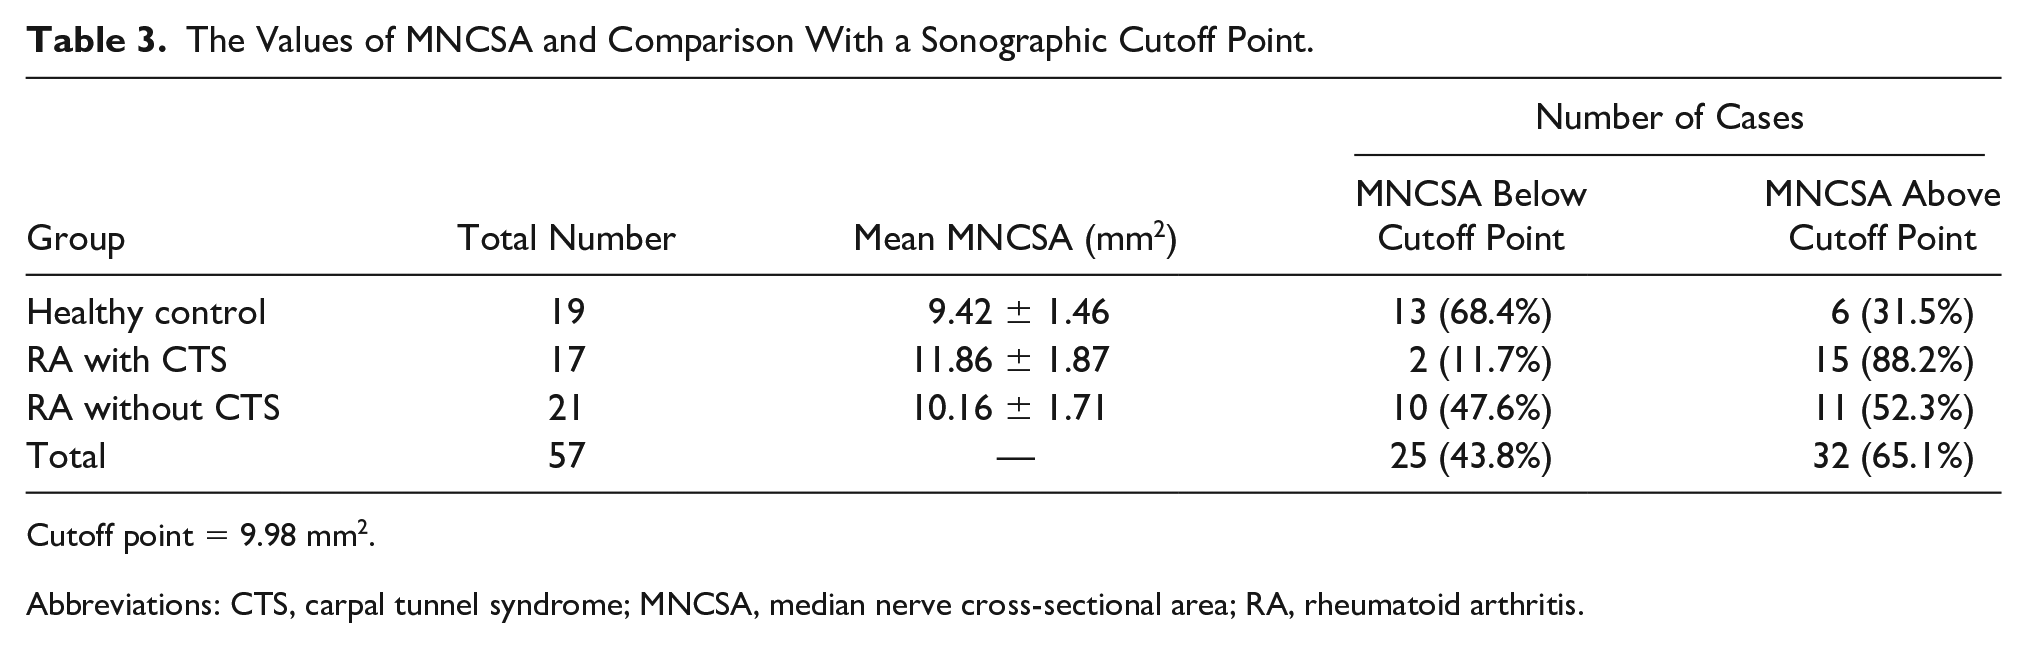
Cutoff point = 9.98 mm2.
Abbreviations: CTS, carpal tunnel syndrome; MNCSA, median nerve cross-sectional area; RA, rheumatoid arthritis.
The mean MNCSA in RA patients without CTS were not significantly different from the healthy control group (P = .386). A statistically significant difference was observed between the MNCSA in RA patients with CTS and healthy control group (P = .016). The MNCSA of RA patients with CTS was significantly higher than RA without CTS group (P = .003). The mean time duration of RA diagnosis was 100 days in RA with CTS group and 130 days in RA without CTS group. No statistically significant correlation was found between the MNCSA and time duration, after RA diagnosis (P = .20). The mean body mass index (BMI) of all participants was 27.9 kg/m2. It was 29 ± 4.9 kg/m2 for RA patients with CTS, 28 ± 5.4 kg/m2 for RA patients without CTS, and 27 ± 4.5 kg/m2 for the healthy control group. A statistically significant association was found between mean MNCSA and BMI of individuals (P = .019). In this cohort, there was an increase in BMI, which led to an increase in MNCSA.
The diagnostic accuracy of the sonographic measurement of the MNCSA was evaluated and presented with an ROC curve (see Figure 4). The ROC analysis was a useful tool to evaluate the accuracy of diagnostic tests. The nearest point on the most top left of the curve represents the point with concurrently the most sensitivity and specificity. In the current study, the ROC curve presented the MNCSA for all participants, including RA patients and healthy individuals. The area under the ROC curve (i.e., accuracy) was 0.66. This indicates that the sonographic measurement of MNCSA has an accuracy of 66% for CTS diagnosis. The MNCSA cutoff point for CTS diagnosis was determined as the point on the curve with concurrently the most sensitivity and specificity. Based on the ROC curve, this point was estimated to be MNCSA of 9.98 mm2. According to this cutoff point, the sonographic measurement diagnosed 32 participants with CTS. Based on the cutoff point of 9.98 mm2 for MNCSA, 15 participants who had RA with CTS, 11 participants who had RA without CTS, and 6 healthy control volunteers had an MNCSA above the cutoff point and were diagnosed with CTS (see Table 3).
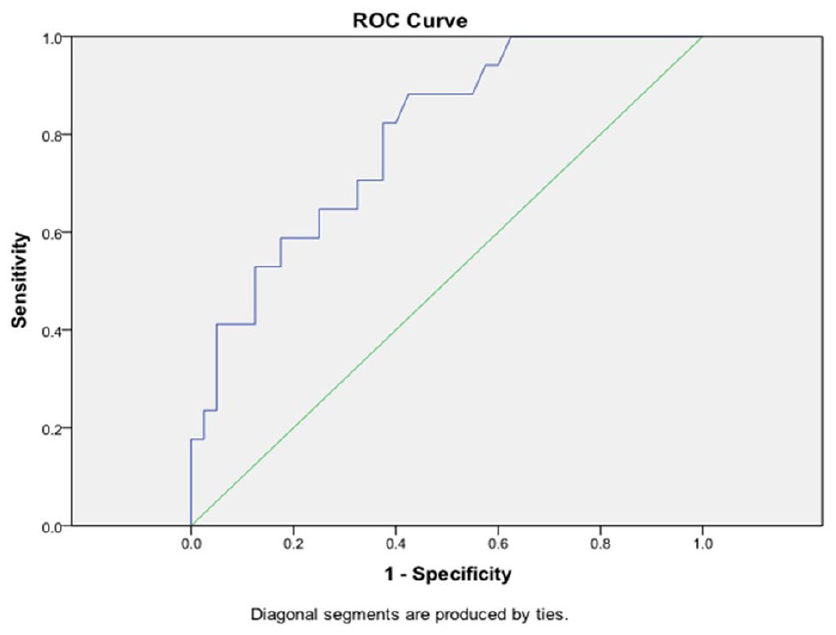
The ROC curve for carpal tunnel syndrome diagnosis, based on the median nerve cross-sectional area. ROC, receiver operating characteristic.
Discussion
Based on this study, sonography has a good sensitivity (88%) and fair accuracy (66%) for the diagnosis of CTS, but was not very specific (57%). Known et al compared sonographic and EDx for a diagnosis of CTS. The sensitivity and specificity of sonography with a 10.7 mm2 cutoff point was 66% and 63%, while the sensitivity and specificity of EDx was 78% and 83%, respectively. Their study did not find sonography an accurate diagnostic test for CTS. 23 In a study by Rhoghani et al, 24 they found sonography to be 73% sensitive for CTS diagnosis; however, the specificity of was not evaluated. Seror conducted a systematic review of the pros and cons for sonography as a diagnosis of CTS. They emphasized that studies have led to conflicting results and regarding this inconsistency, sonography could not be considered a standard test for CTS diagnosis. According to Seror, 25 sonography has shown low levels of sensitivity or specificity in some studies. Different patient factors can affect the results of diagnostic studies. Regarding the present study, it was speculated that this small sample size of RA patients with CTS was a major limiting factor.
Indeed, there is no gold standard test for a CTS diagnosis. In the existing guidelines, EDx is considered as one of the several diagnostic tools, of which none can be considered as the only test for definite diagnosis. One distinguishing advantage of EDx is ruling out other causes of hand pain and paresthesia, such as radiculopathies and polyneuropathies. In their last guideline for CTS diagnosis, the American Academy of Orthopaedic Surgeons (AAOS) mentioned that there is limited evidence supporting usefulness of nerve conduction study (NCS) for a CTS diagnosis. Conversely, no clinical sign and symptoms and provocative tests can be relied upon for a CTS diagnosis as the only marker. Based on the limited existing evidence, it is recommended not to routinely use sonography for a CTS diagnosis. 26 Thus, a collection of signs, symptoms, tests, and questionnaires must be used for making that final clinical decision. Most diagnostic criteria for CTS are based on this collective method. 9 As physical and rehabilitation medicine specialists, the authors consider EDx as a helpful diagnostic tool for making final decision, with the most reliable objective results among existing diagnostic tests. Considering all above-mentioned aspects, final diagnosis of CTS was based on EDx findings.
Among all 57 participants, 17 patients had EDX proven CTS. Based on sonographic findings, there were 32 cases with CTS. To justify this discordance, it is needed to be mentioned that there may been some cases with clinical signs and symptoms of CTS and negative EDx, who have been sonographically diagnosed as CTS. In some previous studies, comparison between EDx and sonography have shown that sonography may be able to detect CTS in earlier stages.9,24,27–29 This can be due to the fact that anatomical changes (e.g., increased MNCSA) may happen earlier than EDx findings (e.g., an increase in median sensory distal latency). Roghani et al 24 reported that EDx has a 27% false negative in detecting CTS, in clinically confirmed CTS patients. More studies are needed to verify these findings.
In the current study, significant correlation of mean MNCSA value with EDx results was found merely in healthy control group. There was no correlation between the above-mentioned values in RA with CTS group. In a study by Mohammadi et al, 30 EDx was used as the gold standard test for CTS diagnosis and sonography was found as an acceptable substitute for EDx (with good sensitivity and specificity), although the authors concluded that sonography could not accurately measure CTS severity. Based on their findings, MNCSA in severe CTS group was higher than others, but among patients with mild or moderate CTS, it was not significantly different. 30
Hammer et al 15 assessed MNCSA in RA patients with and without CTS and healthy control subjects using sonographic methods. The measured values in RA patients with CTS were significantly higher than RA patients without CTS. MNCSA values were 15.7 mm2 for RA with CTS (11.1–21.8), 8.5 mm2 for RA without CTS, and 8.0 mm2 for healthy control group. Although the values are different, comparing MNCSAs show similarities with our findings. The difference between Hammer’s study and the present study was that they did not use EDx and diagnosed CTS clinically, and therefore no comparison was made between sonographic and EDx findings. In addition, they did not evaluate the sensitivity and specificity of sonography for CTS diagnosis. Compared with the current study findings, the mean MNCSA of RA with CTS cases was significantly higher than the Hammer et al study (e.g., 15.7 mm2 vs 11.86 [±1.87] mm2). This incongruity can be due to many unrecognized underlying factors that can affect MNCSA and need to be evaluated in further research.
Another study by Hammer et al 31 revealed that there was no statistically significant difference in MNCSA measured by sonography between RA patients without CTS and healthy individuals. Once more, EDx was not performed in their subjects. Based on Hammer’s findings, it seems that isolated RA disease without CTS does not accompany increased MNCSA. According to the present study findings, MNCSA was statistically higher in RA patients with CTS compared with RA patients without CTS and also healthy individuals. MNCSA in RA patients without CTS was somewhat higher than healthy individuals, but this difference was not significant statistically. Some studies have evaluated the effect of RA on MNCSA. 32 Their observations are against the hypothesis that RA can lead to increase in MNCSA.
Mean time duration after RA diagnosis was 3 months (100 days) and 4 months (130 days) in RA with and without CTS, respectively. No significant correlation was found between MNCSA and RA duration, implying that longer duration of RA is not an effective factor in developing CTS. Hammer et al 31 found no correlation between time duration of RA and mean MNCSA values in their study.
Median nerve anatomical variations such as median bifid, trifid, persistent median artery, or aberrant muscles may be a predisposing factor to CTS.33–35 Median nerve anatomy and causes of secondary CTS can be evaluated by sonography, which make this method superior to EDx, especially when median nerve anatomy is to be evaluated. The prevalence of bifid median nerve has been reported 2.8% in some previous studies,35,36 and 6.8% in the present study, including two cases in RA without CTS, one in healthy control, and one in RA with CTS groups. Finding any correlations between this anomaly and occurrence of CTS needs further studies with larger sample size.
In the current study, a significant correlation was noted between BMI and MNCSA. According to these findings, subjects with higher BMI had higher MNCSA. The results of studies have been inconsistent. Werner et al 37 found no correlation between BMI and MNCSA. Conversely, Pan et al 38 showed that there is a significant positive correlation between BMI and MNCSA. Hannawi et al 32 also demonstrated that MNCSA has a positive correlation with BMI. More studies are required to elucidate this correlation more precisely.
The unique characteristic of the present study is to compare sonographic findings with EDx results in RA subjects. In similar studies on RA patients, mainly conducted by Hammer et al, EDx was not used and CTS diagnosis was made clinically. Although there are other studies comparing sonography with EDx for CTS diagnosis,22,24,27,29 they have all studied the normal population and not RA subjects. Therefore, the current study may be the first to compare sonographic and EDx findings in RA and CTS patients.
Limitations
There were some potential limitations to the current study. First, sample size was small, especially in the RA with CTS group. Second, all EDx and sonographic studies were performed by the same person, so the examiner was not blinded. However, to decrease possible bias, the EDx studies were performed after sonography. Third, the study did not evaluate the RA disease condition in terms of active, remission phase, or drugs used for treatment. Although beyond the scope of this study, these factors could impact CTS symptoms. Overall, this research did not indicate a correlation between disease severity and MNCSA. This may be due to the small sample size of CTS group. The exact decision about this finding would require further research. Another limitation of the study is that the diagnosis of CTS was based on EDx; therefore, the existence of CTS in subjects with normal EDx was ruled out, even in cases with clinical sign and symptoms. This might have led to missing some mild CTS cases. The novelty of the present study lies in the comparison between sonographic and EDx findings in the RA group. It would appear that no previous study, with this same design, has been conducted.
Conclusion
Despite low specificity, the sonographic measurement of MNCSA may be an accurate and sensitive method for CTS diagnosis and could be considered as a noninvasive and cost-benefit diagnostic method especially in early stages of CTS. Furthermore, the present study demonstrated that isolated RA disease, without CTS, does not increase MNCSA.
Footnotes
Declaration of Conflicting Interests
The authors declared no potential conflicts of interest with respect to the research, authorship, and/or publication of this article.
Funding
The authors received no financial support for the research, authorship, and/or publication of this article.