
Abstract
Objective:
The present methods for the linear measurement of the liver with sonography are based on external reference lines. In addition, these measurements are subject to interrater variability due to relative mobility of liver and abdominal wall during breathing, change in position, and so on. A novel method using a plane with two internal references (plane of Y0) was developed as an alternative. The purpose of this study was to estimate the reliability of the novel method and compare with other commonly used methods.
Materials and Methods:
A prospective, analytical, cross-sectional study was completed in a radiology department, including individuals referred for sonography and a contrast-enhanced computed tomography (CT) of abdomen. Three radiologists sonographically measured the craniocaudal dimension of liver in the “plane of Y0,” midclavicular, and anterior axillary lines for each participant. In 60 participants, the craniocaudal measurements obtained in the “plane of Y0,” in both contrast-enhanced CT and sonography, were compared for validity. Interrater correlation coefficients were calculated for each method.
Results:
Three hundred thirty-four participants underwent sonography of the liver. Sixty of them also underwent a contrast-enhanced CT. The craniocaudal measurements within the “plane of Y0” showed excellent reliability in comparison with other methods. It was found to be valid when compared with measurements completed on the CT image.
Conclusion:
Measuring the liver in the “plane of Y0,” with two identifiable internal references, is reliable, valid, and recommended for possible use in daily clinical practice.
Key Takeaways
Using internal reference points for measurements of internal organs, with sonography, will reduce interoperator variability.
The “plane of Y0” passing through two internal reference points within the liver, the branching of right portal vein (Y shaped) and gallbladder (0 shaped lumen), can be easily acquired with sonography.
Measurement in the craniocaudal dimension of liver, in the “plane of Y0,” showed validity and high interrater reliability (0.91). The normal range of measurements in adults was found to be 10.5 to 15.1 cm.
An altered liver size is one of the important determinants of a liver abnormality. Clinically, liver size is assessed by measuring liver span, within the right midclavicular line. Sonography is the primary imaging modality used for morphologic assessment of the liver. Many methods are described to measure liver size with sonography, such as the craniocaudal,1-5 anteroposterior,1,2,6-8 and transverse dimensions. These methods are based on external reference points like midclavicular line, anterior axillary line, and so on. As the liver moves with respiration, it changes its relative position to the external reference planes with every breath. Thus, relative position of the liver is dependent on the depth of inspiration, expiration, and position of patient (supine/erect/oblique). Although frequently the measurement is done with a breath-hold, it is not possible to achieve breath-holds with a similar amount of lung volume. It is common to encounter instances where different radiologists, using the similar measurement methods, document different sizes for the same liver. Even the same radiologist would find it difficult to reproduce the measurements repeatedly. Often normal sized livers are erroneously assessed as enlarged and vice versa, which could affect the diagnosis and management of that patient.
To overcome this measurement variance, a new method was explored to sonographically assess liver size using internal references. Using a single internal reference point would still lead to ambiguities as the same point could be visualized in various planes and at different angles. Therefore, the measurement system that was developed employed a two internal reference point model.
The present study assessed a novel method of measuring liver size with sonography by using two internal references in the same plane. On reviewing multiple images of the liver with sonography, cross-sectional imaging, and gross specimens, a final plane was chosen for making measurements and was based on the feasibility and ease of acquiring the sonographic image. The assumption behind this method was that the chosen internal references and the liver always have a constant relation with each other. It was also based on there being no significant relative mobility of breathing or change of position of the individual. This method was devised to offset the drawback of measures using external reference points which showed significant intra- and interoperator variations.
The plane of liver selected was a near sagittal plane almost corresponding to right midclavicular line (see Figure 1). The two points in the plane used as internal references were
The branching of right portal vein, which is seen as “Y,” the stem being the right portal vein, and the two arms represented by its anterior and posterior branches and
The gallbladder lumen, which is seen as oval shaped “0.”
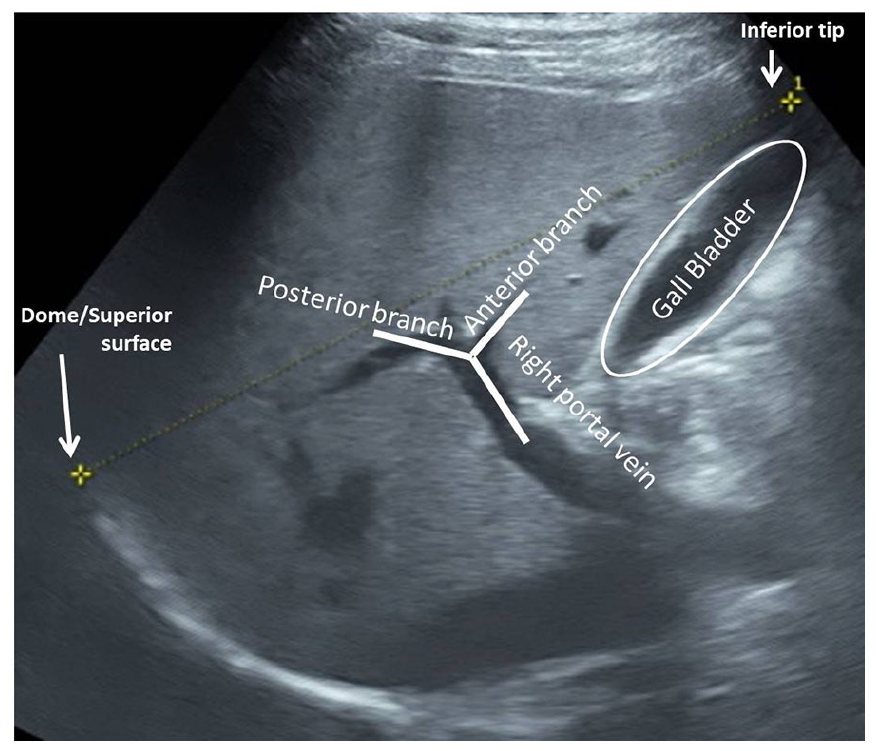
Two-dimensional sonographic image, obtained in the “plane of Y0.” The image clearly depicts the “Y” configuration of the right portal vein and its branches and “0” configuration of the gallbladder. The stem of “Y” is formed by the terminal part of right portal vein and the two arms of “Y” are formed by its branches.
This internal reference points were clearly depicted on a two-dimensional (2D) sonogram, seen in Figure 1, as this plane was referred to as “plane of Y0,” for this study.
This study was done to determine the reliability of liver measurements in the plane of Y0 in comparison with other commonly used sonographic measurement methods.
Materials and Methods
A prospective observational analytical study was done in the radiology department of a tertiary care center between June and December 2020. Prior institutional ethical committee approval was given prior to the study being conducted.
The study included all participants above the age of 18 years who were referred to the department of radiology for sonography and had clinical indications, other than liver disease. In addition, 60 individuals over the age of 18 years referred for a contrast-enhanced computed tomography (CECT) of the abdomen were consented to the study. The patients were referred for CECT based on indications other than those that can affect liver size. The liver is of an adult size by the age of 15 years; therefore, individuals above the age of 18 years were considered for study inclusion.
The sample size was calculated using the precision-based formula for comparing more than two sample means. Informed consent of the participants was taken prior to subjecting them for abdominal sonogram. Participants were screened and subjected to a clinical examination, as means of checking for the presence of any preexisting conditions, which could affect the liver (i.e., diabetes, chronic alcoholism, hepatitis, obesity, etc.). If available, any liver function test results from the immediate past (3 months) were scrutinized. Individuals who had signs of any previous/present ailment that could affect the liver and those with abnormal liver function test results were excluded from the study.
The initial sonogram was performed by a radiologist, and participants were placed in the supine position. The sonogram was completed using a GE Voluson S8 ultrasound equipment system (GE Healthcare, Waukesha, WI). A 3 to 5 MHz C1-5 convex transducer was used for this particular examination. A 2D sonogram and a color Doppler examination of the liver were done to assess its echogenicity, echotexture, and vascularity. A normal liver, on sonography, appears homogeneous with fine intermediate echoes, similar to the normal adjacent right renal cortex. The vasculature of liver, such as the portal vein, hepatic artery, veins, and their intrahepatic branches/tributaries were assessed for intraluminal flow. The main portal vein, hepatic artery, and veins were also assessed for luminal diameter, flow velocity, direction, and waveforms. Any perceived deviation from normality and presence of any intrahepatic mass/lesion was considered abnormal and excluded from the study. Another criterion for exclusion was a contracted, abnormal, or absent gallbladder. Thereafter, three radiologists with sonographic experience of 4, 6, and 8 years, respectively, completed the examinations. The radiologists completed the hepatobiliary sonogram by acquired images and hepatic measurements for each participant. The study radiologists were kept unaware of their colleagues’ diagnostic findings.
The following dimensions of liver were chosen to be measured based on most prevalent methods when using the “plane of Y0.” The measurements were made using the ultrasound equipment system’s digital calipers.
The craniocaudal dimension right anterior midclavicular line (C-MCL) in the sagittal plane: The transducer was placed longitudinally over the right hypochondrium in the midclavicular line (see Figure 2) and adjusted to include both superior and inferior margins of liver in that plane. The participant was asked to suspend breathing momentarily, while acquiring the sonographic image. The C-MCL was measured between the superior-most point of the visualized superior surface/dome of liver and its inferior-most tip in that plane (see Figure 3).
The craniocaudal dimension using the right anterior axillary line (C-RAA): The transducer was placed longitudinally over the right hypochondrium along the anterior axillary line (see Figure 4) and adjusted to include both superior and inferior margins of liver in that plane. The participant was asked to suspend breathing momentarily while acquiring the sonographic image. The C-RAA was measured between the superior-most point of the visualized superior surface/dome of liver and its inferior-most tip in that plane (see Figure 5).
The craniocaudal dimension in the “plane of Y0” (C-Y0): The transducer was initially placed longitudinally perpendicular to skin surface over the right hypochondrium in the midclavicular line. The transducer was then adjusted by moving it slightly to right by 1 to 2 cm and rotated anticlockwise by 10 to 15 degrees if needed. This allowed the sonographic image (see Figure 6) obtained to include both the gallbladder (0 shaped lumen) and branching of right portal vein (Y shaped) in Y0 configuration. Care was taken to include both superior and inferior margins of liver in that sonographic image (see Figure 1). If needed, the participant was asked to suspend breathing momentarily to acquire the image. C-Y0 was measured as the distance between the anteroinferior tip of the liver and superior-most point of dome/superior surface of liver in that image (see Figure 7). Whenever the exact Y0 image could not be obtained or there were anatomic variations, the radiologists were free to use a closely corresponding image, which included both the internal references.
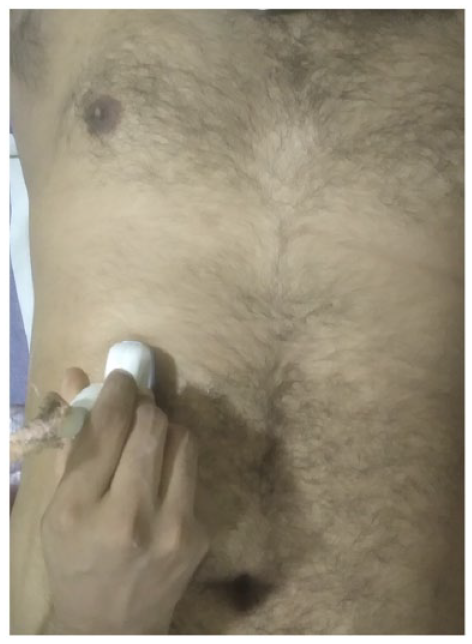
Depicting the position of the transducer to acquire an image in the right midclavicular line. Note the longitudinal position of the probe over the right hypochondrium in midclavicular line.
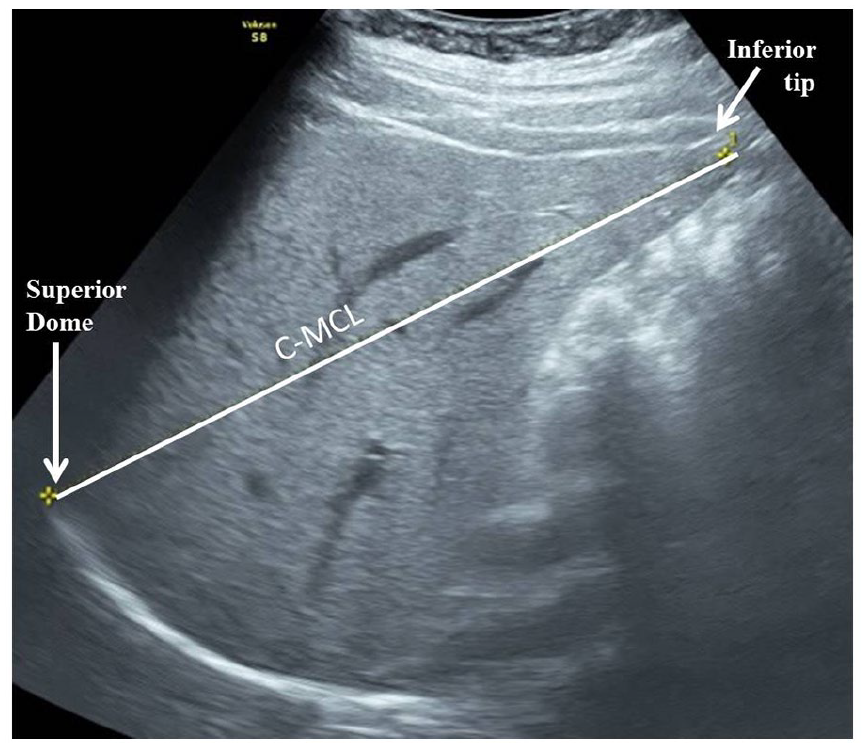
Two-dimensional sonographic image obtained in the right midclavicular line depicting craniocaudal measurement from dome to tip of liver (C-MCL).
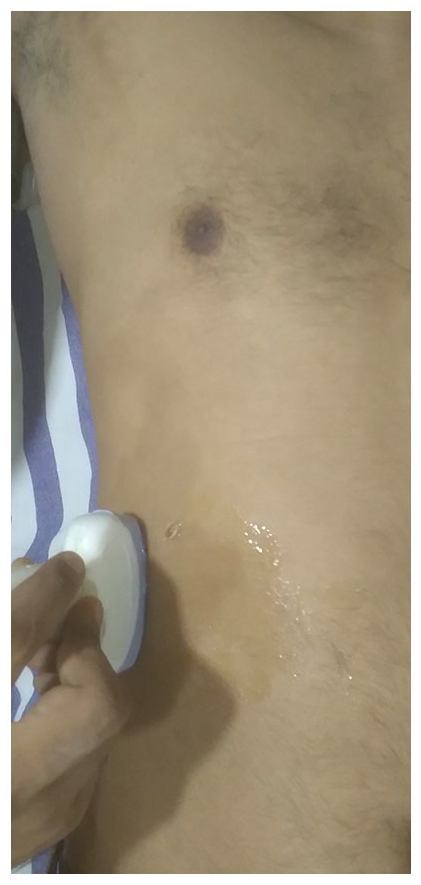
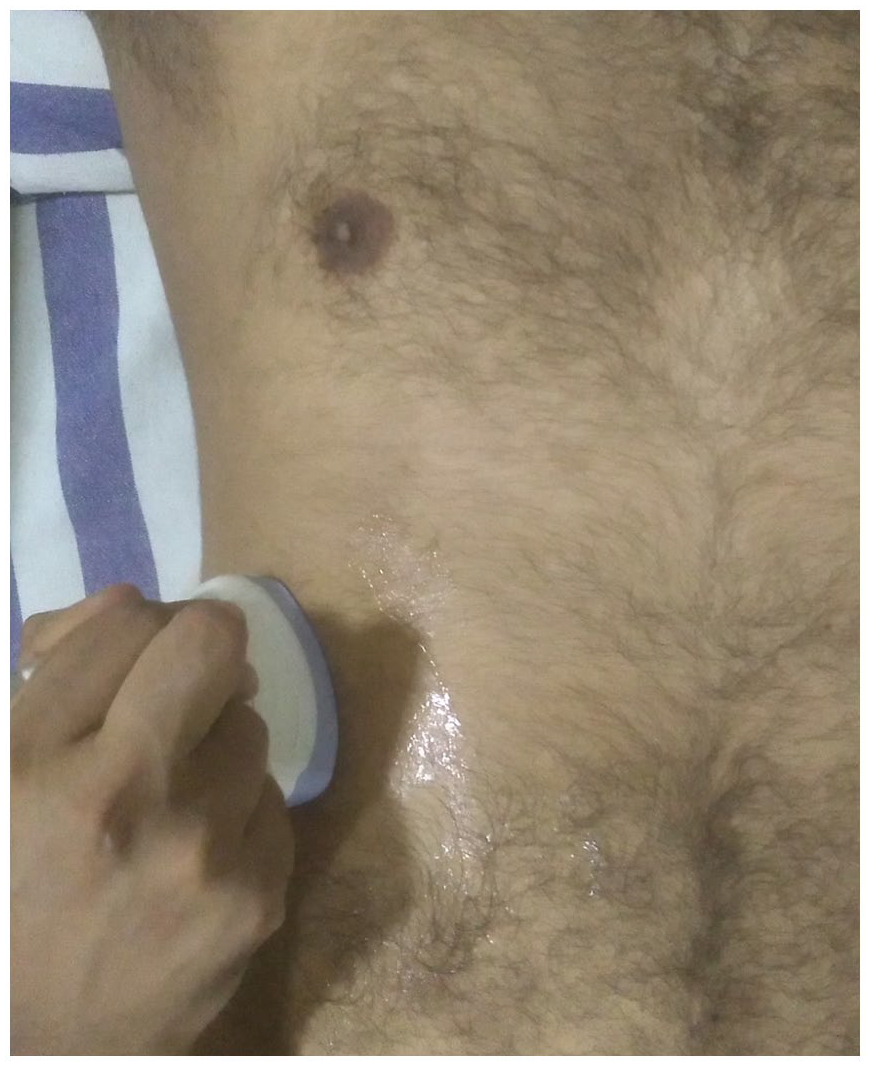
Depicting the position of the transducer to acquire an image in the right anterior axillary line. Note the longitudinal position of the probe over the right hypochondrium in the right anterior axillary line.
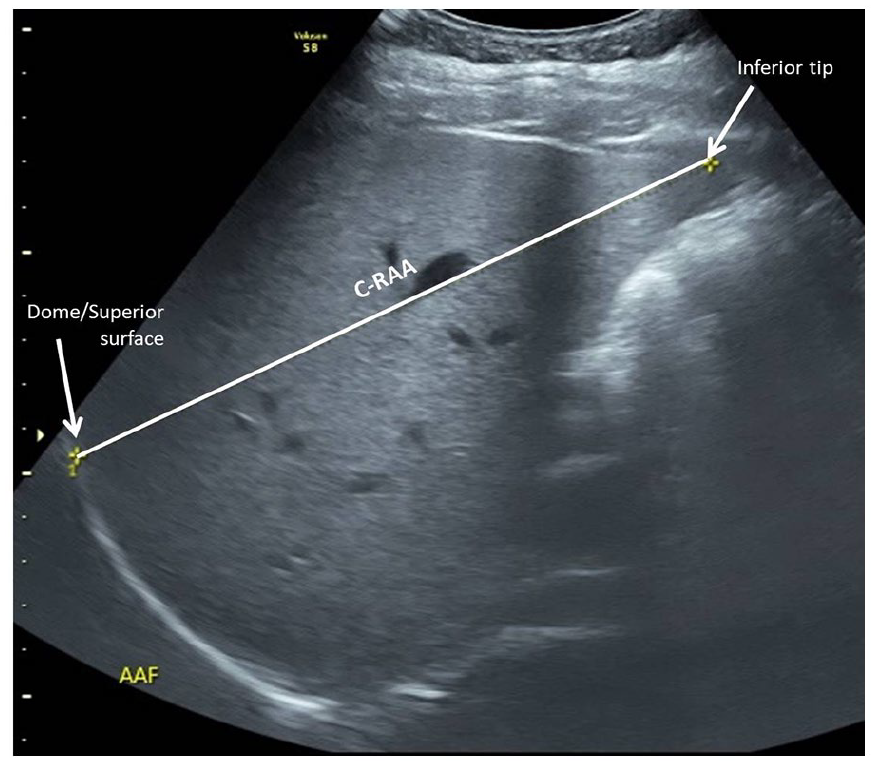
Two-dimensional sonography image obtained in the right anterior axillary line and depicting the craniocaudal measurement from dome to tip of liver (C-RAA).
Depicting the position of the transducer to acquire an image in the “plane of Y0.” Note that the transducer is placed over the right hypochondrium 2 cm lateral to the midclavicular line and rotated 10 degrees anticlockwise from the longitudinal position.
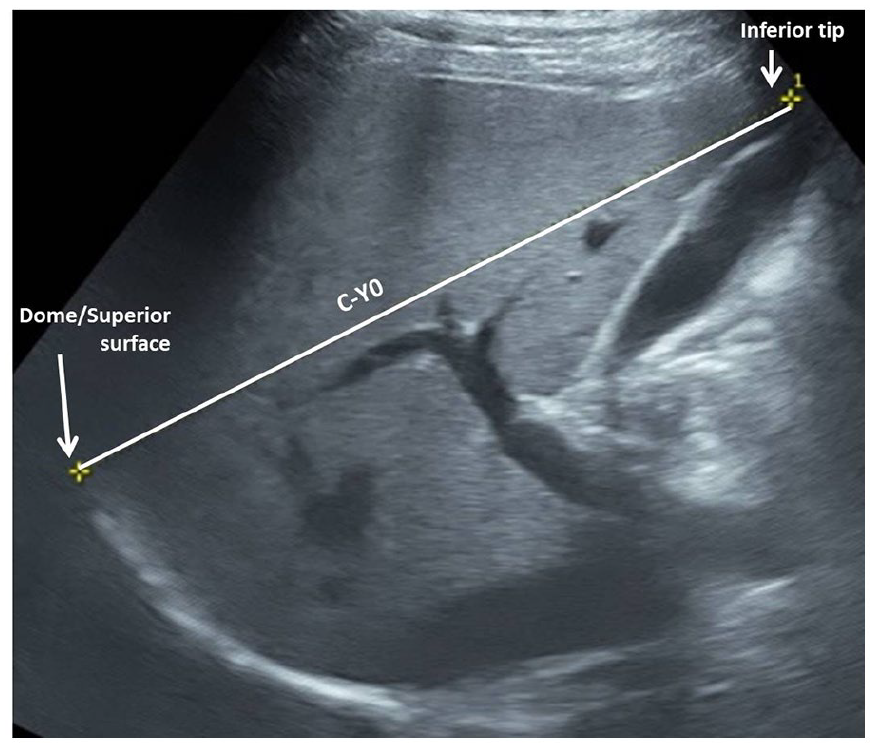
Two-dimensional sonographic image obtained in the “plane of Y0” and depicting the craniocaudal measurement from dome to tip of liver (C-Y0).
In addition to sonography, the 60 individuals originally referred for CECT of abdomen underwent multiphasic CECT abdominal imaging as per the requirements, and only images of the liver, in the portal phase, were included. A 16-slice Somatom Emotion (Siemens Healthineers, Germany) CT equipment system was used for CECT. In the facility where the study was done, CECT was done using bolus tracking technique. As per protocol, Iohexol of 300 mg Iodine/mL strength was injected intravenously (1.5 mL/kg bodyweight) at the rate of 4 to 4.5 mL/second using a single head pressure injector. The portal phase images were acquired after 40 seconds from the time of enhancement of 100 HU in the proximal abdominal aorta. The volume data acquired were then reconstructed in oblique sagittal plane corresponding to the “plane of Y0,” using multiplanar reformation algorithm on an Osirix application (see Figure 8). The image which closely matched the Y0 image (including gallbladder and branching of right portal vein in the same image) was selected in each case and C-Y0 measurement was done as on the sonogram.
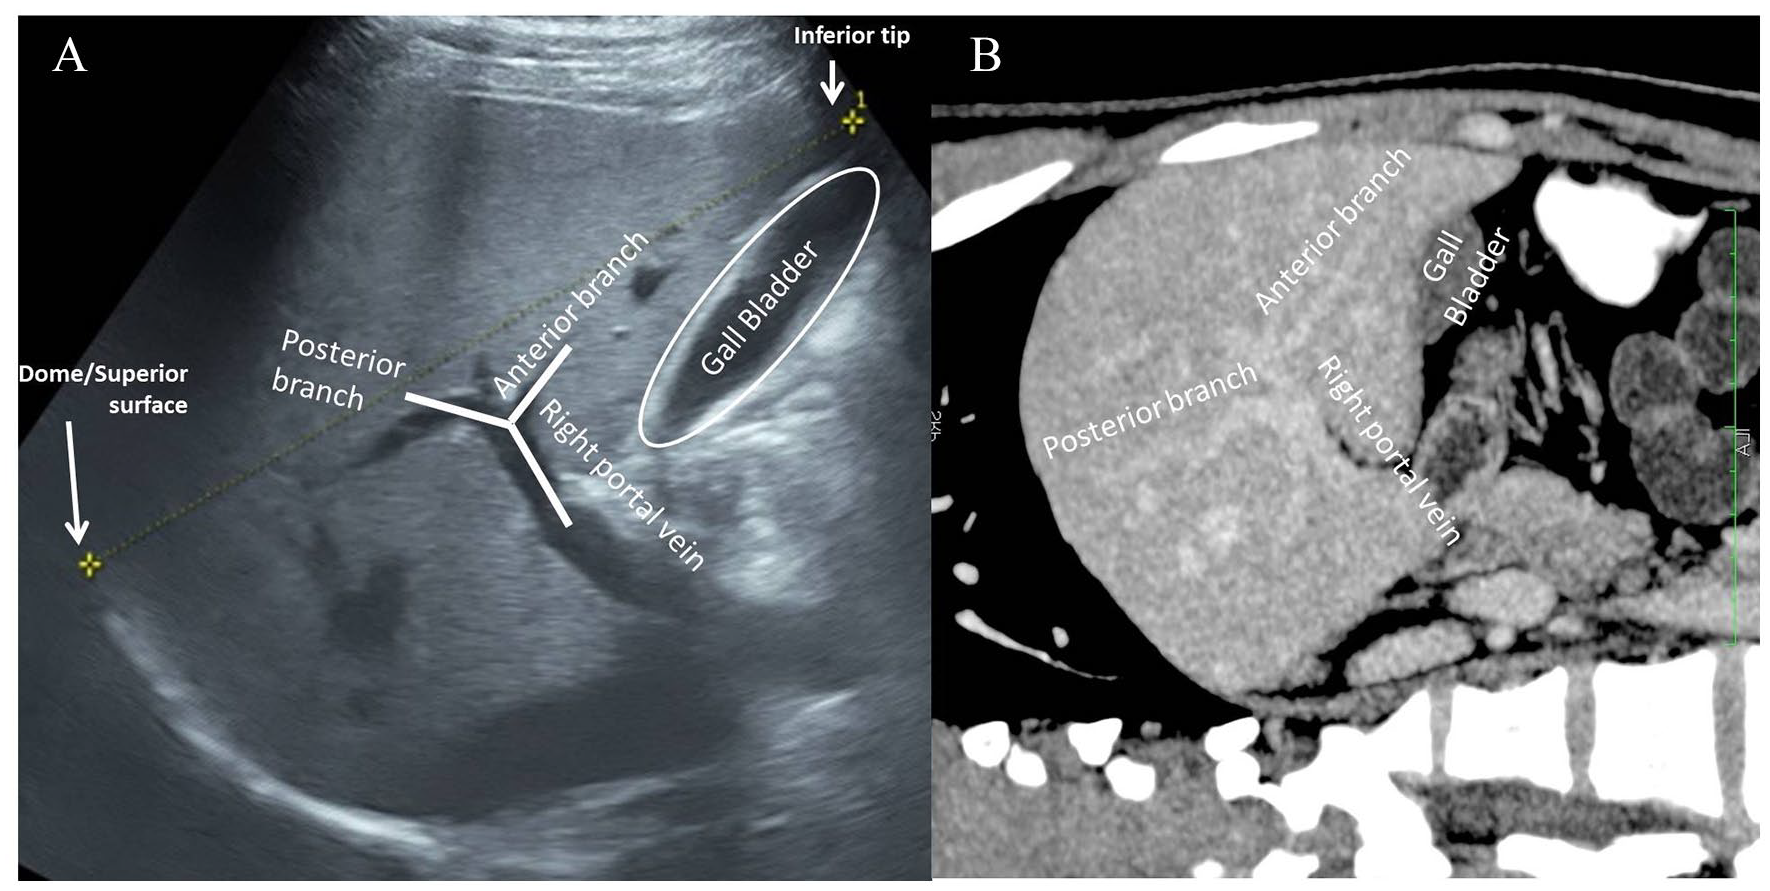
(A) Two-dimensional sonographic image of liver in the “plane of Y0.” (B) A corresponding image of liver in the “plane of Y0” within the portal phase of a contrast-enhanced computed tomography (CT). The CT image is a rotated, multiplanar reformatted image in a slight oblique sagittal plane of liver. Note the similarities between the two images.
The data were tabulated with the statistical product and service solutions (SPSS) software, version 16.0. Means and standard deviations were calculated for each method of sonographic measurement, for each radiologist. An intraclass correlation coefficient (ICC), for interrater reliability, was calculated for each method. The present study corresponded to a two-way random effects model based on mean of multiple raters and focused on the absolute agreement. The ICC values below 0.5 was considered poor reliability and between 0.5 and 0.75, between 0.75 and 0.9, and >0.9 were considered moderate, good, and excellent reliability, respectively.
The C-Y0 measurements of the 60 participants who underwent CECT were compared with their Y0 measurements with sonography for validity.
A normal reference range of liver size by C-Y0 method was estimated based on the data.
Results
From among the 460 prospective participants, 334 participants were included in the study after applying exclusion criteria. Two hundred ten participants were men and 124 were women. Of the 334, 274 participants had been referred for sonography and 60 for CECT abdomen. The age of the participants ranged between 18 and 62 years, with a mean of 34 years 2 months. One hundred forty-two of the 334 participants had undergone liver function tests in the prior 3 months, mostly as part of comprehensive health screening, which were within normal ranges.
The three radiologists obtained the sonographic “plane of Y0” easily in 280 participants. In 37 participants, the radiologists had to rotate the transducer significantly in an anticlockwise direction, for more than 20 degrees, to capture the Y0 image. In 17 participants, the exact image with a Y0 configuration could not be obtained by either two or all three of the radiologists. In such cases, the Y configuration of branching of the right portal vein was compromised due to only the terminal part of right portal vein, with or without the anterior/posterior branch, being included in the image. Even the vertically oval appearing image of gallbladder was compromised, due to a circular or oblong shape, in 35 participants.
The mean, standard deviation, and reliability of different methods are depicted in Table 1. Reviewing Table 1, the number of significant variations in measurements, with a difference of more than 1 and 2 cm, between any two or all three radiologists, was significantly less in the C-Y0 method compared with the other measurements. Even in the 54 participants in whom the exact plane of Y0 could not be obtained, the final measurements of the radiologists varied by more than 1 cm (between two out of three radiologists) in 14 instances.
Liver Size Measurement by Different Methods and Interrater Correlation.
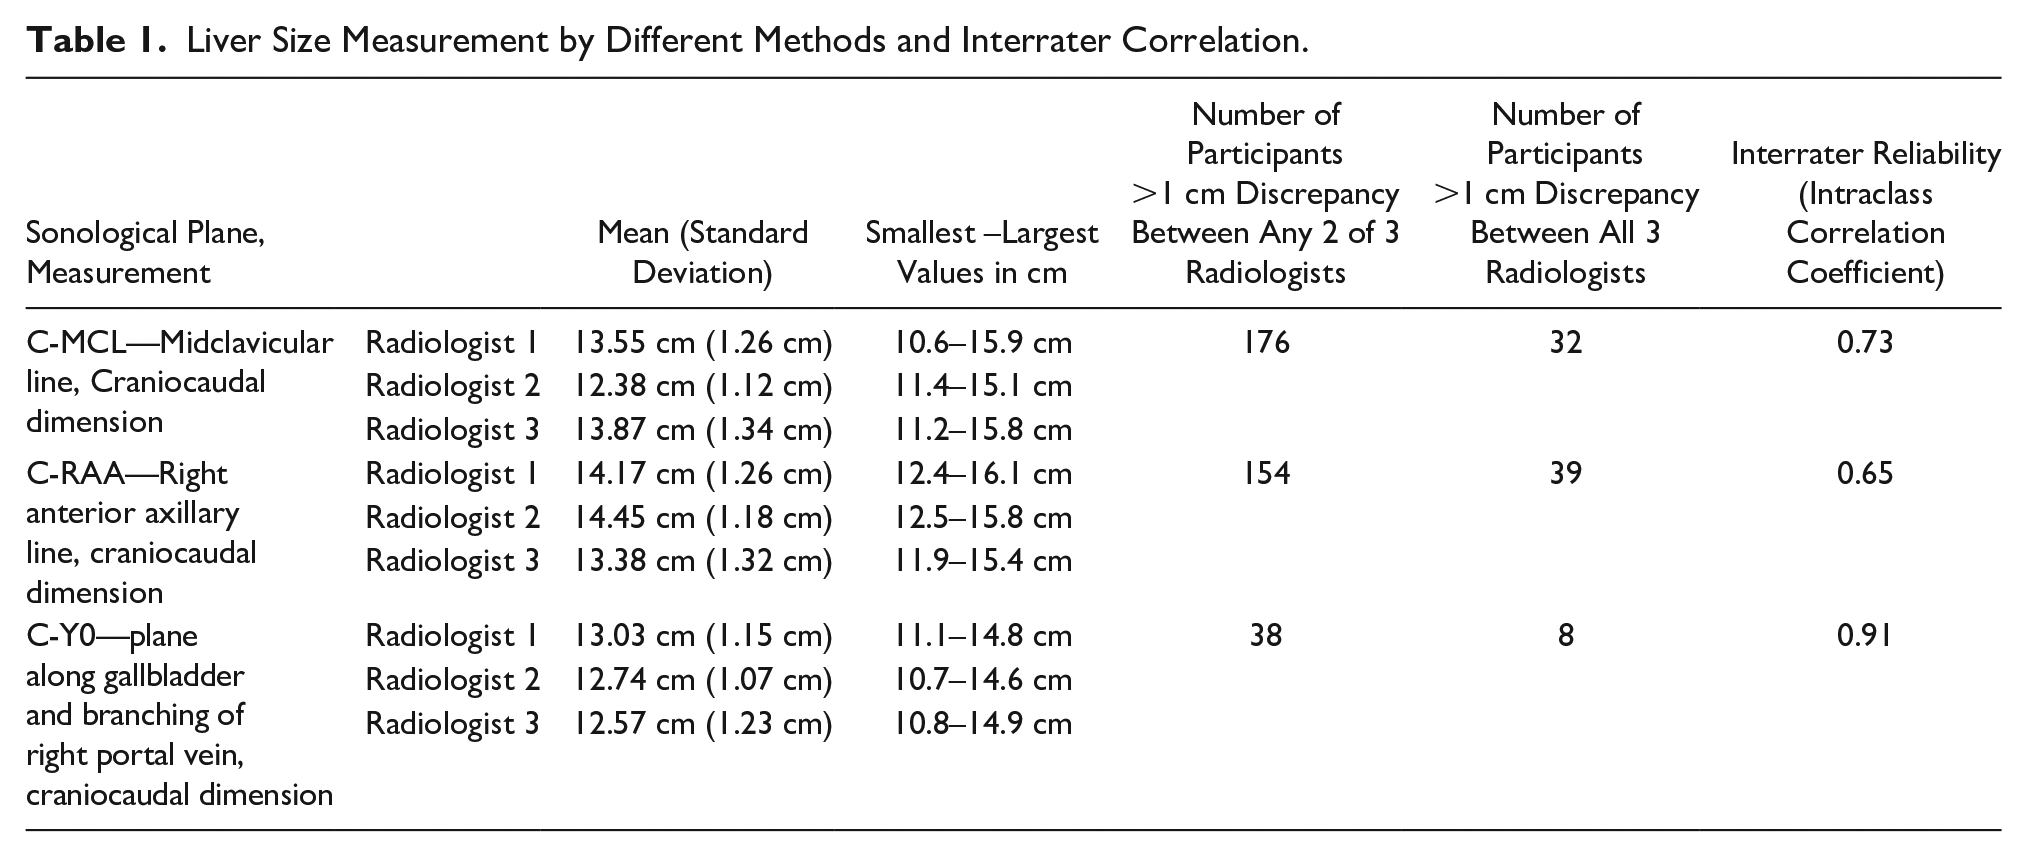
With a 95% confidence interval of the calculated ICC, the C-MCL and C-RAA measurements showed a moderate reliability, with values of 0.73 and 0.65, respectively. The C-Y0 measurement showed excellent reliability, with a value of 0.91.
On analyzing the images obtained for C-MCL and C-RAA measurements, it was noted that the images of liver of the same participant acquired by same method but by different radiologists varied considerably in terms of extent and segments of the liver included. However, most images saved for C-Y0 measurement were similar in appearance. Hence, reproducing a similar sonographic image was found to be easier by using internal references.
In the 60 participants who underwent both sonography and CECT, the mean value of Y0 was 12.79 cm with sonography and 12.61 on CECT. There was no statistically significant difference between these measures, as the calculated P value (based on the two sample t test) was .57. There was also a positive correlation between the Y0 values obtained on CECT and sonography, as determined by the Pearson’s correlation. The strength of the correlation coefficient was .74. This suggests that the Y0 measurement of liver, with sonography, was similar in accuracy to the corresponding measurement using CECT.
Based on the average of the measurement data generated by the three radiologists, across the 334 participants, the mean C-Y0 on sonography was 12.8 cm with a standard deviation of 1.15 cm. Hence, the expected normal range of this measurement in adults with a 95% confidence interval is 10.5 to 15.1 cm (approximated to nearest tenths).
Discussion
Comparing Different Types of Sonographic Measurements of the Liver
Various methods have been used to measure liver on sonography. Traditionally on a sonogram, the liver size is assessed by measuring the craniocaudal dimension, in the midclavicular line, as it corresponds to a clinical liver span estimation. Niederau et al measured it between the anterior most points of superior and inferior margins of liver in the midclavicular longitudinal scan and proposed a mean value of 10.5 ± 1.5 cm. However, there were difficulties in visualizing the anterior most part of superior margin due to the shadow caused by air in the overlapping part of the right lung, making it cumbersome. 2 This method provides a relatively foreshortened and projected vertical measurement, whereas the actual longest craniocaudal dimension of liver is oriented in an oblique anterior-posterior plane (dome to tip).
Patzak et al measured craniocaudal dimension of liver in midclavicular line. 3 They opted to measure the maximum height of liver (dome/superior-most part to inferior-most tip of liver corresponding to the C-MCL measurement performed in the present study, see Figure 3) rather than between the anterior most points. Several other studies including Kratzer et al, 4 Ozmen et al, 5 Childs et al, 6 Riestra-Candelaria et al, 7 and so on have used this measurement method.
This method of measuring the longest dimension has also been employed in the present study in all three planes of measurement: midclavicular line (see Figure 3), right anterior axillary line (see Figure 5), and the “plane of Y0” (see Figure 7). Although these measurements provide slightly oblique length rather than true craniocaudal dimension, it reflects the accurate height of the liver. The superior-most part of the liver is located much posterior under the dome of the right hemi-diaphragm as compared with the inferior-most tip which is closer to the anterior abdominal wall.
There are some studies employing the anteroposterior measurement of liver in the midclavicular plane.2,6-8 But there is lack of data on this measurement in liver abnormalities unlike craniocaudal measure. However, the same “plane of Y0” can be used to measure AP diameter, due to its excellent reproducibility.
Riestra-Candelaria et al found the longitudinal maximum dimension in midaxillary line to be more accurate when compared with similar measurements on the cadaveric liver. 7 However, this produces a coronal sonographic image of the liver, in which the maximum craniocaudal dimension measured will be along the lateral margin of right lobe, which may be exaggerated due to wide variations including Riedel’s lobe. 9 This method was again based on external references.
Various models of estimation of volume of liver have been proposed claiming good reliability and validity. However, in the setting of a busy practice, they are relatively complex and time-consuming.6,10
The results of the present study would suggest that the sonographic measurement of liver, in the near sagittal plane passing through the branching of right portal vein and gallbladder, has better reliability than other commonly used methods, which are based on references on the surface of the abdomen. The results gain significance in the backdrop that there are no significant studies/methods using such internal references for liver measurement on sonography.
Comparing C-MCL and Y0 Values
The mean values of C-MCL (see Figure 3) obtained in different studies have recorded as 15 cm ± 1.5 cm (Patzak et al), 3 14 cm (±1.7 cm) (Kratzer et al), 4 14.98 cm (±1.67 cm) (Ozmen et al) 5 , and 13.9 cm (±1.6 cm) (Childs et al). 6 In the current study, the mean of C-MCL was 13.3 cm (±1.24 cm). The values obtained in the present study were lower than the widely accepted upper limit of 16 cm. In contrast, most of the above mentioned studies had multiple values larger than 16 cm. The differences are likely due to different study populations who vary in anthropometric measurements. Mean C-Y0 (see Figure 7) values obtained in near sagittal plane in the present study was 12.8 cm (±1.15 cm), which is significantly lower than C-MCL values obtained in present and different studies.
Comparison of Interrater Variability
The “plane of Y0” was found in near sagittal plane close to right midclavicular line in most cases and hence almost mirrored the clinical liver assessment and C-MCL sonography methods with significantly better reliability. The plane was easily obtained in majority of participants and was not found to be dependent on the phase of respiration. Even in the small number of participants where exact “plane of Y0” could not be obtained (54 of 334), a subtle compromise in the shape of right portal vein and/or its branches and/or gallbladder yielded similar results. Due to two specific identifiable internal references within this plane, it was easy to reproduce the images not only on sonography but also on CECT.
Very few studies have estimated the interrater variability of these measurements. Child’s et al found an excellent reliability for all the right lobe measurements. The drawback of that study was a small sample size of 12 participants. Overall, the most reliable measurements were found to be perimeter and area at MCL level. The most reliable linear measurement was C-MCL (ICC = 0.93) followed by maximum anteroposterior measurement in MCL (ICC = 0.83). Yet C-MCL was found to reliably detect true differences of more than 2.7 cm only. The study showed moderate to poor reliability for most of the left lobe measurements. 11 In the present study, the C-Y0 (Figure 7) showed excellent reliability (ICC > 0.9), whereas C-MLC and C-RAA showed moderate reliability (ICC = 0.5–0.75).
Strengths of the Study
The study was unique in employing three radiologists, who were unaware of their colleagues’ findings to accurately check the interrater correlation. The present study used a sample size larger than most other comparable studies.
Limitations
The study focused on reliability of a novel method in comparison with other commonly prevalent craniocaudal measurements. It did not include anteroposterior measurements of liver. However, due to excellent reproducibility of the “plane of Y0,” it is opined that anteroposterior measurement, in the same plane, will show good to excellent reproducibility. Further studies are planned in this regard. Other dimensions of liver like left lobe dimensions, area, and volume were not included in this study as the purpose was to compare single most representative linear measurement for clinical use.
The exact “plane of Y0” is not feasible in cases with an absent, abnormal gallbladder, variations of right portal vein, or distorted architecture of liver. Although the study did not cater to such conditions, it is recommended to try and include both internal or one internal and one external reference points to get better reliability and document the same for future comparisons.
Conclusion
The method of sonographically measuring liver in the “plane of Y0,” with two specific identifiable internal references (e.g., branching of right portal vein -Y shape and gallbladder lumen-0 shape), is both reliable and valid. These results would suggest a replication of the technique in clinical practice instead to possibly substitute for measures based on external references.
Footnotes
Declaration of Conflicting Interests
The authors declared no potential conflicts of interest with respect to the research, authorship, and/or publication of this article.
Funding
The authors received no financial support for the research, authorship, and/or publication of this article.