
Abstract
Objective:
Sonographic estimated fetal weight (EFW) has an influence on the management of a pregnancy. The Hadlock 4 regression model (Hadlock-4), based on fetal biometry, is widely used. There are significant discrepancies noted between EFW, using Hadlock-4, compared to the actual infant birth weights (ABW) in the author’s clinical practice. The research objective was to compare the EFW, using Hadlock-4, with ABW and determine minor arithmetic modifications needed for this population.
Materials and Methods:
A prospective observational study was done enrolling women in the third trimester, who underwent sonography and delivered within a week of the examination. The sonographic cases were divided into class intervals by gestational age. The EFW were compared with the ABW, using a Pearson coefficient and mean percentage errors (MPE). The EFW values were increased or decreased, by a certain percentage, to keep the mean percentage error in an acceptable range.
Results:
The strength of association between the EFW and ABW was 0.69 (p = .014). The EFW and the MPEs for women delivering at 36-40 weeks and beyond was significantly more (13.2 and 18.2%). The EFWs at 36-40 weeks and beyond 40 weeks were reduced by 3 and 8% respectively, which reduced the MPEs. After this modification 97.6% of ABWs fell within +/-2 standard deviations of the EFWs.
Conclusion:
A simple 3 and 8% reduction of EFWs, using the Hadlock-4, with those sonographic examinations at 36-40 weeks and beyond 40 weeks gestation respectively, is proposed to increase reliable in this Indian patient practice.
Fetal birth weight can be an important predictor of mortality and morbidity in the immediate postnatal period and infancy. Low birth weight, defined as birth weight less than 10th percentile (corresponding to 2500g at birth) 1 and very low birth weight (less than 1500 g) 2 new-borns fare poorly, in terms of survival, growth and development.1,3 They are also more prone for adverse neurological events, 4 infections and malnutrition. 5 Even large for gestational age new-borns (more than 90th percentile corresponding to birth weight >4000 gm at term) are at increased risk of perinatal mortality and morbidity and most often need to be delivered surgically. 6 Hence, fetal birth weight is an important criterion to plan management and prognosticate in all pregnancies. Knowing approximate fetal weight in utero will also guide in assessing fetal lung maturity and appropriate time of delivery. Sonography is the widely used imaging modality to visualize the fetus in utero and also ascertain the estimated fetal weight (EFW). EFW is an important marker of fetal growth and well-being and provides vital clues to the obstetrician to decide best possible management. Hence it is imperative for EFW to accurately depict the actual weight of the fetus in utero at that point in time.7–9 Various models have been proposed to assess EFW, with sonography and they are based on fetal biometric measurements.10–19 The Hadlock regression model (Hadlock-4) utilizes 4 fetal measurements of head circumference (HC), biparietal diameter (BPD), abdominal circumference (AC) and femur length (FL), which are considered reliable and widely used.20–22 The Hadlock-4 was based on American population data. This method has also been found by some studies to be more accurate in an Indian population context.23,24 Most of present ultrasound equipment systems that are available in India are configured with Hadlock-4. However, in authors’ practice, discrepancies have been noted between EFW, using this method, and the actual birth weight (ABW). Obstetricians often complained about these issues affecting the management of cases in an adverse manner. The aim of this study was to compare EFW, using the Hadlock-4, with ABW and also determine whether some minor arithmetic modifications were needed for this population.
Materials and Methods
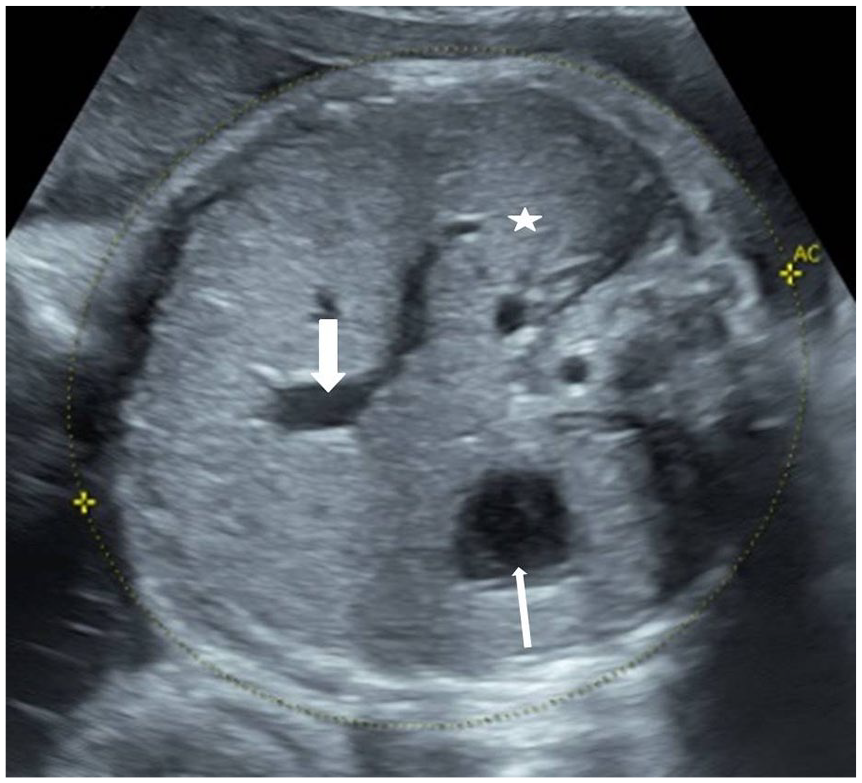
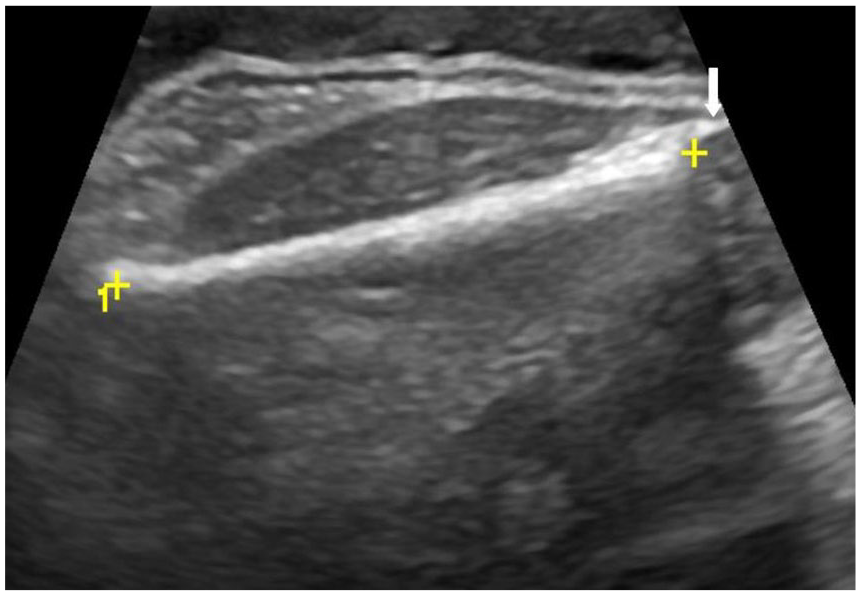
A prospective study was conducted in a tertiary care hospital for a period of 2 months (Jan-Feb 2021). Institutional review committee clearance was obtained for the study. All pregnant women presented to sonography suite, during the study, in their third trimester. They were enrolled into the study with an intention to include at-least 250 women who would deliver an infant, within a week of their last sonogram. 25 The sample size was calculated based on the delivery rates of the host institution. Participants were considered as being in the third trimester if their gestational age (GA) was more than 28 weeks, which was determined by their last menstrual period (LMP) or any first trimester sonogram available. Whenever there was a discrepancy between GA by LMP or earlier sonogram, the GA determined by sonography was considered for study inclusion. When neither LMP nor earlier sonogram report was available, the participant was excluded from the study. After taking informed consent, an obstetric sonogram was performed using a GE Logiq P9 (GE Healthcare, CHicago, USA) ultrasound equipment system. Two radiologists, each with 6 years of experience in antenatal sonography, performed the examinations. The images and measurements were considered appropriate only after both the radiologists reviewed and agreed. Whenever there was ambiguity among the radiologists, image acquisition and measurements were repeated until consensus was achieved. A 3-5 MHz C1-5 Convex transducer was used for the sonogram. All fetal anomalies detected during the present or past sonogram were excluded from the study. BPD, HC, AC and FL of the fetus were measured on static sonographic images using the digitized calipers on the monitor. The BPD and HC were measured, in the axial plane, of the fetal head at the level of thalami and cavum septum pellucidum. The maximum transverse diameter of the fetal head, measured from the outer table of the calvarium, (side closest to the transducer) to the inner table (side distal to the transducer), constituted the BPD measurement (see Figure 1). HC was measured using an ellipse tool drawn along the outer table of the calvarium all around the outer edge (see Figure 2). The AC was measured in the axial plane which consisted of the gastric bubble, fetal liver, and a short segment of umbilical vein (see Figure 3). The femur proximal to the transducer and oriented parallel to the transducer plane was selected to measure FL. The entire length of the femur, excluding the epiphyses, was measured using straight line tool on the ultrasound equipment system’s monitor (see Figure 4).26,27 The ultrasound equipment system was preconfigured, by the manufacturer, to calculate the EFW using the following Hadlock-4 formula10,11:
Note: Two standard deviations (SD) of EFW, based on Hadlock-4, encompasses 15% of values on either side of the EFW.
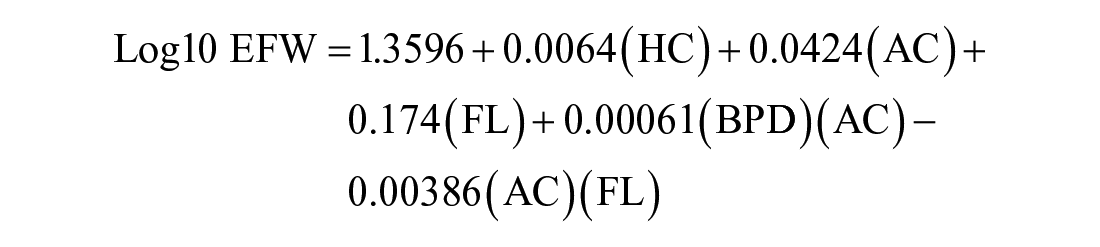
An example axial B mode sonographic image of the fetal head depicting the measurement of BPD. The midline hyperechoic linear falx cerebri (thick white arrow) is interrupted by hypoechoic cavum septum (thin white arrow). Echogenic columns of fornix (arrow heads) and thalami (asterisks) are seen on either side. BPD is the widest transverse diameter in this plane measured with digital calipers from the outer table of calvaria proximally to inner table of the skull distally. BPD, biparietal diameter.
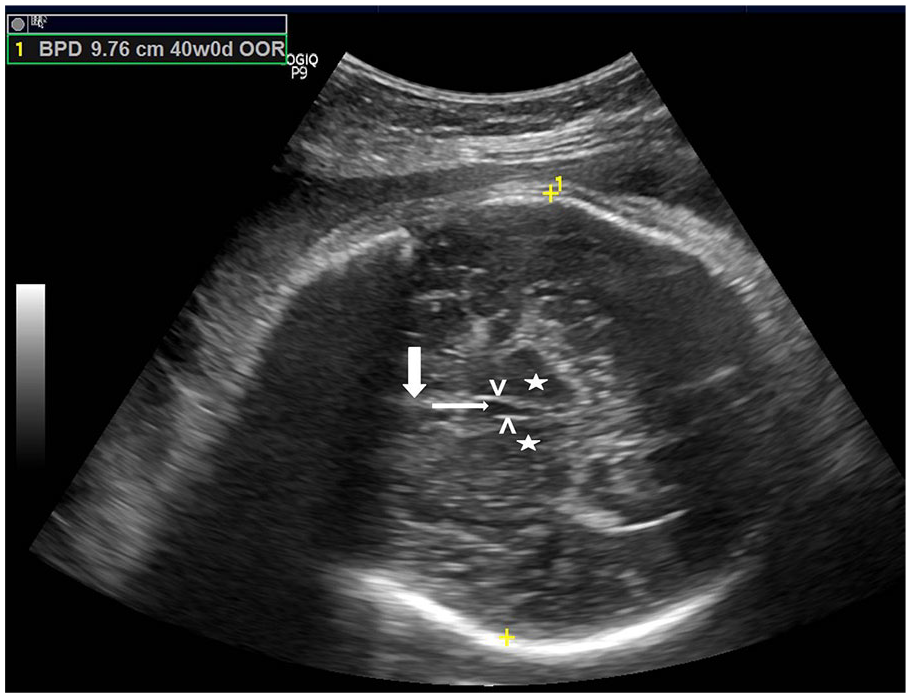
An example axial B mode sonographic image of the fetal head depicting the measurement of the HC. The midline hyperechoic linear falx cerebri (thick white arrow) is interrupted by hypoechoic cavum septum (thin white arrow). Echogenic columns of fornix (arrow heads) and thalami (asterisks) are seen on either side. HC is the axial circumference of the skull measured along the outer table in this plane. HC, head circumference.
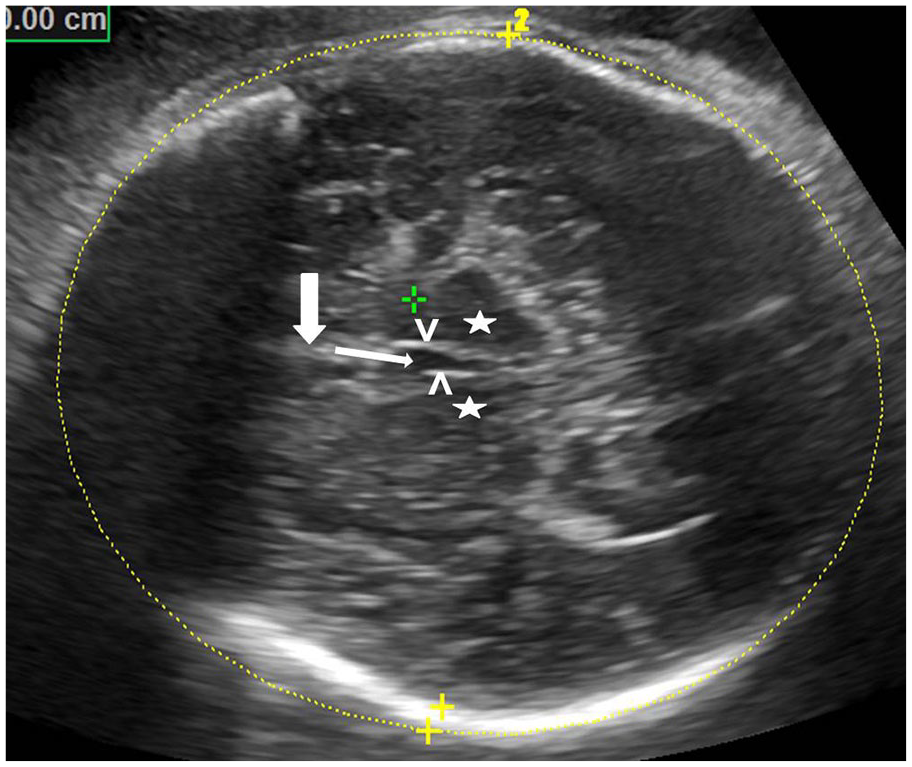
An example axial B mode sonographic image of the fetal abdomen depicting the measurement of AC. The stomach bubble (thin white arrow), umbilical vein at portal sinus (thick white arrow) and liver (asterisk) is seen in this plane. AC is the outer circumference of the abdomen measured along the skin. AC, abdominal circumference.
An example longitudinal B mode sonographic image of the fetal femur depicting the measurement of femur length (FL). Note that the epiphyses (thin white arrow) are not included in the measurement.
If the pregnant woman delivers within 7 days of the sonogram, then the actual birth weight of the neonate, as entered, in the parturition register of the institution, was noted. All newborns were weighed in the labor and delivery room as a protocol, immediately at birth. All infants were weighed on a digital scale in grams (up to 4 numeric digits). This weight was entered into the parturition register. Other pregnant women who did not deliver within 7 days of the sonogram were excluded from the study.
The data were tabulated using Microsoft Excel 2010. A Pearson’s correlation coefficient was calculated to look for linear relation between the actual birth weight and estimated fetal weight with Hadlock-4. The strength of association was set a priori at the significance of p less than .05. The data were divided into class intervals of gestational age at delivery. The means and standard deviations were calculated. A percent error for each case was calculated with the formula:

The mean percentage error (MPE), which is the average of percentage errors by which EFW differ from ABW, was calculated for each class interval and overall data. If the EFW and ABW demonstrated a linear correlation, based on MPEs. The plan was to apply basic arithmetic modifications, in terms of increase or reduction of all EFWs in the class interval by a certain percentage to bring MPEs to acceptable levels (close to 10%), for each class interval.
Results
A total of 543 pregnant women, who presented for sonography, at the third trimester were considered for inclusion in the study. In this cohort, 38 women were excluded for reporting an unknown LMP and no previous sonographic data. Another 6 patient cases were excluded due to presence of fetal anomalies. In 72 patients, the exact fetal planes for biometry measurements could not be obtained, therefore their sonograms were not included. The antenatal sonographic data for the remaining 427 pregnant women was collected for this cohort study. Among these patients, 289 women delivered within 7 days of their last sonographic examination. The remaining 138 women continued their pregnancies beyond a week or delivered in other medical facilities therefore were excluded from the study (See Figure 5).
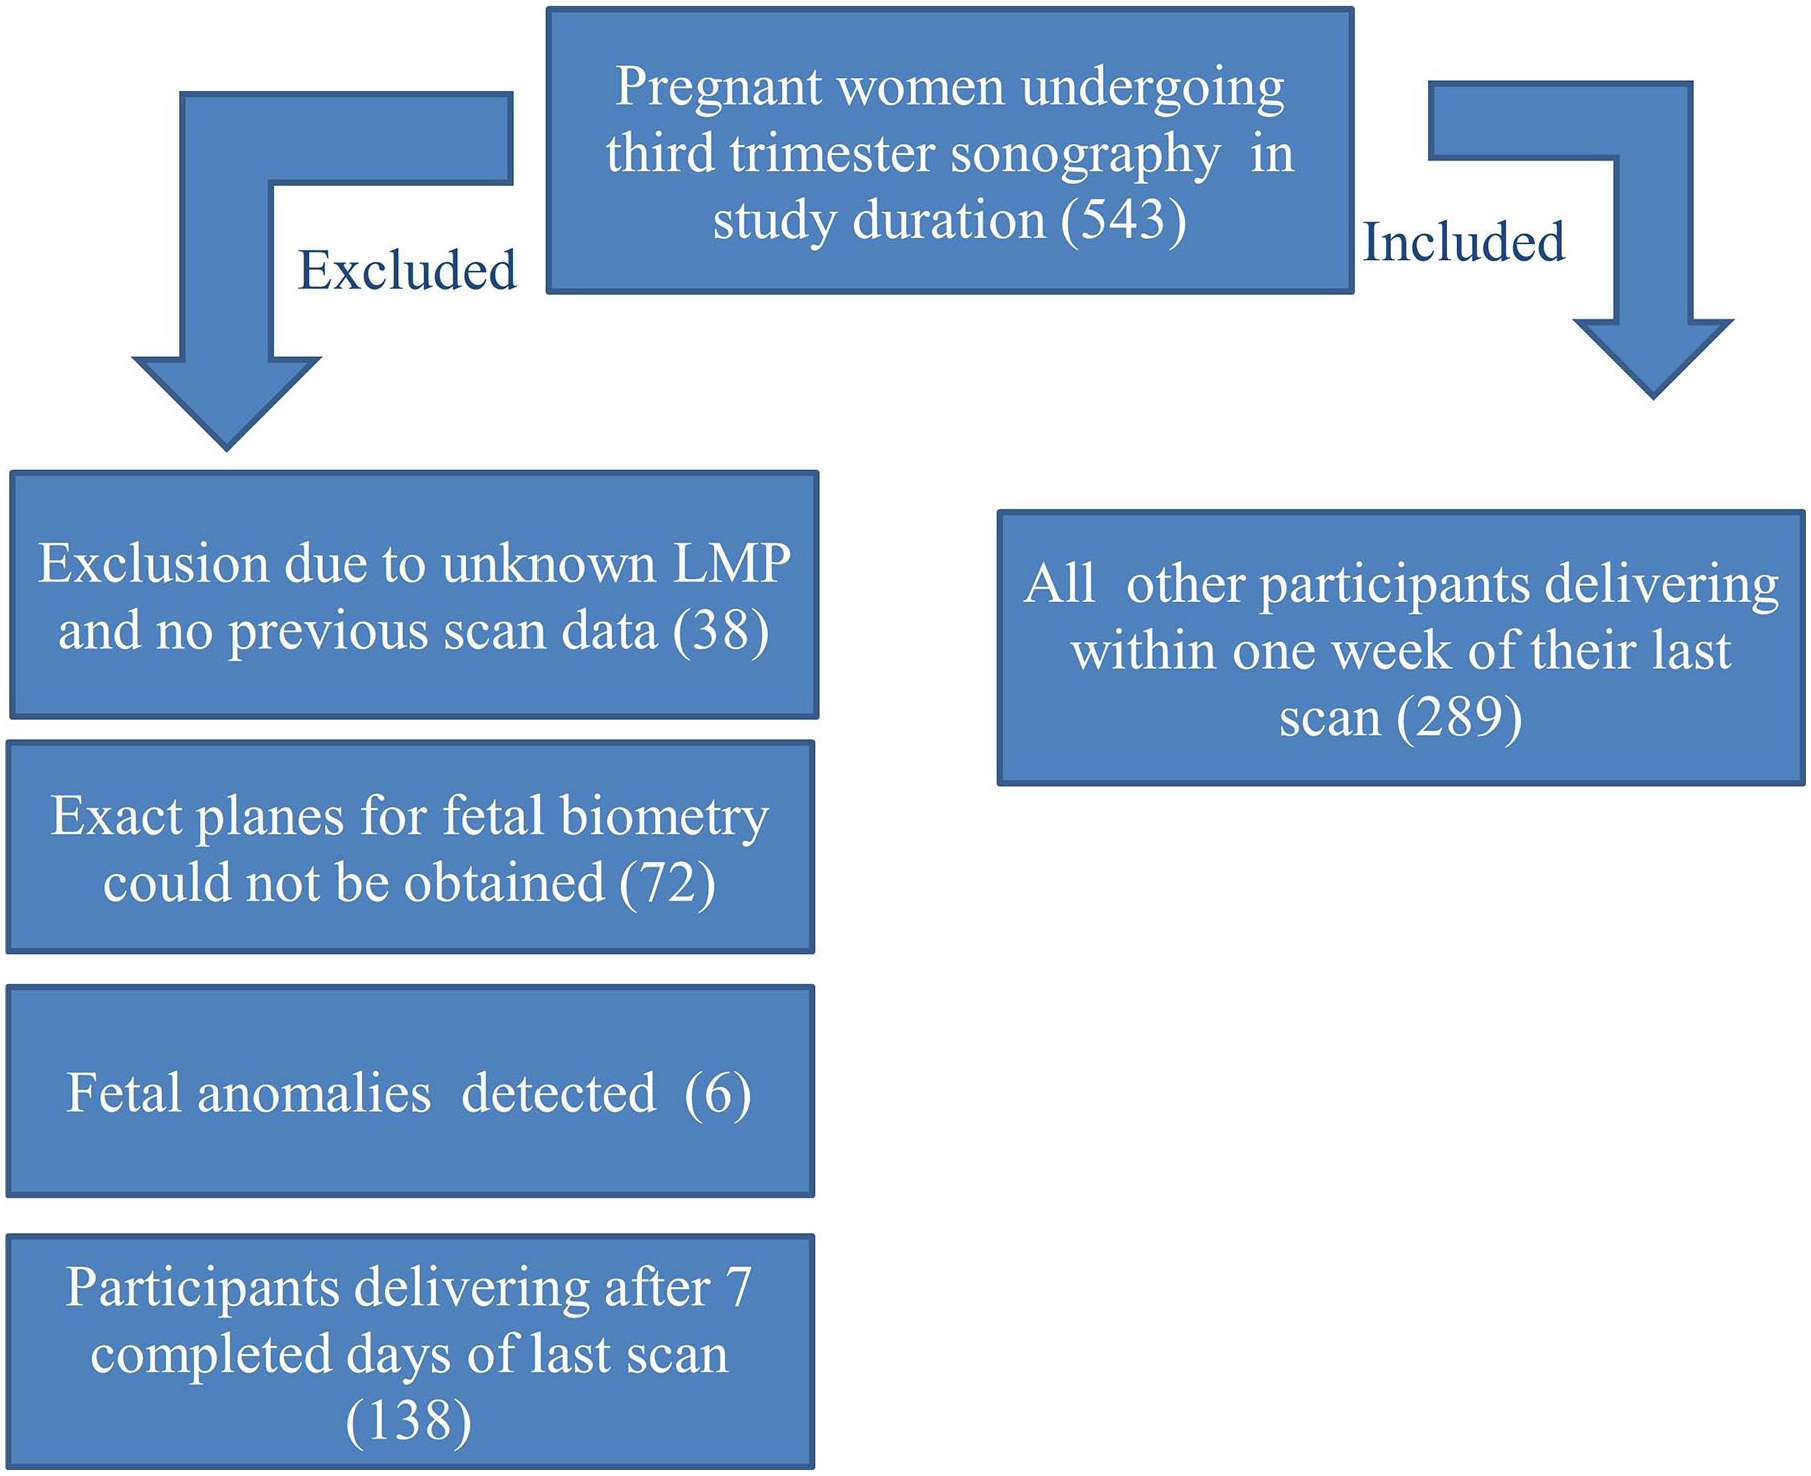
An inclusion and exclusion flow chart that depicts the number of study participants that were recruited, consented, and followed throughout the research study.
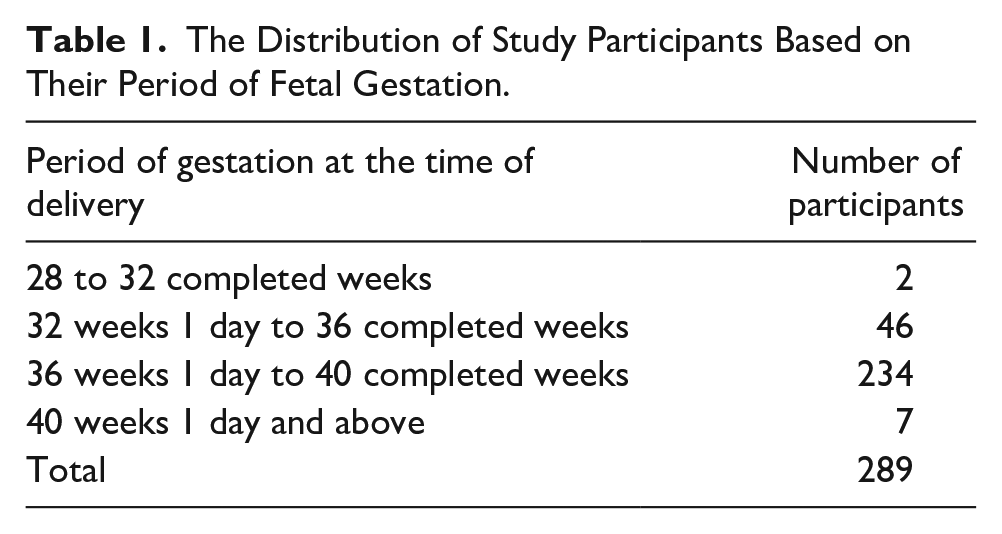
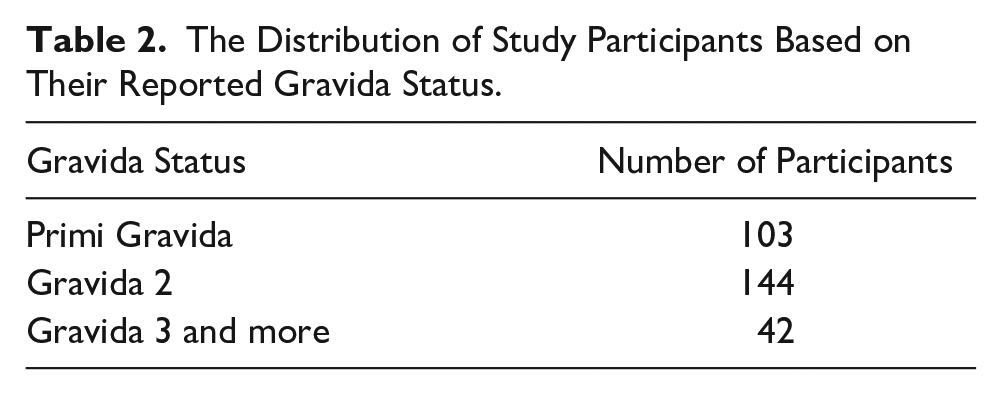
The mean age of this patient cohort was 25 years and 5 months, with a minimum of 20 years 8 months and a maximum of 33 years 10 months. The distribution of cases based on period of gestation at delivery is depicted in Table 1. The earliest delivery was at 31 weeks 2 days and the latest delivery was 40 weeks 5 days. The majority of the pregnant women, enrolled, delivered between 36 weeks and 40 weeks. Of the 289 cases, 223 delivered vaginally and 66 underwent Cesarean (CS) delivery, for due varied reasons such as a previous CS, breech presentation, delayed progression of labor, and other issues. Table 2 depicts the distribution of the gravida status of the women enrolled, in the study. A large number of enrolled women delivered between the third and sixth day after their last sonogram (See Figure 6).
The Distribution of Study Participants Based on Their Period of Fetal Gestation.
The Distribution of Study Participants Based on Their Reported Gravida Status.
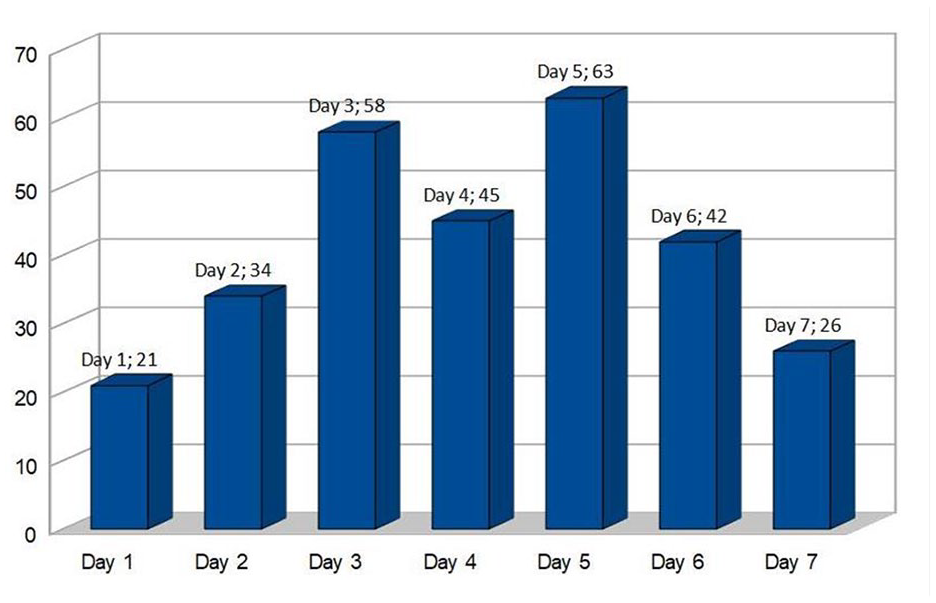
A bar chart showing the distribution of number of participants on the basis of the day of delivery starting from the day of their last sonogram. The number after the semi-colon is the number of participants delivering on that particular day.
In 203 of 289 patient cases, the EFW was higher than the ABW. In the remaining 86 cases the ABW was higher than EFW by a mean of 3.6%. In 57 out of 289 (19.7%) cases, the ABW’s were lesser than the defined 2SD of the value of EFW. There were 5 cases in which the ABW was more than of the value of EFW, by over 15%. Overall, 62 (21.4%) ABW values were beyond 2 SD of the EFW. The Pearson’s correlation coefficient was determined to be 0.69, which indicated a positive correlation between EFW by Hadlock-4 and ABW with p < .014. The break-up of the mean EFW and ABW with percentage errors at various class intervals of gestational age at delivery are provided in Table 3. The overall mean percentage error between EFW and ABW is 12.8% in a positive direction, meaning the EFW was by 12.8%.
The Mean Estimated Fetal Weights and Actual Birth Weights, at Different Gestational Periods, With Mean Percentage Errors.
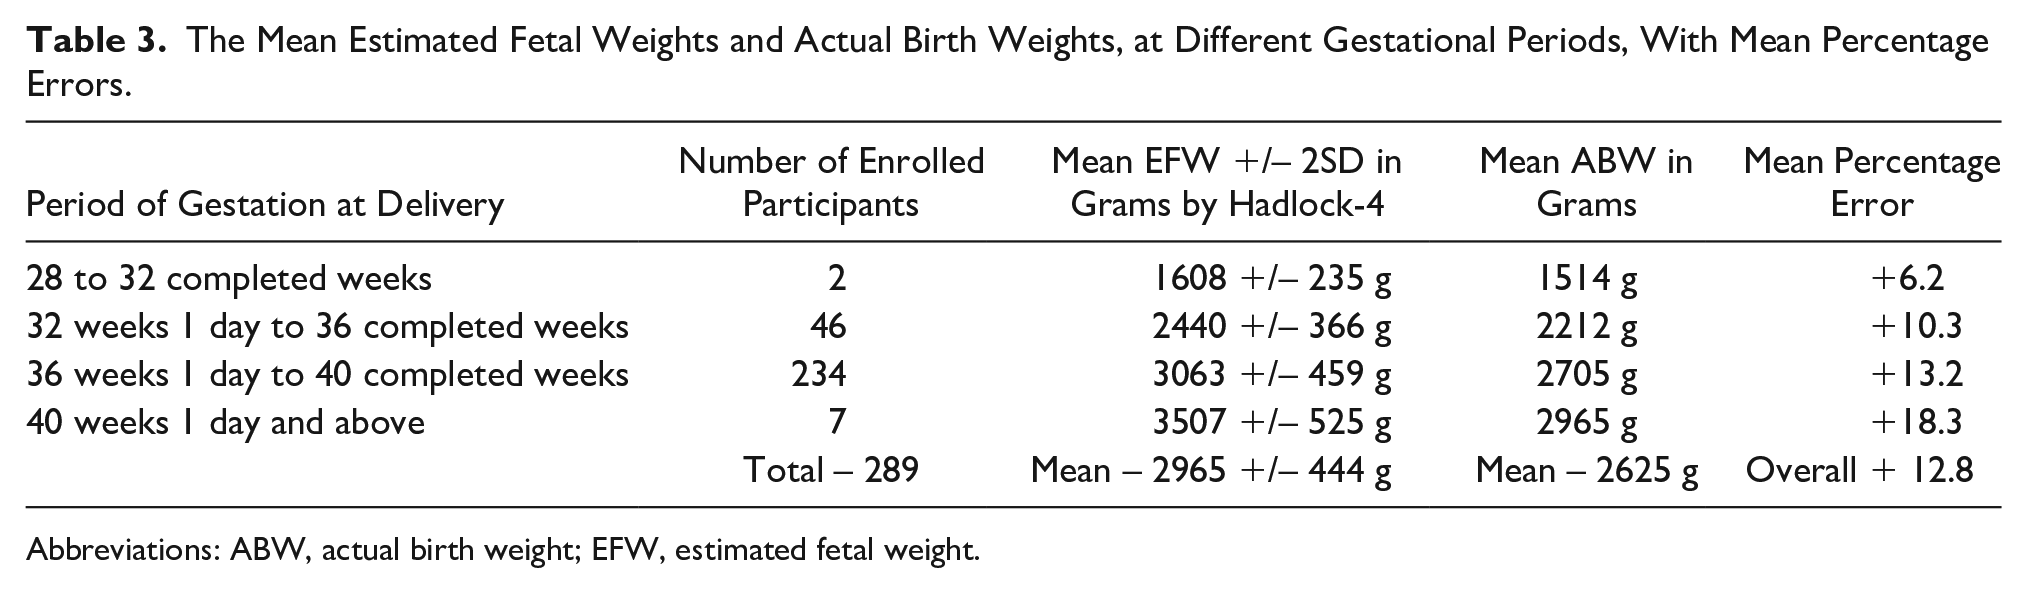
Abbreviations: ABW, actual birth weight; EFW, estimated fetal weight.
Table 3 suggests that Hadlock-4, in its current form, with a mean percentage error of up to 10.3% at 36 weeks GA and below, is within acceptable limits and is appropriate within this Indian population. However, there was a disproportionate increasing trend of mean percentage error with increasing gestational age at delivery, beyond those completing 36 weeks. As there was linear correlation, a simple reduction in the EFW to bring MPE close to 10 percent was envisaged. This was done by noting the amount of MPE beyond 10% and therefore reducing the individual EFWs, of the respective class intervals, by that percentage (See Table 4). Between those patients who completed 36 and 40 weeks of GA, the MPE was 13.2%. Hence the EFW in those class intervals were reduced by 3% each and a revised mean EFW and MPE were calculated. Similarly for GA 40 weeks and beyond, the individual EFWs were reduced by 8% (MPE 18.3%). With these modifications the revised MPE for those between 36 to 40 weeks estimated date of delivery (EDD) was 9.8% and those 40 weeks and beyond it was 8.8%. The overall mean percentage error of the study reduced to 9.8 %. The number of ABW’s beyond 2 SD of EFW drastically reduced from 21.4% (62) to 2.4 % (7), after the revision of EFW.
The Applied Modifications and Revised Values to the Mean Estimated Total Weights and Mean Percentage Errors for This Data Set.
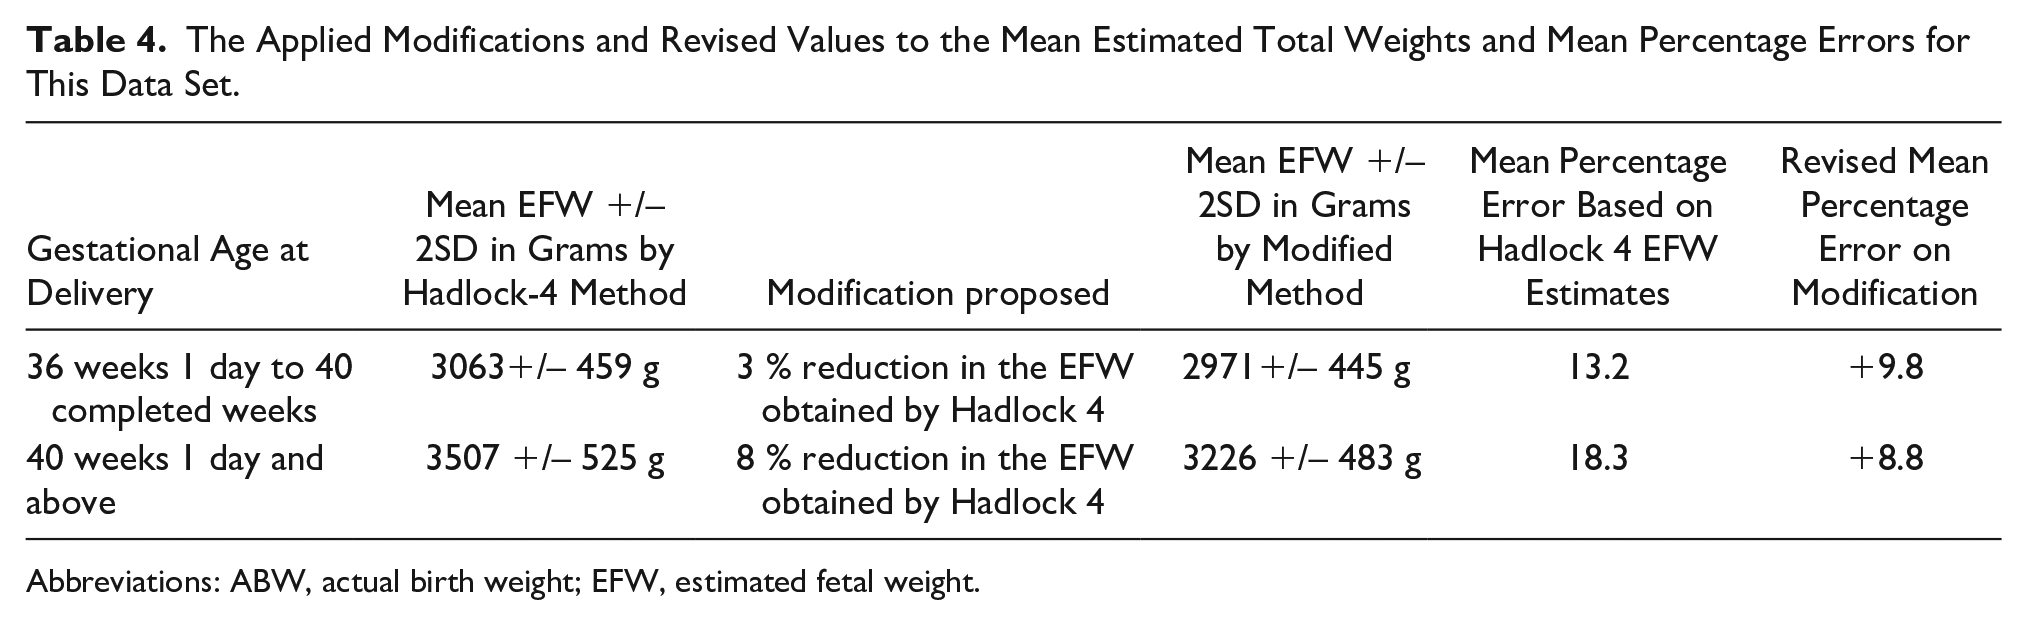
Abbreviations: ABW, actual birth weight; EFW, estimated fetal weight.
The 36 low birth weight newborns (<2500 g) had been predicted to have normal EFW’s by Hadlock-4. The number reduced to 4 on applying the proposed modification retrospectively. The 13 newborns in this category had postnatal adverse events like respiratory distress (9), sepsis, (2) and neurological complications (3). They were correctly identified as low EFW on applying the modified Hadlock-4 estimate.
There were 27 instances where the mean EFWs were more than 4000 g (fetuses deemed large for gestational age) and were delivered surgically, as per the institutional protocol. However, 24 newborns weighed less than 4000 g at birth with retrospective possibility of vaginal deliveries. On retrospectively applying the proposed modification, EFWs of 22 of 24 newborns was less than 4000gm. The revised EFWs for the other 2 newborns, though still above 4000gm, were considerably reduced, compared to previous estimates. The revised EFWs of the actual large for GA (>4000gm) continued to be more than 4000gm and hence were correctly identified.
Discussion
It is well known that the morbidity and mortality among small for GA babies7,8 and premature infants is high. 9 With the knowledge of EFW, the physician can prognosticate and decide on timing and mode of delivery, as well as counsel parents accordingly. The EFW also helps in situations where there is increased maternal risk, like preeclampsia, gestational diabetes, etc., and where early delivery is indicated due to fetal lung maturity. 28 EFW gives a sense of the fetus’ maturity status. 29 It is imperative for EFW to reflect actual fetal weight to decide on appropriate management. These decisions become critical especially in borderline values of large for GA and the preterm fetuses.
Various methods postulated for assessment of fetal weight by sonography are decades old and only a few have found widespread usage. Most of the methods are regression techniques based on a combination of fetal measurements.10–17 There are other methods proposed based on fetal volume and neonatal specific gravities.18,19
In this study, EFW by Hadlock-4, which is currently the widely used method in this region, was compared with ABW to determine appropriateness for an Indian patient population. The Hadlock-4 is based on the 4 fetal biometry measurements configured in most ultrasound equipment systems.20–24 The regression model is based on U.S. population data. As there are wide variations in the physical built, genetic makeup and nutritional status globally, it was important to study if there were any significant inconsistencies in their population data, vis-a-vis the western EFW estimation methods. Few studies have even proposed newer formula to cater to their population. On literature search, there are fewer studies of such kind in Indian context, mostly by non-Radiology specialties. Due to legal binding in India, formal, structured, and comprehensive training in sonography is given only to Radiology students. Hence, radiologists undertaking such studies will help arrive at a more appropriate sonographic method of EFW assessment. In this context, the present study, done in a Radiology facility, within an Indian tertiary care hospital, is unique.
Table 5 compares the sample size and results of the current cohort study with a few prominent foreign and Indian studies, which have assessed the performance of the Hadlock-4. The EFW with Hadlock-4 overestimated ABW by a mean of 12.8%, in the present study. This would mean that ABW was significantly lower than EFW, in comparison with studies by Melamed et al 30 (Israel), Siemer et al 31 (Germany), Westerway et al 20 (Australia) and Ugwu et al 32 (Nigeria). This corroborates the fact that Indian newborns may be smaller, lighter, and also possess more body fat, as compared to Western newborns. D’Angelo et al 35 compared Indian data with similar United Kingdom data and found Indian newborns to have a smaller head circumference (33.25 cm, UK-34.91 cm), birth weight (2.73 kg, UK-3.44 kg), and mid-arm circumference (9.8 cm, UK-11.38 cm). However, an Indian newborn’s crown heel length is only marginally less (48.02 cm, UK-49.73 cm) than its U.K. counterparts. Yajnik et al 36 found that Indian newborns also had higher adipose content. These factors indicate that the body composition, density, and weight of Indian newborns are significantly less compared to western newborns, though the lengths were comparable. Hiwale et al, 33 also found EFW values among Indian fetuses using the Hadlock-4, higher than other mentioned studies. However, Prajapati and Patel, 34 another Indian based study, found a negative mean percentage error unlike the present study.
Comparison of Results From the Current Study With Other Similar Studies on Hadlock-4 Model of Estimating Fetal Weight.
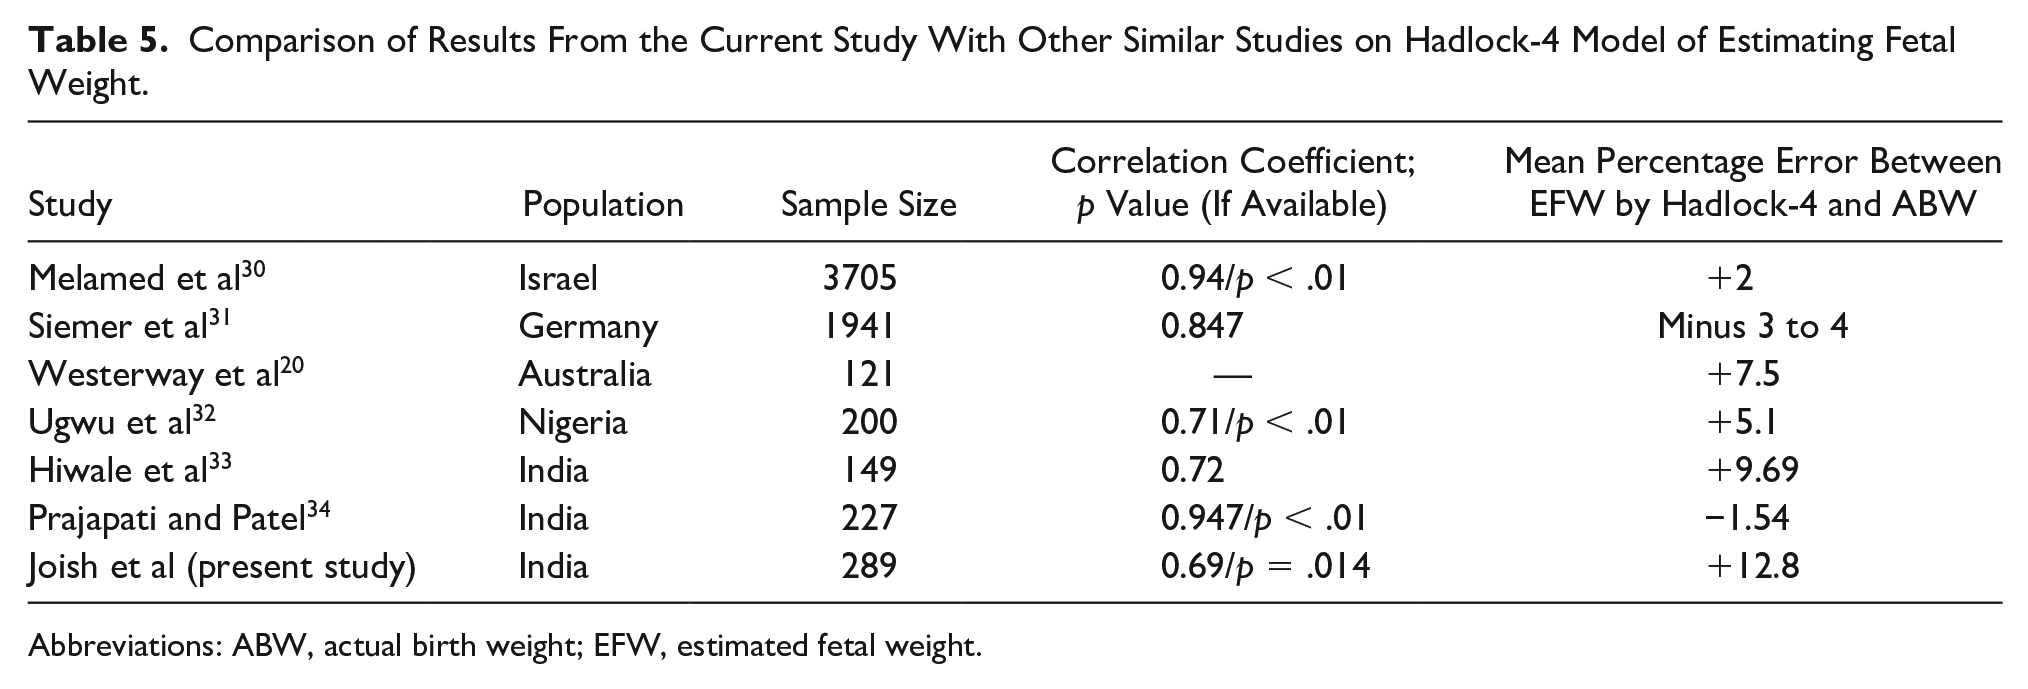
Abbreviations: ABW, actual birth weight; EFW, estimated fetal weight.
EFWs, obtained in the present study, overestimated the birth weight in most cases (70.2%). This is similar to studies by Hiwale et al 33 and Prajapati and Patel 34 which found an overestimation in approximately 60 and 62.5% of respective cases.
Pearson’s correlation coefficient, to find linear correlation between EFW and ABW, in the present study showed a lower strength of association though statistically significant, compared to studies listed in Table 2. This could be attributed to variations among newborns, in terms of body composition. Newborns of different ethnicity, with similar lengths or biometric measurements, may not necessarily have similar birth weights.35,36
In the present study, the EFW were classified in class intervals, of gestational age, to find the percentage error of EFW among different GA, unlike studies where the class intervals were based on birth weight. It was found that the highest discrepancy between the EFW and ABW was near term. As there was a unidirectional increase in the MPE, a simple reduction in the obtained values of EFW by 3% between 36 and 40 weeks and by 8% at 40 weeks and greater, therefore it was important to reduce the MPE to acceptable levels (closer to 10%). With this modification, 97.6% of the ABW values were within the 2 SD range, of respective EFWs. The sample size of 289 used in this study was higher than most Indian studies33,34 done in this context.
Dipti Das et al, 37 compared a new regression based 4 parameter model and compared with 3 parameter Hadlock formula for Indian fetuses and found the new model to be accurate. The sample size used was 139 which was a smaller sample size that was used in present study. Hiwale et al, 38 proposed 2 new models for an Indian population derived from a sample size of 137 and validated with 36 patients. The study concluded that the models performed better compared to other prevalent methods in an Indian context, including the Hadlock-4. 38 That study had a percentage error of approximately 6% 38 compared to a higher 9.1% in the present study. However, the sample size was lower than in the present study and the percentage error calculated was irrespective of GA. This comparison was unlike the present study where performance of the modified Hadlock-4 had been assessed at different class intervals of GA.
No mathematical formula can accurately predict EFW as fetal body composition is not bound by mathematical rules nor is an exact science. In a trade-off between exactness and reliability of bias/error of close to 10%, on either side of the obtained value, is acceptable. In this context, the proposed modification to Hadlock-4 for EFW calculation may go a long way in addressing the concerns of the physician and patients involved.
The inferences drawn based on the results of this study will help sonologists predict actual fetal weight in utero more accurately, in an Indian patient population. The modification proposed being a simple arithmetic reduction of the EFW obtained by Hadlock-4, is easy to incorporate in daily practice. Further studies are planned to test whether application of this proposed revision of Hadlock-4 is planned for individual cases as well as on a larger prospective patient cohort, in hopes that it will have the expected results.
Limitations
This was a large cohort study and therefore it has limitation due to the data being collected conveniently. In this study, those participants who delivered within a week of their sonogram were included for data collection. There was an interval of greater than a week between EFW assessment and birth. Fetuses were on an average rate of weight gain of 200 g per week, in last trimester. 23 Most of the deliveries, in present study, occurred between the 3rd to 5th day therefore it can be assumed that an average interval fetal weight gain of 100 g, between the sonogram and the actual delivery. This factor was not accounted for in this study. This suggests that the actual MPEs of EFW would be marginally more, if the sonograms were done just prior to birth. However, this is not practical as exact timing of delivery cannot be predicted. Moreover, most of the studies done in this context have opted for an interval of a week between EFW estimation and birth.20,31,33,34,37,38 The range of EFW obtained by most biometry based EFW calculation methods including Hadlock-4 and the proposed modification is wide (15 percent on either side of the mean). There is a need for further studies to narrow down the range and increase precision. The study was carried out in one tertiary care medical center and needs further validation through multi-centric trials in India to generalize these results and associated inferences.
Conclusion
The EFW assessment by Hadlock-4 shows significant discrepancies with the actual birth weight at 36 weeks of gestation and beyond. A simple 3 and 8% percentage reduction of EFWs obtained by Hadlock-4 at 36-40 weeks and more than 40 weeks GA, respectively, is proposed which may make it more reliable, in an Indian population.
Footnotes
Declaration of Conflicting Interests
The authors declared no potential conflicts of interest with respect to the research, authorship, and/or publication of this article.
Funding
The authors received no financial support for the research, authorship, and/or publication of this article.