
Abstract
Introduction:
Neoadjuvant chemotherapy (NAC) is widely used to treat breast cancer. Sentinel lymph node biopsy has replaced axillary lymph node dissection in patients who convert to node-negative status, after NAC. However, few studies have evaluated the diagnostic performance of ultrasonography (US) and magnetic resonance imaging (MRI) in determining axillary lymph node status after NAC. The aim of this study was to evaluate the diagnostic performance of breast US and MRI in predicting a response to NAC, for breast cancer.
Methods:
A systematic search, in PubMed, the Cochrane Library, and Web of Science, for original studies was performed. The Quality Assessment of Diagnostic Accuracy Studies 2 tool was used to assess the methodological quality of the included studies. Patient, study, and imaging characteristics were extracted, and sufficient data were used to reconstruct 2 × 2 tables. Data pooling, heterogeneity testing, forest plot construction, meta-regression analysis, and sensitivity analysis were performed using Meta-DiSc and Stata version 14.0 (StataCorp LP, College Station, TX, USA).
Results:
Nine studies met all the eligibility criteria and were included. The pooled sensitivity and specificity of MRI were 0.78 and 0.92, while the corresponding values for US were 0.80 and 0.90, respectively. The prevalence of pathologic complete response (pCR), among breast cancer patients, after neoadjuvant therapy was 26%. The prevalence of patients with estrogen receptor (ER)-, human epidermal growth factor receptor (HER)-, and progesterone receptor (PR)-positive tumors were 65%, 22%, and 37%, respectively.
Conclusion:
These results showed that MRI and US have almost the same accuracy in predicting pCR in patients with breast cancer undergoing neoadjuvant surgery. There is still a need for further investigations to prove that US is not inferior to MRI for this diagnosis.
Keywords
Neoadjuvant chemotherapy (NAC) is one of the standard methods for treating patients with primary breast cancer. It includes treatment with a combination of the following drugs: docetaxel, doxorubicin-cyclophosphamide, capecitabine, and gemcitabine. 1 There are several benefits for using NAC which include increasing the rate of breast-conserving surgery and reducing tumor size. 2 The latest advances in NAC include, in particular, the introduction of an antihuman epidermal growth factor receptor 2 (anti-HER2) agent for breast cancer HER2þ. This has increased the rate of pathologic complete response (pCR) which is defined as the complete eradication of all invasive and noninvasive cancer. 3 Numerous studies have indicated that patients who reached a pCR after NAC were likely to have a better prognosis. 4 However, it has been shown that the response to NAC and the prognostic effects on pCR depend on the subtype of breast cancer. Patients with a pCR still have to do a surgery due to the fact that imaging cannot definitely approve the pCR. 5 The response to NAC is assessed with the following imaging modalities: magnetic resonance imaging (MRI), mammography, or ultrasonography (US). 6 The diagnostic accuracy of mammography and US for detection of pCR was reported to be 74% and 79%, respectively. The former was reported to be more sensitive than physical examination but was less specific, and there is a possibility of underestimation of the treatment response. Another problem with mammography is the presence of microcalcifications, which do not correlate with the presence of viable tumor.
The Candelaria et al study demonstrated that MRI outperformed US. MRI is usually assessed using the response evaluation criteria in solid tumors (RECIST) criteria, which are based on unidimensional parameters.7,8 Alternative MRI parameters, such as volumetric, functional, and tissue measurements, promise improvement in assessing the Neoadjuvant chemotherapy (NACT) response, during and at the end of treatment. 9 However, MRI has disadvantages, including being expensive and time-consuming, as well as the need to prescribe intravenous contrast material, and being contraindicated for some patients. 10 Conversely, US is inexpensive, reproducible, more available, and simple to perform. Previous studies have shown variable results comparing MRI and US, with some indicating that MRI has a better accuracy and others indicating no difference. The aim of this study was to evaluate the diagnostic performance of breast US and MRI in predicting the response to NAC in breast cancer patients, with a meta-analysis.
Material and Methods
Research Strategy
The two authors independently searched Web of Science, the Cochrane Library, Embase, and PubMed and gathered all original studies comparing the performance of US and MRI in post-NAC breast cancer patients. The used keywords in the search strategy include “MRI” or “magnetic resonance imaging” or “MR,” “US” or “ultrasound” or “ultrasonography,” “breast neoplastic,” “ breast carcinoma,” “ breast cancer,” “locally advanced breast cancer,” “neoadjuvant chemotherapy,” “preoperative,” “sensitivity,” and “specificity.” The search was not limited to a specific country. This search was updated in March 2020, and the included studies were published after January 2005.
Inclusion and Exclusion Criteria
The present study addressed several factors, namely, (1) examining the performance of US and MRI among those suffering from breast cancer after NAC treatment; (2) applying histopathologic analysis as the reference standard; and (3) expressing stated values for false positive (FP), true positive (TP), true negative (TN), and false negative (FN). Studies were excluded if they (1) had less than 10 patients included; (2) were published as a case report, conference abstract, review, letter, comment, and animal experiment; and (3) were not written in English. The researchers examined all full-text articles in the scope of the inclusion criteria. In the end, the researchers who did not agree with each other accepted the opinion of the third researcher. The figure below illustrates the Preferred Reporting Items for Systematic Reviews (PRISMA) flowchart for the selection process (see Figure 1).
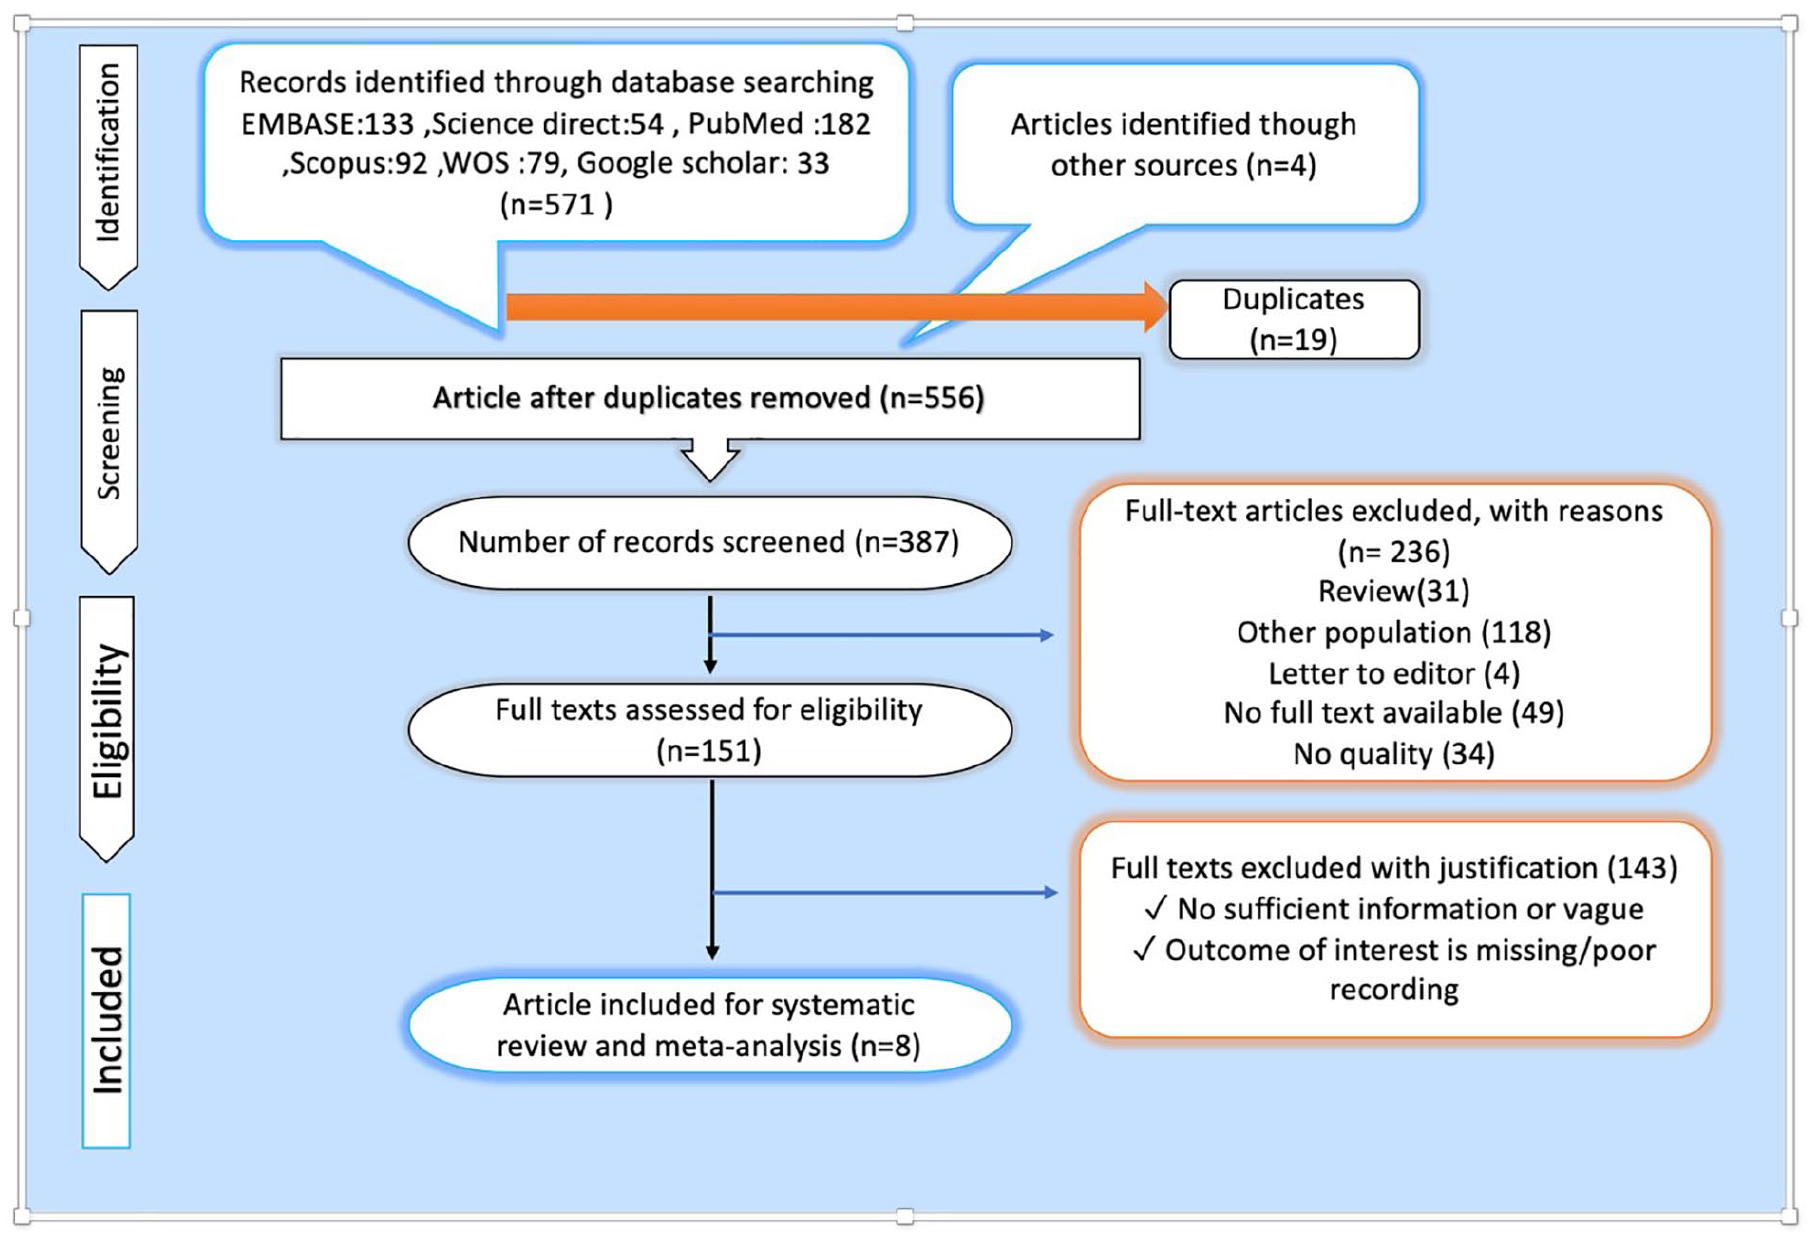
The PRISMA flow diagram and how it was used in this systematic review. PRISMA, Preferred Reporting Items for Systematic Reviews.
Quality Assessment
Using the Quality Assessment of Diagnostic Accuracy Studies 2 (QUADAS-2) tool, two authors independently evaluated the methodological quality of each included study. 11 Any inconsistencies were resolved by discussing them with a third reviewer. The QUADAS-2 is a new quality assessment tool that has recently been introduced for systematic reviews of diagnostic accuracy studies, which includes four areas: patient selection; index test; reference standard; and flow and timing. Each is evaluated in terms of risk of bias and the first three are evaluated in terms of application concerns.
Signaling questions were included to help judge the risk of bias. Besides, each question had to be answered with “yes,” “no,” or “unspecified.” The level of risk of bias can be evaluated as a homolog of “low risk,” “high risk,” and “unspecified risk.” Finally, we used Review Manager 5.3 software to determine and assess the risk of bias in each study.
Data Extraction and Statistical Analysis
Two reviewers extracted the following information separately from each included study: the year of publication, author name, the number of patients, country, study design (prospective or retrospective), patients’ age, equipment performance, image quality, tumor classification, and NAC type. In addition, TN, TP, FN, and FP rates of US and MRI were included from each study. Any disagreement between the two reviewers was discussed and resolved by referring to a third reviewer. All studies were reviewed using a 2 × 2 probability table to determine the true negative rate (TNR; specificity), the true positive rate (TPR; sensitivity), the associated forest plots, and the summary receiver operating characteristic (SROC) curve by Stata 14.0 software. SROC curves were defined by sensitivity (y-axis) and specificity (x-axis), and each study is shown in the data as a point with the area under the ROC curve (AUC) being the final comparison index. Furthermore, SROC curves were plotted as a larger single curve using Review Manager 5.3.
Results
Study Selection
A total of 571 studies were selected in a systematic search protocol using the PRISMA in the Cochrane Library, PubMed, Embase, Web of Science, and Chinese Biomedical Literature Database (CBM) databases. Nineteen studies were duplicate and excluded from the study. Besides, 236 irrelevant studies were excluded by reviewing their titles and abstracts. The full manuscripts of the remaining 151 studies were reviewed in detail and another 141 studies were excluded. In total, 9 studies met all the eligibility criteria and were included in our meta-analysis. Figure 1 shows the details of the steps taken to perform the meta-analysis.
Description of the Included Studies
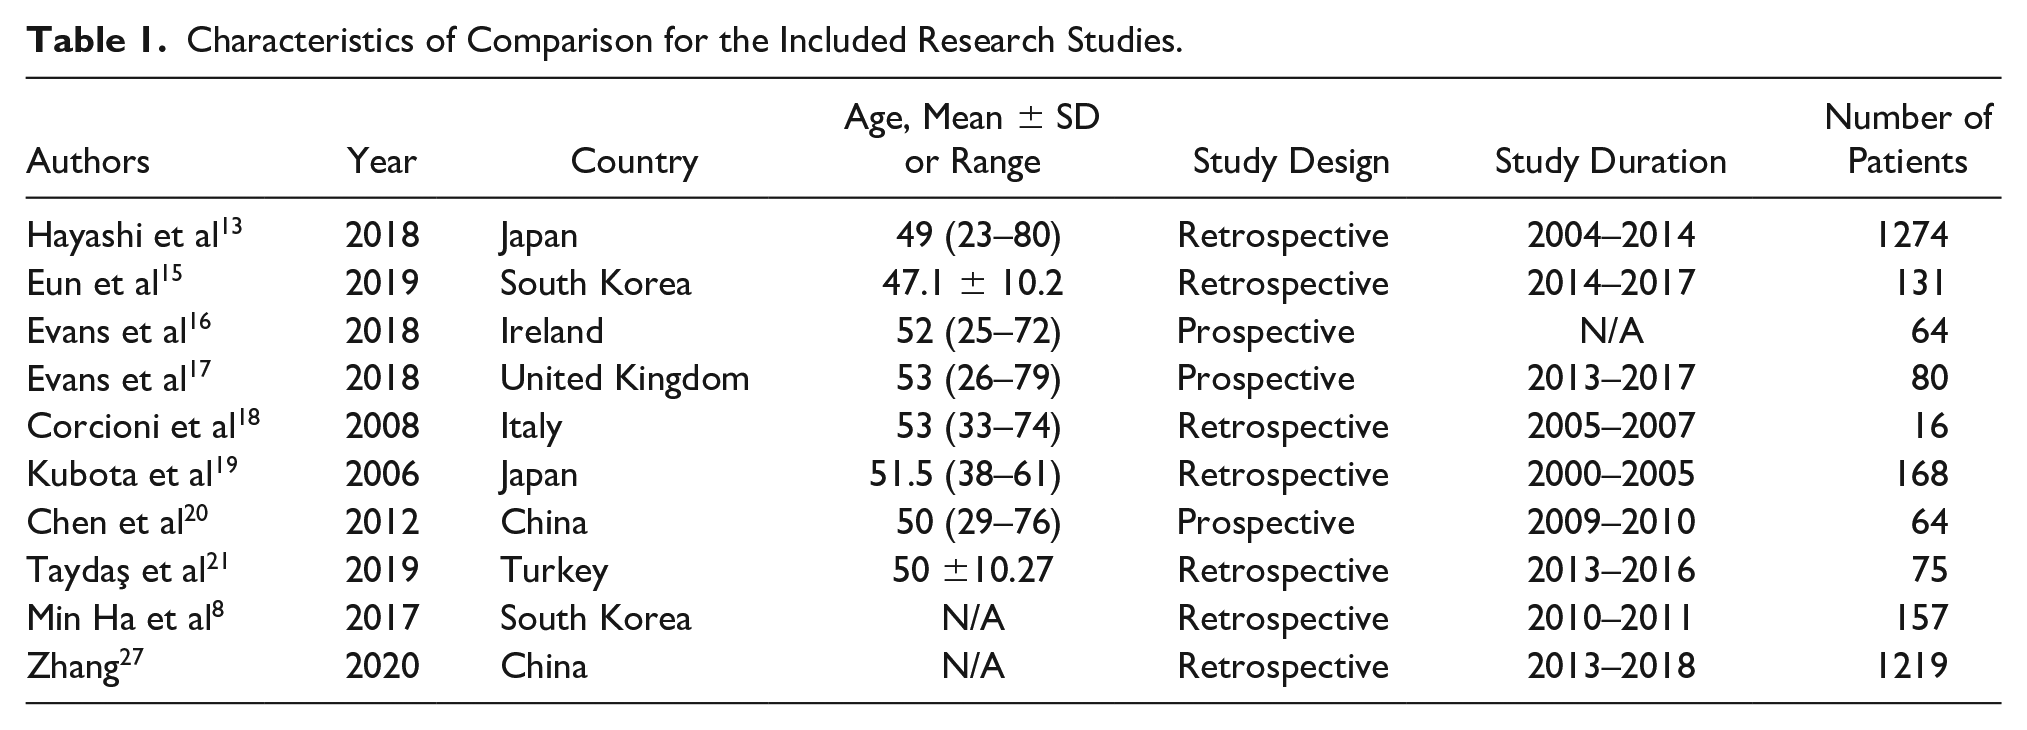
In this study, the age of patients was 23–80 years. A total of 533 patients with a mean age of 42 years ranging from 23 to 80 years underwent US and 1639 patients with a mean age of 44 years ranging from 26 to 79 years underwent MRI and were included in the meta-analysis. Of the 9 studies included, 2 were from South Korea, 2 from Japan, and each of Italy, United Kingdom, Ireland, and China had 1 study included. Among the studies, 6 were retrospective, and the rest were prospective studies. All studies compared the diagnostic value of US and MRI and considered the pCR (pCR vs non-pCR) as the gold standard (Table 1).
Characteristics of Comparison for the Included Research Studies.
Methodological Quality Assessment
Based on the results of QUADAS-2 quality assessment, 2 studies12,13 recorded random sampling of patients, 3 studies13–15 interpreted the standard reference results without knowing the results of index tests, and all studies presented postoperative pathologic outcome as the gold standard. In general, the results of the QUADAS-2 tool suggested that the overall quality of the reviewed studies was satisfactory (Figure 2).
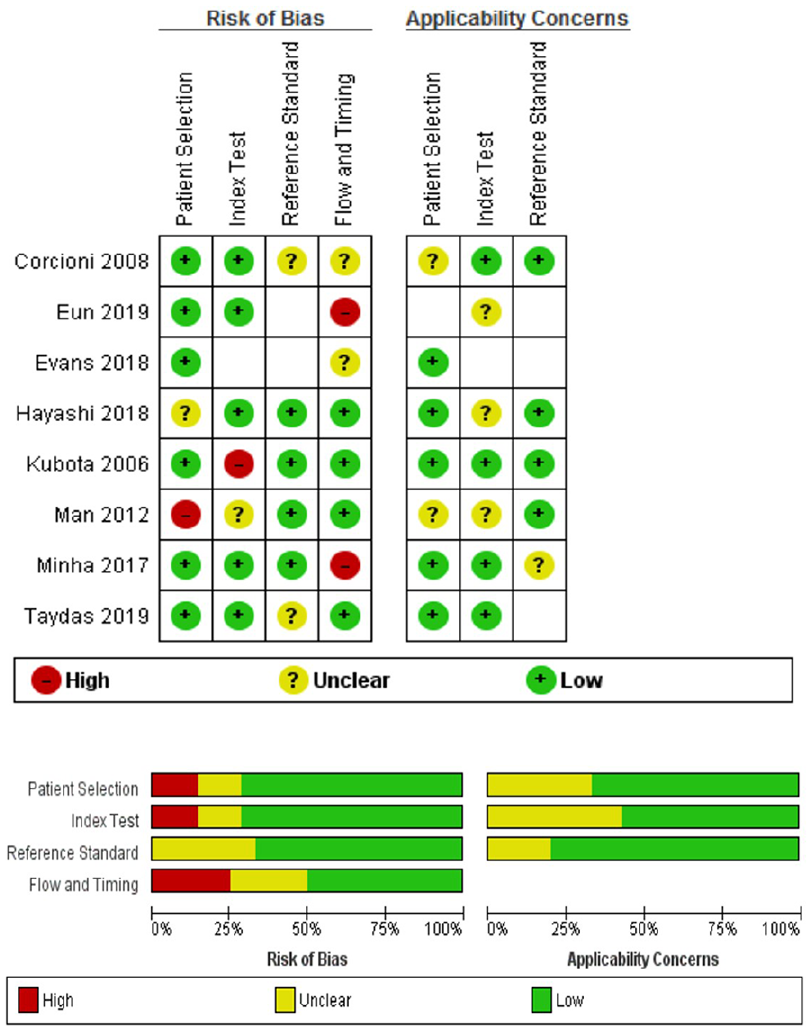
The Quality Assessment of Diagnostic Accuracy Studies 2 was used to assess the quality of the studies for diagnostics.
Meta-Analysis of the Diagnostic Performance of Breast US and MRI in Predicting pCR to NACT for Breast Cancer
The sensitivity of MRI ranged from 0.50 to 0.91, the specificity ranged from 0.50 to 0.95, and the corresponding values for US ranged from 0.47 to 0.78 and 0.50 to 0.96, respectively. The pooled sensitivity of MRI was 0.78 (95% confidence interval [CI], 0.76–0.80) and the pooled specificity was 0.92 (95% CI, 0.91–0.93), while the corresponding values for US were 0.80 (95% CI, 0.78–0.82) and 0.90 (95% CI, 0.88–0.91), respectively. Compared with MRI, US had a higher sensitivity (0.80 vs 0.78) but lower specificity (0.90 vs 0.92). The results of MRI and US are shown in Figures 3–7 and Table 2. The SROC curves of MRI and US are shown in Figure 5. We concluded that the AUC of US was larger than that of MRI (0.82 vs 0.76; see Figure 5).
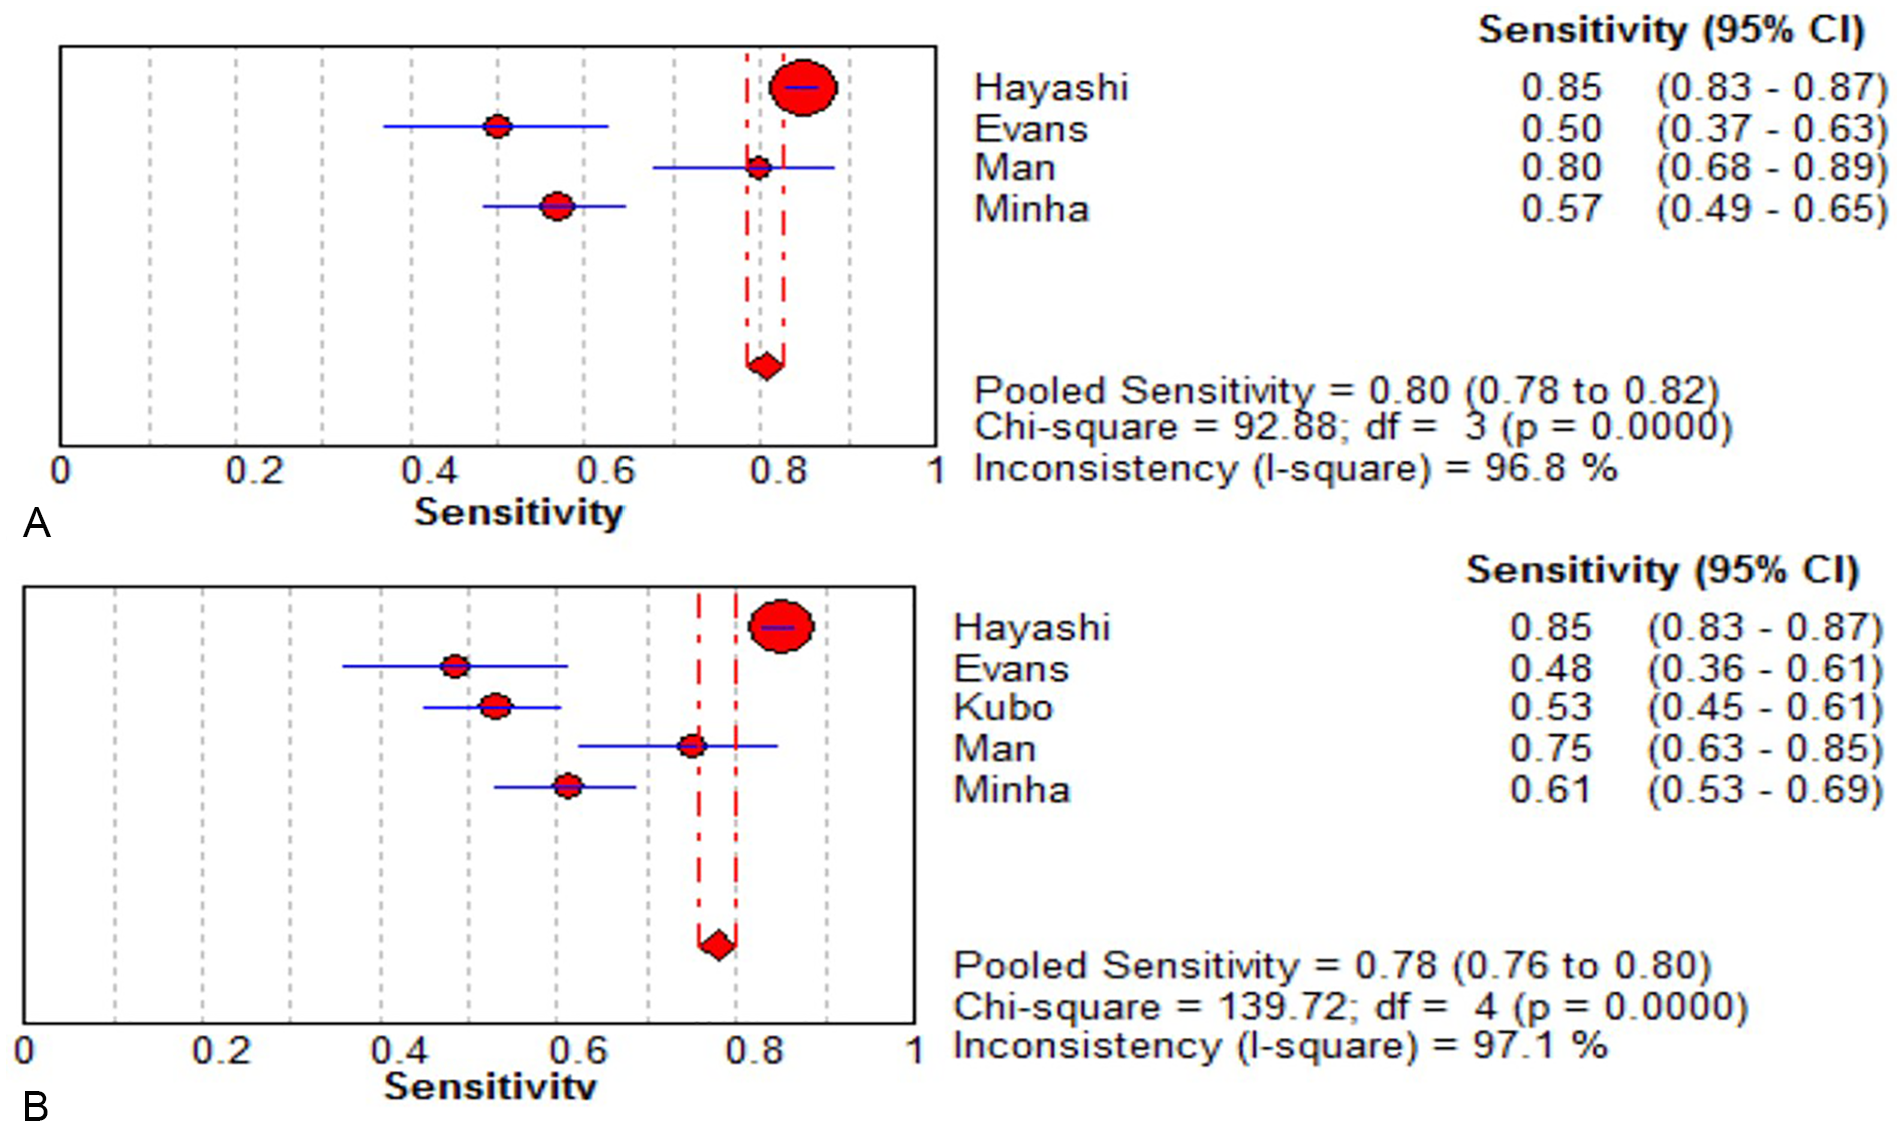
Sensitivity for diagnostic performance of breast (A) US and (B) MRI in predicting response to neoadjuvant chemotherapy for breast cancer. Forest plot of sensitivity reported in each study. Each study is identified by the name of the first author and year of publication, with circles representing individual study point estimates, size of each circle indicating relative contribution to data pooling (inverse variance weighting), horizontal lines indicating 95% CIs, and dashed vertical lines representing 95% CIs for pooled sensitivity. CI, confidence interval; MRI, magnetic resonance imaging; US, ultrasonography.
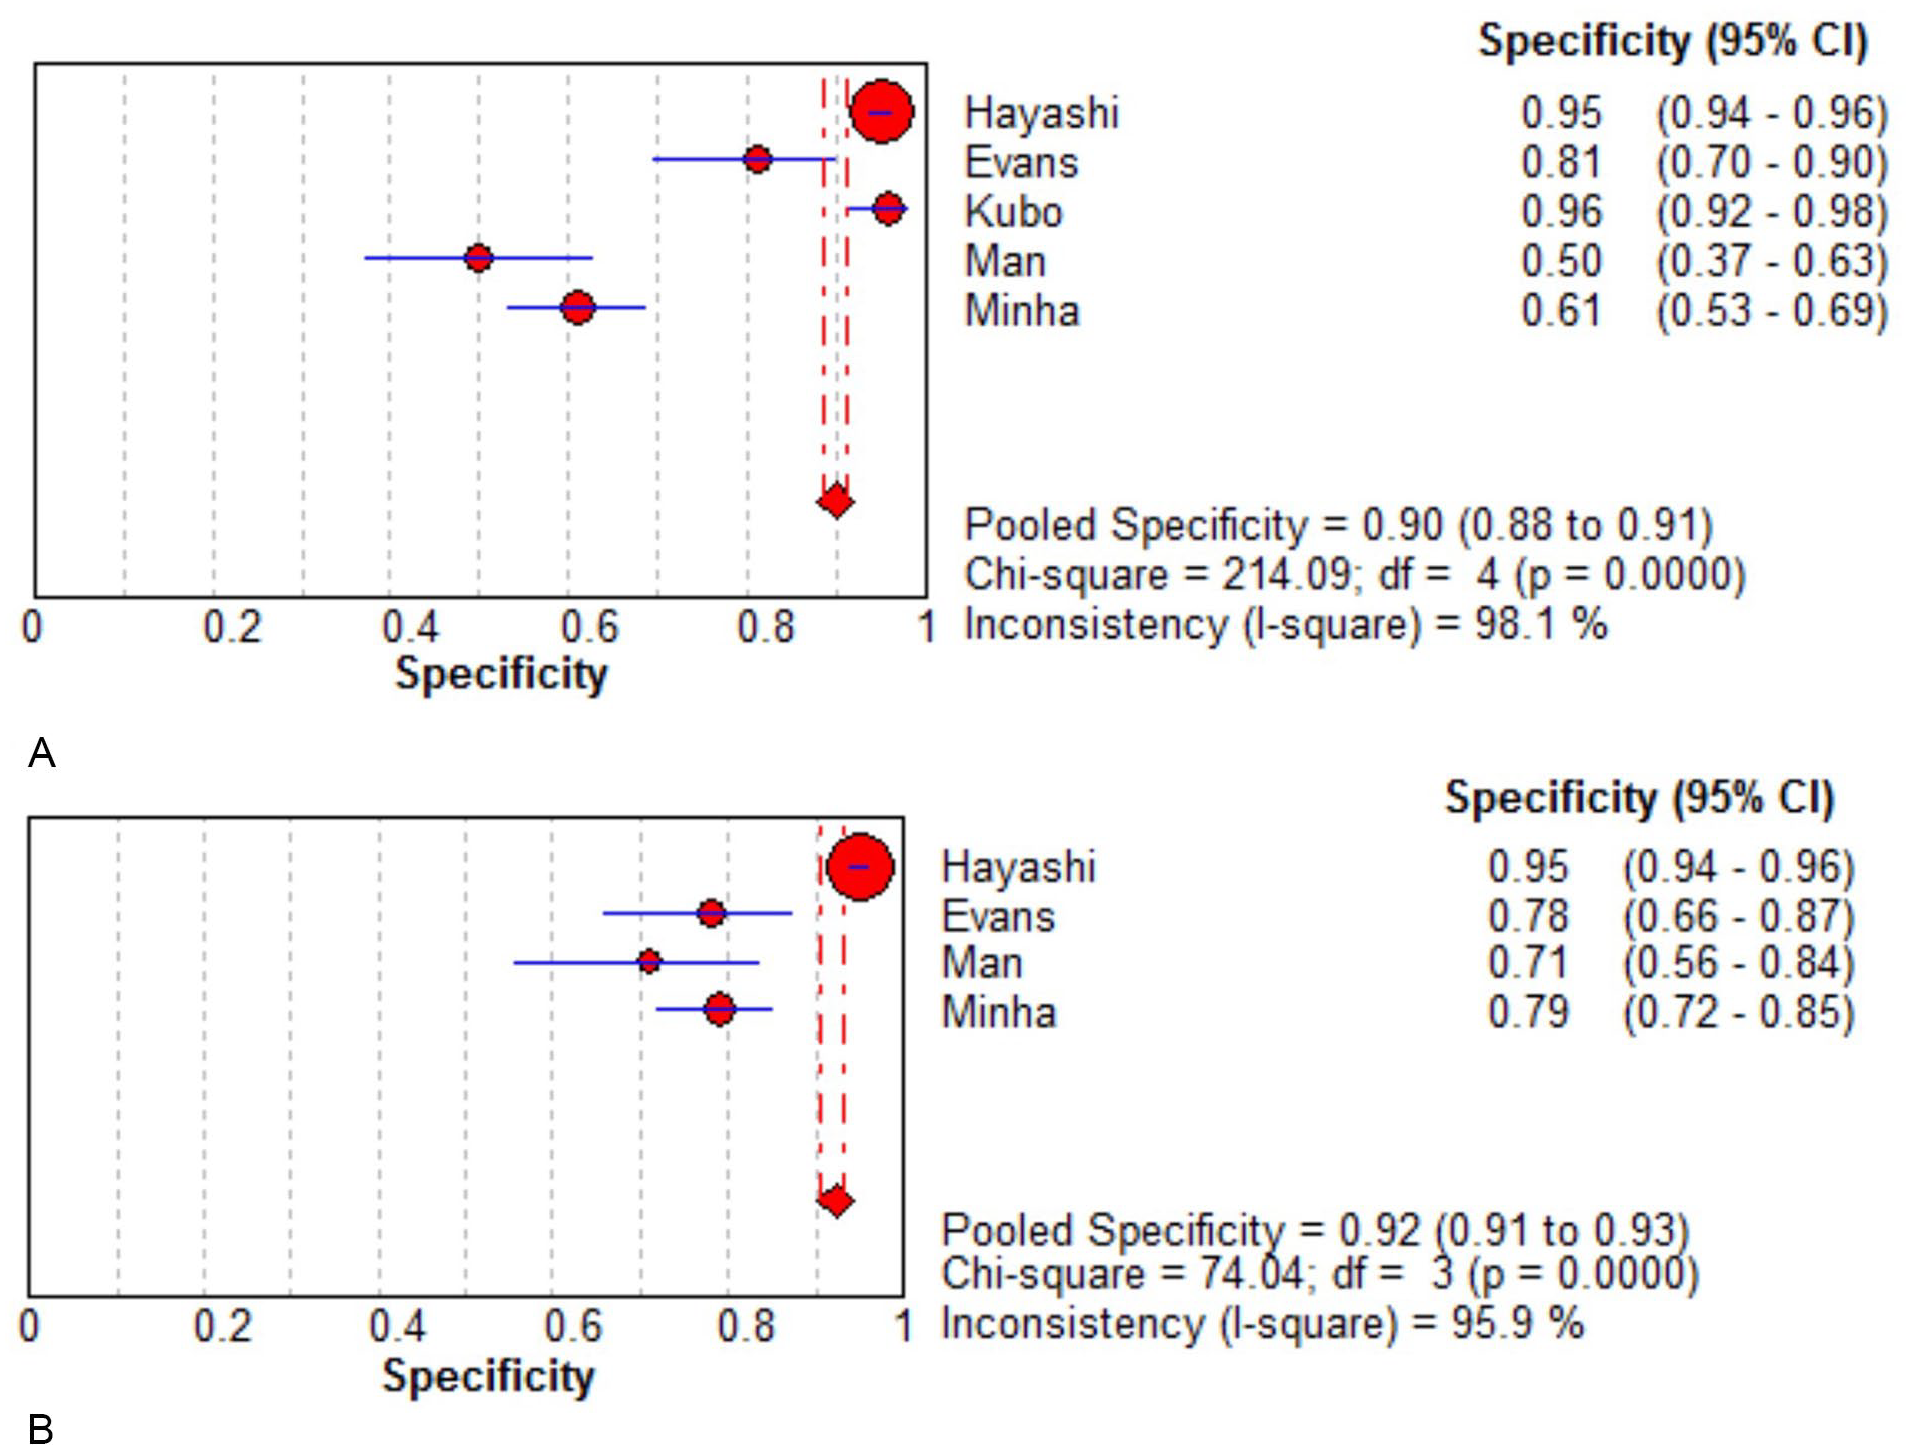
Specificity for diagnostic performance of breast (A) US and (B) MRI in predicting response to neoadjuvant chemotherapy for breast cancer. Forest plot of sensitivity reported in each study. Each study is identified by the name of the first author and year of publication, with circles representing individual study point estimates, size of each circle indicating relative contribution to data pooling (inverse variance weighting), horizontal lines indicating 95% CIs, and dashed vertical lines representing 95% CIs for pooled sensitivity. CI, confidence interval; MRI, magnetic resonance imaging; US, ultrasonography.
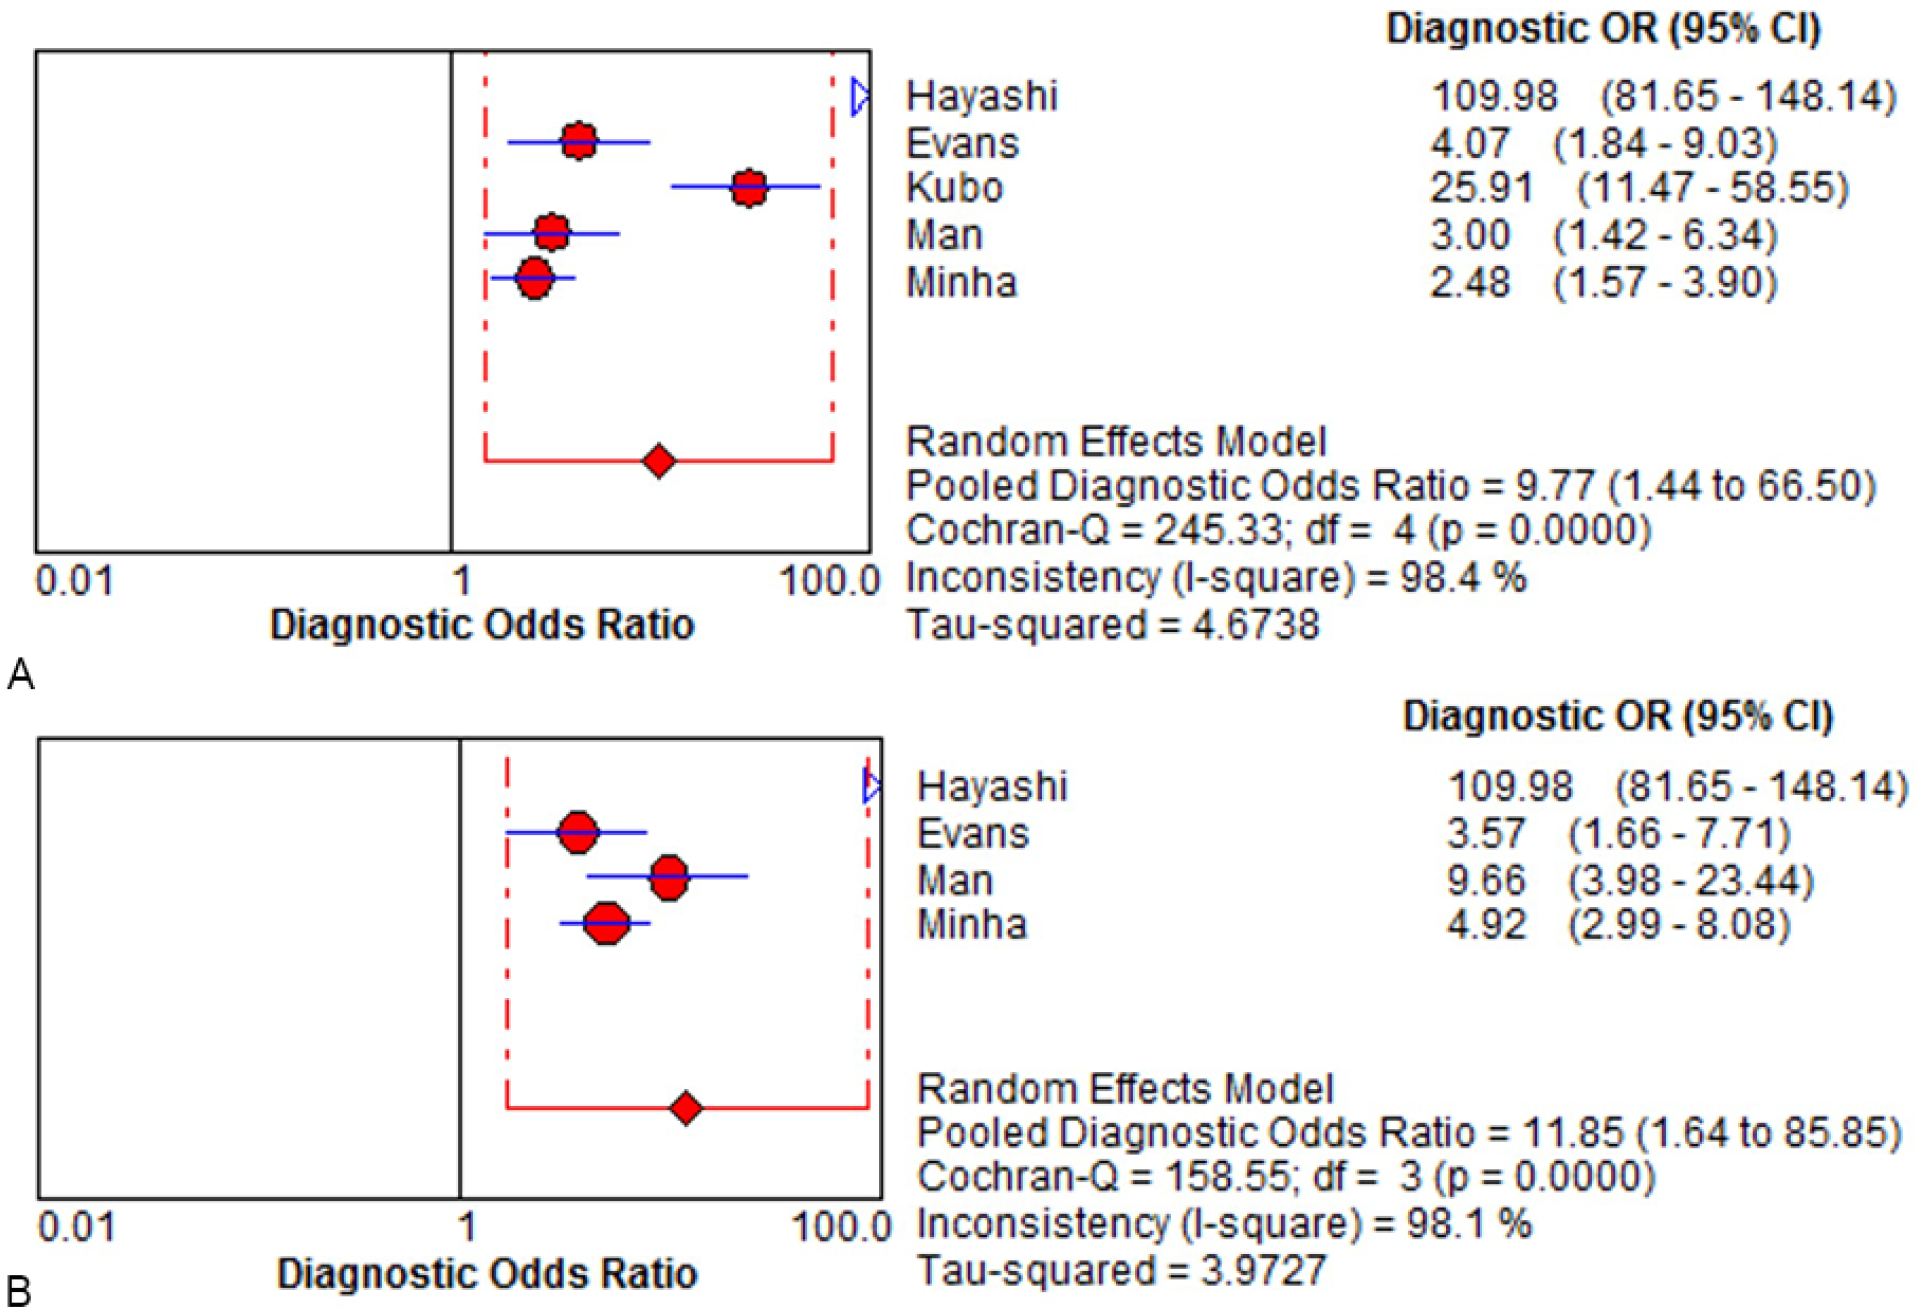
Diagnostic OR for the diagnostic performance of breast (A) US and (B) MRI in predicting response to neoadjuvant chemotherapy for breast cancer. Forest plot of sensitivity reported in each study. Each study is identified by the name of the first author and year of publication, with circles representing individual study point estimates, size of each circle indicating relative contribution to data pooling (inverse variance weighting), horizontal lines indicating 95% CIs, and dashed vertical lines representing 95% CIs for pooled sensitivity. CI, confidence interval; MRI, magnetic resonance imaging; OR, odds ratio; US, ultrasonography.
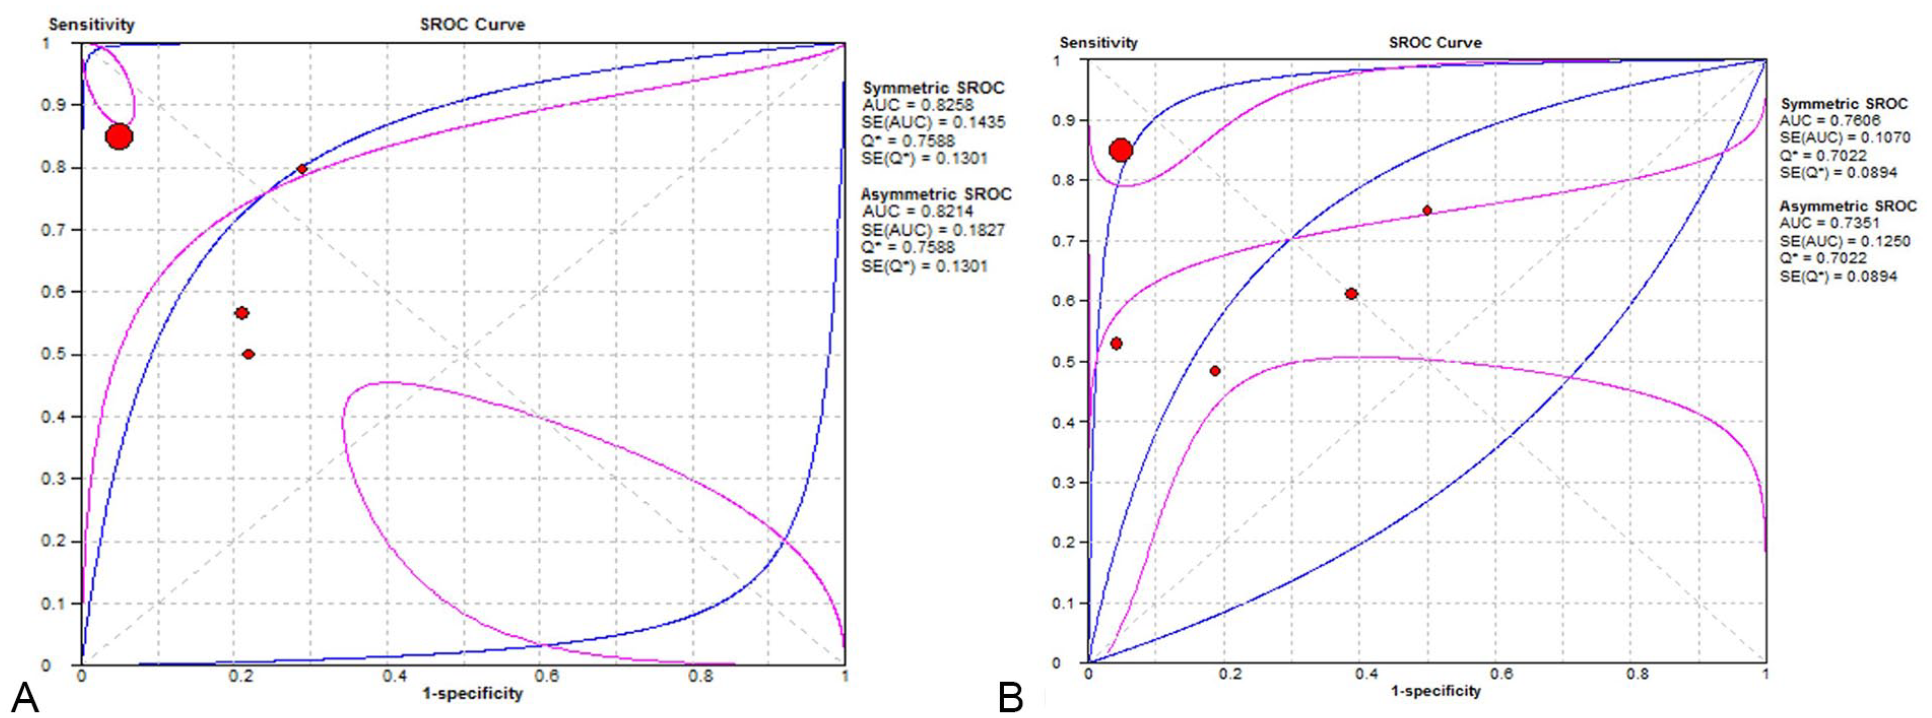
Summary receiver operating characteristic (SROC) curves of US for parameters—(A): SROC curves for US; (B): SROC curves for MRI—in predicting response to neoadjuvant chemotherapy for breast cancer. Circle: likelihood ratios of individual studies. The middle blue lines are the SROC curves, and the adjacent two lines are 95% confidence intervals. AUC, area under the ROC curve; MRI, magnetic resonance imaging; Q*, Q index; ROC, receiver operating characteristic; SE, standard error; US, ultrasonography.
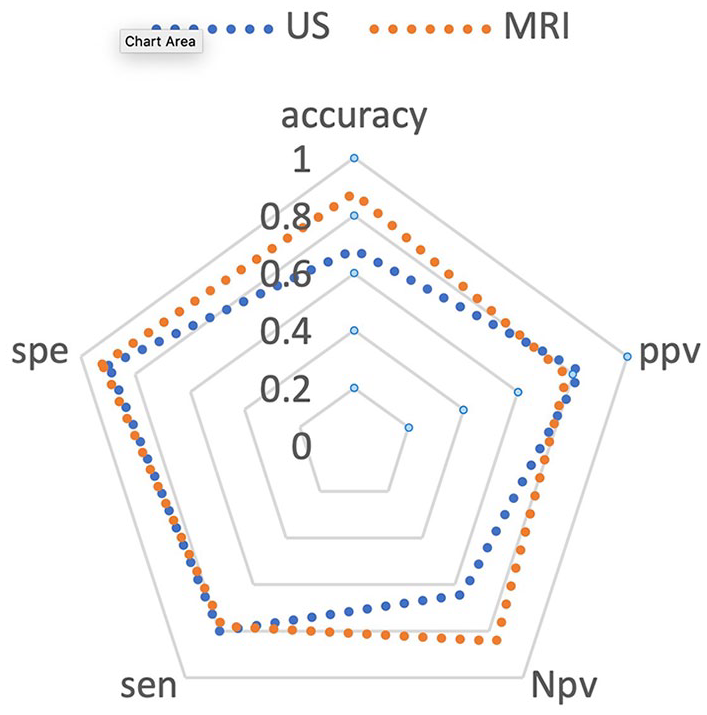
Radar chart of diagnostic performance of breast US and MRI in predicting response to neoadjuvant chemotherapy for breast cancer. MRI, magnetic resonance imaging; US, ultrasonography.
Diagnostic Performance of Breast US and MRI, in Predicting Response to Neoadjuvant Chemotherapy, for Breast Cancer.
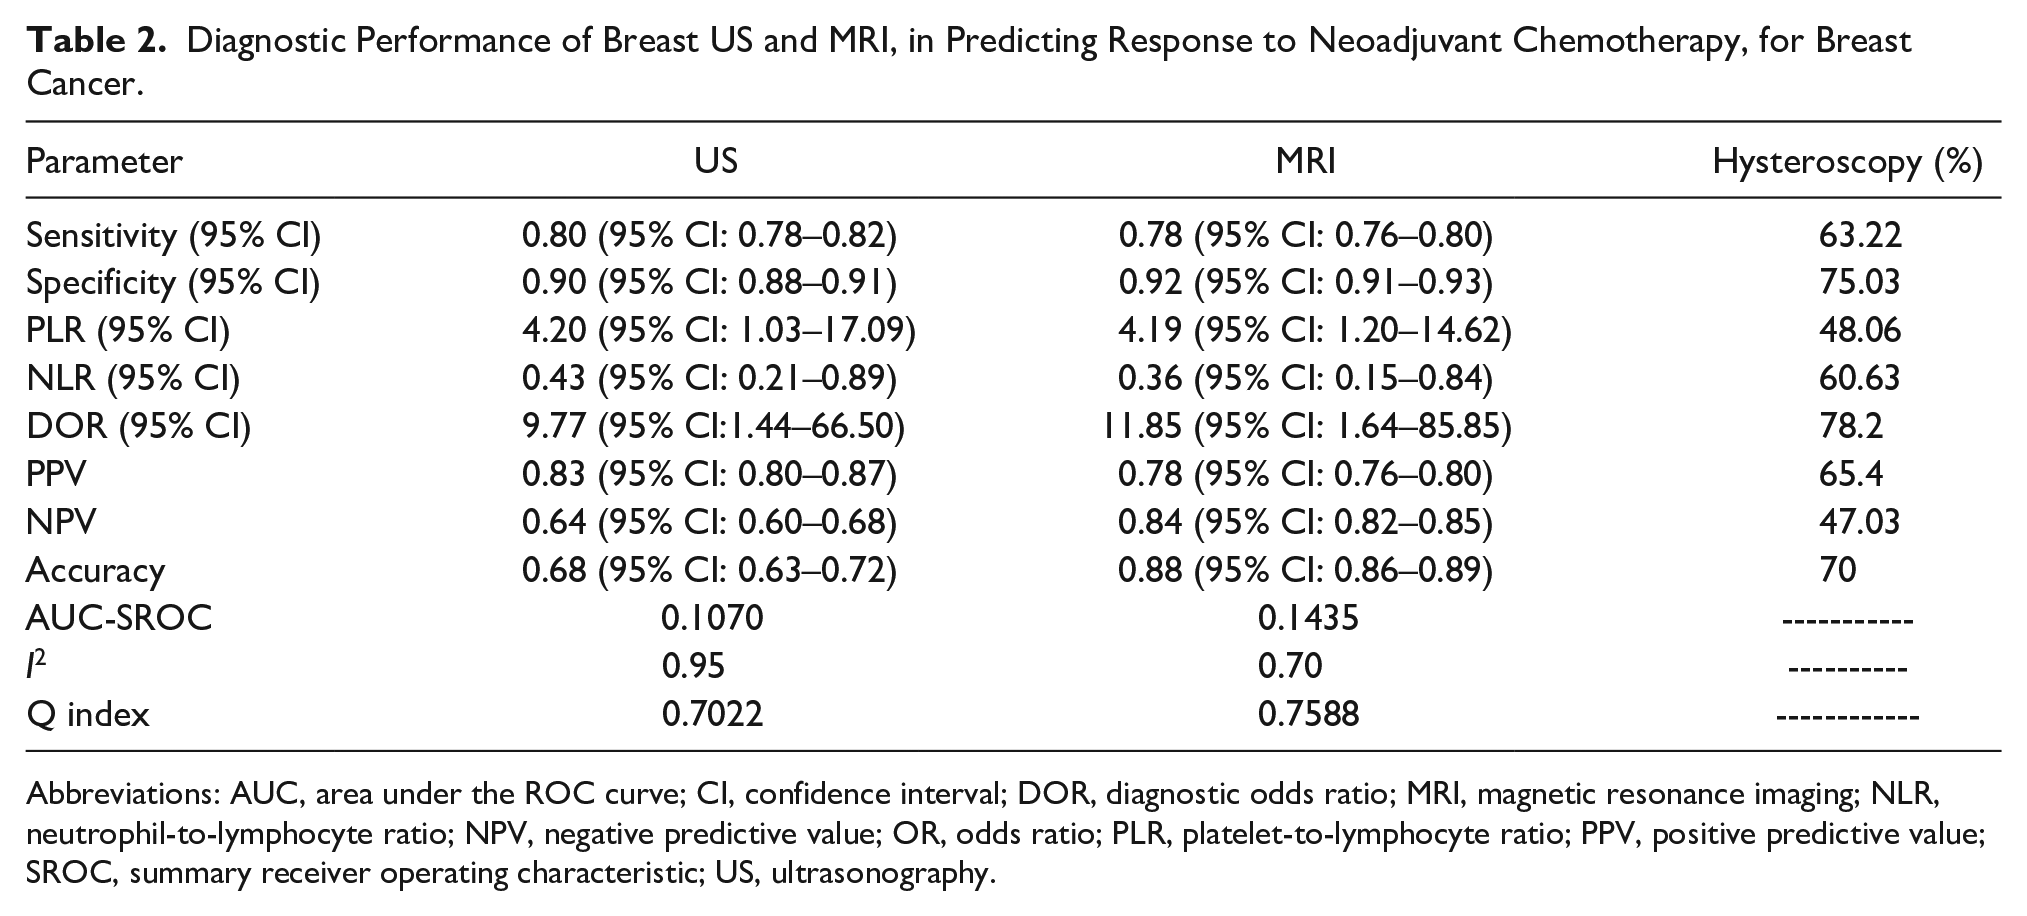
Abbreviations: AUC, area under the ROC curve; CI, confidence interval; DOR, diagnostic odds ratio; MRI, magnetic resonance imaging; NLR, neutrophil-to-lymphocyte ratio; NPV, negative predictive value; OR, odds ratio; PLR, platelet-to-lymphocyte ratio; PPV, positive predictive value; SROC, summary receiver operating characteristic; US, ultrasonography.
Meta-Analysis of Prevalence of Patients Approved With pCR
The overall prevalence of pCR among breast cancer patients after neoadjuvant therapy was 26% (95% CI: 24%–28%, I2: 63%).
Meta-Analysis of Prevalence of Different Tumor Subtypes, Grading, and Histology
The total prevalence of patients with estrogen receptor (ER)-, human epidermal growth factor receptor (HER)-, and progesterone receptor (PR)-positive tumors was 65% (95% CI: 63%–67%, I2: 90%), 22% (95% CI: 20%–25%, I2: 88%), and 37% (95% CI: 31%–42%, I2: 71.5%), respectively. The total prevalence of patients with grades 2 and 3 of breast cancer was 73% (95% CI: 70%–75%, I2: 94%) and 22% (95% CI: 20%–24%, I2: 96%), respectively. The most prevalent tumor histology between breast cancer patients undergoing neoadjuvant therapy was ductal with a prevalence of 93% (95% CI: 89%–96%, I2: 76.2%).
Heterogeneity Test
The heterogeneity of MRI and US was high in terms of both sensitivity (I2: 97% and 96.8%, respectively) and specificity (I2: 92% and 90%, respectively). Considering the large heterogeneity, the random effects model was chosen, to pool to results. The results of the analysis of the diagnostic threshold indicated that the Spearman correlation coefficient was 0.26, and the P value was .24. The corresponding values for MRI were 0.36 and .18, respectively. According to these results, there was no threshold effect in this study.
Heterogeneity and Publication Bias
The chi-square test was used to analyze biological heterogeneity between studies. We calculated the I2 index which ranges from 0% to 100%. The corresponding values were approximately 0%, 25%, 50%, and 75%, which indicate the absence of heterogeneity, low, medium, and high heterogeneity, respectively. We used the fixed effect model, when I2 was greater than 50%. We chose the random effect model, when it was less than 50%. Due to the fact that threshold effect is one of the major causes of heterogeneity, the Spearman correlation coefficient was used for MRI and US to see if there was a threshold effect. There is no threshold effect, given P ≥ .05. Stata 14.0 software was used to analyze all eligible studies according to Deek’s test, to determine the publication bias in each study (see Figure 8).
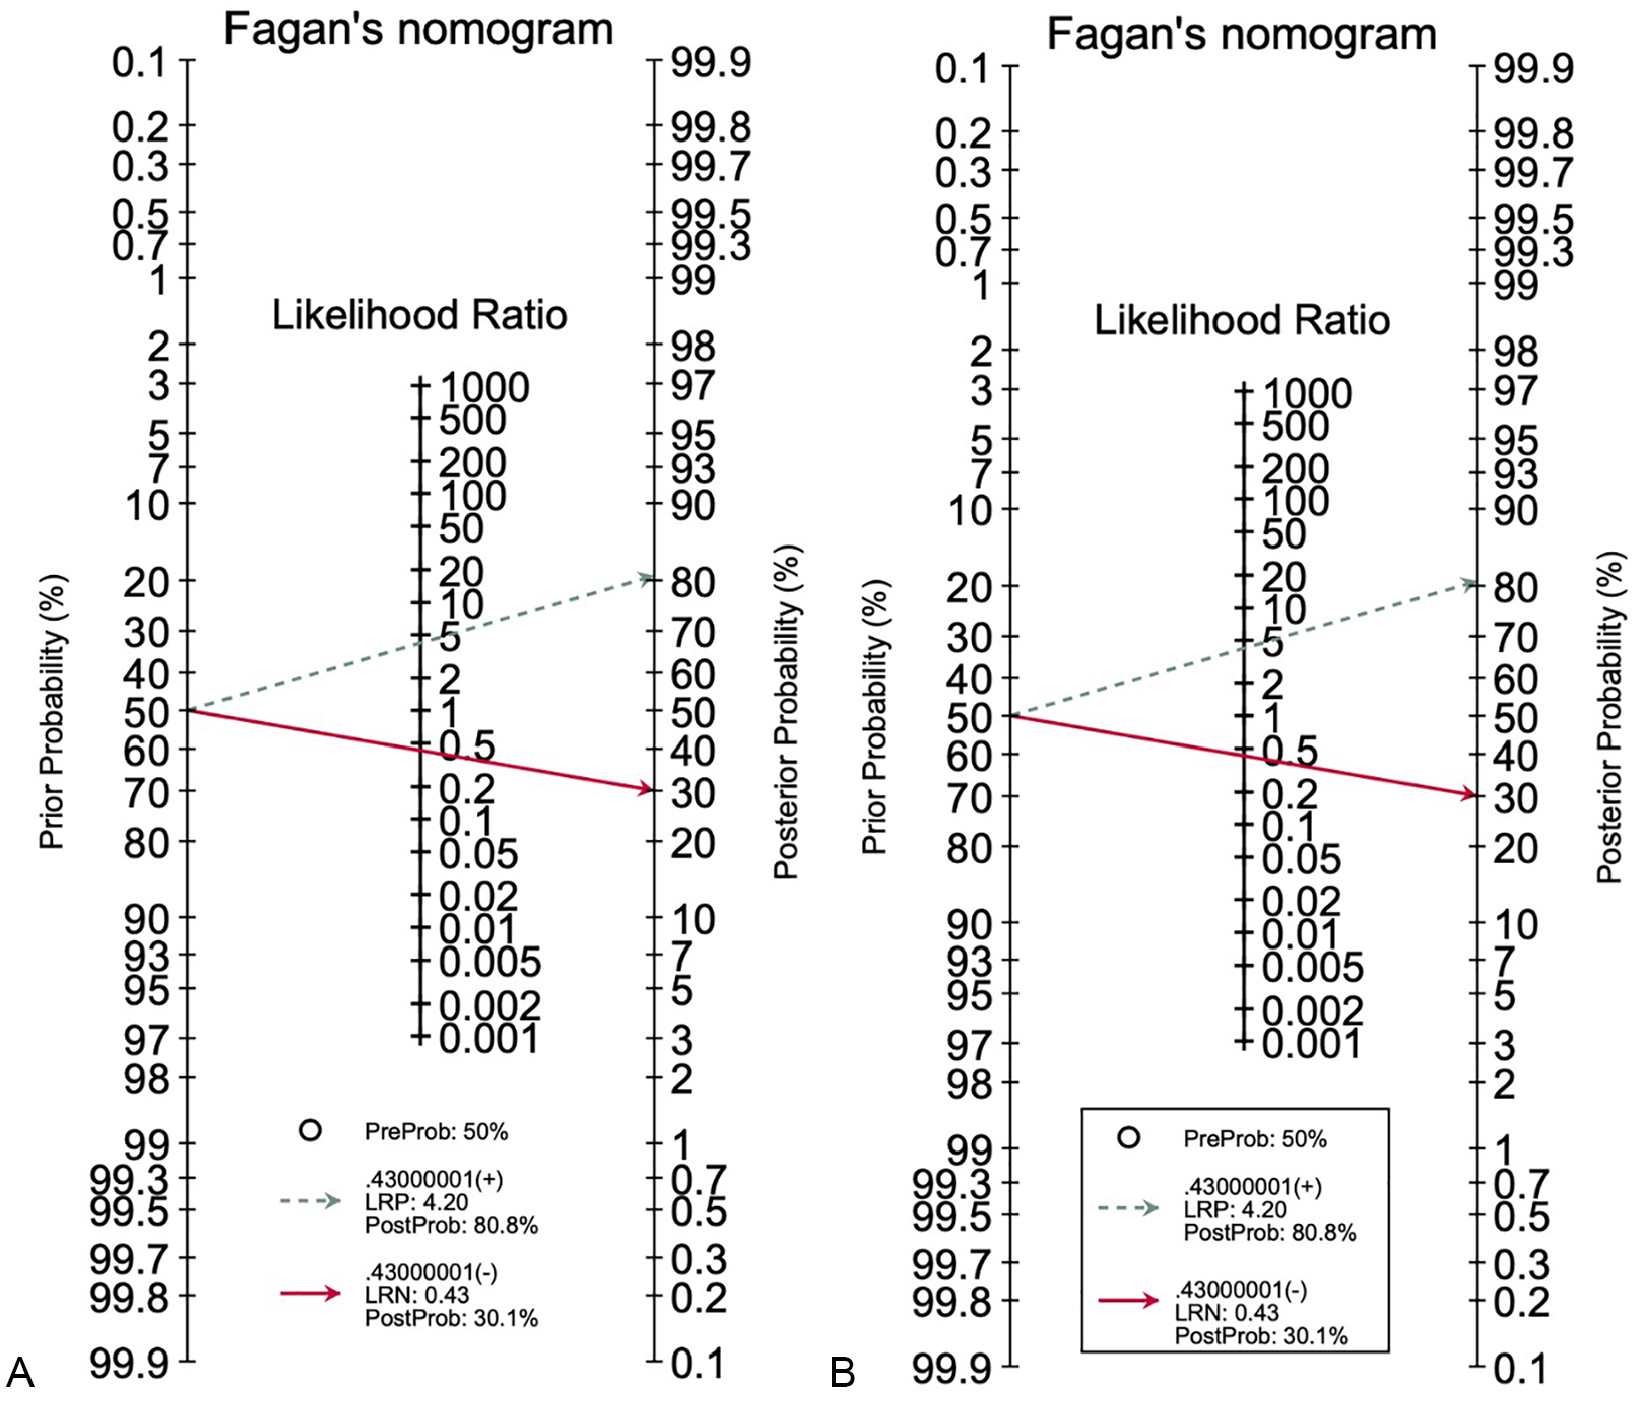
Fagan’s nomogram for the calculation of posttest probabilities. A pretest probability of 50% for all three diagnostic tools was fixed, which was estimated by the number of symptomatic cases in selected studies. (A) US had a posttest probability of 80.8%. (B) For MRI, the posttest probability was 80.8%, and hysteroscopy. If this patient tests positive, the posttest probability that she truly has dengue would be (A) 30.1% or (B) 14.4% (solid line in red). The results were obtained by the following calculations: pretest odds = prevalence / (1 − prevalence); posttest odds = pretest odds × LR− (LR+); posttest probability = posttest odds / (1 + posttest odds). LR, likelihood ratio; LRN, likelihood ratio negative; LRP, likelihood ratio positive; MRI, magnetic resonance imaging; US, ultrasonography.
Discussion
With the global acceptance of NAC, the assessment of response to NAC by clinical and imaging techniques has developed over the past few years. The purpose of imaging and clinical techniques in evaluating NAC response must be attempting to predict the post-NAC pathologic response as well as measuring the residual disease and documenting morphologic information. Tumor size is generally thought to be not only an independent prognostic indicator for local treatment choice but also an assessment of the NAC response in breast cancer patients. However, the prediction of a pCR after NAC and the size of the residual tumor are more difficult.22,23 The cancer response to NACT is also potentially valuable when choosing an axillary procedure, as the axillary tumor response is often similar to that seen in the breast, 24 so accurate evaluation of the NACT response imaging can change the management of breast and axillary surgery for patients’ benefit. Assuming its superiority to other imaging techniques, MRI with limited prospective backup data has been adopted as the main method to evaluate the response to NAC in breast cancer. 24 Compared with other tests, accuracy, positive predictive value (PPV), and negative predictive value (NPV) of MRI showed poor results for pCR assessment.25,26 Retrospective studies have shown that MRI is not superior to other techniques in evaluating response to treatment after neoadjuvant therapy.27,28 The results of the present study for response evaluation by US and MRI showed that US has higher sensitivity and lower specificity compared with MRI. Vriens et al reported that US is at least as much effective as MRI in providing information about the residual size of the tumor after NAC in patients with breast cancer. However, both methods significantly overestimate or underestimate the size of the tumor. Besides, both methods showed less negative predictive values of complete pathologic response. 29 US is commonly used in many centers to monitor patients undergoing NACT for breast cancer, and its main advantage is its quick and inexpensive application. This technique can facilitate accurate clinical assessment during the treatment period by having less radiation exposure, eliminating the need for intravenous contrast, and reducing costs, as well as good availability and ease of interpretation. However, US can sometimes produce erroneous results. For example, in women who have a scar on their breast despite having a pCR, this tissue may be considered a residual mass on ultrasound. Besides, a round tumor mass can turn into a plaque-like area in which the tumor volume is reduced but the diameter remains unchanged. 30 Previous studies have shown that the specificity of breast MRI in breast cancer is not as great as its sensitivity. Therefore, further research including biopsies and MRI repeat may be necessary. 31 However, the results of the present study indicated that MRI shows an almost equal specificity compared with the US in breast cancer, although it may overestimate the size of the tumor. Several previous investigations have indicated that, regardless of MRI overestimating the size of the tumor, it performs better in evaluation of the extent of the disease, finding satellite nodules, and searching for other cancer foci. 32 In previous studies, tumor measurement with US was more accurate than MRI, and it was found that MRI overestimated tumor size.12,14 Probably the greatest advantage of MRI is the ability to confirm clinical findings and the presentation of descriptive findings. 30 The present results showed a similar predictive and diagnostic value for MRI and US in predicting the pCR after NACT in breast cancer patients. US is still a noninvasive method of choice for assessing neoadjuvant therapy response. However, US assessment still does not have the ability to replace the surgical procedure for determining pCR, completely.
Limitations
One of the limitations of the present study is that MRI can evaluate the NACT response better in some subtypes of breast cancer than in others. Besides, one of the most important disadvantages of breast US is the high variability between and among observers.
Conclusion
The current study results showed that MRI and US have almost the same accuracy in predicting pCR in patients with breast cancer undergoing neoadjuvant surgery. There is still a need for further investigations to prove that US is not inferior to MRI in detecting pathology.
Footnotes
Declaration of Conflicting Interests
The authors declared no potential conflicts of interest with respect to the research, authorship, and/or publication of this article.
Funding
The authors received no financial support for the research, authorship, and/or publication of this article.
Availability of Data and Supporting Materials
Please contact author for data requests.