
Abstract
The aim was to compare the heel pad thickness (HPT) in diabetic patients with high biochemical parameters (fasting blood sugar [FBS], hemoglobin A1c [HbA1c], and lipid profile) with nondiabetic counterparts. A total of 438 subjects made up of 216 diabetics with high biochemical parameters (poorly controlled) and 222 apparently healthy subjects were recruited. The HPT, FBS level, HbA1c values and lipid profile, and duration of diabetes mellitus were assessed. Results showed that the mean HPT was 13.33 ± 1.29 mm in the control subjects and 16.79 ± 1.84 mm in diabetics. The HPT among diabetics differed significantly from the control group (P < .05). The mean value of HbA1c in the control group was 5.4 ± 1.3 compared to diabetics with values of 8.53 ± 2.1. The values of HbA1c among diabetics were significantly higher than that of the control group (P < .05). HPT had a significant linear relationship with HbA1c among the diabetic subjects (r = 0.42, P < .05).
The heel is a fat pad under the calcaneus that plays important roles in protecting the underlying bones of the foot. It also functions as a shock absorber, thus providing cushioning effects during walking, running, jumping, or landing from a height. It is composed of sealed spiral microchambers of unsaturated fat, contained in whorls of fibroelastic tissue, which is anchored to both the dermis and the calcaneus. 1 The heels are designed to be one of the areas of the foot that makes contact with the ground during normal activities, and so it must be structurally and mechanically stable to provide the necessary support, balance, and mobility. Considering the forces of walking, running, jumping, and landing that the heel is subjected to and the pull from various ligaments and muscles, it would be important to evaluate the heel pad in diabetic patients. This group of patients is usually susceptible to ulcerations (especially on the toe) and microtears on the plantar aspect of the foot.
The pathogenesis of foot ulcers in diabetes mellitus (DM) is multifactorial. Many studies have reported that peripheral sensory neuropathy, trauma, and deformity are the major predisposing factors for foot ulceration.2–4 Other factors involved in heel ulceration are ischemia, edema, limited joint mobility, and lower limb immobility. 2 The repetitive trauma of walking may increase pressure on the heels and, combined with the gradual alteration in thickness/loss of elasticity of the heel pad that occurs in diabetic patients, could result in loss of skin integrity and ulceration. 2 These ulcers may be prone to infection and directly extend to the calcaneus or along tissue planes proximal to the ankle joint. This can be one of the major causes of lower extremity amputation.2,5,6
Quantification of human soft tissues could be very useful in diagnosis, 7 and the knowledge of heel pad thickness (HPT) could be a useful screening tool in preventing further DM complications, such as ulcers. The HPT and the loss of its elasticity also have been suggested as being one of the causes of heel pain, especially among diabetics.8,9
The incidence of type 2 DM is growing very rapidly worldwide.10–12 The global estimate was approximated at three million in 1994 and was expected to increase two- to threefold by 2010. 13 In the United States, it is estimated that 23 million people will have type 2 DM by 2030. 14 In addition, 100 million will have pre-DM, and the cost of treating DM will create a huge financial burden on patients and the health care system globally. 14 In Nigeria, 30% of the elite population, including decision makers, have been diagnosed with DM. 15 The number of excess deaths attributable to DM is similar in magnitude to the number reported for human immunodeficiency virus in the year 2000. 16
The principal mediators of tissue damage and chronic complications in DM are the interrelated processes of lipoprotein abnormalities, protein glycation, oxidation, and endothelial dysfunction. 17 Nonenzymatic reactions between reducing sugars and several precursors such as collagen, plasma proteins, lipoproteins, cell membranes, and intracellular proteins lead to the formation of multiple compounds, known as advanced glycation end products (AGEs). 18 In patients with DM, hyperglycemia-mediated synthesis of new collagen and accumulation of glycation end products accelerate age-related changes noted in the skin,19,20 connective tissue, and joints. This would include decreased elasticity, increased collagen cross-linking, and loss of enzymatic digestibility of the extracellular matrix. 21 The rate of protein turnover is also a significant determinant of AGE accumulation, being increased in tissues with slow collagen turnover such as skin and cartilage. 18 The rate of AGE residue deposition in skin collagen and connective tissues is associated with severity of hyperglycemia as well as the presence of long-term complications.20,22
Main target organs for insulin action and therefore sites responsible for insulin resistance and complications are the liver, skeletal muscles, and adipose tissue. 23 Reduced responsiveness to insulin in these tissues would lead to insulin resistance and later on to glucose intolerance and development of complications on the affected parts. 24 Various factors have been implicated in the development of insulin resistance. This includes an excess of intrahepatic fat, 25 skeletal muscle’s fat infiltration,26,27 an increased central obesity, 28 and visceral adiposity. 29
Complications from poor management of DM are on the increase. A long-term prospective nonrandomized study of DM control and complications has shown a 10-fold increase in the prevalence of complications, such as retinopathy, neuropathy, and nephropathy, in poorly versus well-controlled patients. 17 DM is the leading cause of blindness in persons aged 20 to 70 years. 17 It is the leading cause of end-stage renal disease (ESRD), nontraumatic limb amputations, 17 and psychological trauma associated with limb amputation. The outlook for diabetic patients may be very challenging, and the next generation faces an even more serious problem by 2030. Therefore, it is imperative to establish early detection of complications associated with DM. The aim of this study was to quantify the HPT in poorly controlled diabetic patients and evaluate the relationship of HPT with hemoglobin A1c (HbA1c) concentration. This has the potential to be a useful early diagnostic tool and accelerate prevention.
Method
DM patients for this study were recruited from the diabetic clinic of a teaching hospital in Nigeria. Subjects were confirmed to be diabetic by the hospital’s diabetic clinic. Only those with type 2 DM, with a fasting blood sugar level of 8 mmol/L or higher, were invited and consented to the study. The recruited subjects were asked to come to the clinic without having breakfast (fasting). On arrival to the imaging room, patients were greeted, and the procedure was explained to them. Only patients and volunteers who gave informed consent were recruited for the study. The HPT was measured using a high-resolution digital dedicated small-parts real-time ultrasound machine (Sonoace 5500; Medicol, Medison, Miami, FL, USA) with a high-frequency (10-MHz) linear array transducer. The ultrasound equipment produced a 3-cm × 4-cm field of view with an axial resolution of 0.5 mm and a lateral resolution of 1 to 2 mm. Patients lay prone on the examination table with their feet extended over a padded couch (Figure 1). Ultrasound coupling gel was applied on the surface of the heel, and the transducer was placed over the midsection of the plantar surface. Measurements were taken (transverse image of the mid-heel) from the calcaneal tuberosity to the skin (Figure 2), without compression of the underlying soft tissues, as described by Silver et al. 30 All measurements of the heel pad (average of three measurements of both feet) were performed in the morning by a single well-experienced sonographer. An independent observer recoded the readings/measurement to prevent the sonographer from being biased by previous readings.
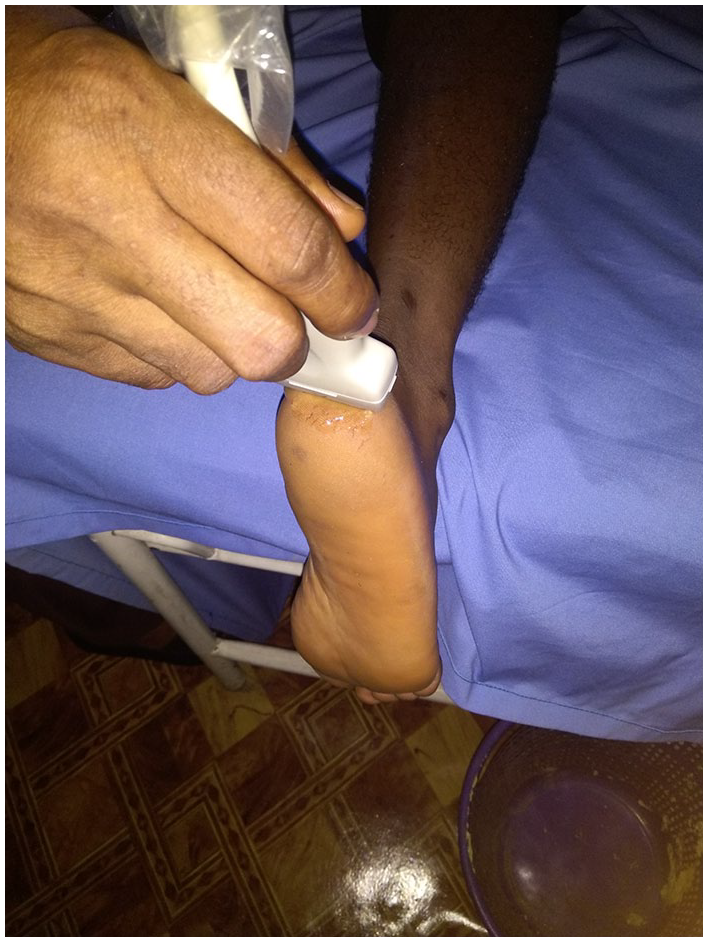
Patients’ position prior to heel scan and probe orientation.
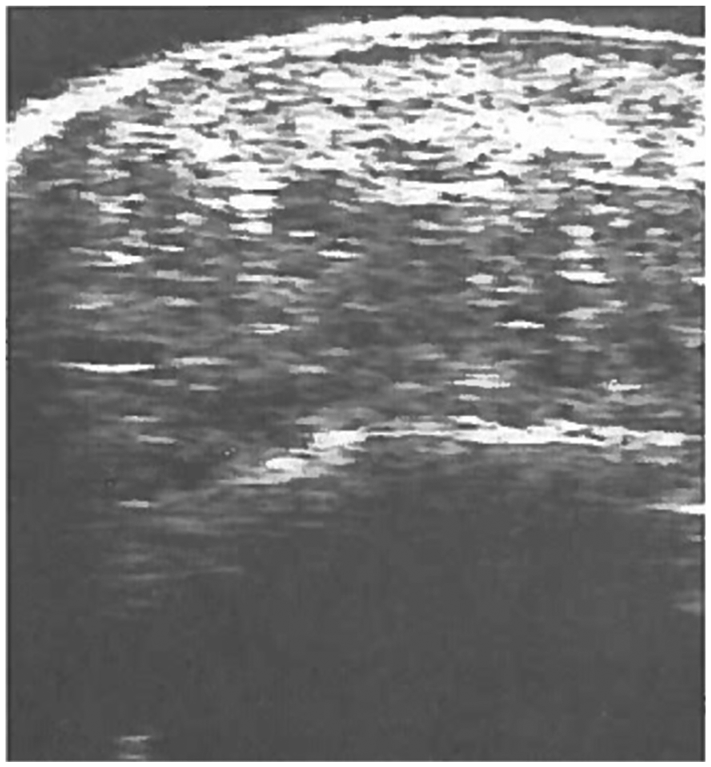
Sonogram showing how measurements were taken.
The fasting blood sugar level was assessed using a digital glucometer (Accu-Chek Active; Roche Group, West Sussex, UK). The tip of the subjects’ thumb was pricked with a lancet after the area was cleaned with cotton wool and methylated spirit. A drop of blood from the thumb was placed on the strip of the Accu-Chek Active, and the fasting blood sugar level was read from the meter. Diabetics with a fasting blood sugar level of 8 mmol/L or greater were considered in poor control of their DM. To determine the HbA1c level, the tip of the other thumb was also pricked with a lancet after the area was cleaned with cotton wool and spirit. A drop of blood from the thumb was placed on the strip of the Bio-Rad Diamat (Hercules, CA, USA) analyzer, and the HbA1c concentration and lipid profiles were determined electronically as described by Lind et al. 31 Lipid profile and HbA1c concentration (and not just fasting blood sugar alone) were measured to further confirm that the subjects were actually in poor control of their DM. The duration of DM was obtained from patients and recoded by an independent observer. The subject’s weight, height, and age were also documented.
Data Analysis
The mean and range of the various variables measured were obtained using descriptive statistics. Pearson correlation analysis was used to assess the association of HPT with HbA1c, lipid profiles, age, and sex. The t test was used to test the difference between the HPT of healthy and diabetic patients. The data had a normal distribution. P < .05 was chosen as the level of statistical significance.
Results
A total of 438 subjects, composed of 216 poorly controlled diabetic patients and 222 apparently healthy subjects, were recruited for the study. The diabetic patients consisted of 103 males (31–70 years) and 113 females (30–68 years). The control group consisted of 114 males (27–68 years) and 108 females (26–72 years).
For the control subjects, the mean HPT was 13.33 ± 1 (see Table 1). A comparison of HPT across age groups, within the healthy control subjects, showed no significance difference (P > .05) between groups and across groups (see Table 2). When sex and age group were controlled, HbA1c and low-density lipoprotein (LDL) were the only significant factors that correlated with HPT. HPT had a weak correlation with body mass index (BMI) (r = 0.32, P = .03) but no significant correlations with age (see Table 3). The mean HPT of diabetics was 16.79 ± 1.84 mm. The HPT of diabetics differed significantly from that of the control group (P < .05). The mean value of HbA1c in the control group was 5.4 ± 1.3 while that of the diabetics was 8.53 ± 2.1. The values of HbA1c in the diabetics were significantly higher than those of the control group (P < .05). Subjects with very high HbA1c values (7 and above) had higher HPT even when sex, age, and BMI were controlled. HPT had a significant linear relationship with HbA1c among the diabetic subjects (r = 0.42, P < .05) but not with the control group. Again, the values of the lipid profiles except triglyceride in the diabetics significantly differed from that of the control group (P < .04). HPT had positive correlations with LDL and HbA1c but negative correlations with high-density lipoprotein (HDL) and triglycerides. HPT also increased with duration of DM.
Mean ± SD Values of Laboratory Biomarkers for Diabetic and Control Study Patients.
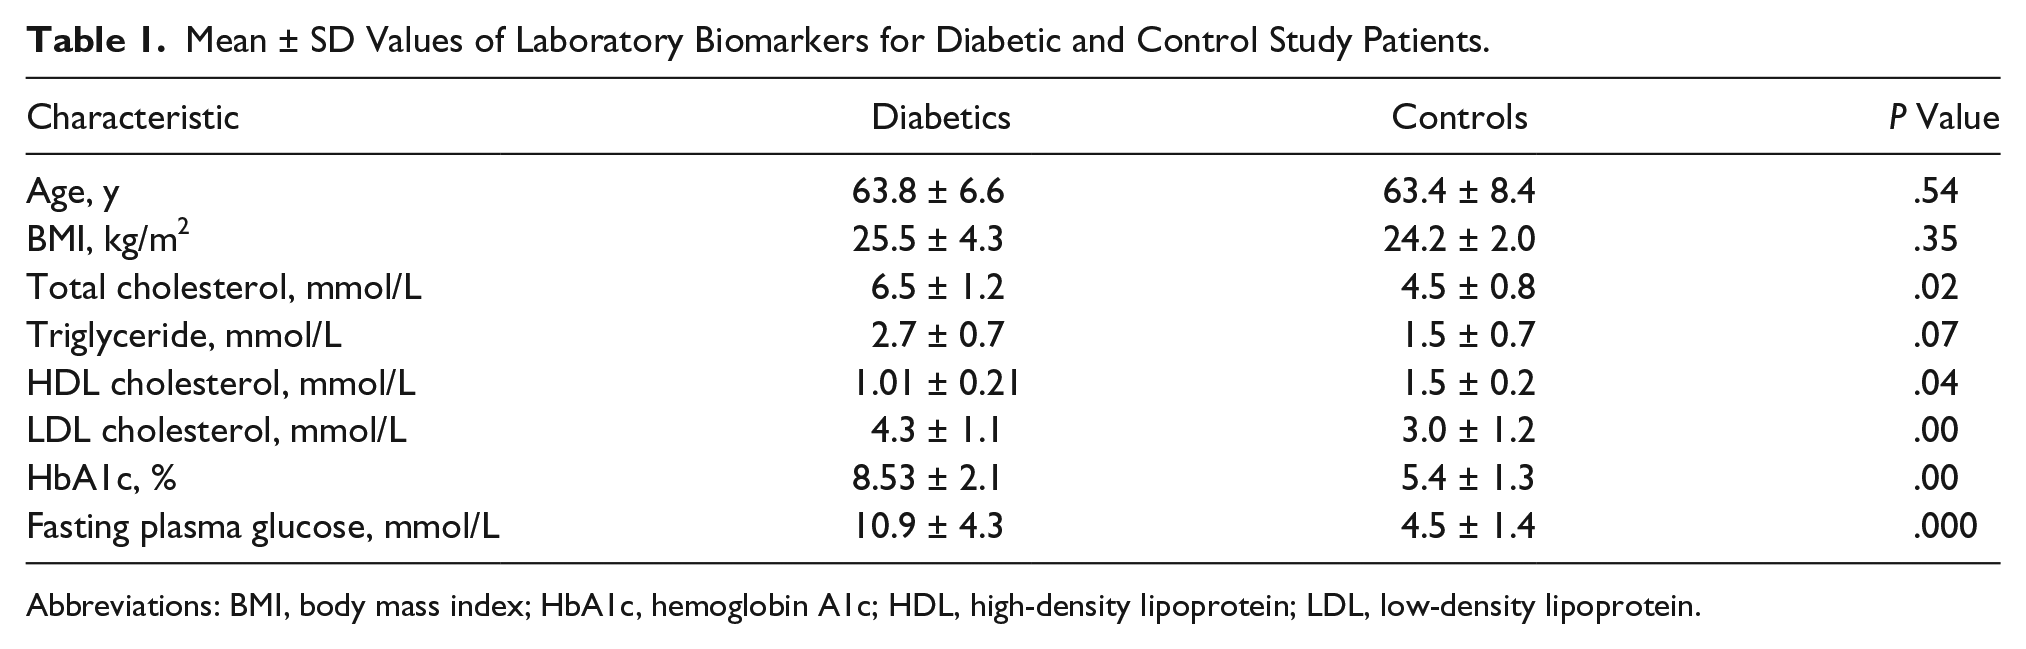
Abbreviations: BMI, body mass index; HbA1c, hemoglobin A1c; HDL, high-density lipoprotein; LDL, low-density lipoprotein.
Mean ± SD Distribution of HbA1c and HPT Between Nondiabetic and Diabetic Subjects Across Varied Age Groups.
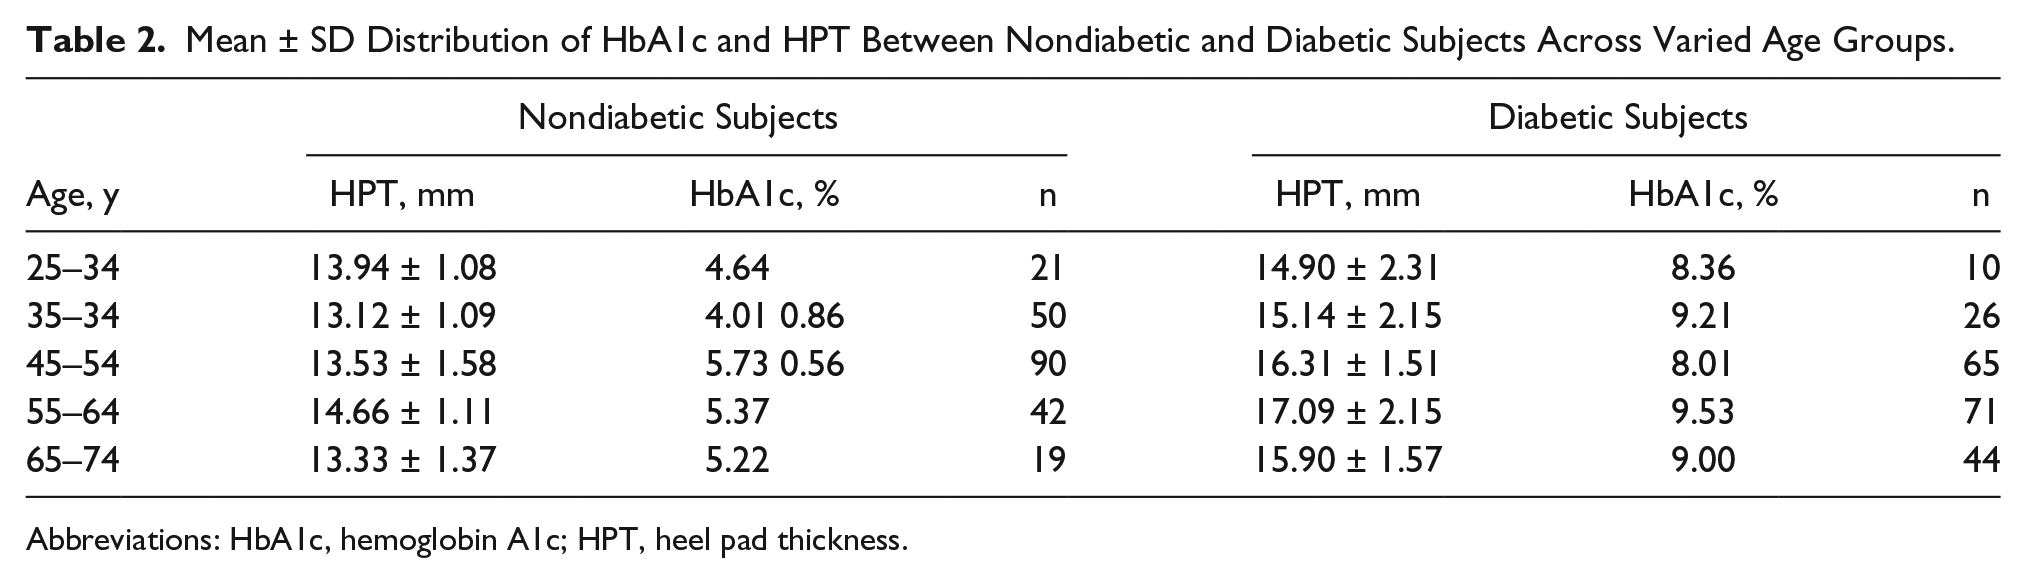
Abbreviations: HbA1c, hemoglobin A1c; HPT, heel pad thickness.
Pearson Correlation to Determine the Strength of Association Between HPT, Lipid Profile, and HbA1c.
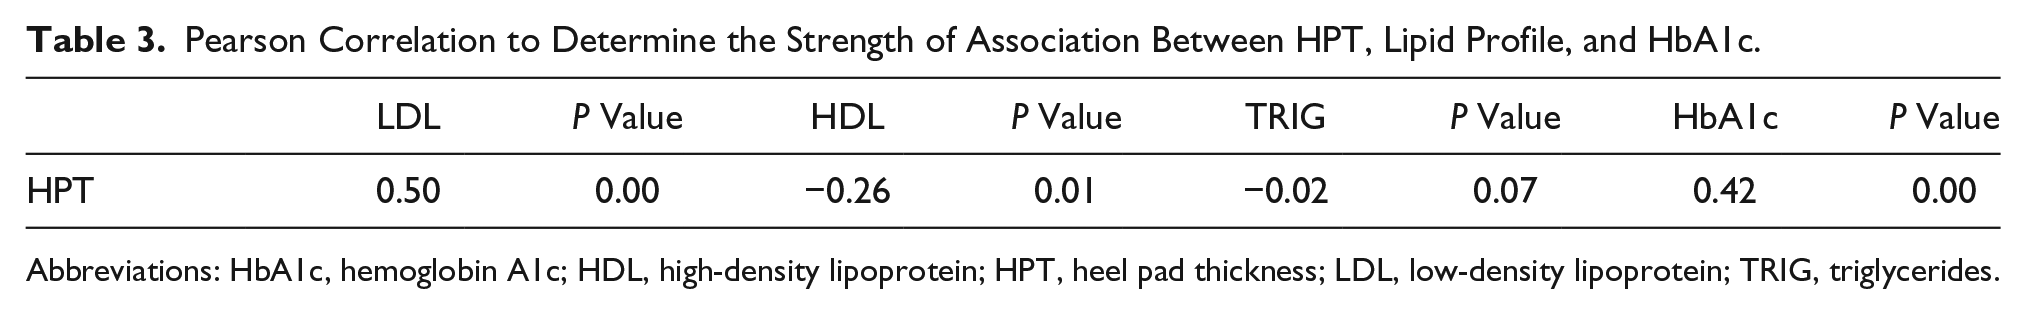
Abbreviations: HbA1c, hemoglobin A1c; HDL, high-density lipoprotein; HPT, heel pad thickness; LDL, low-density lipoprotein; TRIG, triglycerides.
Discussion
These study results demonstrate that the mean HPT of the control subjects in the studied population is 13.33 ± 1.29 mm with a range of 10.30 to 16.55 mm. This value differs significantly from that of the diabetics, whose mean HPT was 15.79 ± 1.84 mm and ranged from 11.40 to 20.41 mm. Other studies had earlier reported increased HPT in diabetic patient. 32 Hyperglycemia, which is a common denominator in diabetic patients, promotes glycation of proteins and consequent accumulation of advance glycation end products in some human tissues. The accumulation of these end products in the basement membrane of the tissues results in the thickening of the tissues.
The results of this study indicated that there was no significant difference between the mean dimension of HPT in males and females among the diabetic subjects, unlike the control group. This is thought to be the result of the supremacy and overshadowing effects of nonenzymatic glycation (powered by hyperglycemia) in diabetics over hormonal or genetic influences in the control group. This indicates that hyperglycemia and not genetic composition drives the HPT in diabetic patients.
HPT in the present study correlated positively with HbA1c (r = 0.42, P < .05) and LDL (r = 0.50, P < .05) and negatively with HDL and triglycerides. Junyent et al. 33 also observed in their study that the thickness of the tendocalcaneus correlated positively with LDL cholesterol and negatively with HDL cholesterol. HbA1c provides a measure of glycemic control during the previous two to three months. 34 In patients with diabetes, hyperglycemia enhances the synthesis of new collagen 19 AGEs and accelerates HPT. The AGE residues in skin and connective tissues are associated with severity of hyperglycemia and hyperlipidemia. 22 The above findings suggest that the severity of the lipid phenotype influences extravascular cholesterol and collagen deposition in tissues. This means that HPT could be useful in the assessment of dyslipidemia and maybe glycemic control.
Deposition of materials (e.g. AGE, cholesterol) in the heel pad could change its mechanical properties and resilience, and it predisposes the heel to injuries. Rome et al. 35 in their studies noted that HPT is an important factor in determining stress observed in healthy as well as pathological feet. Abboud et al. 36 assessed cholesterol level and rotator cuff tears and found a positive correlation between hypercholesterolemia and tendon injury. Research on fatty deposits in the tendon (xanthomas), which are often associated with familial hypercholesterolemia, also provides details about cholesterol’s potential contribution to tendon size and injury. 37 These fatty lesions increase tissue size and may alter the biomechanics of the heel pad.
“Heel pad sign” is an increased HPT that has been demonstrated in a number of conditions, and some studies have investigated the effects of some systemic diseases on the structural integrity and inclination of the tissue.38–40 Apart from the heel pad, the thicknesses of the other structures of the foot have been reported to be higher in diabetic subjects compared to their nondiabetic counterparts. 36 It could be suggested that insulin resistance and hence DM complications result from the accumulation of intracellular lipid metabolites in target organs, as reported in studies of both humans and experimental animals. 41
Conclusion
In this study, HPT was increased in poorly controlled diabetics compared to their nondiabetic counterparts. HPT was also significantly correlated with diabetic patients’ HbA1c level. More research is needed to determine whether this would be a good sonographic screening tool for patients diagnosed with DM type 2.
Footnotes
Declaration of Conflicting Interests
The authors declared no potential conflicts of interest with respect to the research, authorship, and/or publication of this article.
Funding
The authors received no financial support for the research, authorship, and/or publication of this article.