
Abstract
To determine the value of prefrontal space ratio (PFSR) as a novel soft marker in the second-trimester screening for trisomy 21, PubMed and two other databases were searched electronically for the relevant materials published between January 2000 and December 2015. Four studies were included in the mini meta-analysis. All of the studies were retrospective and of high quality. Overall sample size was 293 trisomy 21 and 609 euploid fetuses. The pooled mean PFSR was 0.322 (95% confidence interval [CI], 0.256-0.388) and 1.205 (95% CI, 0.997-1.413) in trisomy 21 and euploid fetuses, respectively. This ratio was found to be significantly lower in trisomy 21 fetuses compared to euploid ones (P < .0001). The pooled detection rate was 87.2% at a false-positive rate of 5%. Pooled positive and negative likelihood ratios measured 17.2 and 0.146, respectively. In conclusion, PFSR is an efficient marker that may be investigated in the second-trimester ultrasound screening for trisomy 21.
Keywords
Trisomies make up about 70% of all aneuploidies, and trisomy 21 is the most common among them (53% of trisomies). 1 In the past decades, different strategies have been developed for prenatal screening of trisomy 21. In the early 1970s, fetal screening was solely based on maternal age. The methods continued to evolve over the years. The most recent advancement is the cell-free DNA (cfDNA) or Harmony test.2,3 The ultimate goal of these attempts is to increase the detection rate (DR) of aneuploidies along with a reduced false-positive rate (FPR).
Second-trimester sonographic screening for aneuploidies is based on looking for soft markers, in conjunction with predefined structural abnormalities. Soft markers are variations from normal anatomy, which are more common in aneuploid fetuses compared to euploid ones. These markers are often not clinically significant and do not cause adverse pregnancy outcomes; rather, they are transient findings in most instances. The most common soft markers currently assessed in the second-trimester sonogram include (1) nuchal fold (NF) thickness (Figure 1); (2) absence/hypoplasia of the nasal bone (NB); (3) echogenic intracardiac focus (EIF) (Figure 2); (4) echogenic bowel; (5) renal pyelectasis (Figure 3); (6) short femur and short humerus; (7) mild ventriculomegaly (Figure 4); and (8) aberrant right subclavian artery. In the presence of a soft marker, risk of trisomy 21 may be recalculated by multiplying the baseline risk (based on the maternal age, first-trimester sonographic and blood screening, and second-trimester maternal serum biochemical markers) by the positive likelihood ratio attributed to the detected soft marker. If the pregnancy falls into the high-risk category for aneuploidy or two major soft markers (e.g., absent NB and increased NF thickness) are present, diagnostic testing (i.e., amniocentesis) should be offered to the patient. Test characteristics of different soft markers in the second-trimester sonographic screening for trisomy 21 are summarized in Table 1.4,5
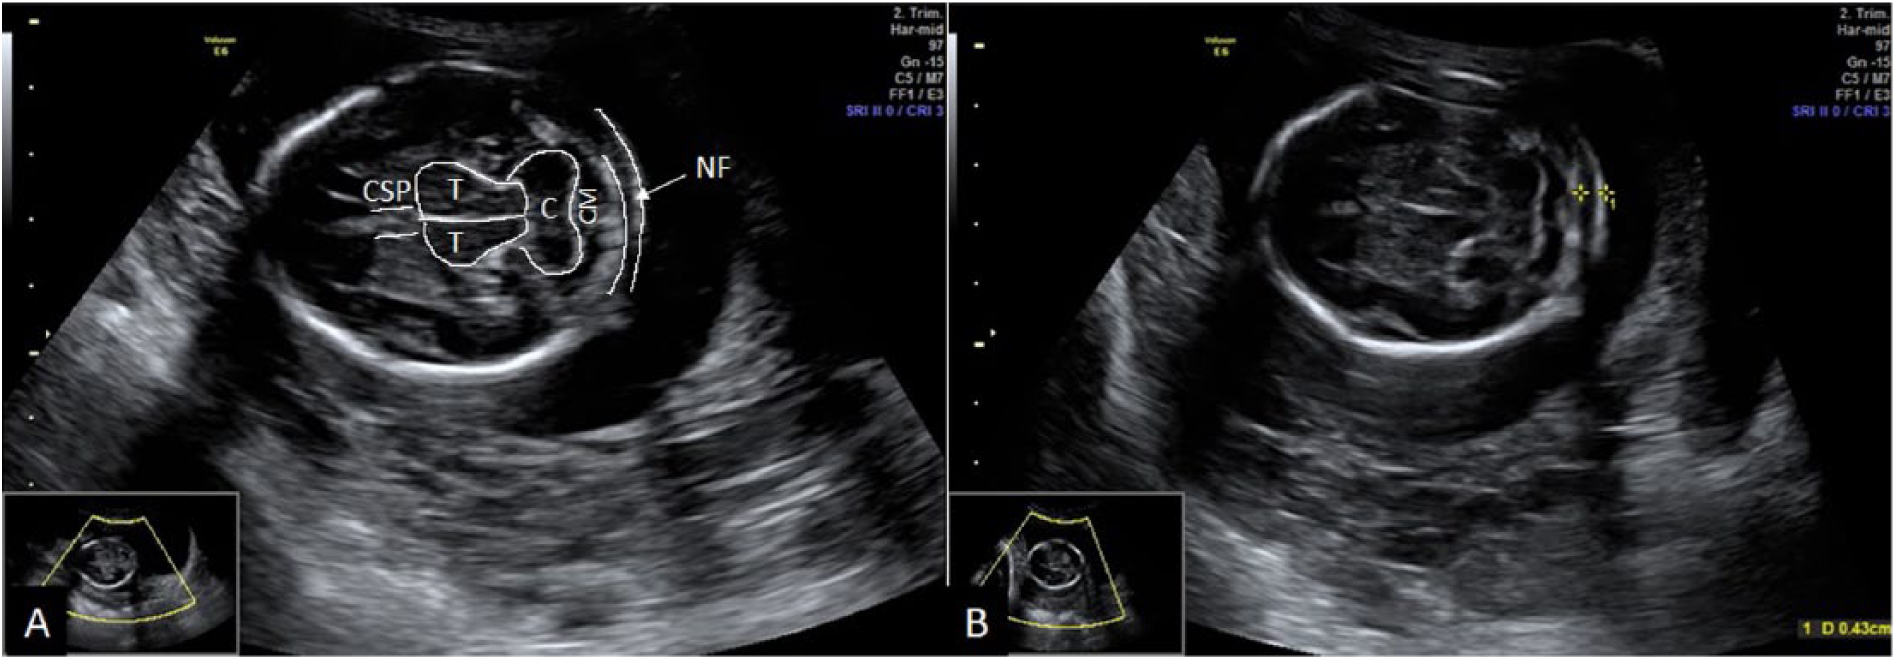
Nuchal fold (NF) thickness. (A) NF is measured in an axial section of the fetal head at the level of the cavum septum pellucidum (CSP), thalami (T), and cerebellum (C), which are outlined in white manually (CM, cisterna magna). (B) The calipers are placed at the outer edges of the occipital bone and the skin.
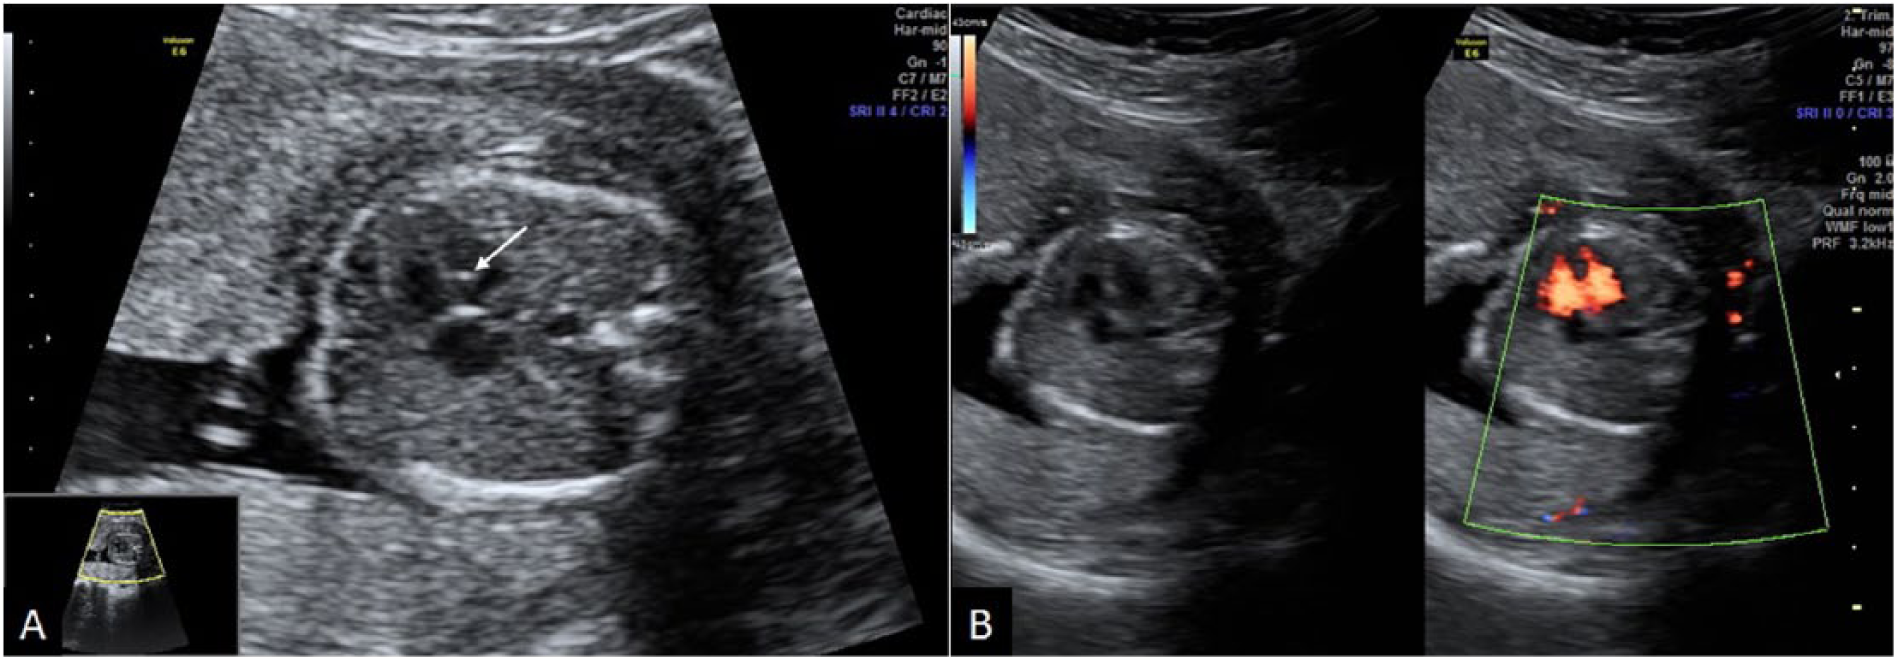
Echogenic intracardiac focus (EIF). (A) A small bright focus (arrow) is seen in the left ventricle. The significant EIFs should be as bright as bone, which distinguishes them from normal papillary muscles. (B) The gray-scale and color Doppler ultrasound of the same fetus revealing a ventricular septal defect.
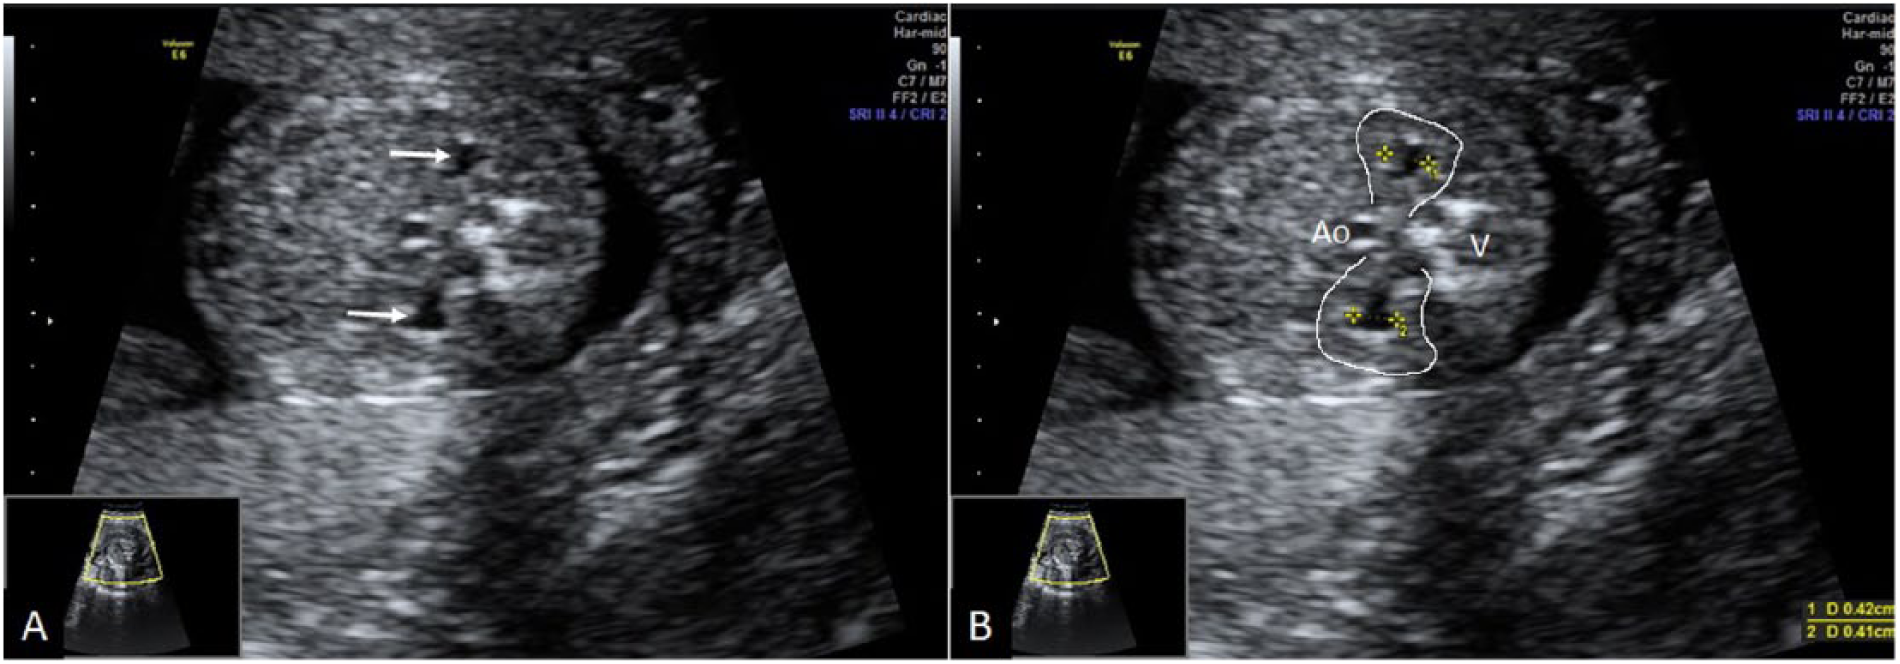
Fetal pyelectasis. (A) Mild bilateral pyelectasis is seen (arrows). (B) Anteroposterior diameter of renal pelves is measured in an axial section of the fetal abdomen. Both renal borders are outlined in white manually (Ao, aorta; V, vertebrae).
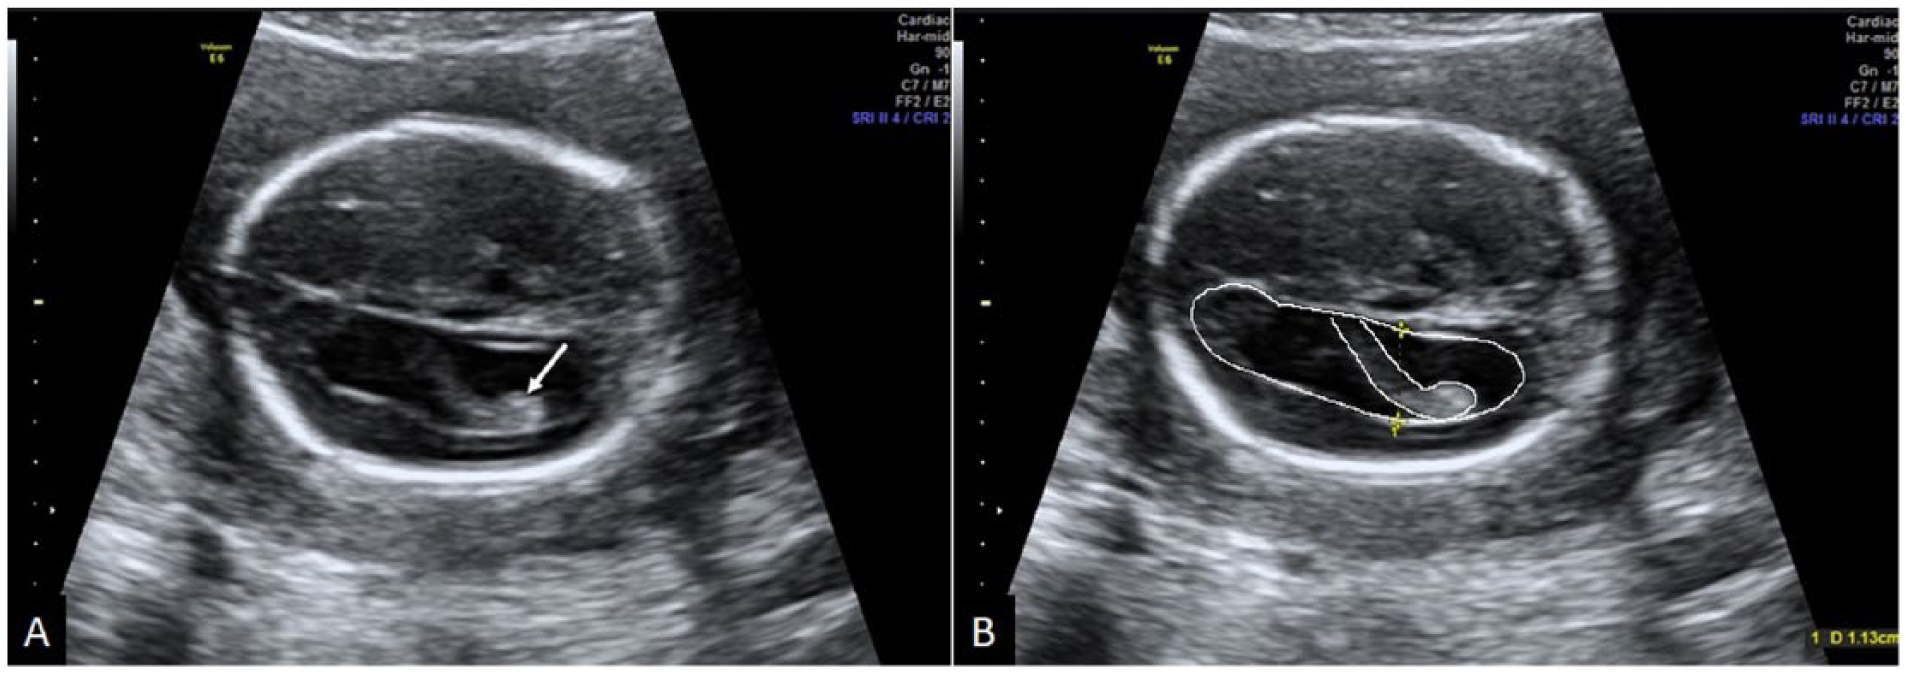
Fetal ventriculomegaly. (A) Mild ventricular dilatation with a dangling choroid plexus (arrow). (B) The ventricular diameter is measured in an axial section of the fetal head at the level of the lateral ventricular atrium and the choroid plexus glomus. The calipers should be placed in the inner margins of both medial and lateral walls. The ventricle and choroid plexus are outlined in white manually.
Test Characteristics of Different Soft Markers in the Second-Trimester Ultrasound Screening for Trisomy 21. a
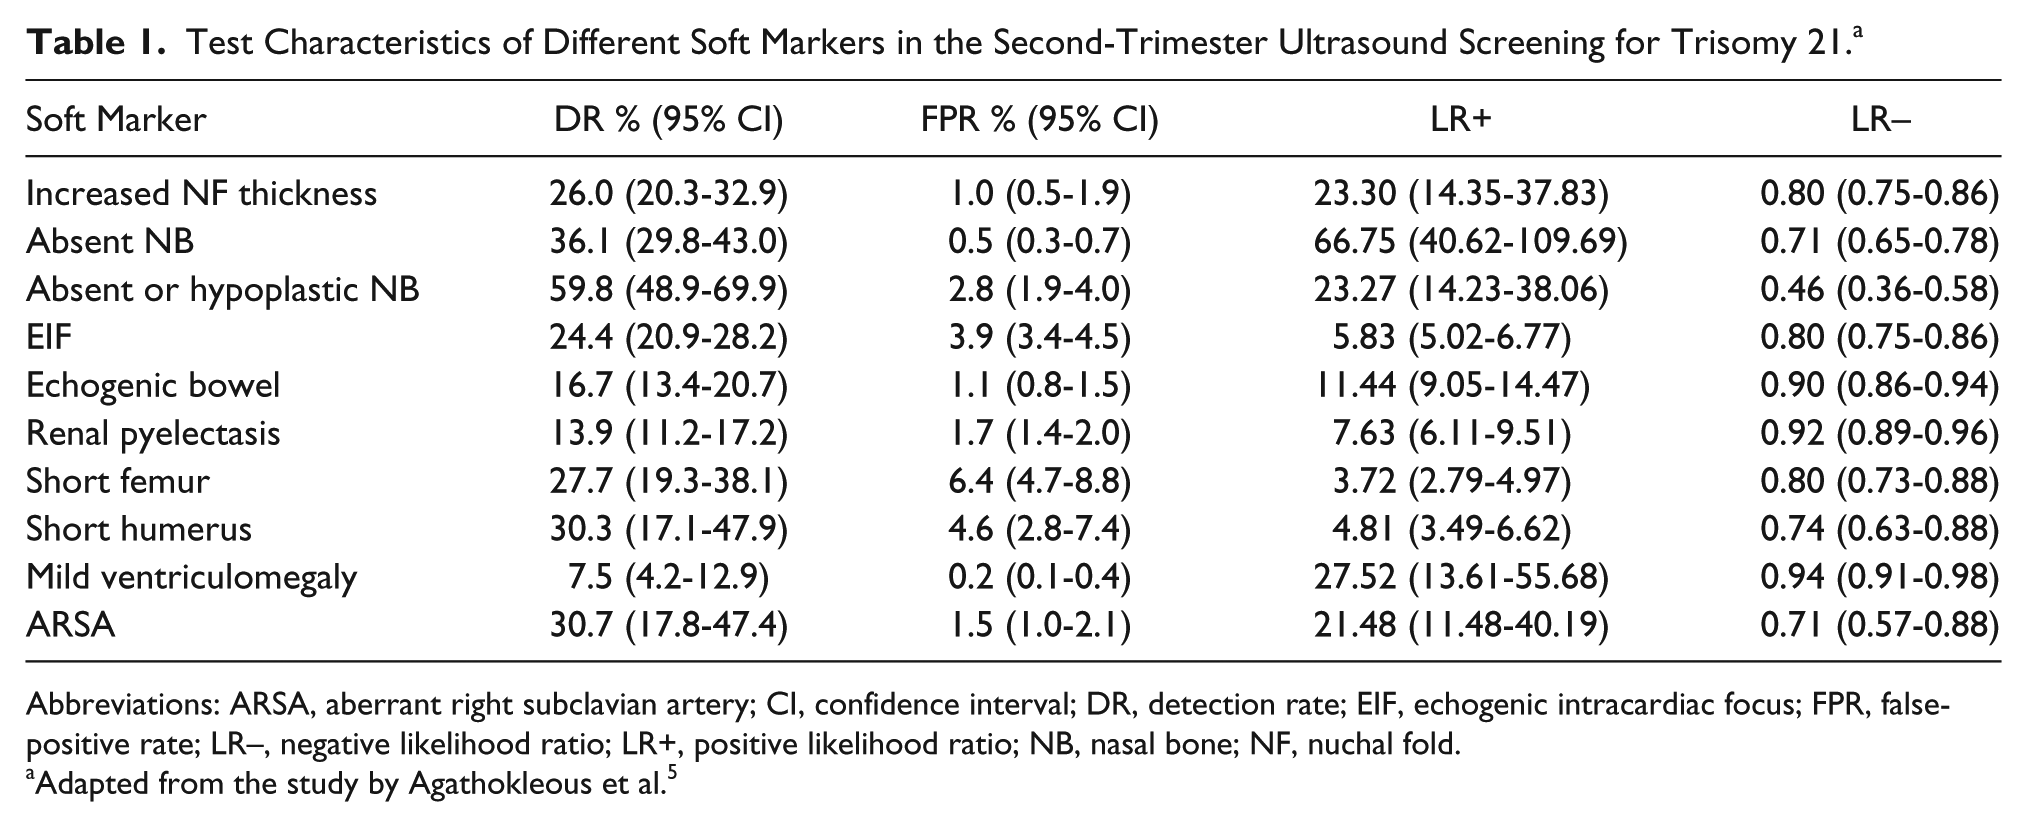
Abbreviations: ARSA, aberrant right subclavian artery; CI, confidence interval; DR, detection rate; EIF, echogenic intracardiac focus; FPR, false-positive rate; LR–, negative likelihood ratio; LR+, positive likelihood ratio; NB, nasal bone; NF, nuchal fold.
Adapted from the study by Agathokleous et al. 5
Some differences have been described in the facial features between euploid and aneuploid fetuses. The most common facial markers that are used for detecting trisomy 21 fetuses are the NB, prenasal skin thickness, and maxillary bone length (Figure 5).6 –8 The DR of trisomy 21 fetuses when the NB is absent or hypoplastic is 59.8% with a FPR of 2.8%. The FPR is greater in African Caribbeans (8.8%). The positive and negative likelihood ratios for absent/hypoplastic NB have been reported to be 23.27 (95% confidence interval [CI], 14.23–38.06) and 0.46 (95% CI, 0.36–0.58), respectively.5,6 In addition, in the trisomy 21 fetuses, the prenasal skin thickness is increased compared to the euploid fetuses and is reported to be above the 95th percentile in about 73% of trisomy 21 fetuses. 7 Also, maxillary length is significantly shorter in trisomy 21 fetuses, resulting in midfacial hypoplasia. However, maxillary length seems to be dependent on NB status (i.e., presence or absence/hypoplasia). 8
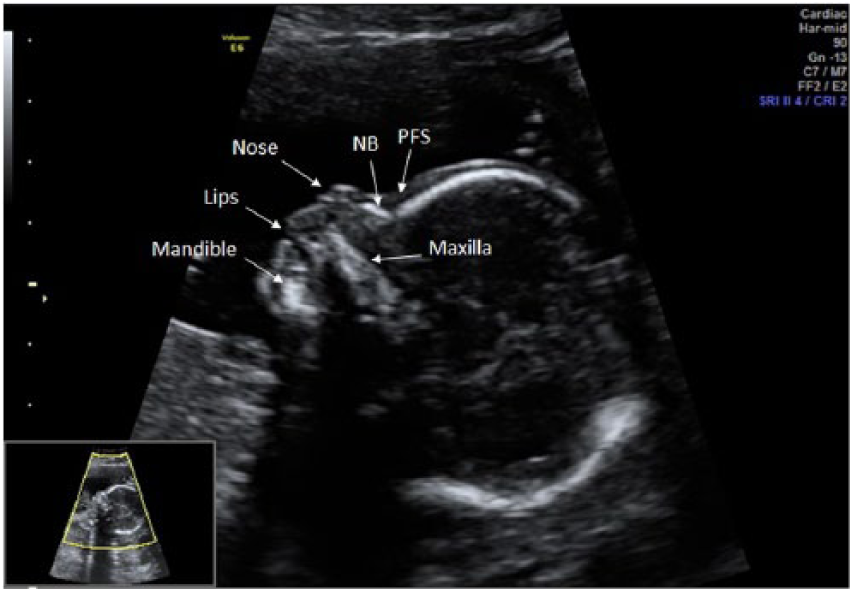
Facial characteristics of a normal fetus. Fetal facial profile is best assessed on a precise midsagittal section of the fetal face. NB, nasal bone; PFS, prefrontal space.
Prefrontal space ratio (PFSR) is a relatively novel soft marker that is based on two facial characteristics in trisomy 21 fetuses, including (1) posterior displacement of the anterior edge of the maxilla (i.e., midfacial hypoplasia); and (2) increased thickness of the prenasal skin. Recent studies have shown that the PFSR is an independent soft marker, which means that the presence or absence of other soft markers does not affect this ratio. In addition, its value is constant throughout the pregnancy. These characteristics potentially make the PFSR an appropriate marker, which may be investigated in the second-trimester sonographic screening for trisomy 21. For determining this ratio, in the midsagittal view of the fetal face (Figure 6), a line is drawn between the most anterior aspects of the fetal chin and maxilla (mandibulo-maxillary or MM line) extending in front of the fetal forehead. The second line is drawn parallel to the inferior aspect of the maxilla from nasion (just superior to the point where the skin over the forehead turns anteriorly over the fetal nose) to the point where the MM line is intercepted. The PFSR is measured by dividing the following two distances: prenasal skin to the point where the MM line is intercepted (d2), and the leading edge of the skull to the prenasal skin (d1). In case the MM line crosses behind the leading edge of the prenasal skin (which has been reported as a very strong marker for trisomy 21), the d1 measurement is still taken between the frontal bone and the skin, but the d2 measurement is taken between the MM line and the skin and then multiplied by −1. This method has been adopted by most authors for measuring the PFSR. However, Chaveeva et al. 9 have suggested a different method of PFSR measurements. In their method, after drawing the MM line, the second line is drawn from nasion to the MM line perpendicularly. The PFSR is measured by dividing the following two distances: the leading edge of the skull to the prenasal skin (D1), and the leading edge of the skull to the MM line (D2). They have recommended this method for two reasons: first, the inferior edge of the maxilla is not a well-defined line in most instances, and second, in the case of increased prenasal thickness, accurate measurement of d2 may be impossible. Note that PFSR is defined as d2/d1 and D1/D2 in the first and second methods, respectively.9 –12 Because the first method of PFSR measurement is more popular, all the values and analyses provided in this article are based on this method.
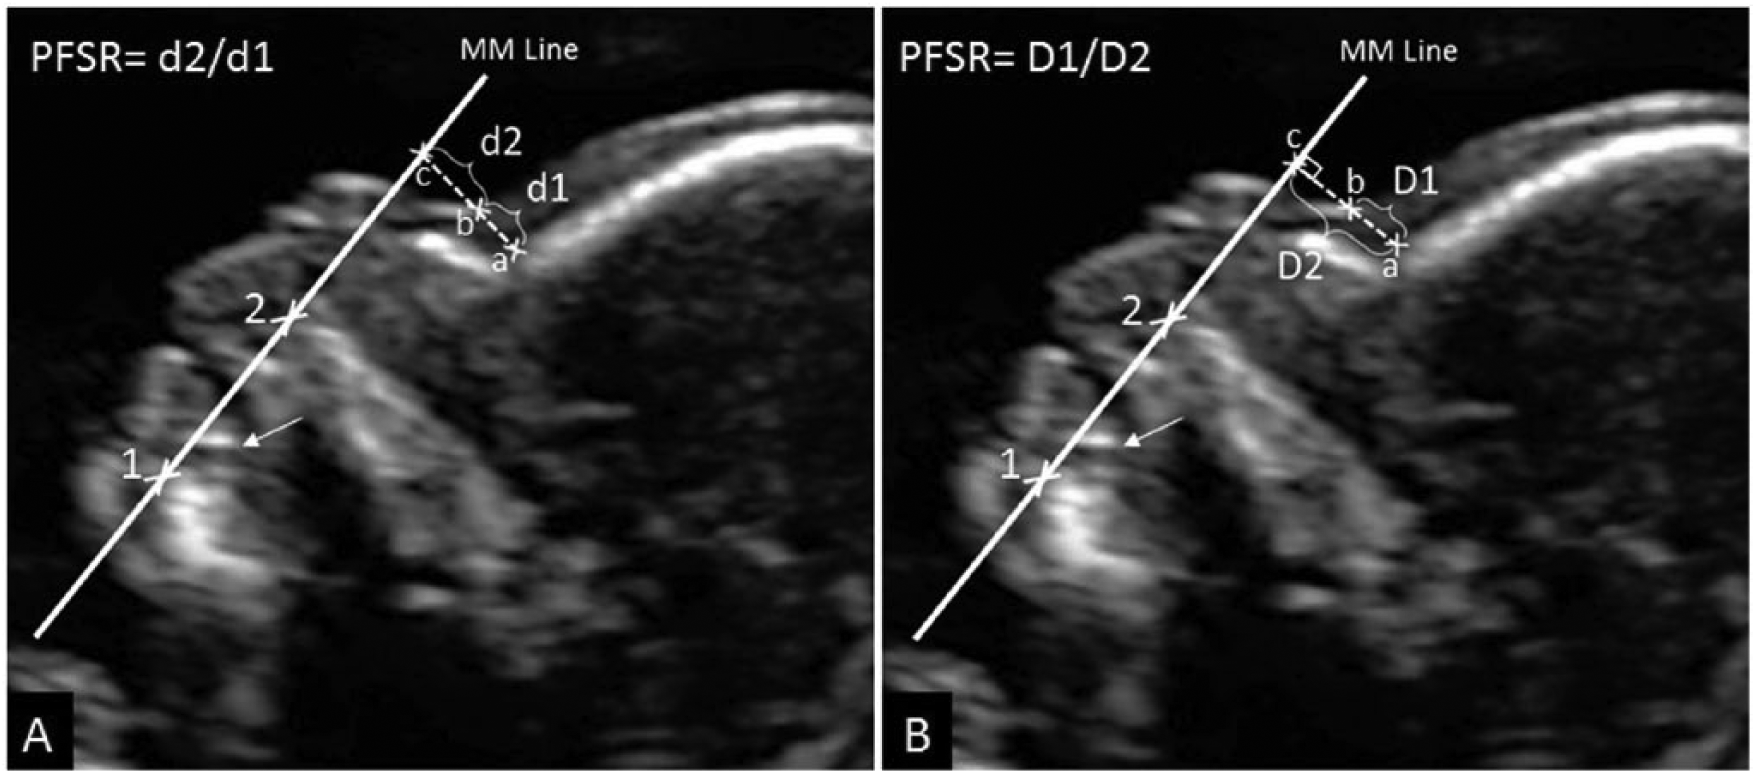
Prefrontal space ratio (PFSR) measurement methods. PFSR is measured on a midsagittal section of the fetal face. The image should be zoomed in, so that most of the field is occupied by the fetal facial profile. (A) The most popular method adopted by the majority of authors for measuring PFSR. The reference point is placed on the most anterior edge of the fetal chin (point 1) slightly below the tooth bud (arrow). The mandibulo-maxillary (MM) line is then drawn from this point to the most anterior aspect of the maxilla (point 2) extending in front of the fetal forehead. The second line is drawn parallel to the inferior aspect of the maxilla. The distance between the leading edge of the frontal bone (point a) and the prenasal skin (point b) is called d1, and the distance between the leading edge of the prenasal skin (point b) and the point where the second line intercepts the MM line (point c) is called d2. (B) Chaveeva et al. 9 method of PFSR measurement. The MM line is drawn similar to the other method. However, the second line is drawn from the most inferior end of the skull in the forehead perpendicular to the MM line. The distance between the skull and prenasal skin (D1 = a–b) and the distance between the skull and the MM line (D2 = a–c) are then measured.
The objective of this study was to determine the value of PFSR as a novel soft marker in the second-trimester sonographic screening for trisomy 21 based on a systematic review and mini meta-analysis.
Methods
Protocol
The Preferred Reporting Items for Systematic Reviews and Meta-Analyses (PRISMA) statement 13 was followed by the authors during this study.
Data Sources
The PubMed, Embase, and Cochrane databases were searched electronically on December 24, 2015, for the keywords prefrontal space ratio, soft marker, second-trimester screening, trisomy 21, and Down syndrome and related terms in articles published between January 2000 and December 2015, without any language restriction. The reference list of the retrieved articles was also manually searched for any relevant publications.
Eligibility Criteria
To decrease the between-study heterogeneity, just the studies with random sampling of all ethnicities were included in the meta-analysis. In addition, the studies that did not provide the minimum required data (described in the Data Collection section) were excluded.
Study Selection
Titles and abstracts of all relevant studies were screened primarily by one of the authors (M.Z.M.). The same author further examined full manuscripts of the studies that met the eligibility criteria.
Data Collection
Study data were independently extracted by the two reviewers (M.Z.M. and E.K.). Any disagreement was resolved by consensus. The following data were collected from the included studies: (1) study characteristics (including authors, country of origin, design, and sample size); (2) gestational and maternal ages at the time of sonographic examination; (3) method of the PFSR measurement and its mean values in the case and control groups; and (4) test characteristics (including DR, FPR, and positive and negative likelihood ratios).
Quality Assessment
The quality of retrieved studies was assessed using items from the QUADAS-2 (Quality Assessment of Diagnostic Accuracy Studies−2) tool. 14 According to the QUADAS-2, each study was evaluated for patient selection, index test, reference standard, and flow and timing. All items were assessed about the risk of bias, and the first three domains were evaluated regarding concerns about applicability.
Analysis and Synthesis of Results
Meta-analyses were performed for the mean PFSR in both case and control groups, DR of the test at a given FPR, and the positive and negative likelihood ratios using random effects modeling. 15 The pooled mean PFSR values were compared between the case and control groups (i.e., trisomy 21 and euploid fetuses) using the unpaired t test, and a P value less than .05 was considered to be statistically significant. Between-study heterogeneity was assessed by I2 statistic and was considered to be high if I2 was more than 0.60. In case data distribution normality was not provided by the authors, it was determined by dividing the differences of the observed mean from the highest and lowest measured values by the standard deviation (SD), and the distribution was considered mildly skewed if the ratio was between 1 and 2, and severely skewed if it was less than 1. The analyses were performed using Comprehensive Meta-Analysis (version 2; Biostat, Englewood, NJ, USA), and Statistical Package for the Social Sciences (version 20; IBM Corporation, Armonk, NY, USA) software.
Results
Study Selection
Five relevant studies were found in the primary search.9 –12,16 One of the studies was excluded from the initial screening because it was performed solely with a black population and did not meet the predefined eligibility criteria. 16 All included studies were retrospective and of high quality. The between-study heterogeneity was low to moderate (I2 = 0.134 in trisomy 21 group, and I2 = 0.483 in euploid group).
Study Characteristics
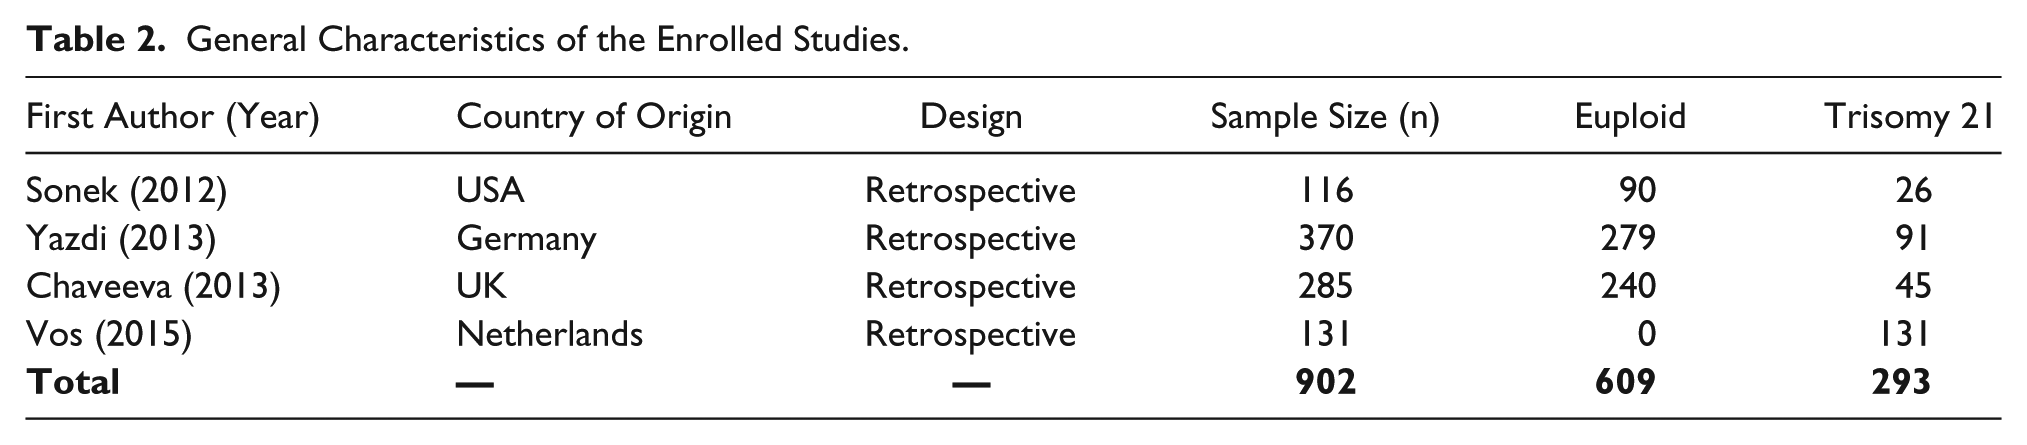
General characteristics of the enrolled studies are summarized in Table 2. In all included studies, the midline view of the fetal face was reconstructed or retrieved retrospectively using the stored 3D volumes or 2D images, and the mean PFSRs in trisomy 21 (case) and euploid (control) fetuses were compared with each other. Although the primary method of PFSR measurement was different in one of the studies (i.e., Chaveeva et al. 9 study), it is fortunate that Chaveeva and colleagues provided the equivalent values that were measured by a similar method to other studies. Thus, the extracted data were made homogeneous by using these equivalent values. Sonek et al. 10 did not provide data on the test DR; therefore, this study was not included in the meta-analysis for determining the pooled DR. However, Sonek et al. study data were included in measuring the pooled mean PFSR in the case and control groups. As previously mentioned, PFSR is independent of gestational age (GA); therefore, the GA heterogeneity between these studies could not confound the meta-analyses (Table 3). Maternal age of the euploid and trisomy 21 pregnancies in the included studies is summarized in Table 4. The PFSR had normal distribution in both case and control groups in all studies, except for the PFSR values of euploid fetuses in the Sonek et al. study, which were slightly positively skewed.
General Characteristics of the Enrolled Studies.
Gestational Age of the Euploid and Trisomy 21 Fetuses at the Time of Ultrasound Examination.
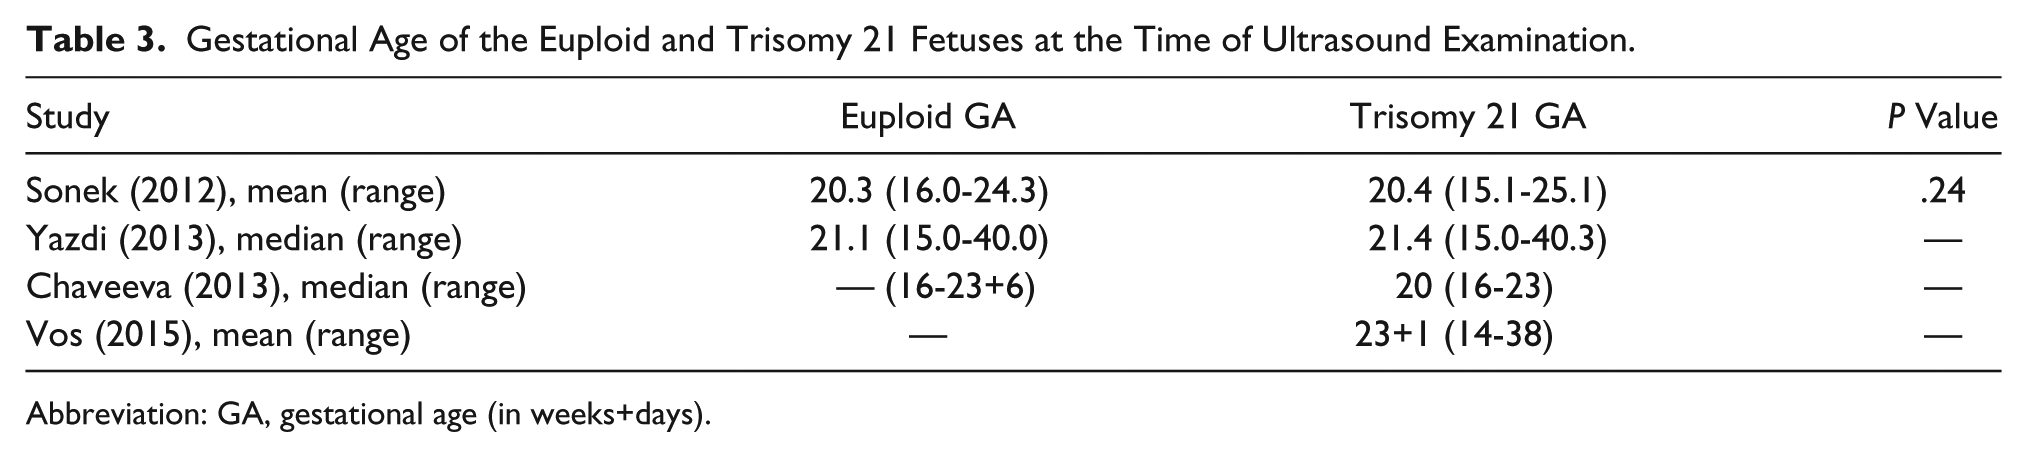
Abbreviation: GA, gestational age (in weeks+days).
Maternal Age of the Euploid and Trisomy 21 Fetuses. a
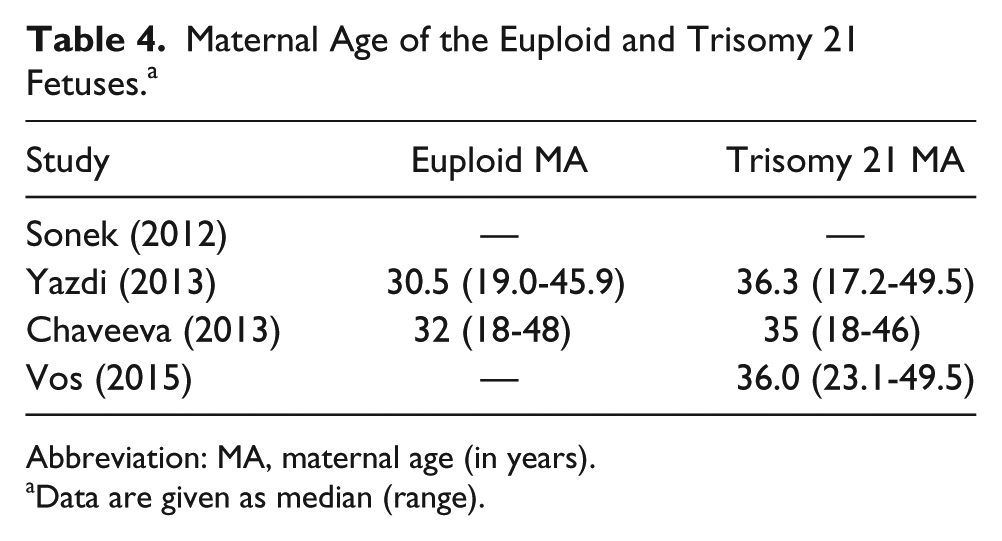
Abbreviation: MA, maternal age (in years).
Data are given as median (range).
Results of Mini Meta-Analysis
The overall sample size in our mini meta-analysis was 293 trisomy 21 and 609 euploid fetuses. Figures 7 and 8 show the mean PFSR and 95% CI in the included studies, as well as the weighted pooled measurements in the trisomy 21 and euploid fetuses, respectively. The weighted pooled mean PFSR using random effects modeling was 0.322 (95% CI, 0.256-0.388) in trisomy 21 and 1.205 (95% CI, 0.997-1.413) in euploid fetuses (Table 5). The PFSR was found to be significantly lower in trisomy 21 fetuses compared to the euploid fetuses (P < .0001).
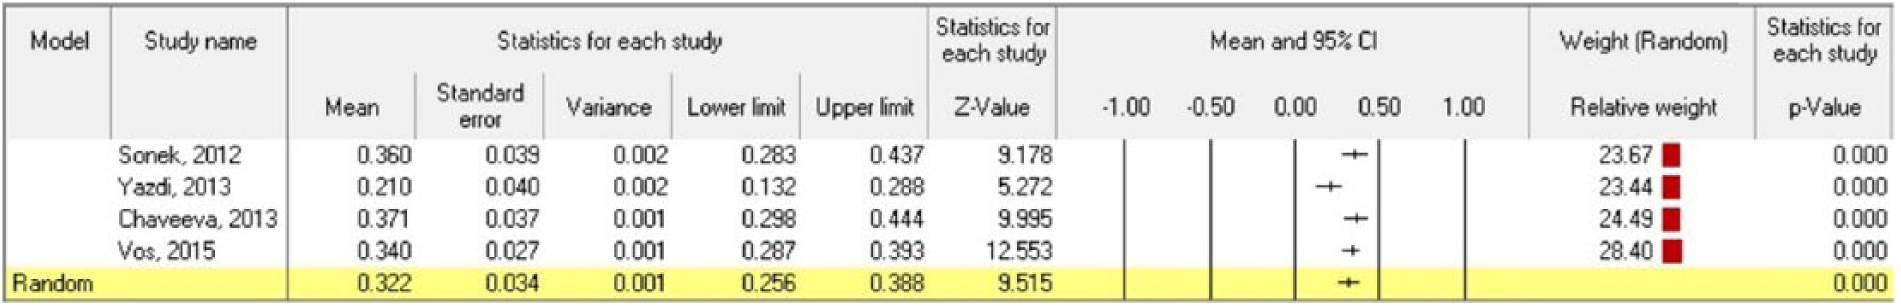
Mean prefrontal space ratio and 95% confidence interval (CI) in trisomy 21 fetuses. The pooled weighted values are calculated at the last line using random effects modeling.
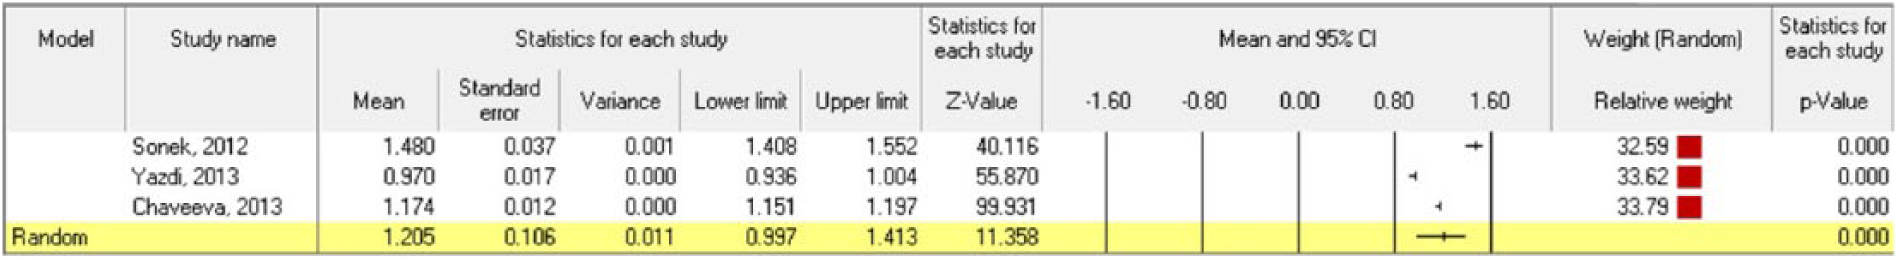
Mean prefrontal space ratio and 95% confidence interval (CI) in euploid fetuses. The pooled weighted values are calculated at the last line using random effects modeling.
Mean Prefrontal Space Ratio in Euploid and Trisomy 21 Fetuses and the Pooled Measurements.
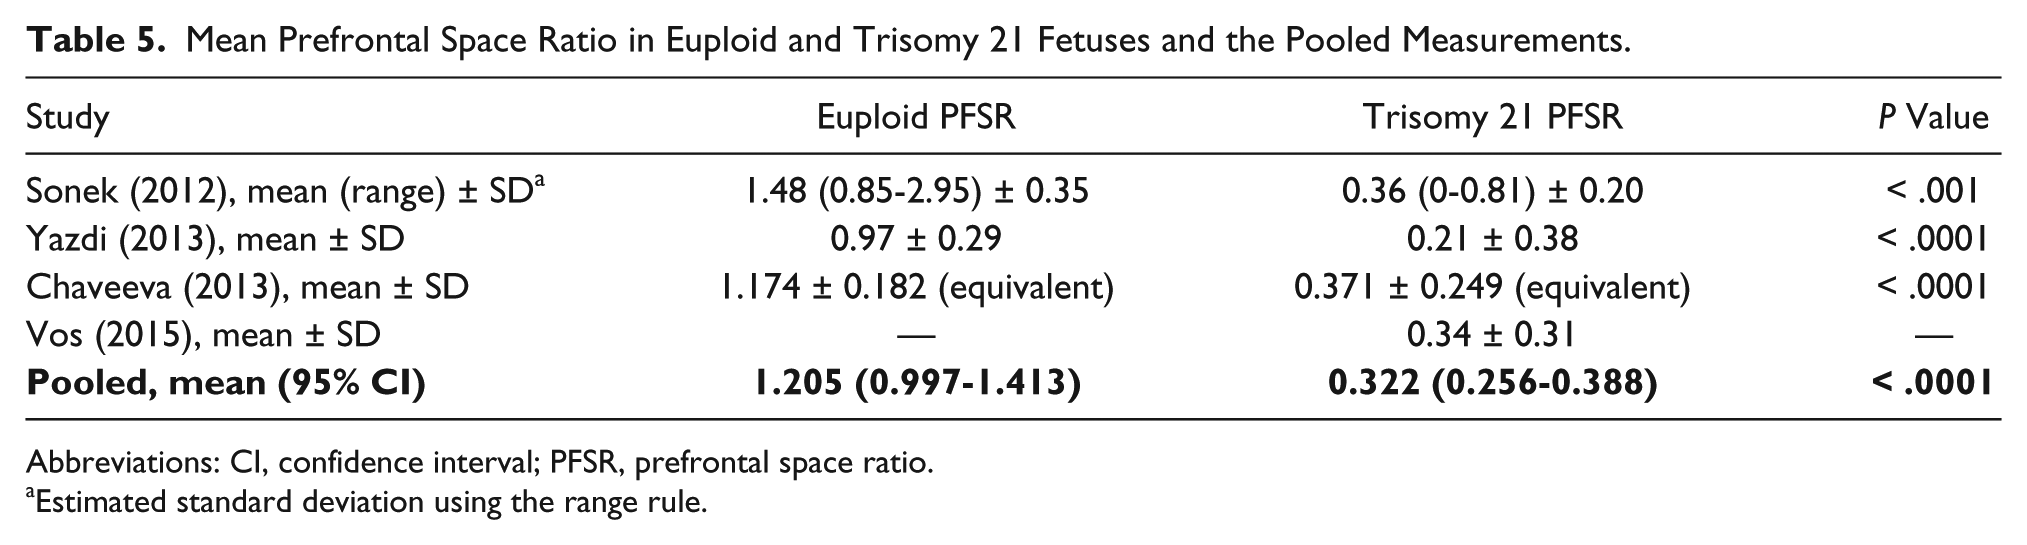
Abbreviations: CI, confidence interval; PFSR, prefrontal space ratio.
Estimated standard deviation using the range rule.
The weighted pooled DR was 87.2% (95% CI, 81.3-93.1) at a FPR of 5%. The pooled positive likelihood ratio measured 17.2 (95% CI, 10.8-23), and the pooled negative likelihood ratio was 0.146 (95% CI, 0.124-0.193) (Table 6).
Test Characteristics of the Prefrontal Space Ratio in the Second-Trimester Ultrasound Screening for Trisomy 21 and the Pooled Measurements. a
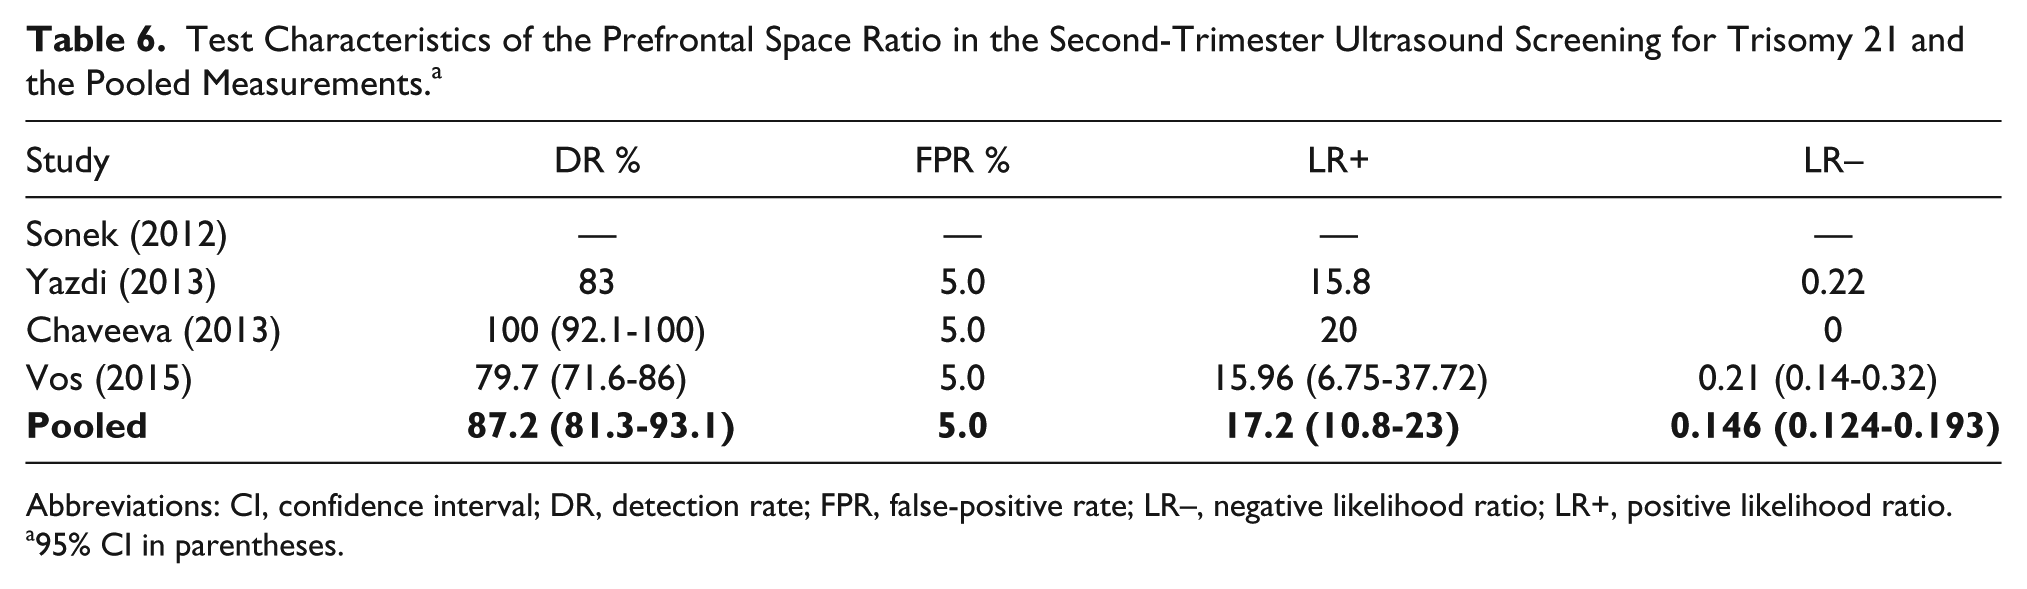
Abbreviations: CI, confidence interval; DR, detection rate; FPR, false-positive rate; LR–, negative likelihood ratio; LR+, positive likelihood ratio.
95% CI in parentheses.
Discussion
Summary of the Included Studies
Sonek et al. 10 introduced PFSR as a soft marker for second-trimester sonographic screening in 2012. They retrospectively examined 26 trisomy 21 and 90 euploid fetuses between 15 and 25 weeks of gestation. The PFSR in trisomy 21 fetuses (mean = 0.36; range = 0-0.81) was significantly lower compared to euploid fetuses (mean = 1.48; range = 0.85-2.95) (P < .001). There was no significant association between the PFSR and gestational age in either trisomy 21 (rs = 0.25; 95% CI, –0.15 to 0.58) or euploid fetuses (rs = 0.06; 95% CI, –0.15 to 0.27). In addition, the PFSR was not dependent on the status of the other soft markers. For example, the mean PFSR in trisomy 21 fetuses with no additional soft marker and trisomy 21 fetuses with absent/hypoplastic NB were 0.26 and 0.3, respectively (P = .69). The PFSR was normally distributed in trisomy 21 fetuses (P > .10), but it was skewed positively in the euploid group (P = .002).
Yazdi et al. 11 conducted a similar retrospective study, published in March 2013, on 91 trisomy 21 and 279 euploid pregnancies between 15 and 40 weeks of gestation. The mean ± SD PFSR was 0.2 ± 0.38 and 0.97 ± 0.29 in the trisomy 21 and euploid groups, respectively (P < .0001). With 3% and 5% FPRs, the DRs were 77% and 83%, respectively. Similar to the Sonek et al. 10 study, the PFSR was independent of maternal age (P = .331) and gestational age (P = .672) in both groups. In the Yazdi et al. 11 study, the PFSR was normally distributed in both trisomy 21 and euploid groups.
Chaveeva et al. 9 published another retrospective study in May 2013. They included 45 trisomy 21 and 240 euploid fetuses at 16 to 24 weeks of gestation. The equivalent mean ± SD PFSR was 0.371 ± 0.249 and 1.174 ± 0.182 in the trisomy 21 and euploid fetuses, respectively (P < .0001). The DR was 100% at a FPR of 5%. There was no significant association between PFSR and gestational age in either trisomy 21 (rs = 0.285, P = .058) or euploid (rs = −0.033, P = .612) fetuses. In addition, the PFSR was not dependent on the status of the other soft markers. The PFSR was normally distributed in both trisomy 21 and euploid groups.
Vos et al. 12 published an article in February 2015 evaluating multiple facial parameters in the second and third trimesters in 159 fetuses with trisomy 21 syndrome at 14 to 38 weeks of gestation. The PFSR was measured in 131 of them, and the mean ± SD value was 0.34 ± 0.31. The DR was 79.9% at a FPR of 5%. The PFSR was independent of gestational age and other soft markers. The method of PFSR measurement was similar to the Sonek et al. and Yazdi et al. studies. Vos and colleagues did not have any control group. However, PFSR values had a normal distribution in their study.
Interpretation
Our results are very similar to that of the previously conducted studies included in the meta-analysis. However, we determined the mean PFSR in trisomy 21 and euploid fetuses as well as the test characteristics in a larger sample size using random effects modeling. Our findings suggest that the PFSR could be significantly less in trisomy 21 fetuses compared to euploid fetuses (mean = 0.322 vs 1.205, P < .0001). This facial marker may be considered as an effective soft marker, which can be measured in the second-trimester sonographic screening considering its promising DR (DR = 87.2%, FPR = 5%) and likelihood ratio (LR+ = 17.2, LR– = 0.146), as well as its independence of the gestational age and other soft markers. Moreover, PFSR combines two previously described characteristics of the trisomy 21 facial profile (i.e., small maxillary bone and increased prenasal skin thickness), and hence, both mentioned facial markers are evaluated in a shorter time period by measuring the PFSR.
The PFSR measurement may be part of the routine second-trimester sonographic screening, particularly when other soft markers are present, or the patient baseline risk is high for aneuploidies. In addition, if prenasal skin seems to be thick or the maxilla seems to be hypoplastic visually, the PFSR measurement is helpful to quantitatively examine these structures and document the observation.
Second-trimester sonographic screening may modify the patient baseline risk for aneuploidy, when the pregnancy is high risk based on the maternal age, first-trimester screening results, and second-trimester maternal serum biochemical markers. It has been stated that if no soft markers are detected in the second-trimester sonogram, the risk of aneuploidy is reduced by a factor of 7.7. 5 This risk reduction is achieved by multiplying the negative likelihood ratios attributed to all of the absent soft markers by the patient baseline risk. In addition, if one of the soft markers is present during second-trimester screening, the sonographer should look for all other markers, so the pregnancy risk for aneuploidy may be calculated by multiplying the positive likelihood ratios of present markers and the negative likelihood ratios of absent markers by the baseline risk.
Limitations of This Meta-Analysis
A study conducted by Suskin et al. 16 suggested that there may be diversity in the normal and abnormal PFSRs between different races. In their analysis, the mean ± SD PFSR was 1.01 ± 0.27 in Caucasian euploids, whereas it was 1.37 ± 0.44 in the black euploid fetuses (P < .0001). Therefore, the difference between races should be taken into account when the PFSR is evaluated—the same as with other soft markers. Considering this fact, the mean values, reference range, and likelihood ratio for the PFSR should be further evaluated in prospective studies with large sample sizes for each ethnicity (because the included studies in this meta-analysis were performed mostly on Caucasian fetuses).
Conclusion
The PFSR seems to be significantly smaller in fetuses with trisomy 21 compared to euploid fetuses, which is in part due to midfacial hypoplasia and increased prenasal skin thickness in trisomy 21. This ratio is approximately constant throughout the pregnancy (unlike many other soft markers) and has a high reproducibility. In conclusion, the NB length and PFSR are the preferred markers to be investigated in the fetal facial profile, because both of these markers may be measured on the same midsagittal section of the fetal face easily, and together largely affect the final risk assessment results considering their likelihood ratios. Further studies should be conducted, which will allow for a stronger future meta-analysis in order to determine test characteristics of the PFSR measurement more precisely.
Footnotes
Declaration of Conflicting Interests
The authors declared no potential conflicts of interest with respect to the research, authorship, and/or publication of this article.
Funding
The authors received no financial support for the research, authorship, and/or publication of this article.