
Abstract
Empirical data is fundamental for deriving accurate and high-resolution estimates of the post-earthquake building recovery process. To this end, a unique and extensive dataset comprising damage and recovery data from residential buildings affected by the 2010–2011 Canterbury Earthquake Sequence (CES) has been systematically compiled to introduce a novel hybrid data-driven approach for modeling post-earthquake recovery at both individual and community levels. At the individual building level, key temporal variables are modeled using their respective probability distribution functions (PDFs), which are iteratively refined through Bayesian inference with the incorporation of collected empirical data. Specifically, Markov Chain Monte Carlo (MCMC) and Empirical Bayes (EB) methods are employed to derive updated posterior distributions for these variables, offering a contextually grounded understanding of recovery dynamics within the New Zealand setting. At the community level, a suite of machine learning models, including Random Forest (RF), Gradient Boosting Machine (GBM), Decision Tree (DT), and Extreme Gradient Boosting (XGBoost), is developed to rapidly predict the recovery trajectories across residential building portfolios. The marginal posterior distributions derived from the MCMC and EB methods are directly applicable to future recovery modeling efforts, offering valuable insights into the temporal duration and inherent variability of recovery activities tailored to a region’s contextually specific socio-economic profiles and recovery practices. The findings further underscore the superior performance of the RF model in predicting community-level recovery trajectories, whereas the XGBoost model demonstrates excellence in estimating overall recovery timeframes. Consequently, an integrated approach utilizing both RF and XGBoost models is recommended to provide a comprehensive understanding of community-level recovery dynamics and overall recovery time in the aftermath of earthquakes.
Keywords
Introduction
The Canterbury earthquake sequence (CES) struck Christchurch, New Zealand, in 2010 and 2011, with profound consequences for the community. The CES resulted in the tragic loss of 185 lives, the demolition of approximately 80% of structures in Christchurch (Thusoo et al., 2019), and substantial financial losses estimated at NZD 40 billion (appropriately 20% of NZ’s GDP) (ICNZ, 2023). The second major aftershock that occurred on 22 February 2011 led to the closure of the central business district (CBD) for over 2 years (Marquis et al., 2017), with recovery efforts continuing for more than a decade thereafter (Li et al., 2023b).
The prolonged recovery process in Christchurch has taken a toll on society. The imposition of the cordon not only directly impacted building repairs and reconstruction but also precipitated the complete displacement of businesses across a large portion of the Christchurch CBD (Hulsey et al., 2022). Chang et al. (2014) reported that approximately 6,000 businesses were displaced, disrupting 50,000 central city jobs. Even 13 years post-event, the CBD continued to be marked by empty lots and makeshift car parks (RNZ, 2024b). Despite initiatives to revitalize the area by attracting investments and encouraging the return of residents, such as public “anchor projects,” the city still grapples with the enduring impact of the earthquakes.
Post-disaster recovery has emerged as a critical area of research, particularly given the imperative for rapid and efficient restoration following seismic events. Initial efforts predominantly focused on the recovery of individual structures, advocating for seismic designs that minimize damage and facilitate the swift restoration of functionality. Foundational frameworks, such as the Federal Emergency Management Agency (FEMA) P-58 (FEMA, 2018a) and Resilience-based Earthquake Design Initiative (REDi) (Almufti and Willford, 2013), have provided structured procedures for evaluating post-disaster recovery outcomes at the building level (Li et al., 2023a). These frameworks have laid the groundwork for more sophisticated assessments of various functionality states, such as stability and shelter-in-place (Molina Hutt et al., 2022), as well as the incorporation of more realistic repair and resource scheduling strategies (Terzic et al., 2021b). The ATC-138 methodology (ATC, 2021) has further refined recovery modeling by addressing the unique functional needs of individual tenants within buildings. Collectively, these methodologies establish critical benchmarks for researchers and engineers to accurately quantify building recovery within the broader context of loss modeling.
In response to the growing need for enhanced community resilience (Sattar et al., 2021), there has been a notable shift from modeling individual building recovery to addressing community-level recovery. Over the past decade, various methods have emerged to tackle this complex challenge. For instance, Burton et al. (2016) investigated the post-earthquake recovery by developing building recovery functions for shelter-in-place housing and simulating community-level recovery through the aggregation of individual building recovery curves. Lin and Wang (2017) introduced a simulation-based Building Portfolio Recovery Model (BPRM) that estimates recovery timelines and trajectories for entire building portfolios using a discrete-state, continuous-time Markov chain framework. Despite these advancements, accurately modeling community-level recovery continues to be impeded by numerous external factors, including resource availability (Blagojević and Stojadinović, 2022; Li et al., 2023b, 2025), accessibility to buildings (Hulsey et al., 2022), household decision-making dynamics (Burton et al., 2019a; Marquis et al., 2017), and the interdependencies among adjacent structures (Mieler et al., 2018). Failure to adequately incorporate these factors can substantially compromise the robustness and predictive fidelity of existing recovery models.
A further impediment to progress in this field is the persistent paucity of empirical data required to accurately define key input parameters and validate existing frameworks (Cook et al., 2022; Li et al., 2023a; Mieler et al., 2018). Although current methods provide a theoretical and methodological foundation for building recovery modeling (Cook et al., 2022; Molina Hutt et al., 2022; Terzic et al., 2021b), their development has primarily been confined to the US building environment. Extending these frameworks to other regions necessitates rigorous validation, a process that is often both time-intensive and resource-demanding (Bhatta and Dang, 2024). In addition, the modular and highly granular nature of these frameworks, which rely on detailed data for structural and non-structural components, presents considerable challenges for their practical implementation in the immediate aftermath of a disaster. These challenges are further exacerbated by the intrinsic uncertainties inherent in post-disaster recovery processes (Li et al., 2023a), thereby necessitating the deployment of advanced techniques to enhance both the reliability and accuracy of recovery analyses.
To address these challenges, an extensive and unique dataset comprising empirical damage and recovery data from residential buildings affected by the 2010–2011 CES has been systematically collected. This dataset underpins a novel hybrid data-driven approach to modeling post-earthquake building recovery at individual and community levels. In this study, the building recovery at an individual level is defined as the repair or rebuild of individual buildings, whereas the building recovery at the community level refers to the recovery of multiple buildings at a community scale (Burton et al., 2016), such as the recovery of buildings in the Christchurch CBD. In recognition of the uncertainties associated with estimating critical duration-based variables (e.g. inspection time and repair time) that underpin the building recovery process at the individual level, a probabilistic Bayesian estimation framework is employed to iteratively update probability distributions for these temporal variables. Specifically, the Markov Chain Monte Carlo (MCMC) and Empirical Bayes (EB) methods are utilized to derive the posterior marginal distributions of these variables. The resulting distributions offer robust insights into the potential durations and variability of recovery activities tailored to the New Zealand context, and are directly applicable to regional recovery modeling efforts.
At the community level, a suite of machine learning (ML) algorithms, including Random Forest (RF), Gradient Boosting Machine (GBM), Decision Tree (DT), and Extreme Gradient Boosting (XGBoost), has been developed to streamline sequential computational procedures. By directly leveraging building-level data, these algorithms enable the rapid prediction of recovery times for individual buildings and the generation of recovery trajectories for affected buildings. Notably, the model’s input-output framework has been configured to align with the New Zealand context, thereby ensuring its relevance and applicability to local post-earthquake recovery scenarios. This hybrid methodology harnesses the complementary strengths of both probabilistic and machine learning techniques, resulting in a framework that fully leverages empirical data to enhance the fidelity of building recovery modeling. In doing so, it equips policymakers with critical, data-driven insights into recovery dynamics at both individual and community scales, thereby facilitating more informed and timely decision-making in the aftermath of major seismic events.
Modeling the recovery of buildings: state of the art
Modeling post-disaster building recovery is typically represented through recovery trajectories that delineate the temporal progression of building restoration over time (Burton et al., 2016; Cimellaro et al., 2010). This section critically examines contemporary methodologies for quantifying these trajectories by estimating critical temporal variables that underpin the post-disaster building recovery process.
Performance-based estimation
A foundational method in this field is Performance-Based Earthquake Engineering (PBEE), which integrates probabilistic hazard analysis, structural response evaluation, and component-based damage assessment to predict building performance under seismic loading (Moehle and Deierlein, 2004; Porter, 2003). A prominent application of PBEE is embodied in the FEMA P-58 methodology, which quantifies building performance using metrics such as repair costs, repair time, casualties, and the issuance of unsafe placards (FEMA, 2018a). FEMA P-58 provides the estimates of repair time as the cumulative duration required to restore damaged components either sequentially or in parallel. However, its heavy reliance on predefined fragility functions constrains adaptability across diverse construction practices, as recalibrating these functions for different seismic contexts is both data-intensive and time-consuming (Xiong et al., 2018; Yuan et al., 2022).
The REDi methodology extends the PBEE/FEMA P-58 framework by explicitly addressing reoccupancy and functional recovery states while incorporating delays due to impeding factors and utility disruption (Almufti and Willford, 2013). It enhances recovery estimation by introducing repair classes and detailed repair sequencing at the floor level. Subsequent refinements by Molina Hutt et al. (2022) have further advanced both FEMA P-58 and REDi by modeling temporal building recovery trajectories that target specific recovery states, such as stability and shelter-in-place, to capture distinct milestones in the recovery process. Nonetheless, REDi and similar methods remain limited by regional specificity and an inherent reliance on expert judgment to define key temporal parameters.
Building on the recognition that building recovery is influenced by the interdependencies within infrastructure systems, socio-economic conditions, and resource constraints (Li et al., 2025; Masoomi and Van de Lindt, 2019), several models have expanded the PBEE framework to incorporate a community perspective. Burton et al. (2016) proposed a probabilistic framework that aggregates individual building recovery trajectories into a comprehensive model for residential portfolios. This framework integrates critical temporal variables—such as lead time (including inspection, financial planning, and mobilization), repair time to restore occupiability, and repair time for full functionality—to delineate an overall recovery path. Although comprehensive, this method requires extensive data and is predicated on numerous assumptions. To incorporate household decision-making processes, Burton et al. (2019b) developed an integrated model that combines PBEE-based probabilistic building performance, household decision-making, and stochastic recovery trajectories at both the building and neighborhood levels. Central to this methodology is an empirical probabilistic utility-based (EPUB) model, derived from survey data collected from Los Angeles households, which captures behavioral aspects of recovery. However, its extension to other contexts necessitates additional region-specific surveys and adjustments.
PBEE/FEMA P-58 with fault tree analysis
Fault tree analysis (FTA) is a systematic method for identifying the root causes of system failures and has been progressively integrated into PBEE frameworks to correlate component-level damage with overall building functionality (Jacques et al., 2014; Mieler et al., 2016; Porter, 2012). The F-Rec framework proposed by Terzic et al. (2021a) combines FEMA P-58 damage assessments with FTA and the Critical Path Method (CPM) to estimate building recovery trajectories regarding building functionality, repair time, and mobilization time. In this approach, repair time is determined through the application of CPM for repair scheduling and realistic labor allocations that are based on the amount and severity of building damage, while also accounting for surges in construction demand and labor congestion. Meanwhile, mobilization time is estimated using insights from empirical studies and expert interviews. It is noteworthy that the F-Rec framework has only been validated for specific case studies (e.g. a 13-story and a 42-story building) (Terzic et al., 2021b; Terzic and Kolozvari, 2020) and relies on user-defined damage thresholds that may limit its scalability.
Similarly, Cook et al. (2022) introduced a framework for modeling building recovery across multiple performance states by integrating FTA with FEMA P-58 fragility and consequence models. Within this framework, repair time is estimated through an optimized scheduling process that incorporates temporary repairs and prioritizes the restoration of functionality. Mobilization time is addressed via a system-specific methodology that enables individual subsystems to initiate repairs independently, thereby mitigating delays. Although this approach effectively disaggregates building functionality into its fundamental components and allows for a more nuanced estimation of downtime, its implementation is highly contingent upon engineering judgments to assess critical factors, such as the severity and extent of damage that may impede building occupancy or functionality. Additional empirical data is required to further augment the robustness and generalizability of this framework.
Agent-based modeling
Agent-based modeling (ABM) has emerged as a powerful tool for encapsulating the intricacies of community recovery by simulating the interactions among individual agents (e.g. households and contractors) within a recovery process. Costa et al. (2021) developed an ABM framework for evaluating portfolio-level housing recovery, effectively capturing the effects of resource competition, infrastructure disruptions, and socio-economic factors on recovery dynamics. Specifically, their research investigated the impact of damage and disruptions to transportation and power networks, in conjunction with socio-economic factors and the potential scarcity of resources for inspection, financing, and repairs, with recovery time estimated as a combination of repair duration and the time required to secure necessary resources. The framework was applied to model the recovery of 114,832 residential buildings in Vancouver, Canada, demonstrating its transferability through the use of extensive public datasets and underscoring its applicability in real-world scenarios.
Similarly, Nasrazadani and Mahsuli (2020) advanced ABM by integrating risk models with Monte Carlo sampling. In their integrated approach, the risk model simulated both direct and indirect economic costs, as well as social losses resulting from hazards, while the ABM component captured recovery dynamics through the modeling of agent attributes and inter-agent interactions within decision-making environments. This integration enabled a comprehensive evaluation of recovery costs and timeframes at the community level. Notwithstanding these advancements, the practical utility of such ABM-based frameworks is constrained by their inherent reliance on semi-heuristic assumptions and the substantial challenges associated with accurately modeling community-level interactions. Furthermore, achieving robust model accuracy remains contingent upon rigorous calibration and the incorporation of extensive, large-scale behavioral datasets.
Discrete event simulation
Discrete event simulation (DES) offers a structured framework for modeling recovery processes by representing interactions between entities and resources as discrete events. Longman and Miles (2019) developed DESaster, a simulation program specifically designed to model post-disaster building recovery with a focus on housing. In DESaster, the interactions among entities, such as single-family homeowners, and various resources are modeled as discrete events, with the duration of each event serving as a critical parameter. Key temporal variables, including the mobilization of inspectors, the processing of insurance claims, the evaluation of grant and loan applications, the approval of building permits, and the reconstruction of single-family homes, are explicitly captured. While DESaster provides a systematic framework for simulating housing recovery, its adaptability to real-time disruptions is limited, and it requires meticulous event scheduling to adequately account for uncertainties. Moreover, its overall effectiveness remains contingent upon input parameters that are often derived from assumptions based on expert judgment.
Empirical and judgment-based methods
Empirical and judgment-based methods have long benefited from the availability of historical data and experiences from global seismic events, enabling the direct estimation of key temporal variables underpinning building recovery. For example, HAZUS estimates building repair time through a combination of probabilistic damage assessment and empirically derived recovery functions, with predefined repair time values established from historical post-earthquake assessments, expert judgment, and empirical studies (FEMA, 2022). Similarly, the REDi framework utilizes expert consultations and post-disaster reconnaissance data to estimate delays resulting from impeding factors (Almufti and Willford, 2013). However, the regional specificity of these approaches, coupled with the uncertainties associated with the estimated temporal variables, indicates that these methods lack generalizability and have not adequately captured the full complexity of building recovery dynamics.
The proliferation of extensive empirical datasets has further enabled the development of data-driven techniques to estimate critical temporal variables. For instance, Alisjahbana and Kiremidjian (2021) modeled housing recovery following the 2018 Lombok earthquake by characterizing building delay and recovery times with probability density functions (PDFs), which were subsequently validated via the Kolmogorov–Smirnov (KS) test. These empirically derived PDFs were then integrated into a queuing model designed to capture the temporal impacts of resource constraints on recovery processes. Furthermore, Kang et al. (2018) leveraged empirical data from 456 buildings affected by the 2014 South Napa earthquake—including information on damage, permitting, and repair durations—to develop a generalized stochastic process model that predicts the recovery trajectories of building inventories. Complementing this work, Omoya et al. (2022) employed Bayesian parameter estimation techniques to refine the PDFs for permitting and repair times, thereby capturing the uncertainties inherent in these critical recovery phases and updating their probabilistic models accordingly.
Despite these notable advancements in post-disaster building recovery modeling, several methodological limitations persist that impede broader applicability and robustness. Many models rely on heuristic assumptions and expert judgment to determine key input parameters, a reliance that necessitates extensive validation and consequently restricts both the generalizability and precision of recovery estimates. Moreover, conventional methodologies often fail to adequately address the uncertainties inherent in duration-based variables, thereby compromising the reliability of estimates across heterogeneous post-disaster contexts. The stringent requirement for highly granular data further curtails the practicality of these techniques for timely post-disaster decision-making. In addition, the prevalence of models derived from geographically confined datasets, primarily from the United States, poses significant challenges regarding their applicability and transferability to regions with differing regulatory frameworks, construction practices, and socio-economic conditions.
This study proposes a hybrid data-driven approach that integrates Bayesian inference with advanced ML models. Utilizing a unique dataset comprising empirical damage and recovery data from New Zealand’s residential buildings affected by the 2010-2011 CES, the proposed methodology minimizes reliance on subjective assumptions by directly harnessing empirical data to generate realistic and scalable recovery estimates. This approach is designed to enhance the fidelity and efficacy of building recovery modeling at both the individual and community levels while accommodating variations in building occupancies and seismic environments. In doing so, the study offers a contextually nuanced characterization of recovery dynamics specific to the New Zealand environment, thereby contributing to the global corpus of post-disaster recovery research and advancing the modeling of recovery processes across diverse seismic settings.
The study region and the dataset
Study region
The study region selected for this research is Christchurch CBD, delineated by Bealey Avenue, Fitzgerald Avenue, Moorhouse Avenue, and Deans Avenue, as shown in Figure 1. This area was chosen owing to its extended building recovery timeframes and the resultant pronounced cascading socio-economic consequences, as discussed earlier in this article. Notably, the repair of the iconic Christchurch Cathedral has been halted as of the preparation of this article, primarily due to a complex funding decision mechanism (RNZ, 2024a).
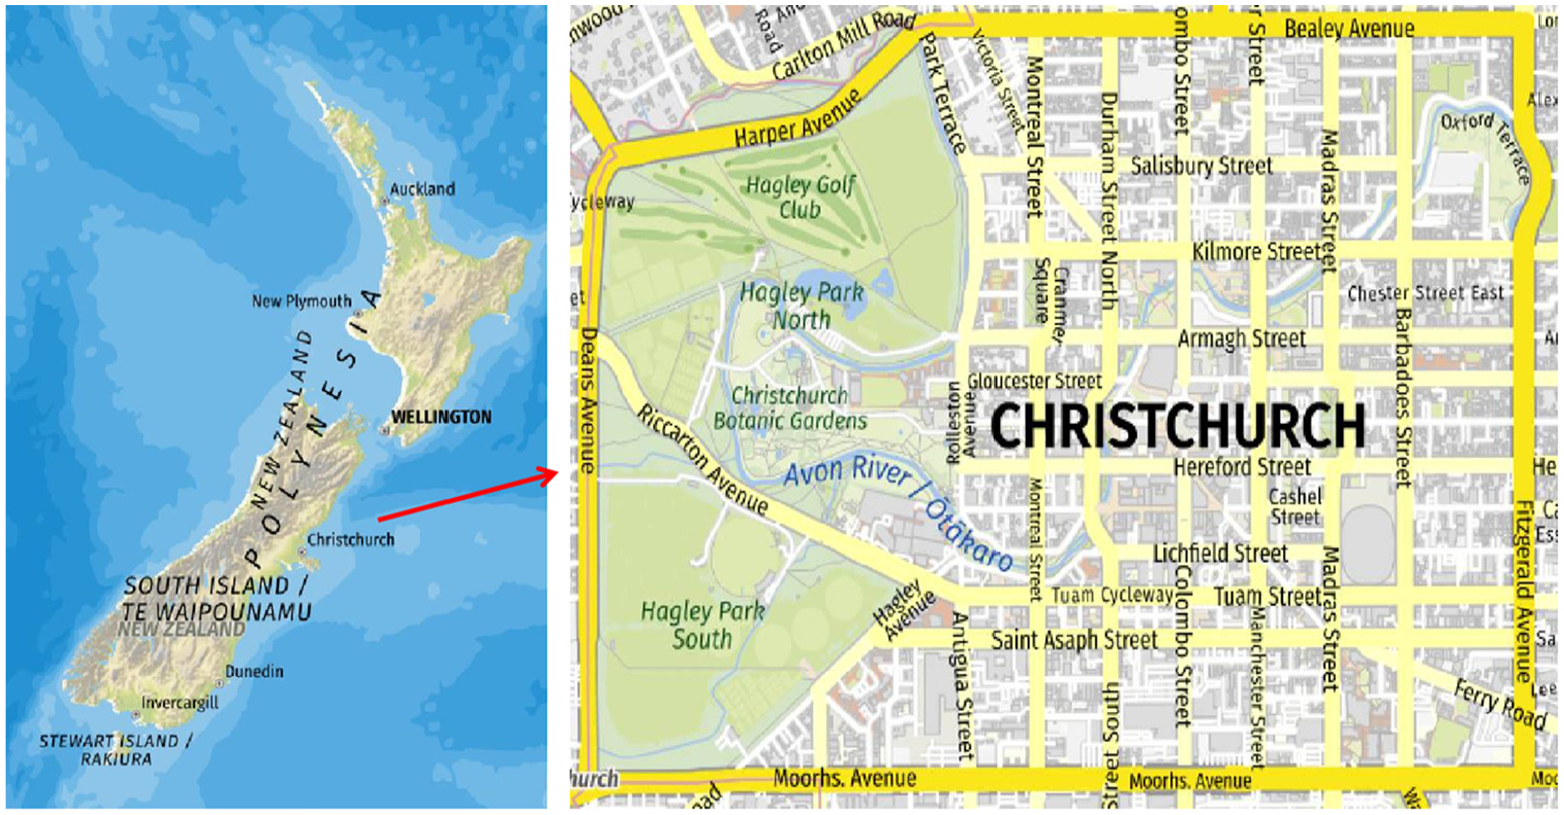
The geographic location of Christchurch CBD.
Empirical data
Approval for data collection was obtained from the University of Auckland Human Participants Ethics Committee (Reference Number 25474). The empirical damage and recovery data of a total of 1,987 multi-story residential buildings in Christchurch CBD were provided by the Natural Hazards Commission—Toka Tū Ake (NHC), formerly the Earthquake Commission (EQC). The NHC, a Crown Entity established under the Earthquake Commission Act 1993 (EQC Act), is responsible for overseeing the insurance payout process for insured properties affected by disasters in New Zealand. Notably, buildings that did not undergo recovery or reconstruction (e.g. properties that remained abandoned, were permanently red-zoned, or lacked insurance coverage) are not included in the dataset.
The basic characteristics of the 1,987 residential buildings are outlined in Figure 2. The majority of these buildings (1,635 buildings, 82.28%) were 2-story structures, while 335 buildings (16.86%) were 3-story buildings. Of the total, 55.46% required substantial repairs, with 88.74% remaining within the NHC insurance coverage limit. The primary foundation types were crawlspace (650 buildings) and slab (607 buildings). Notably, 24.87% of the buildings were constructed prior to 1960, a period during which seismic design considerations were not standard practice. In contrast, 69.35% of the buildings were constructed after the 1980s, incorporating advanced seismic design features.
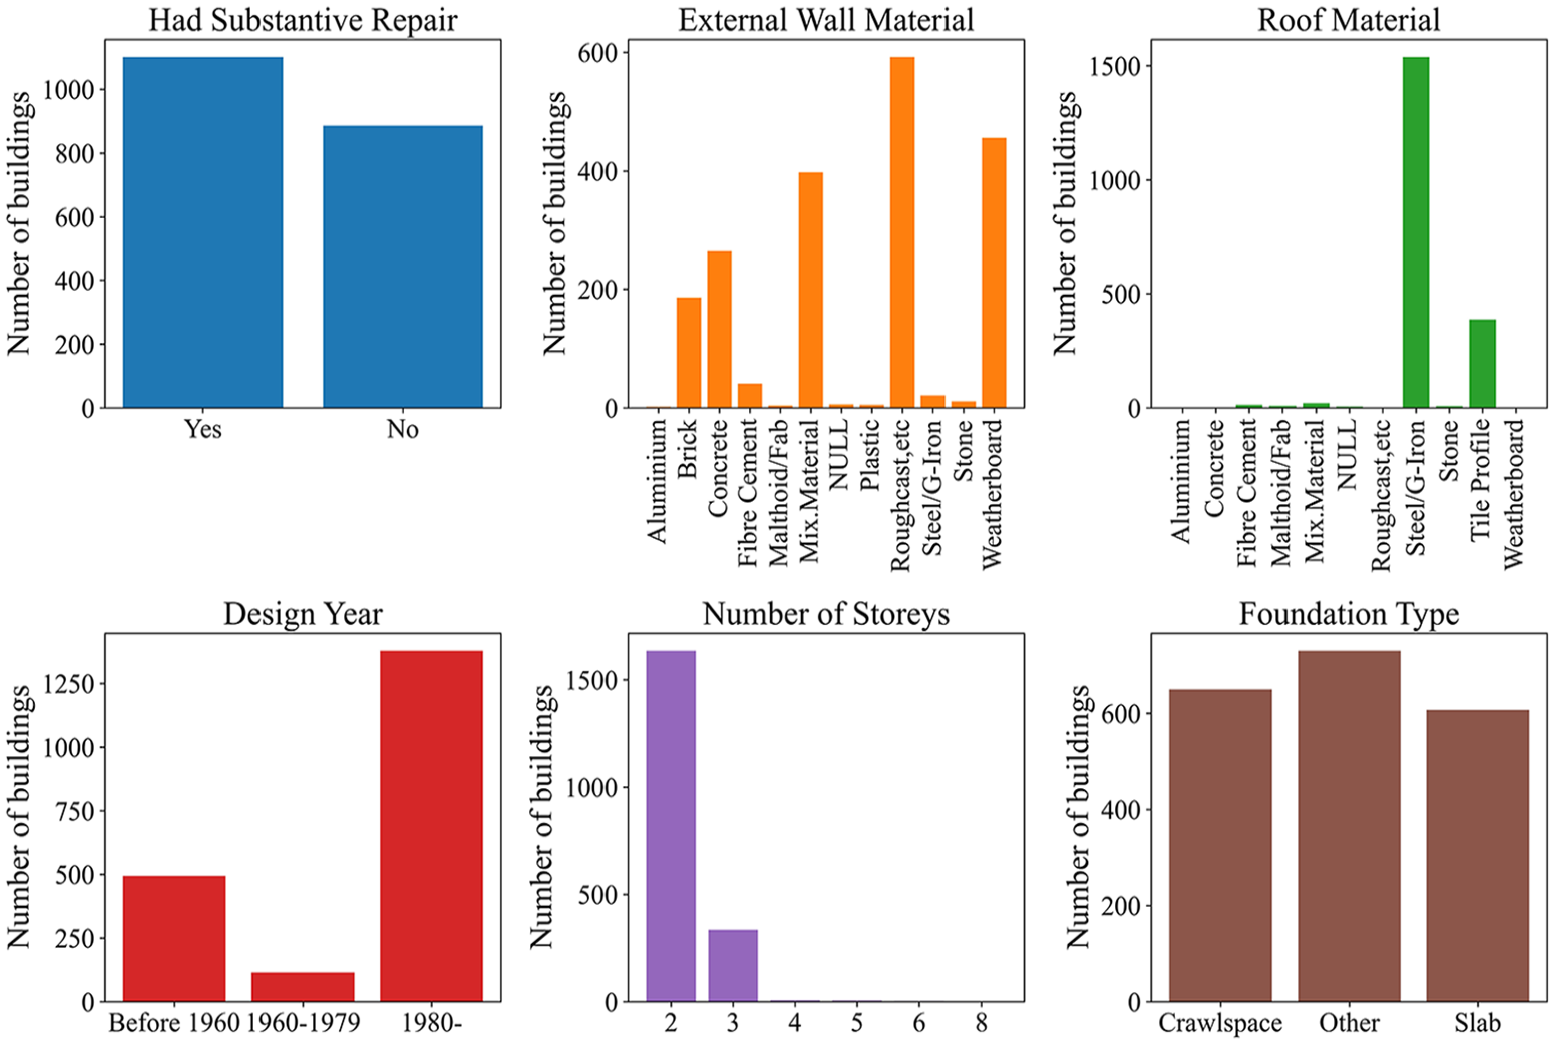
Basic characteristics of the collected residential building dataset.
The raw data collected includes critical dates associated with various restoration activities, which are integral to the insurance claim settlement process. These data were processed to derive the duration data for key temporal variables underpinning the building recovery process. Informed by the NHC’s practices, Table 1 presents the definitions and calculation criteria for the five key temporal variables employed in this study.
Definition of key temporal variables used in this study
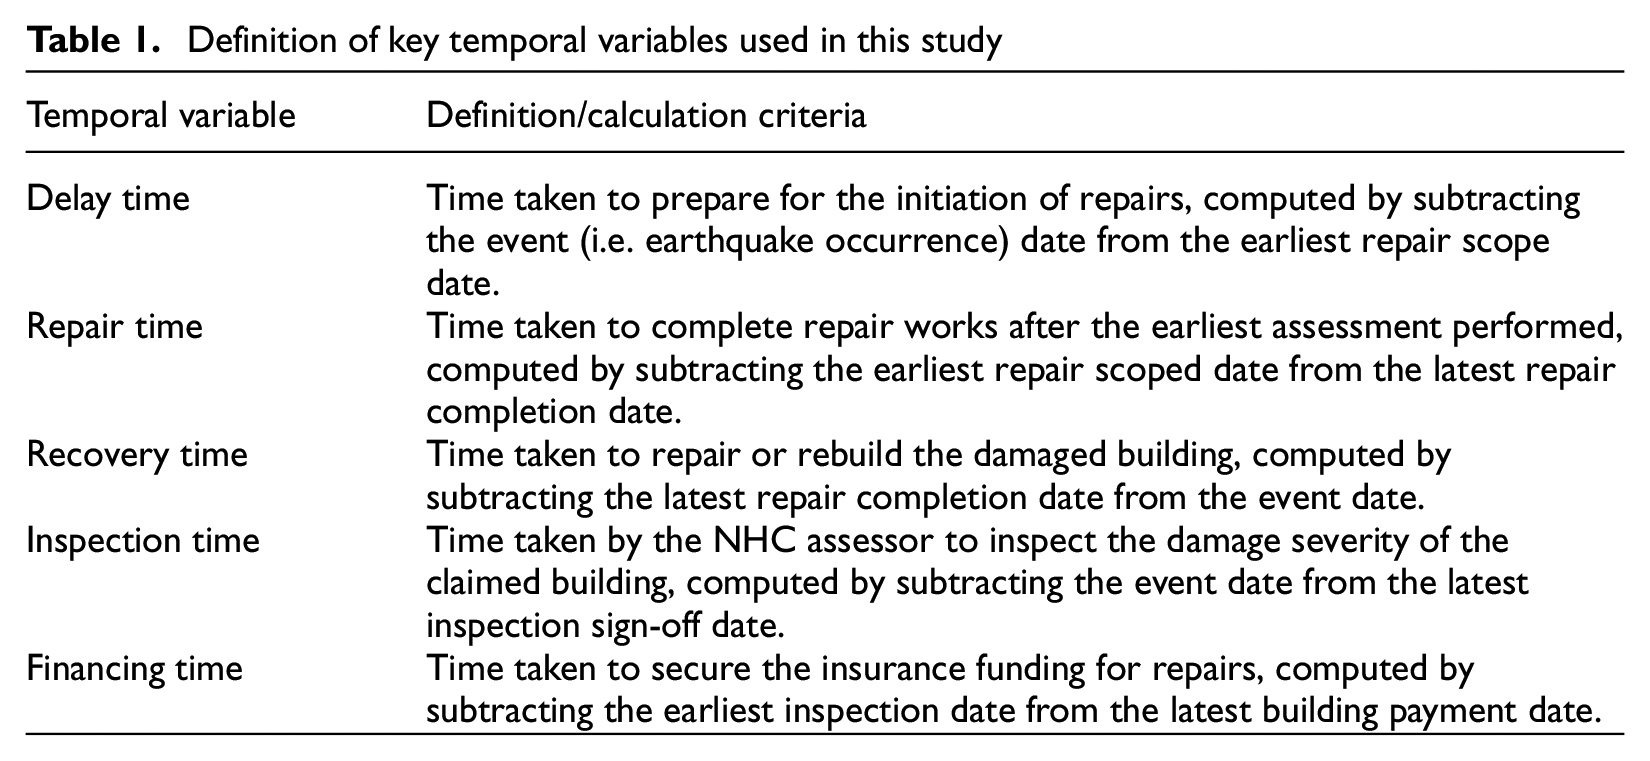
The temporal variables adopted in this study diverge from those traditionally employed in the REDi guidelines (see Table 1). This flexibility facilitates a more targeted and nuanced analysis of the temporal parameters pertinent to the research. Each temporal variable is modeled as an independent random variable, thereby capturing the substantial uncertainties inherent in the complex, nonlinear recovery sequences observed across diverse restoration activities following the CES. The dataset encapsulates the prolonged imposition of cordons within the Christchurch CBD, an effect explicitly reflected in the delay time, recovery time, inspection time, and financing time variables. Notably, the financing time variable encompasses instances where buildings undergo multiple rounds of repairs and insurance claim settlements, often necessitated by remedial work, aftershocks, and funding disputes. Owing to the granularity of the available data, additional temporal variables, such as permit acquisition and contract mobilization, were excluded from this analysis.
The data provided by the NHC included total paid value data (including Goods and Services Tax, GST) for each building but lacked the detailed damage descriptions that triggered the insurance payout. To apply the insurance data within a functional recovery model, the cost data were converted into estimated damage data. The NHC recommended using both the paid values and cap status (i.e. whether the sustained damage exceeded the insurance coverage limit) to represent the severity of building damage. These values are mapped to delineated damage states (green, yellow, and red tags) following ATC-20 and the rapid damage assessment procedures in New Zealand (EAG, 2012). This mapping is as follows: Green (under-cap, with paid values ranging from $ 0 to $100,000), Yellow (over-cap, with paid values ranging from $100,001 to $200,000), and Red (over-cap, with paid values exceeding $200,001).
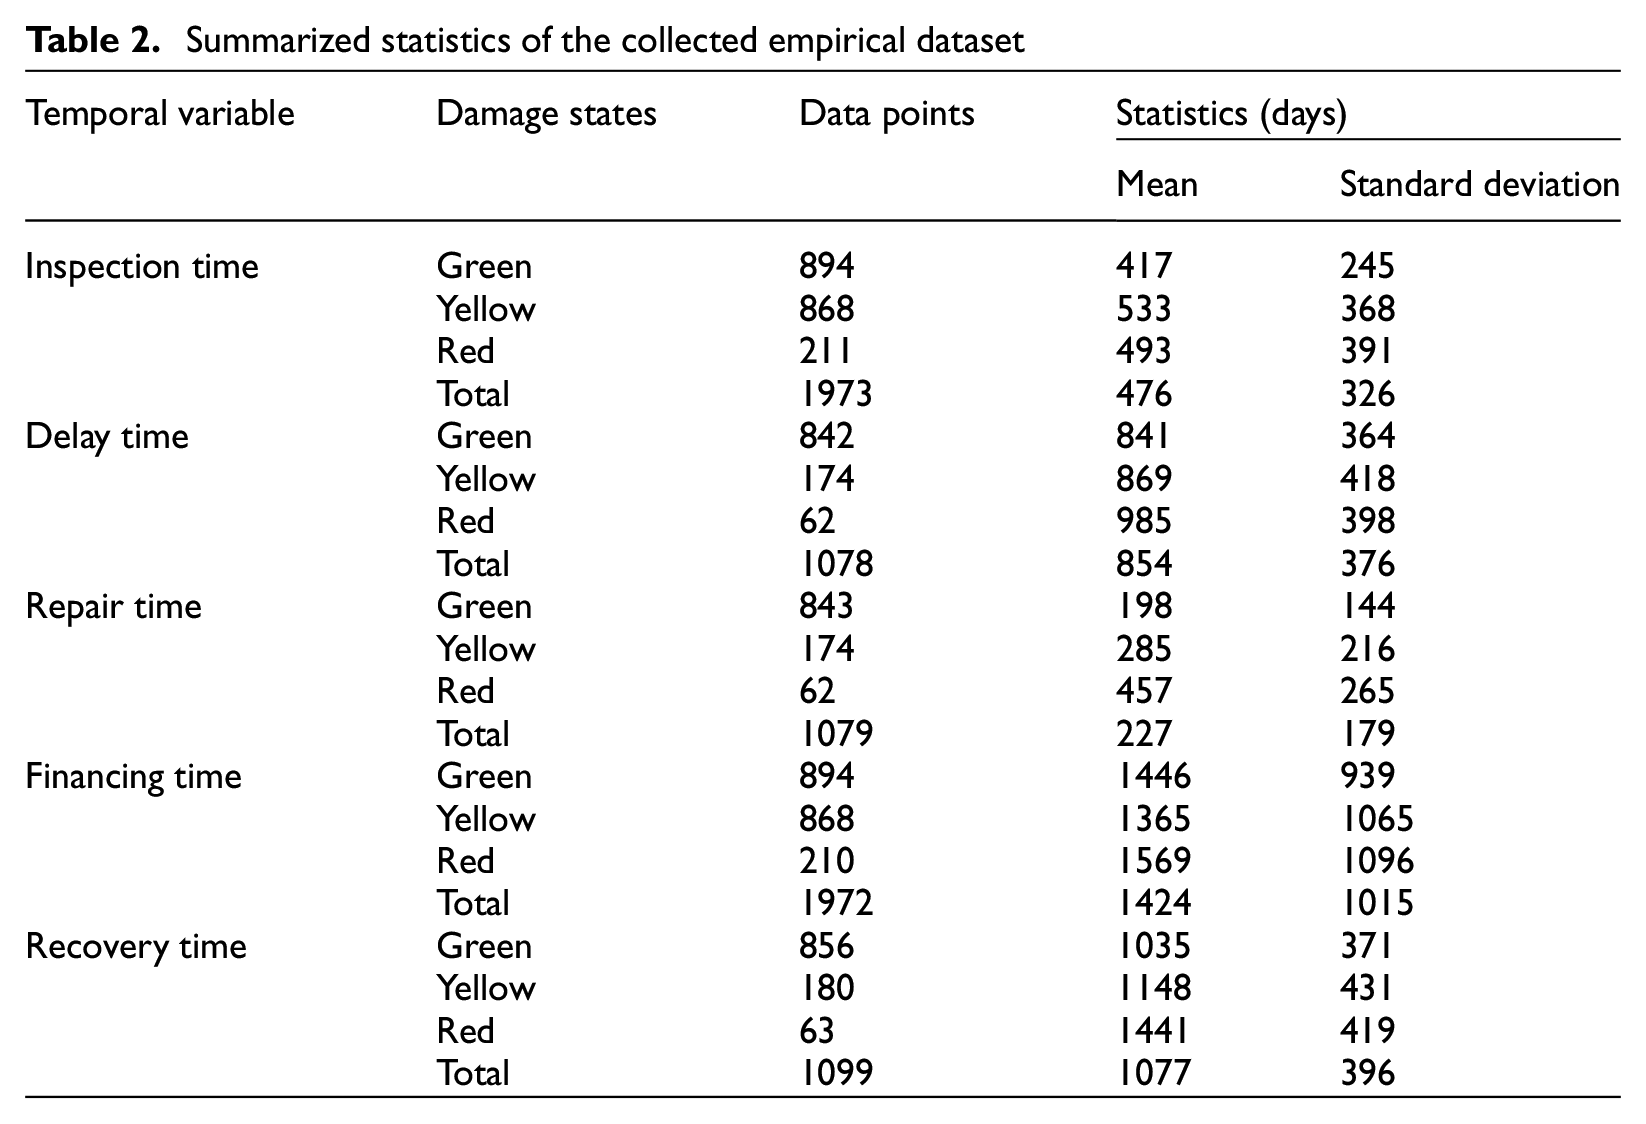
Once the damage states and duration data for each temporal variable were determined, the summarized statistics categorized by damage state are presented in Table 2. It should be noted that not all building samples contain entries for all five variables, resulting in a total number of data points for each variable that is lower than the 1,987 buildings collected. In addition, Figure 3 depicts the empirical distributions of these variables along with their respective kernel density estimates (KDE), thereby providing a comprehensive representation of the damage distribution within the dataset.
Summarized statistics of the collected empirical dataset
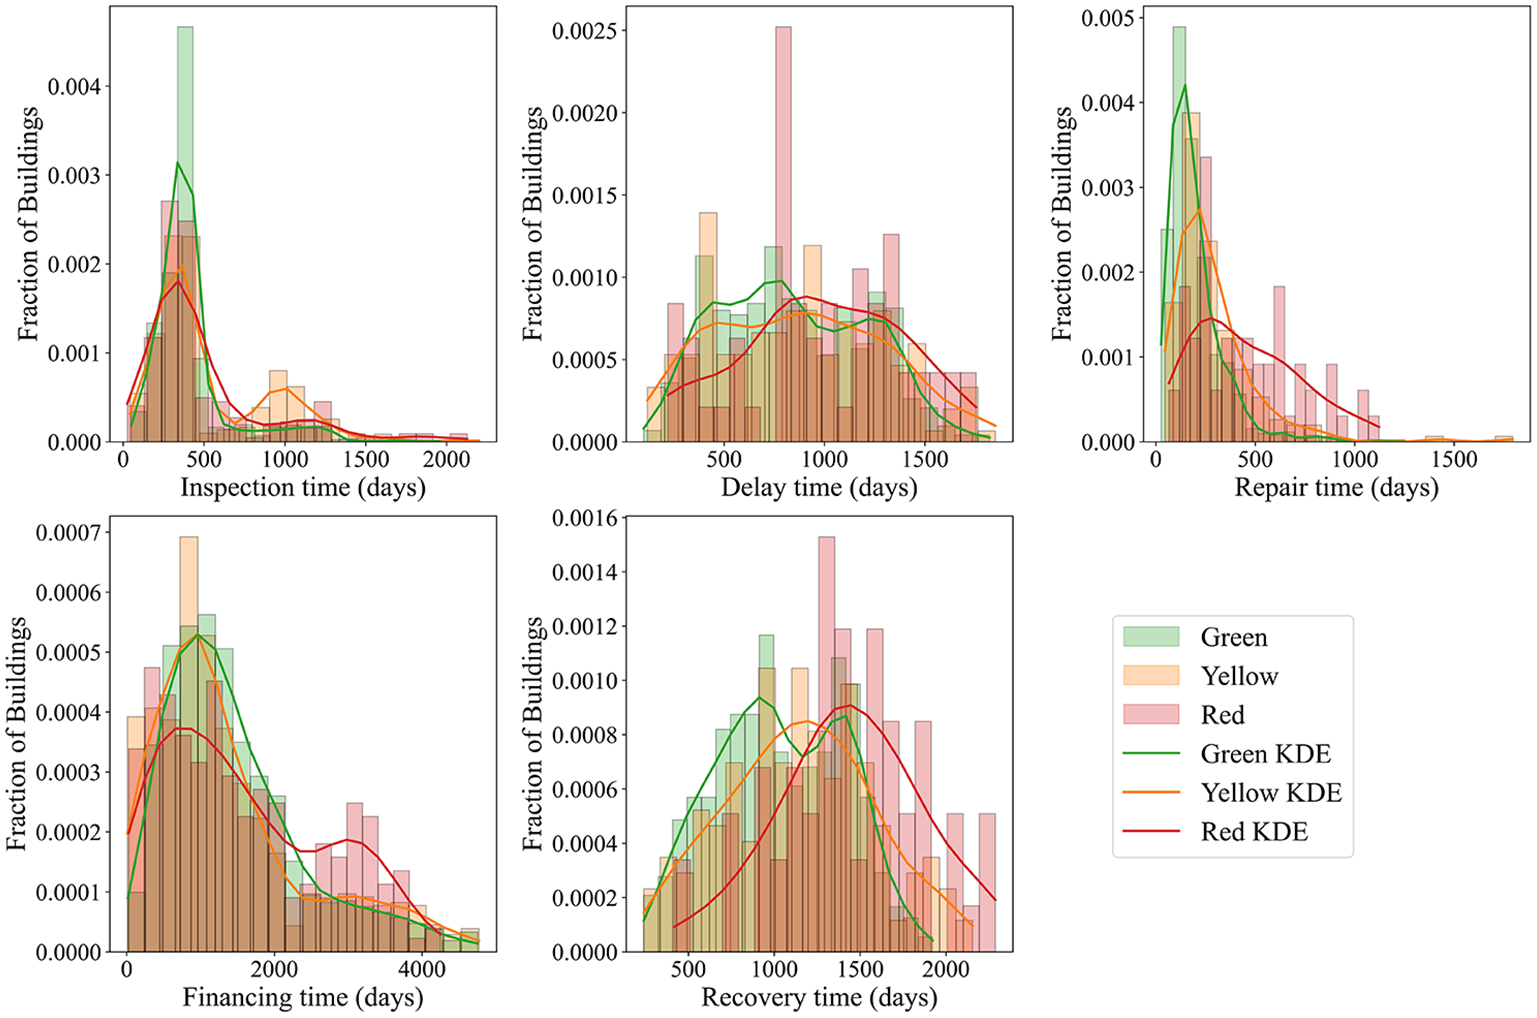
Empirical distributions of the disaggregated (by damage states) inspection time, delay time, repair time, financing time, and recovery time.
Methodology
This research presents a hybrid data-driven approach that simultaneously estimates and updates recovery parameters for duration-based temporal variables at the individual building level and predicts building recovery trajectories at the community level, as depicted in Figure 4.
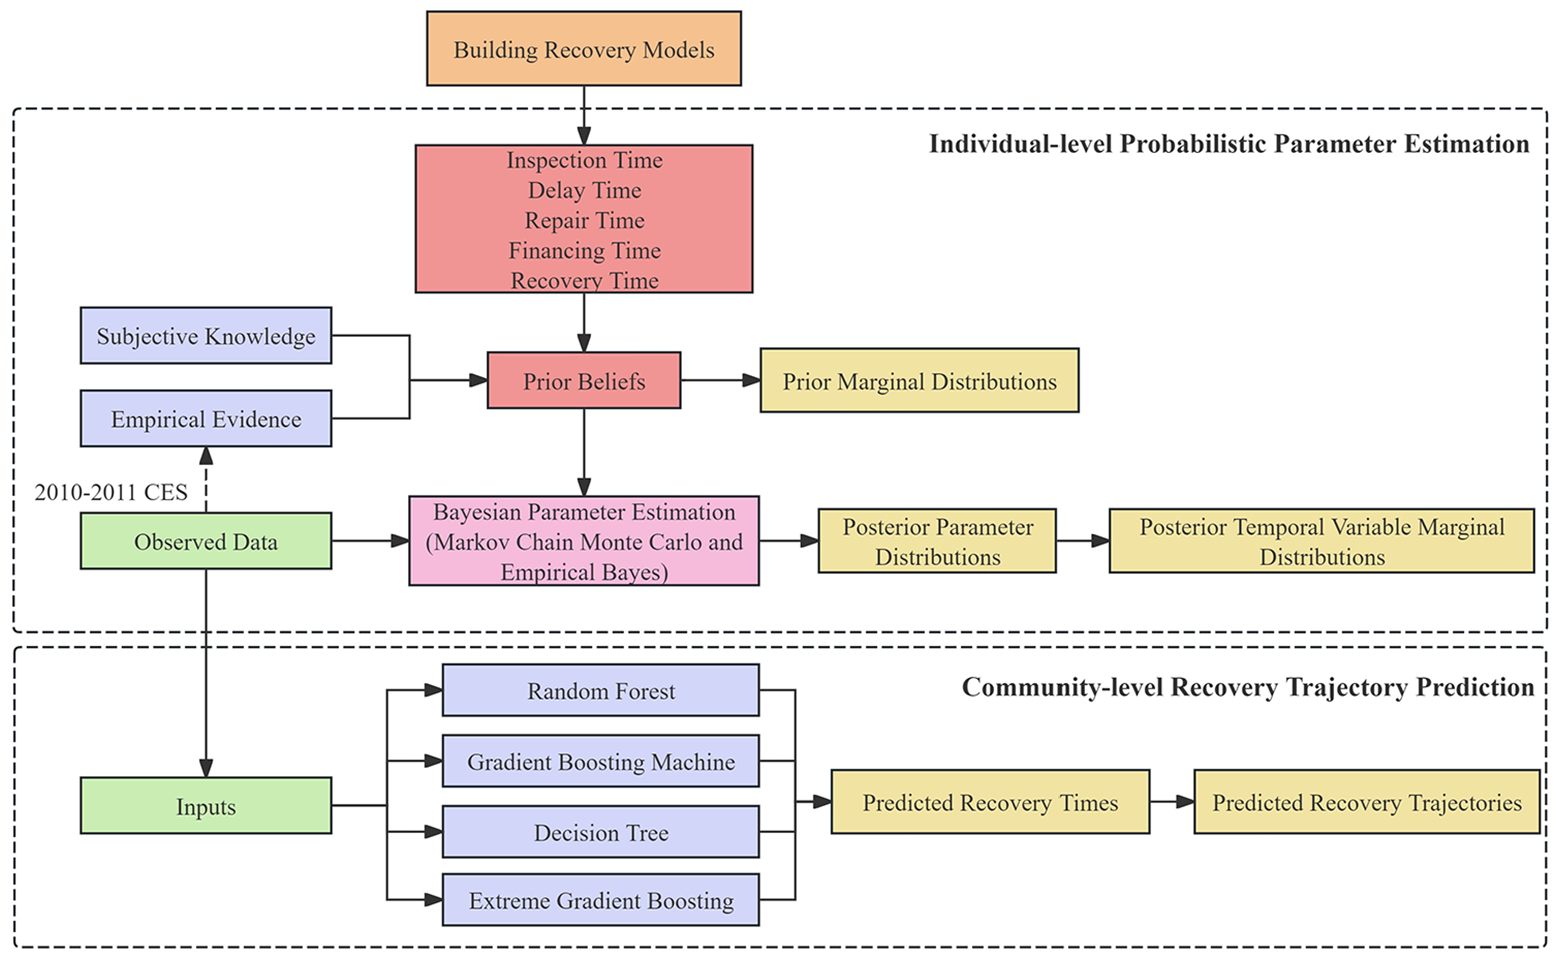
The architecture of the proposed hybrid data-driven approach.
At the individual building level, each temporal variable is modeled as an independent random variable, represented by a PDF characterized by parameters such as the mean and standard deviation. In this context, Bayesian inference is then utilized to estimate and update these parameters within the context of New Zealand’s built environment. The process begins with the specification of prior distributions derived from both subjective knowledge and empirical evidence; these priors are subsequently updated via MCMC and EB methods that integrate the collected empirical data to yield posterior marginal distributions for the selected temporal variables. The resulting parameter estimates can be directly applied to future recovery modeling efforts in the region. At the community level, a range of ML models, including RF, GBM, DT, and XGBoost, is employed to predict recovery times and trajectories for earthquake-affected buildings. The integration of Bayesian estimation with these ML models establishes an advanced, data-driven framework that deepens understanding of the complex dynamics governing post-seismic building recovery.
Markov chain Monte Carlo
Bayesian inference is a widely utilized framework for estimating the posterior distribution of random variables conditioned on observed data, grounded in the principles of conditional probability as formalized by Bayes’ rule (Gelman et al., 1995). The primary objective of Bayesian inference is to derive posterior distributions and to apply computational methods to effectively summarize and interpret these distributions. A commonly employed technique within this framework is MCMC, which is based on Markov chains, stochastic processes in which the probability of transitioning to the next state depends solely on the current state. By exploiting the equilibrium properties of Markov chains, MCMC approximates posterior distributions through iterative sampling, making it particularly effective for complex models where analytical solutions are either intractable or unavailable.
One of the commonly utilized samplers within the MCMC method is the Metropolis-Hastings (MH) algorithm (Chib and Greenberg, 1995; Metropolis et al., 1953). The application of MH-MCMC begins with the selection of a proposal distribution
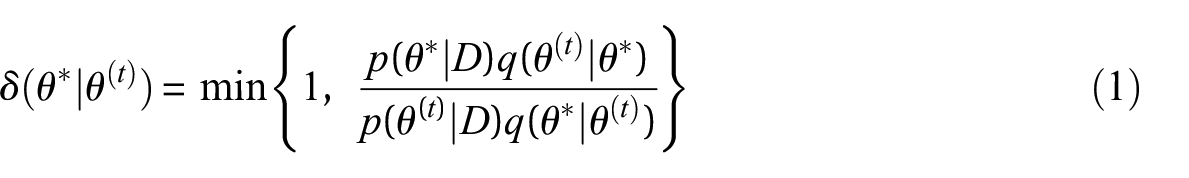
where
According to Equation 1, the acceptance probability
Empirical Bayes
EB constitutes a semi-Bayesian methodology that integrates the principles of Bayesian inference with data-driven estimation of prior hyperparameters to enhance posterior distribution estimation (Deely and Lindley, 1979; Good and Toulmin, 1956; Robbins, 1956). Unlike fully Bayesian approaches that require a fully specified subjective prior, EB empirically estimates the hyperparameters of the prior distribution by aggregating data from multiple subpopulations (Gelman et al., 1995). This procedure is particularly advantageous in hierarchical models where data are naturally partitioned into subgroups. By pooling information across these subpopulations, EB substantially improves parameter estimation in cases with sparse or limited observations (Carlin and Louis, 2000).
In this study, the temporal variable
Rather than relying exclusively on global measures such as the overall mean (
where
Assuming that the likelihood function is lognormal, the prior mean (
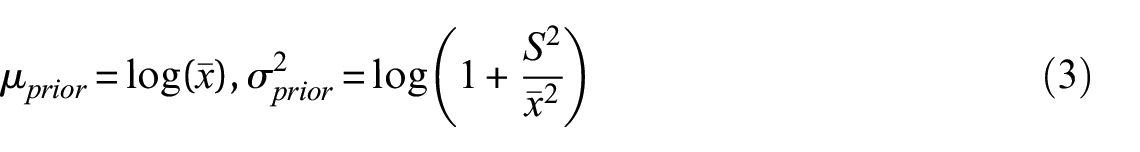
Notably, unlike traditional EB methods, which apply maximum likelihood estimation (MLE) independently for each damage state, the hierarchical Bayesian model adopted here permits the sharing of information across damage states. The posterior mean and variance in log-space are updated via a Bayesian shrinkage formulation, which combines global prior with observed data from each damage state to produce more stable estimates:
where
Once the posterior mean and variance are estimated in log-space, they are back-transformed into the original scale using the standard moments of the lognormal distribution:

where
Machine learning models
In addition to updating individual-level recovery parameters for temporal variables, simulating the recovery trajectories of affected buildings using empirical data is equally crucial for providing decision-makers with intuitive, actionable insights. In this study, recovery trajectories are defined as the temporal progression of housing capacity restoration, quantified by the proportion of buildings repaired over time, with full regional recovery achieved when all damaged buildings in the region have been restored. To model these trajectories, several ML models are employed as surrogate models and adapted to the New Zealand context. In particular, RF, GBM, DT, and XGBoost are chosen for their robustness in managing the uncertainties inherent in post-disaster building recovery and their ability to capture complex, nonlinear relationships between inputs and outputs.
DT is a supervised learning algorithm that recursively partitions data to construct tree-like structures for classification and regression, with predictions determined by the mean (for regression) or mode (for classification) of the values in the terminal nodes (Quinlan, 1986). RF builds upon DT by aggregating predictions from multiple decision trees, each trained on random subsets of both observations and features. This bagging approach reduces variance and mitigates overfitting (Breiman, 2001). GBM further improves predictive performance by sequentially correcting the errors of previous models using gradient descent, albeit at the expense of increased computational demands (Friedman, 2001). XGBoost is an advanced implementation of GBM that incorporates additional features such as regularization, parallel processing, and improved handling of missing data, yielding superior performance and additional safeguards against overfitting (Chen and Guestrin, 2016).
The application of these ML models to predict recovery trajectories begins with the careful selection of input predictors, which must be contextually adapted to the region and informed by the availability of relevant data. The recovery times predicted by these models serve as their output. Given the performance of these models heavily depends on the optimal configuration of hyperparameters (Bhatta and Dang, 2024), a grid search strategy is employed to systematically explore a predefined range of hyperparameters for each model, as detailed in Appendix 1 (see Table 7). This exhaustive search ensures the identification of the optimal hyperparameter configuration. To further enhance model robustness and minimize the risk of overfitting, a k-fold cross-validation technique is applied. This method partitions the dataset into k subsets, allowing the model to be trained and validated iteratively across these subsets. In each iteration, one subset is used as the validation set, while the remaining k − 1 subsets serve as the training set. This combination of hyperparameter optimization and cross-validation ensures rigorous testing and fine-tuning of the ML models to maximize predictive performance.
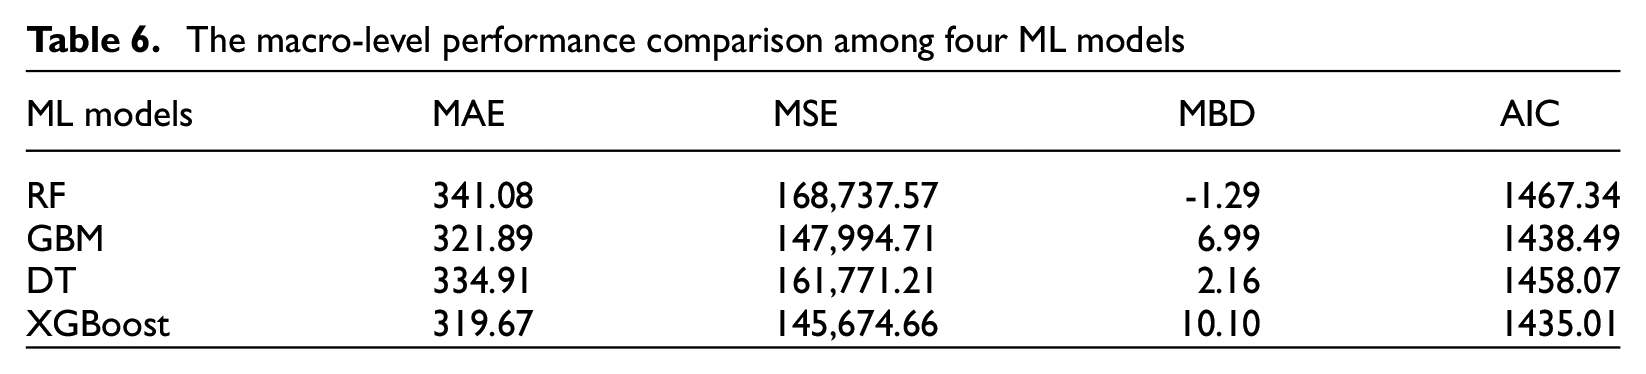
The training and testing of ML models are conducted using the scikit-learn library in Python 3.12. The dataset is randomly divided into training (80%) and testing (20%) subsets. Models are trained on the training set, and their predictive performance is evaluated on the testing set using several metrics. In addition to mean squared error (MSE) and mean absolute error (MAE), the mean bias deviation (MBD) and Akaike information criterion (AIC) are computed. MBD provides insight into the average bias in predictions, which is instrumental in identifying systematic errors, while AIC assesses the relative quality of the models by balancing goodness of fit against model complexity (Akaike, 1974).
Illustrative applications
Individual-level building recovery modeling
To effectively implement the Bayesian estimation approach, it is essential to define prior parameters and distributions grounded in established beliefs. For instance, Omoya et al. (2022) utilized recovery parameters from the REDi and HAZUS frameworks as prior distributions when updating these parameters in the context of the 2014 South Napa earthquake. This approach is methodologically appropriate given that the 2014 South Napa earthquake occurred within the United States, a context consistent with the intended application scope of both the REDi and HAZUS frameworks. In contrast, the present study focuses on residential buildings in the Christchurch CBD, where emergency response and recovery protocols differ markedly from those in the United States. Consequently, the prior parameters established for US buildings under the REDi and HAZUS frameworks are not directly applicable to the Christchurch context.
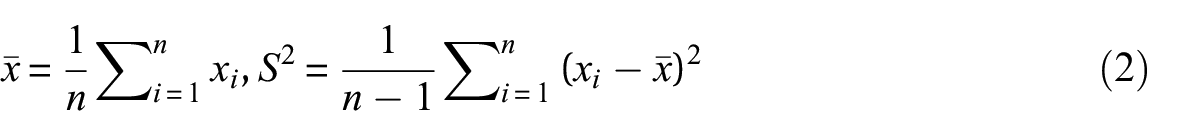
In Bayesian inference, prior parameters can be defined using both subjective prior knowledge and empirical evidence. In this study, extensive empirical data enable the use of the sample mean and variance as statistical estimates for defining the prior parameters. For the EB method, the global mean and variance of each variable, aggregated across the three damage states (Green, Yellow, and Red), form the foundational prior beliefs, which are then transformed into requisite parameters (see Equations 2 and 3). To benchmark the performance of the EB method within the New Zealand context, the MH-MCMC method was also employed to update the parameters for all temporal variables, while standard MCMC methods utilize the sample mean and variance stratified by damage states to construct more context-specific priors.
To rigorously determine the theoretical probability distributions of these temporal variables, a KS test (Fasano and Franceschini, 1987) was applied. The test calculates both the D statistic, which measures the maximum difference between the empirical cumulative distribution function (CDF) and that of the reference distribution, and the associated p-value, which assesses the statistical significance of this difference. A low p-value (e.g. below 5%) indicates that the null hypothesis can be rejected, suggesting that the sample does not follow the specified distribution. Accordingly, for a theoretical distribution to be accepted in this study, the p-value must exceed 0.05, and the D statistic should be sufficiently small, indicating a close fit between the empirical and theoretical distributions.
Several candidate distributions, including exponential, gamma, beta, Poisson, lognormal, and normal distributions, were evaluated to determine the most appropriate fit for the temporal variables. The KS test results revealed that financing time and repair time follow lognormal distributions at the 5% significance level. In contrast, for inspection time, delay time, and recovery time, the p-values fell below 0.05, suggesting that none of the examined theoretical distributions provided an acceptable fit. Notably, when the data were disaggregated by damage states, some KS test outcomes still indicated lognormality. This outcome is anticipated, as large sample sizes can yield statistically significant yet practically trivial discrepancies between the observed data and the chosen distribution, a well-known limitation of any goodness-of-fit test (Johnson and Wichern, 1974).
In the absence of a strong empirical fit, prior knowledge from existing literature was incorporated, a common practice in Bayesian analysis. As indicated by Alisjahbana and Kiremidjian (2021), Almufti and Willford (2013) and Kang et al. (2018), a lognormal distribution was selected for the remaining temporal variables. This informed prior was integrated into the modeling framework to ensure consistency with previous research and to facilitate the estimation of parameters. Consequently, all five temporal variables were modeled using lognormal distributions, with the corresponding lognormal likelihood functions employed in both the EB and MCMC methods. The appropriateness of the lognormal assumption within the MCMC framework was rigorously validated through several diagnostic checks, including trace plots, effective sample sizes (ESS), and R-hat statistics, all of which confirmed its suitability for this study. Moreover, the comparable performance observed for the EB method under the lognormal assumption, when benchmarked against the MCMC approach, further corroborates the validity of this assumption.
In the implementation of the MH-MCMC method, a logarithmic transformation was applied to the acceptance ratio to mitigate numerical stability issues, such as zero denominators and overflow. A total of 100,000 iterations were executed to ensure convergence, as verified by trace plot analysis, ESS, and R-hat statistics. Moreover, a burn-in period of 15,000 iterations was determined through preliminary trial runs, ensuring that the Markov chain had sufficiently stabilized prior to parameter estimation.
Community-level building recovery modeling
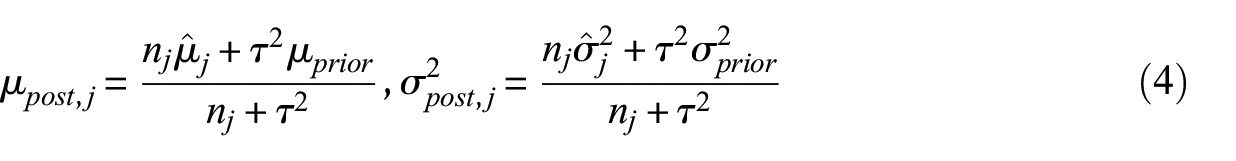
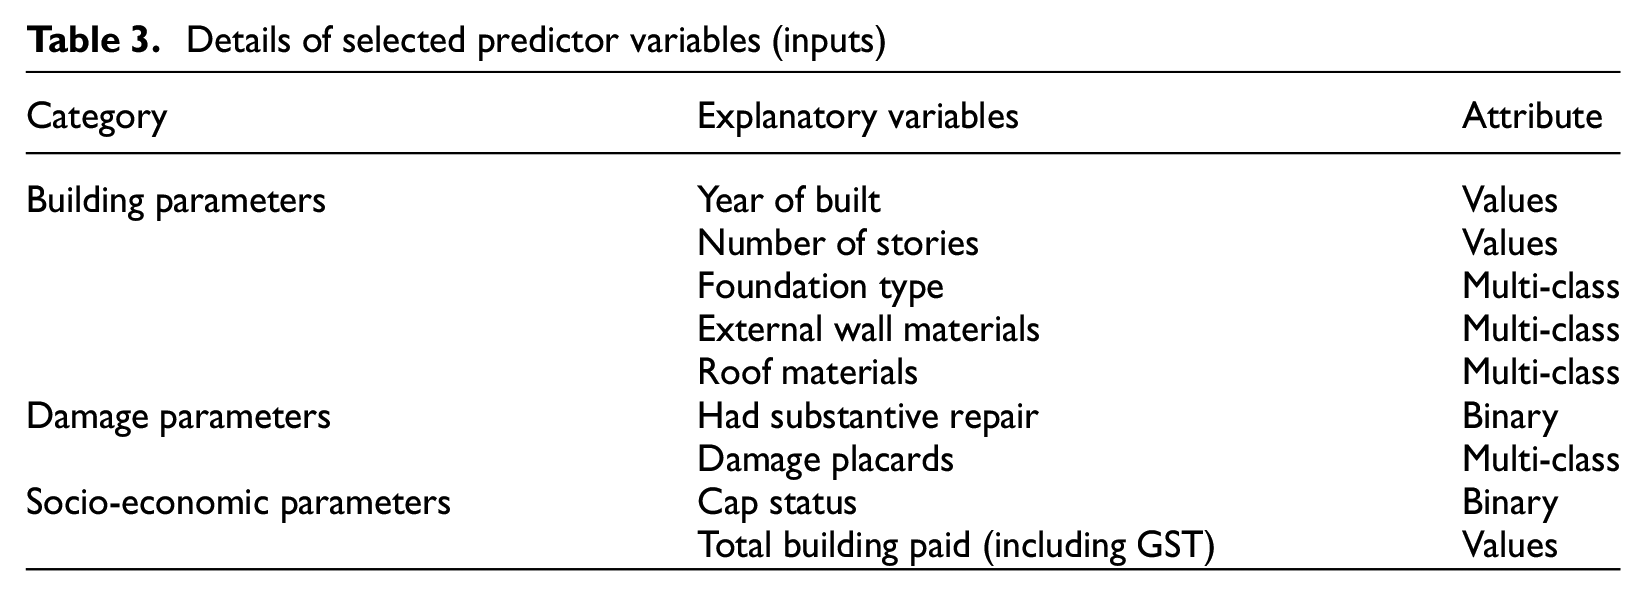
This section examined a total of 1,987 buildings, of which 1,098 with documented outputs (recovery times) were utilized for model training and testing. Instead of incorporating an extensive set of explanatory variables that may be impractical or not readily accessible, this study strategically selected input variables from the NHC internal database, as shown in Table 3. These variables are classified into three groups: (1) building parameters, (2) damage parameters, and (3) socio-economic parameters. Particular emphasis was placed on including building damage as a key input variable, given that damage assessments are typically conducted shortly after an earthquake, ensuring the timely availability of such data (NZSEE, 2011). In addition, recognizing the substantial impact of insurance payouts on building recovery trajectories in New Zealand (Marquis et al., 2017), the total insurance payout provided by the NHC was incorporated as a critical explanatory variable.
Details of selected predictor variables (inputs)
To identify the optimal hyperparameter configurations for selected ML models, a grid search combined with fivefold cross-validation was conducted. The resulting optimal hyperparameter configurations are summarized in Appendix 1 (see Table 8). Then, the predictive performance of these models, configured with the identified hyperparameters, was thoroughly assessed and compared in the subsequent sections.
Results
Bayesian estimation for individual buildings
The prior and posterior distribution parameters for the mean duration of the five variables obtained from the MCMC and EB methods are presented in Table 4, while Figure 5 illustrates the corresponding prior and posterior PDFs for these variables. The findings reveal that both methods yield generally comparable results, thereby confirming their consistency and efficacy in updating posterior distributions through the incorporation of observed empirical data.
The prior and posterior distribution parameters for the mean duration of variables (
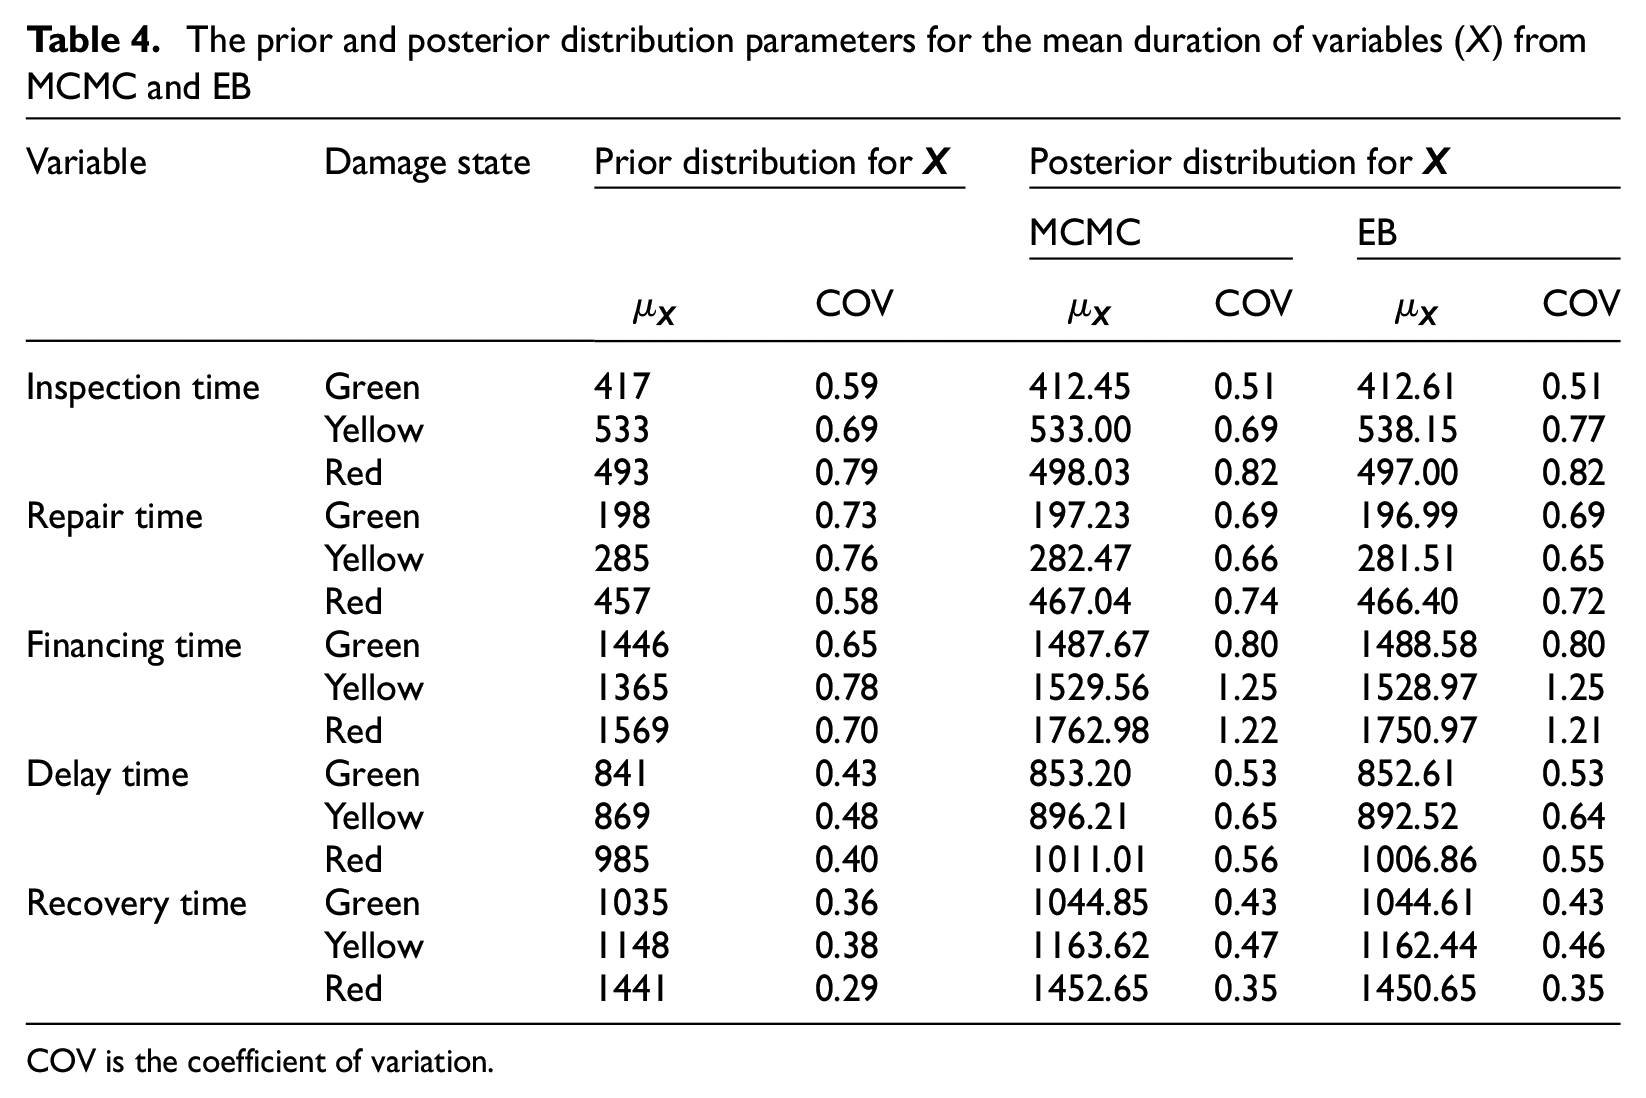
COV is the coefficient of variation.
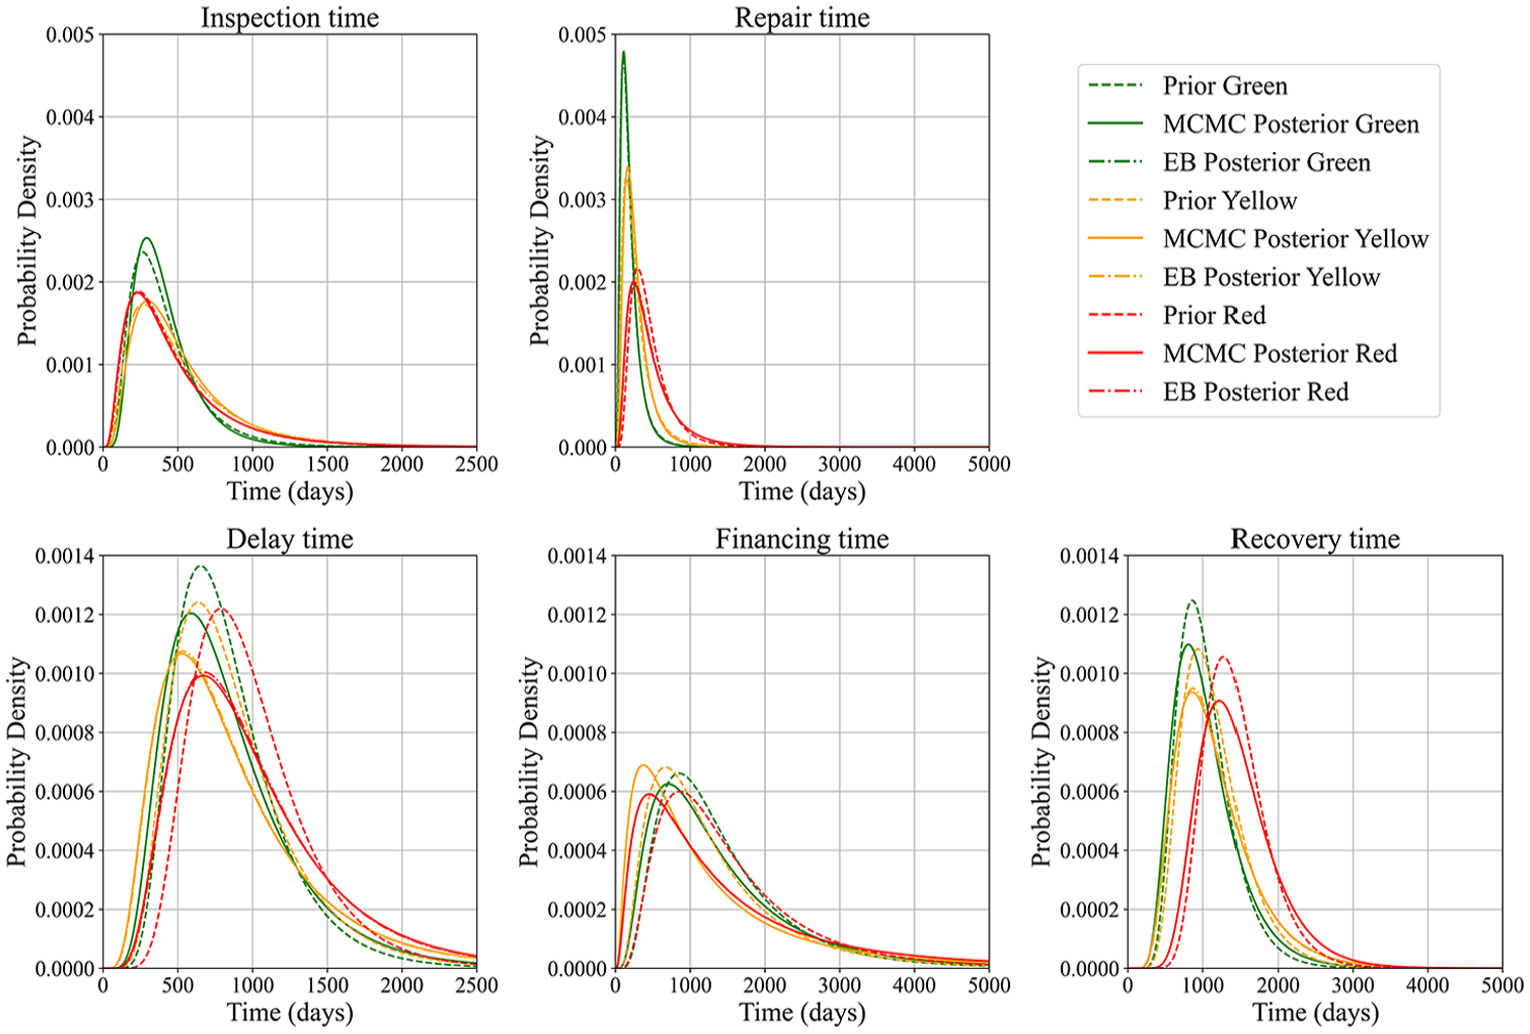
Prior and posterior PDF distribution of
Notably, the posterior distributions derived from the MCMC method frequently exhibit discernible shifts toward the empirical data and exhibit greater dispersion (as measured by the coefficient of variation, COV) than their priors. For instance, the financing time distribution for the red damage state demonstrated a significant shift from the prior to the MCMC posterior, achieving a closer alignment with the observed data. This shift is attributable to the sampling-based nature of the MCMC method, which facilitates a broader exploration of the parameter space during posterior inference. In contrast, the EB method produced posterior estimates that remained relatively closer to the original prior distributions, exhibiting lower variability. These results imply that the EB approach may be preferable when a lower degree of variability in parameter estimates is desired, whereas the MCMC method is better suited to capturing a wider range of uncertainty inherent in the data.
Following the parameter updates for the five temporal variables, the marginal distribution of the duration variable (
Prior and posterior marginal distribution parameters of duration variables (
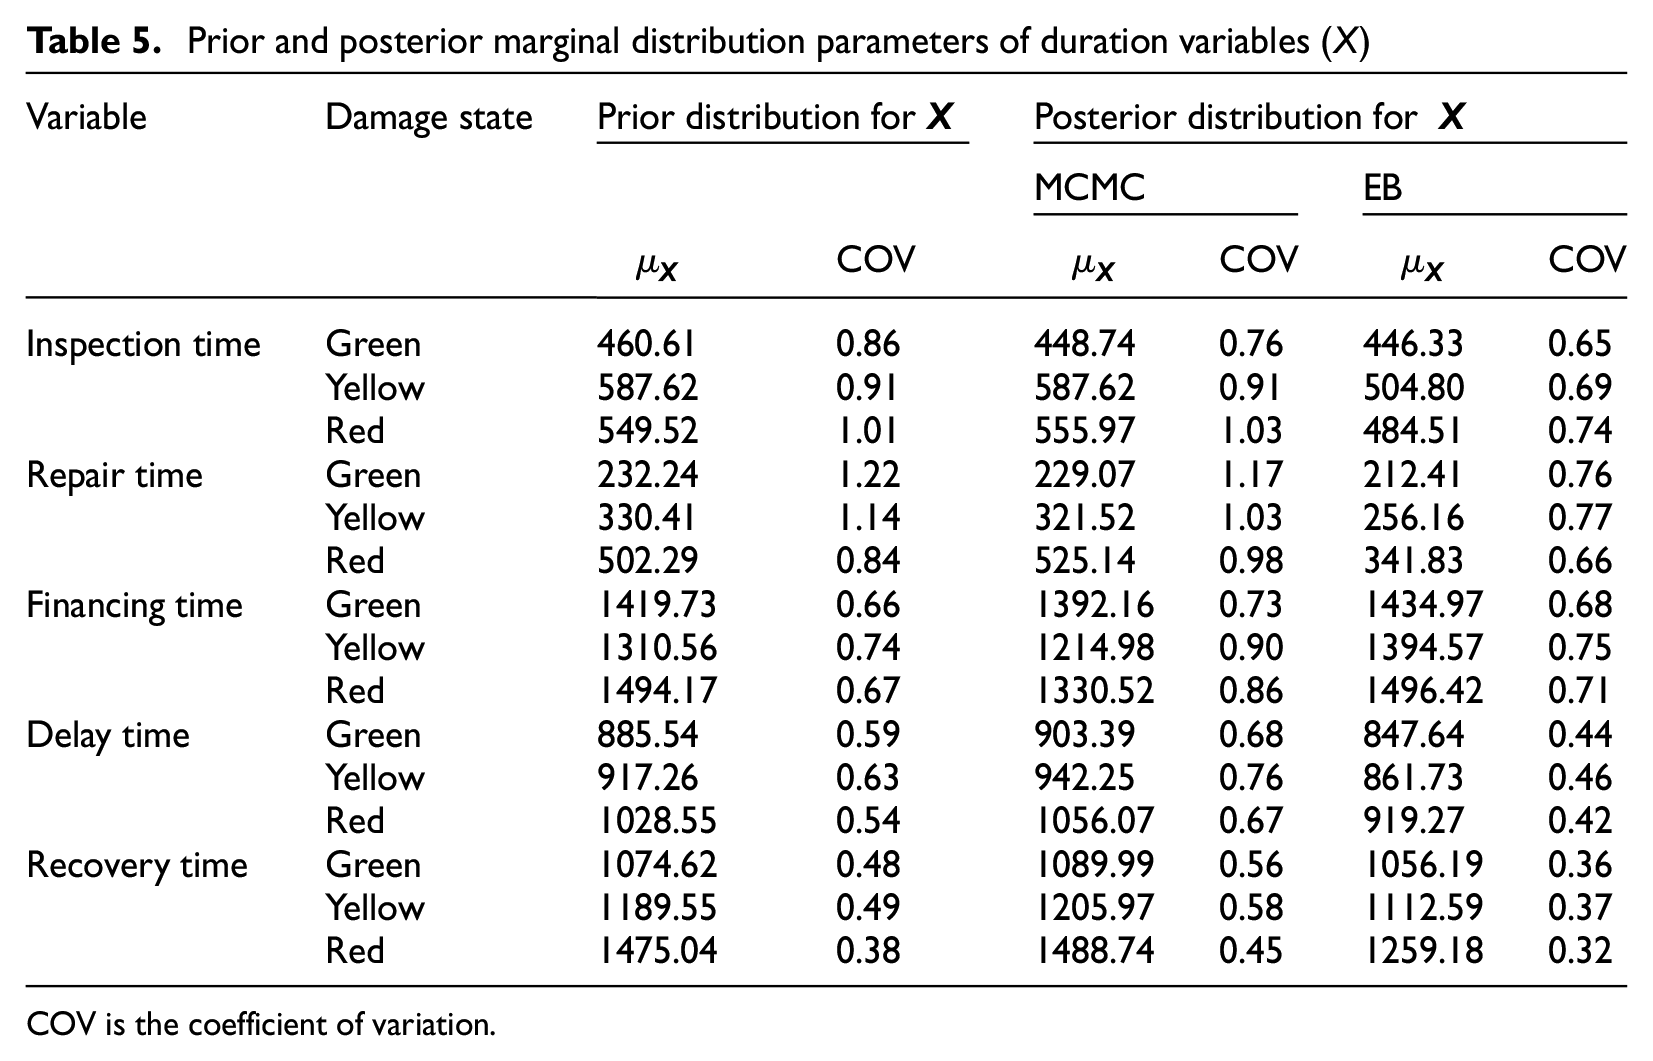
COV is the coefficient of variation.
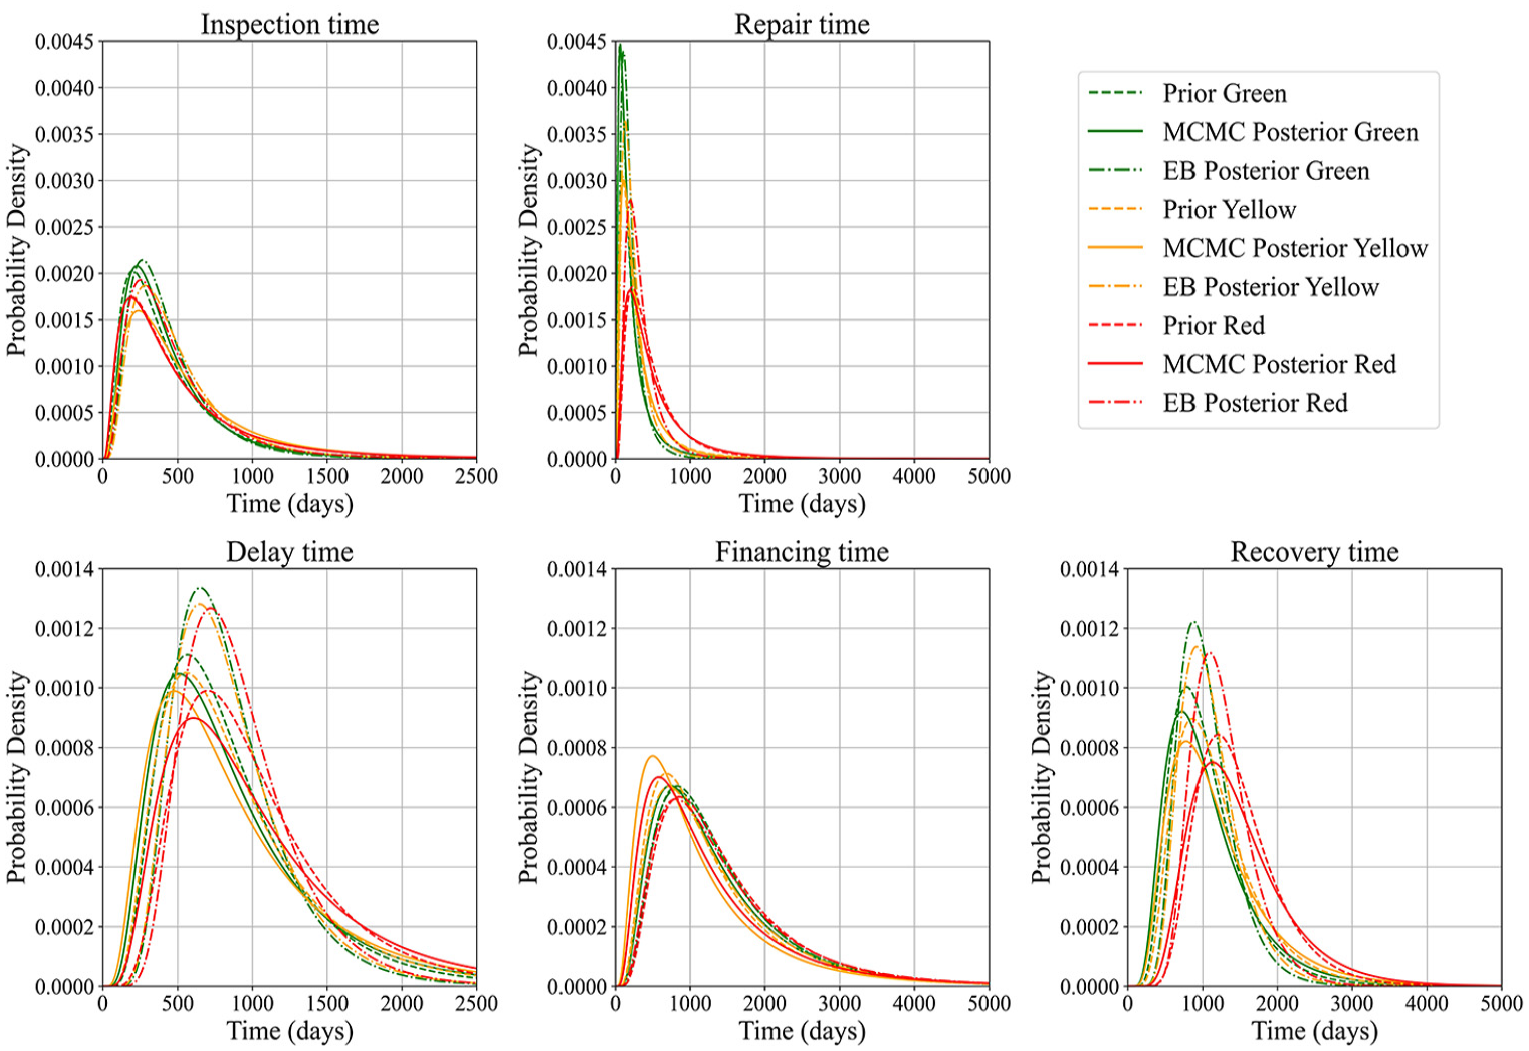
Marginal prior and posterior PDF distribution of
Recovery trajectory prediction for community buildings
The comparative results of the observed versus predicted recovery times for the selected building samples using four ML models are presented in Figure 7, with detailed performance metrics provided in Table 6. Among these models, the RF model demonstrated a close alignment with the observed recovery time distribution, although it tended to underestimate recovery times in cases where recovery exceeded 1,400 days. Conversely, XGBoost yielded the lowest values for MAE, MSE, and AIC metrics, which were key indicators of overall model performance at the macro level. The XGBoost model exhibited a pronounced concentration of predictions around 1,000 days, which corresponded closely to the observed peak of recovery times. Nevertheless, it also displayed underestimation in the lower range and overestimation in the higher range, as evidenced by the elevated MBD values. This implies that while XGBoost achieves better accuracy overall, its predictions should be interpreted with caution.
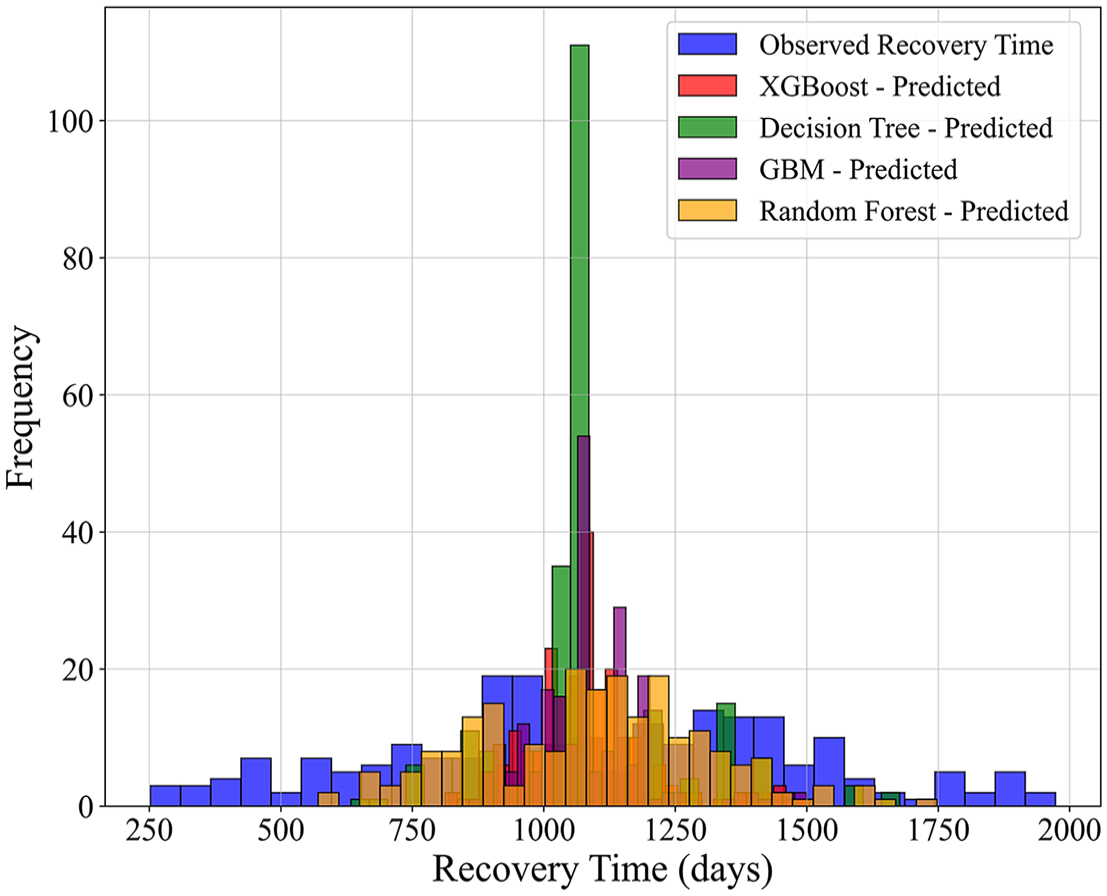
Comparison of observed and predicted recovery times for selected individual buildings using RF, GBM, DT, and XGBoost.
The macro-level performance comparison among four ML models
To further evaluate the models’ ability to capture finer fluctuations in recovery trajectories, a micro-performance analysis was conducted for the RF and XGBoost models, as depicted in Figure 8. The results revealed that despite XGBoost’s superior performance in macro-level metrics, such as overall accuracy and error minimization, the RF model was more adept at capturing nuanced variations in recovery trajectories. In particular, the RF model proved more effective in tracking recovery trends across different damage categories, as illustrated in Figure 8a and b.
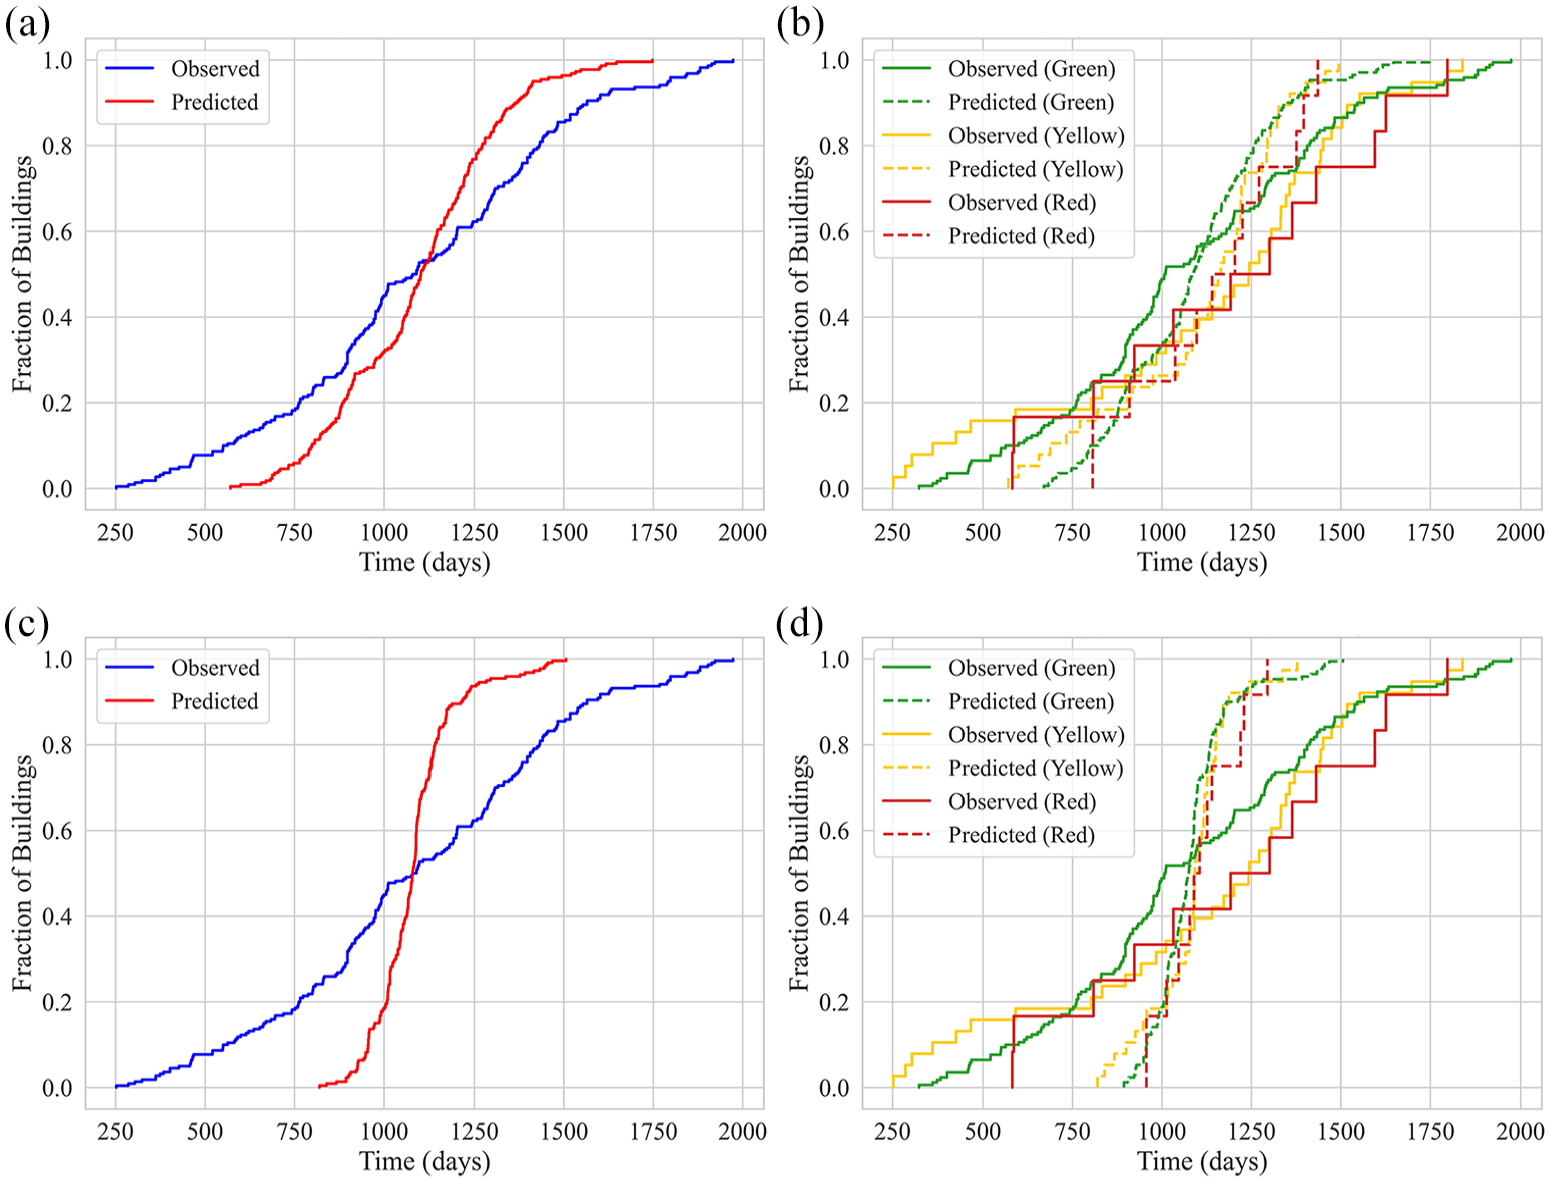
Comparison of observed and predicted recovery trajectories in the testing set using the RF and XGBoost models: (a) RF: overall distribution, (b) RF: distribution by damage label, (c) XGBoost: overall distribution, and (d) XGBoost: distribution by damage label.
Discussion
The implications of the results
Duration-based temporal variables, which are central to the post-earthquake recovery process, are inherently uncertain and influenced by local recovery practices and the characteristics of the built environment. These complexities necessitate the incorporation of extensive empirical data to robustly estimate and validate these variables, thereby yielding insights that are both contextually relevant and operationally meaningful. To this end, comprehensive damage and recovery data were collected from residential buildings impacted by the 2010–2011 CES. A hybrid data-driven approach was subsequently developed to model building recovery at both individual and community levels, elucidating multiple facets of post-earthquake recovery dynamics.
At the individual building level, five key temporal variables—recovery time, financing time, delay time, inspection time, and repair time—were modeled as a stochastic random variable, each characterized by its own PDF. Despite the distinct recovery protocols and practices employed in New Zealand, the KS test results indicate that financing and repair times conform to lognormal distributions. This finding is consistent with the specifications of the REDi guidelines (Almufti and Willford, 2013) and HAZUS (FEMA, 2022). For the remaining temporal variables, a lognormal distribution was assumed based on subjective prior beliefs supported by previous studies (Alisjahbana and Kiremidjian, 2021; Kang et al., 2018). The robust performance of both the MCMC and EB methods in this study substantiates the appropriateness of the lognormal assumption, thereby reinforcing its suitability for modeling these temporal variables within New Zealand’s distinct recovery landscape.
In updating the recovery parameters, both the fully Bayesian MCMC and the semi-Bayesian EB methods were employed to assess their applicability in the New Zealand context. Each approach effectively integrated prior knowledge with empirical data to update the recovery parameters associated with duration-based variables. The MCMC approach, despite its reliance on subjective priors, produced comprehensive posterior distributions that captured the intrinsic variability of these parameters. However, this method incurs higher computational costs due to its iterative sampling and diagnostic procedures, making it particularly well suited for complex models involving hierarchical structures or high-dimensional parameters, where precise uncertainty quantification is paramount. Conversely, the EB method derives prior parameters directly from the data, offering notable computational efficiency and yielding more conservative and stable estimates. While advantageous in scenarios where prior information is limited or when lower variability is preferred, the EB method’s reliance on point estimates may constrain its capacity to fully encapsulate the complexity of recovery dynamics, rendering it less ideal for modeling intricate recovery scenarios.
At the community level, recovery trajectory prediction was conducted using a suite of advanced ML models, including RF, GBM, DT, and XGBoost. The results demonstrate that the RF model is particularly adept at capturing the dynamic progression of recovery over time, a finding that aligns with the work of Bhatta and Dang (2024) and Mangalathu et al. (2020). In comparison to simpler decision tree models (Tocchi et al., 2023), RF exhibits enhanced robustness to data noise and is more effective in managing high-dimensional datasets while maintaining interpretability. Moreover, when macro-level prediction accuracy is paramount, XGBoost delivers more precise estimates for the overall recovery time frame. The integrated use of RF and XGBoost thus offers a more nuanced and comprehensive understanding of building recovery dynamics, furnishing policymakers with critical, data-driven insights to inform effective post-disaster recovery strategies.
Theoretical and practical implications
The integration of Bayesian estimation with ML models represents a noteworthy advancement in data-driven approaches to building recovery modeling. Traditional simulation-based approaches at the individual-level recovery often rely on highly granular, component-level data (Boston, 2017; Cook et al., 2022; FEMA, 2018b; Molina Hutt et al., 2022; Terzic et al., 2021b), necessitating a detailed examination of architectural and design documentation. However, acquiring such detailed data in post-disaster contexts is often impractical due to incomplete or unavailable records (Li et al., 2023a). In contrast, this study leverages readily available building-level empirical data to improve both the feasibility and practical application of the proposed models. By capturing the recovery process on a per-building basis, the approach is considerably more manageable than component-level methods, as data can be feasibly collected once restoration activities are completed and reported to local authorities. It needs to be noted that the Bayesian hyperparameters and machine-learning architectures can be recalibrated by the research community to examine building recovery from other events or in other regions.
The Bayesian estimation framework quantifies uncertainty for the discrete temporal variables integral to the recovery process. Its marginal posterior distributions capture the variabilities inherent in each recovery phase, thereby providing the statistical rigor required for high-fidelity downtime estimation. In contrast, machine-learning models generate deterministic recovery-time predictions at the individual-building level, which are subsequently aggregated to derive community-scale recovery metrics essential for strategic planning and operational decision-making at a portfolio or community scale. In other words, the individual-level building recovery model provides building owners, insurers, and engineers with granular probabilistic insights into specific recovery phases. The building recovery model at a community scale, however, provides scalable deterministic estimates that inform recovery operations across a broader spatial scale. The two models collectively enhance the capability of recovery forecasts and allow for informed decision-making, such as resource allocation and prioritization at both building and community levels.
Theoretically, the application of Bayesian estimation effectively addresses the epistemic uncertainties intrinsic to duration-based variables by integrating empirical evidence with established prior knowledge. The parameters derived from New Zealand’s distinctive recovery practices not only enrich global reconnaissance methodologies but also serve as critical inputs for predominantly US-oriented frameworks such as the REDi guidelines. Incorporating a New Zealand perspective into recovery modeling can inform recovery-based building design and codification processes in earthquake-prone regions worldwide. In addition, the present findings establish rigorously quantified priors tailored to the New Zealand context, laying a robust statistical foundation for subsequent earthquake engineering research in the region. As additional empirical data become available, these priors can be iteratively updated within the Bayesian framework, ensuring that recovery parameters remain attuned to the dynamic characteristics of the built environment and future seismic events.
From a practical standpoint, the ML models developed in this study constitute a markedly more computationally efficient alternative to conventional methods, which first derive individual-level recovery trajectories from component-level data before aggregating them into portfolio-scale estimates (Burton et al., 2016; Lin and Wang, 2017, 2019). In contrast, our ML pipelines generate region-level recovery assessments from empirical building-level observations within seconds, while rigorously propagating uncertainty throughout the inference process. A principal advantage of this paradigm is its intrinsic adaptability: once trained, the models can be redeployed across diverse seismic contexts with minimal modification or re-validation, unlike prescriptive frameworks such as the REDi guidelines (Almufti and Willford, 2013) or FEMA P-58 (FEMA, 2018a). Furthermore, ML techniques excel at integrating heterogeneous data modalities, including textual damage reports, categorical building attributes, and unstructured sensor outputs, thereby enhancing predictive fidelity relative to purely numerical empirical approaches (Alisjahbana, 2022; Alisjahbana and Kiremidjian, 2021; Omoya et al., 2022). Importantly, as additional empirical data are collected over time or from new seismic events, these pre-trained ML models can be incrementally fine-tuned or fully retrained if needed to capture the emerging recovery patterns and maintain predictive accuracy prior to their wider operational deployment.
Limitations and future directions
It needs to be noted that the proposed data-driven approach leverages empirical damage and recovery data from the 2010–2011 CES, rendering the findings particularly pertinent to insured residential buildings in the Christchurch CBD. The dataset used for developing both Bayesian inference and machine learning models was sourced from the NHC in accordance with its established data management practices. The recovery of the Christchurch CBD was unique, as are many other post-earthquake recovery efforts. Therefore, generalizing any model, or modeling technique, that worked well on data from a single, unique event, to other events of different magnitude or in different regions, is not easy, significantly limiting the proposed model’s application. Therefore, caution needs to be exercised when generalizing these results beyond the specific context of the collected and managed data. In particular, the input–output architectures of the machine learning models have been explicitly configured to capture the distinctive characteristics of the 2010–2011 CES and the NHC’s inspection protocols, which limit their immediate applicability in other seismic settings. However, such data-driven design as the architectural frameworks and hyperparameter configurations of these machine learning models provided the research community with a template so they can recalibrate those models for other built-environment contexts, when granular empirical datasets are available.
Future research could benefit from incorporating additional building parameters, such as occupancy type and ownership (e.g. single-family vs multi-family), as these distinctions may reveal divergent recovery patterns. Moreover, the correlation between impeding factors and repair time should be considered in the recovery models. The independence assumption is a limitation of the study. We suggest future investigations to adopt multivariate inferential frameworks (e.g. copula-based joint distributions) that can capture the correlation between impeding factors and repair time and allow for time delay propagation across the recovery process. Furthermore, the inclusion of more nuanced temporal variables, such as permit acquisition and contract mobilization, could offer a more comprehensive understanding of the diverse restoration activities underpinning the recovery process. Due to limitations in data granularity and the study’s exclusive focus on residential buildings, these factors were not examined herein, representing a key avenue for future research.
In addition, the present study did not account for the impact of infrastructure damage or disruptions to utility services on building recovery trajectories. Integrating these factors into downtime modeling is essential for a more holistic understanding of recovery dynamics. While the methodologies presented offer substantial potential for constructing customized models for other built environments and recovery scenarios, their application hinges on the availability of relevant local empirical data. Furthermore, the spatial attributes of damaged buildings are not addressed. Incorporating spatially explicit models, which account for the relative locations of the systems being modeled, will further enhance the precision of recovery forecasts, particularly in scenarios where spatial dependencies significantly influence recovery dynamics.
Conclusion
This research introduces a hybrid data-driven approach to model building recovery at both individual and community levels, drawing on extensive damage and recovery data from residential buildings affected by the 2010–2011 CES in New Zealand. At the individual building level, a probabilistic Bayesian estimation framework, incorporating both MCMC and EB methods, was employed to estimate and update parameters of key temporal variables that underpin the building recovery process. At the community level, a range of ML models was applied to predict recovery times and trajectories for earthquake-affected buildings. The integration of Bayesian estimation with ML algorithms yields a flexible, adaptable, and computationally efficient approach that effectively captures the complex dynamics inherent in post-earthquake building recovery.
In the individual-level analysis, five key temporal variables—recovery time, financing time, delay time, inspection time, and repair time—were rigorously analyzed as independent random variables, each characterized by its respective PDFs. Based on the results of the KS test and corroborated by established prior beliefs from existing studies, all five variables were modeled using lognormal distributions. This was found to be well suited to the New Zealand context, as evidenced by the robust performance of both MCMC and EB methods in updating the parameters of these duration-based variables. While both methods generally produced comparable estimates, the MCMC approach demonstrated a superior capacity to capture parameter uncertainty, yielding broader posterior distributions that more accurately reflected the intrinsic variability of recovery processes. Conversely, the EB method produced more stable and conservative estimates with lower variability, a feature that can be advantageous in decision-making environments where higher precision and certainty are paramount. At the community level, the recovery trajectory predictions were generated using an array of ML models, including RF, GBM, DT, and XGBoost. The results indicated that the RF model was particularly effective at capturing micro-level variations in recovery trajectories, whereas the XGBoost model delivered superior precision for overall recovery times at the macro level. Consequently, the integrated application of RF and XGBoost is recommended to provide policymakers with a comprehensive and nuanced understanding of post-disaster building recovery dynamics.
The proposed hybrid data-driven approach represents a step change in building recovery modeling at both individual and community scales. The use of Bayesian estimation for individual-level modeling establishes a critical statistical foundation for the precise quantification of recovery parameters associated with recovery-related temporal variables within a local context. This methodology not only improves the fidelity of downtime estimations but also rigorously captures epistemic uncertainty inherent in post-seismic recovery dynamics. Moreover, the recovery parameters derived herein complement those established in the US context, furnishing vital prior beliefs that pave the way for subsequent research efforts in New Zealand. The ML-supported prediction models further enhance the ability to rapidly forecast recovery trajectories and equip local agencies and governments with robust decision-support tools for recovery prioritization and long-term resilience planning. This dual methodological framework not only contributes significant theoretical insights but also serves as a practical tool for policymakers engaged in disaster recovery planning and community preparedness for future seismic events.
Footnotes
Appendix 1
The identified optimal hyperparameter configuration for ML models
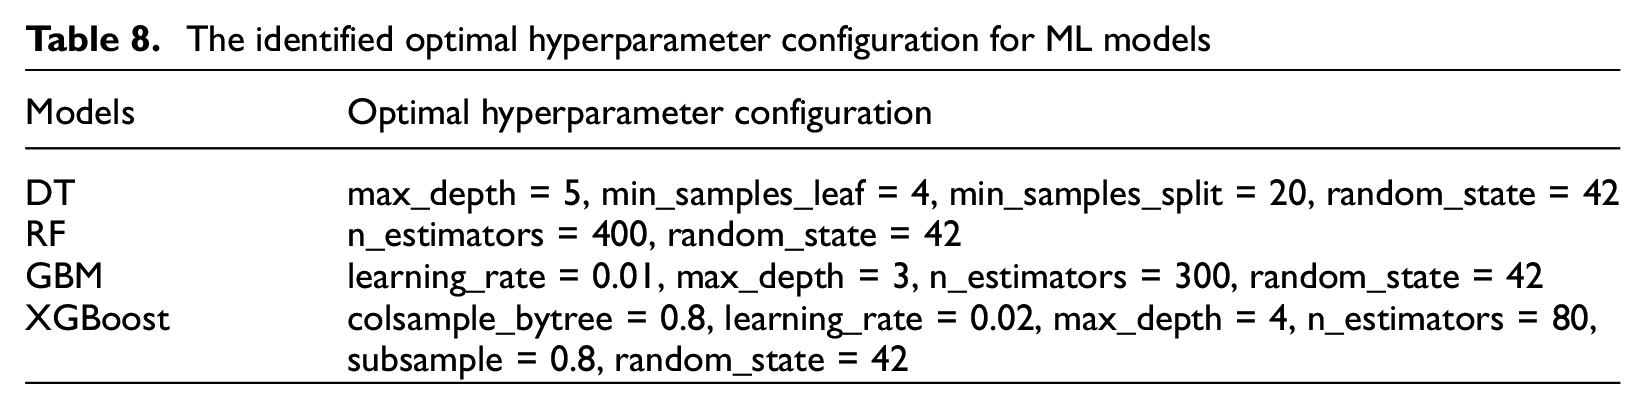
| Models | Optimal hyperparameter configuration |
|---|---|
| DT | max_depth = 5, min_samples_leaf = 4, min_samples_split = 20, random_state = 42 |
| RF | n_estimators = 400, random_state = 42 |
| GBM | learning_rate = 0.01, max_depth = 3, n_estimators = 300, random_state = 42 |
| XGBoost | colsample_bytree = 0.8, learning_rate = 0.02, max_depth = 4, n_estimators = 80,subsample = 0.8, random_state = 42 |
Acknowledgements
The authors would like to express their gratitude to the Natural Hazards Commission—Toka Tū Ake (NHC) for providing the data that was instrumental in conducting this research.
Declaration of conflicting interests
The author(s) declared no potential conflicts of interest with respect to the research, authorship, and/or publication of this article.
Funding
The author(s) disclosed receipt of the following financial support for the research, authorship, and/or publication of this article: The first author of this paper is funded by a joint Doctoral Scholarship between the China Scholarship Council (CSC) and the University of Auckland. This project was (partially) supported by Te Hiranga Rū QuakeCoRE, an Aotearoa New Zealand Tertiary Education Commission-funded Centre. This is QuakeCoRE publication number 989.
Data and resources
Approval for data collection was obtained from the University of Auckland Human Participants Ethics Committee (Reference Number 25474). The data utilized in this manuscript comprises private insurance claim settlements and is not publicly available due to confidentiality restrictions. However, the KS test results, along with the Python codes employed in this study, can be found in the following GitHub repository: ![]() .
.