
Abstract
We present a application programming interface (API)-enabled relational database of global earthquake ground motion intensity measures, associated metadata, and processed time-series data. Raw ground motion records were processed by the authors using either manual or semi-automated processing procedures, and every processed record has passed a quality review by a trained analyst. Computed intensity measures include peak acceleration and velocity, pseudo-spectral acceleration response spectra, cumulative absolute velocity, Arias Intensity, and Fourier amplitude spectra. The processed time-series data, associated metadata, and ground motion intensity measures were organized into a web-served relational database consisting of 32 tables connected by primary/foreign key pairs. Ground motion metadata and intensity measures (but not time-series) from the Next-Generation Attenuation (NGA)-East and NGA-West2 projects and the Hellenic Strong-Motion Database are also contained in the database. As of this writing (June 2025) the database includes intensity measures and metadata for 76,242 multi-component ground motions recorded at 9927 stations for 1391 events, and is approximately 73.5 GB in size. The database is built using the MySQL relational database management system, and is accessible through a web interface and also an API, which allows users to retrieve data using straightforward and intuitive uniform resource locators (URLs). Compared with more traditional file-download-based methods for data release, the relational database (1) increases storage efficiency, (2) improves data integrity, and (3) enables users to query the data subset they wish to retrieve rather than downloading the entire database and loading it into memory. Furthermore, the web-served nature of the database means that users have immediate access to ground motion data following collection, review, and uploading. Periodic static releases of the database will be published as a means of archiving and facilitating reproducibility. The database has been designed to accommodate growth, with ongoing efforts to integrate global ground motion data (e.g. data development for the NGA-West3 project).
Introduction and project motivation
There have been many efforts to develop collections of ground motion data and metadata (e.g. Ancheta et al., 2014; Bahrampouri et al., 2021; Bozorgnia and Stewart, 2020; Castro et al., 2022; Goulet et al., 2021; Hutchinson et al., 2024; Ji et al., 2023; Luzi et al., 2016; Palmer et al., 2022; Rekoske et al., 2020; Rennolet et al., 2018; Sandikkaya et al., 2024). While these efforts have produced substantial volumes of data, there are potential issues for researchers and engineers who wish to use all combinations of datasets for model development. These issues are related to inconsistencies and incompatibilities between databases developed in different projects. Inconsistencies may arise in the form of differences in processing procedures, metadata assignment protocols, or how intensity measures are computed. Incompatibilities arise from different organizational structures used in different databases. Data integrity may also arise within a database depending on how the data are organized (different parameter values for the same site in a flatfile, typos, etc.). When researchers and engineers utilize data from multiple databases these issues need to be considered.
The Engineering Strong-Motion Database (ESM) (Luzi et al., 2016) organized ground motion data and metadata coming from different sources in the European-Mediterranean region. The Next-Generation Attenuation (NGA) program developed a commonly used suite of databases that are divided by tectonic regime: shallow crustal events in active tectonic regions (NGA-West2—Ancheta et al., 2014), crustal events in stable continental regions (NGA-East—Goulet et al., 2021), and subduction earthquakes (NGA-Sub—Bozorgnia and Stewart, 2020). Each of the NGA projects has developed a uniformly processed dataset of recorded earthquake ground motions and associated source, path, and site metadata; however there is no linkage across the three databases. Since completion of the NGA-West2 and -East data collection efforts around 2011, the amount of seismic instrumentation has increased, particularly in the state of California (Kuyuk and Allen, 2013), which means that the quantity and spatial distribution of data produced from a single event can be much greater than similar events included in earlier datasets. This has led to efforts to curate databases from more recent events (e.g. Farghal et al., 2020; Ji et al., 2023; Rekoske et al., 2020).
Ground motion processing has historically been performed manually for each record, but processing tools have evolved to a point where fully automated procedures can be used to select corner frequencies, accept/reject records based on measured quantities like signal-to-noise ratio (SNR), assign metadata, and compute intensity measures. One such approach is implemented in the Python package gmprocess developed by the United States Geological Survey (USGS) (Hearne et al., 2019; Thompson et al., 2025). Automation is attractive because it significantly reduces the time required to process each motion and collect the corresponding metadata and intensity measures for each recording. Fully automated procedures have been leveraged to assemble empirical databases for ground motion studies in the United States and elsewhere (e.g. Aagaard, 2023a, 2023b, 2023c; Bahrampouri et al., 2021; Cabas et al., 2023; Farghal et al., 2020; Gomez et al., 2022; Hutchinson et al., 2024; Ji et al., 2023; Parker and Baltay, 2022; Rekoske et al. 2020, 2022; Thompson et al., 2023b; Wong et al., 2022). Some of these efforts implemented additional quality assurance measures beyond the default set of checks performed in the automated routines such as checking for multiple wave-train arrivals and/or comparing computed intensity measures to expected values from ground motion models (GMMs) (e.g. Ji et al., 2023; Rekoske et al. 2020). When such additional measures are implemented, they are not always well documented.
Creating algorithms that match the judgment of experienced analysts is challenging, and because that judgment is used to ensure data quality while optimizing usable bandwidth, additional measures of quality assurance may be required for accepting/rejecting recordings and for corner frequency selection for data sets to be used in important applications. Furthermore, essential metadata, such as the preferred finite-fault solutions and basin depth parameters that have been used in the NGA projects (e.g. Ahdi et al., 2022; Contreras et al., 2022; Goulet et al., 2021b), are not contained in the databases queried by gmprocess; therefore, supplemental data collection efforts are often needed.
The subject of this article is a ground motion database (GMDB) that has been developed for engineering applications and, at the time of writing (June 2025), contains data from several published databases including NGA-West2, NGA-East, and the Hellenic strong-motion database (Margaris et al., 2021), as well as data from more recent events that was processed by one or more of the authors. An important feature of the data included in the GMDB is the application of consistent protocols that include human inspection during record processing and source, path, and site metadata compilation. Following this introduction, we present the ground motion data stored in the database, and the procedures used to process new data and assign metadata using protocols consistent with those established during NGA projects. The GMDB has been assembled as a relational database, the organization of which is presented after discussion of the data. Finally, we discuss how to interact with the GMDB through a publicly accessible web portal and application programming interface (API).
Ground motion datasets
The GMDB includes ground motions (including time-series) processed by one or more of the authors for recent events in the western US (WUS), central and eastern North America (CENA), and Türkiye. The GMDB metadata (not including time-series) compilation began with the following published datasets: the NGA-West2 global database for shallow crustal earthquakes in active tectonic regions (Ancheta et al., 2014), the NGA-East database for CENA for shallow crustal earthquakes in stable continental regions (Goulet et al., 2021), and the Hellenic database from mostly shallow crustal and some subduction earthquakes within and near Greece assembled using protocols consistent with NGA projects (Margaris et al., 2021). As appropriate, metadata has been updated using results of more recent studies (e.g. updated site parameters based on new site measurements). The information from published databases were adapted into the GMDB data structure presented below, but otherwise were not modified unless explicitly stated.
The authors have processed ground motions in a consistent manner for a number of events since 2011 as part of prior studies. Those studies include site response and path studies in southern and northern California (Buckreis et al., 2023b, 2024a; Nweke et al., 2022; Wang, 2020 and Mohammed et al., 2025), studies to assess the combined data misfits of NGA-East GMMs with site response models (Ramos-Sepulveda et al., 2024), studies to examine the usability of ground motions recorded by the Community Seismic Network (CSN) (Mohammed et al., 2024), and ground motion analysis for the 2014 Napa earthquake, 2019 Ridgecrest earthquake sequence, and 2023 Kahramanmaraş, Türkiye earthquake sequence (Ahdi et al., 2020; Kishida et al. 2014 and Buckreis et al., 2024b, respectively). These efforts significantly increased the quantity of available ground motions in California, CENA, and the Mediterranean relative to NGA databases (Figure 1). The “Other” slice shown in Figure 1 includes data from Alaska, China, Japan, Taiwan, and New Zealand from the NGA-West2 database. The following subsection describes the different data collection efforts.
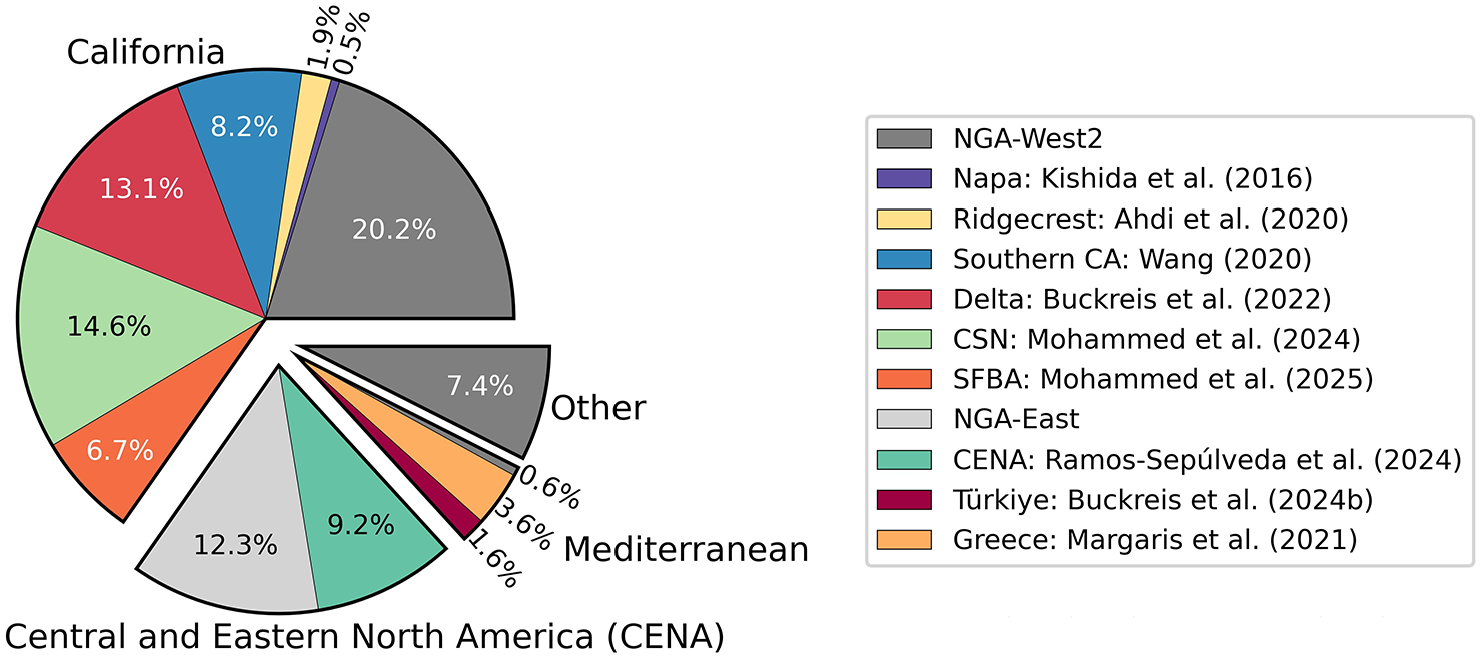
Distribution of recordings in the Ground Motion DataBase (GMDB) by region and collection study.
Data selection, processing, and distributions
Although the domains of the recent collection efforts contributing to the GMDB are different, protocols consistent with NGA projects were used to select and curate the data in each study. In all cases, only events with magnitudes (
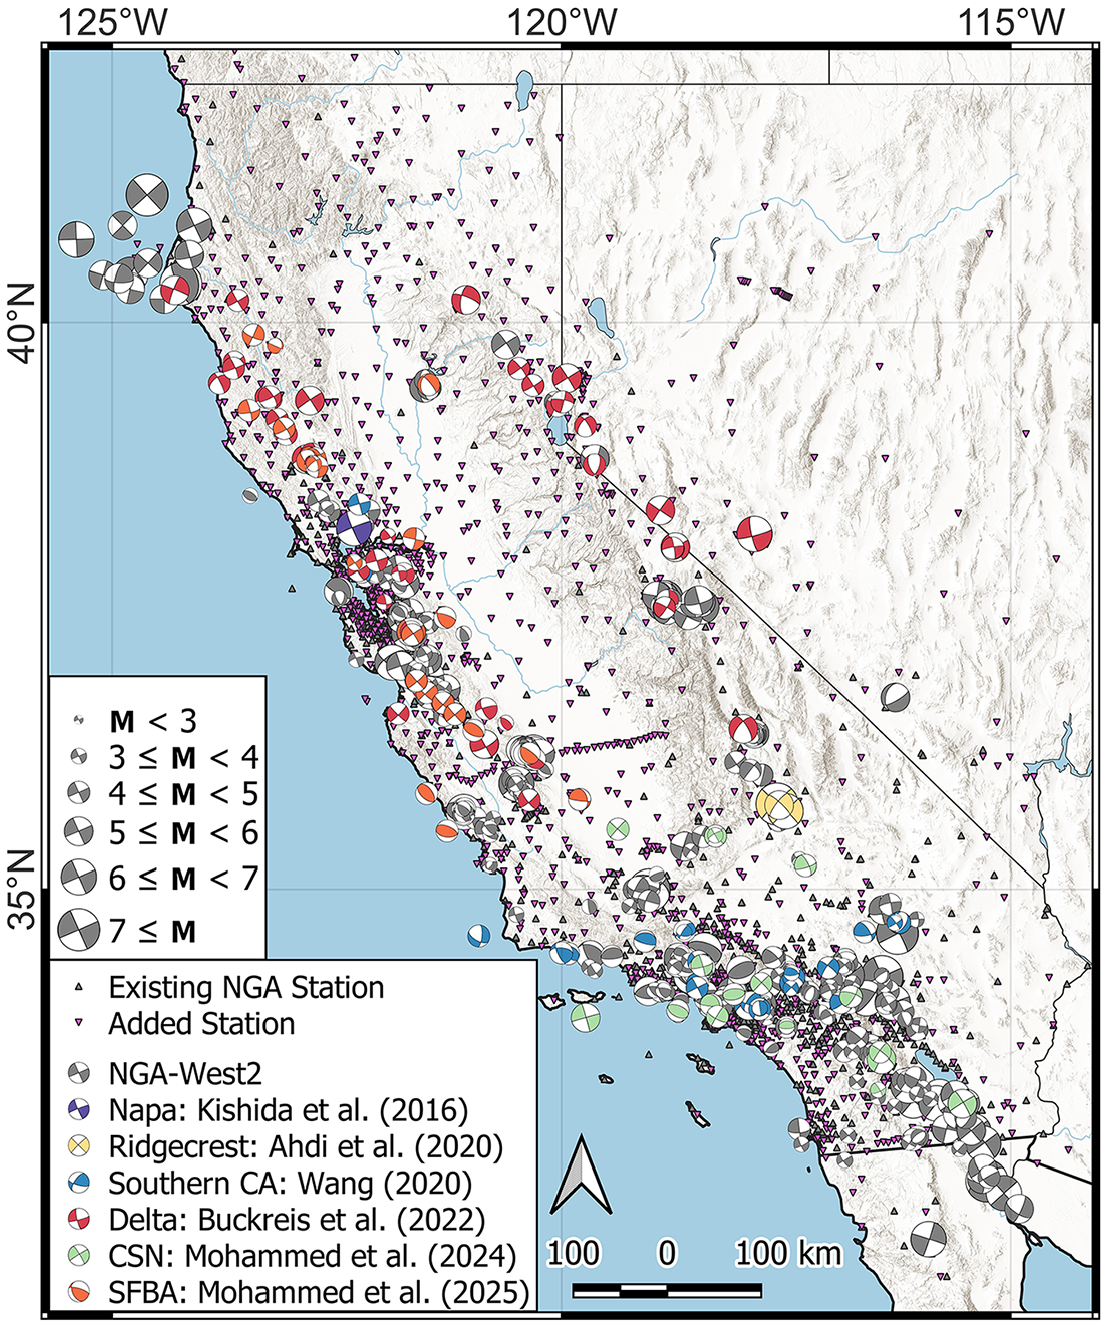
Locations of event focal mechanisms and stations in California and neighboring states. Symbol colors represent different studies as shown in the legend.
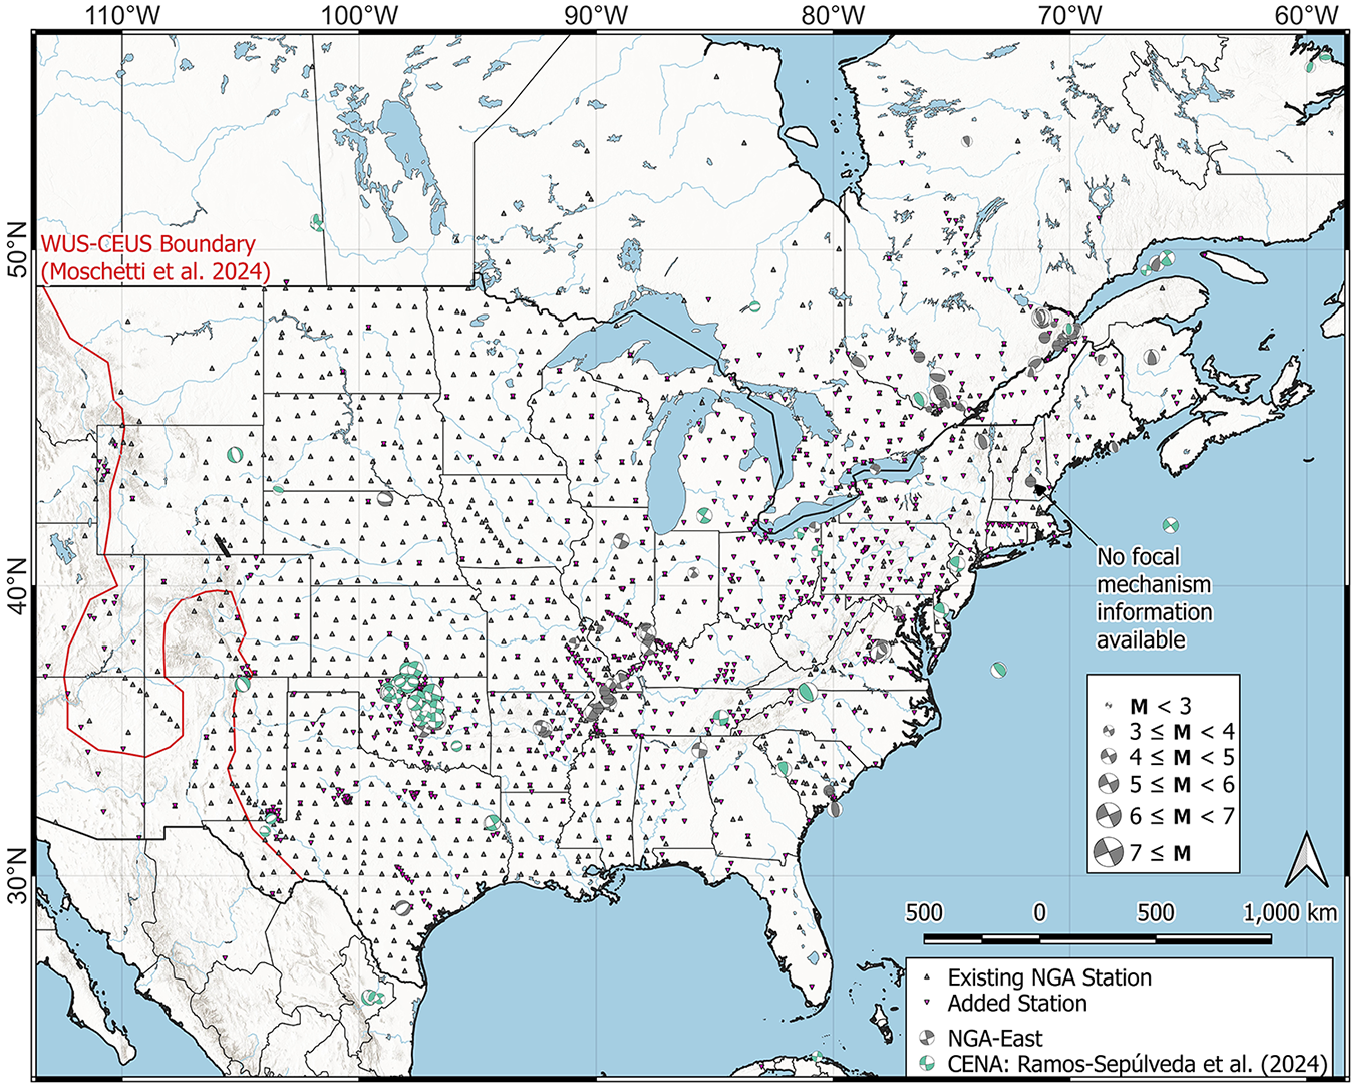
Locations of event focal mechanisms and stations in Central and Eastern North America (CENA). Symbol colors represent different studies as shown in the legend. Boundary between Western United States (WUS) and CENA given by Moschetti et al. (2024).
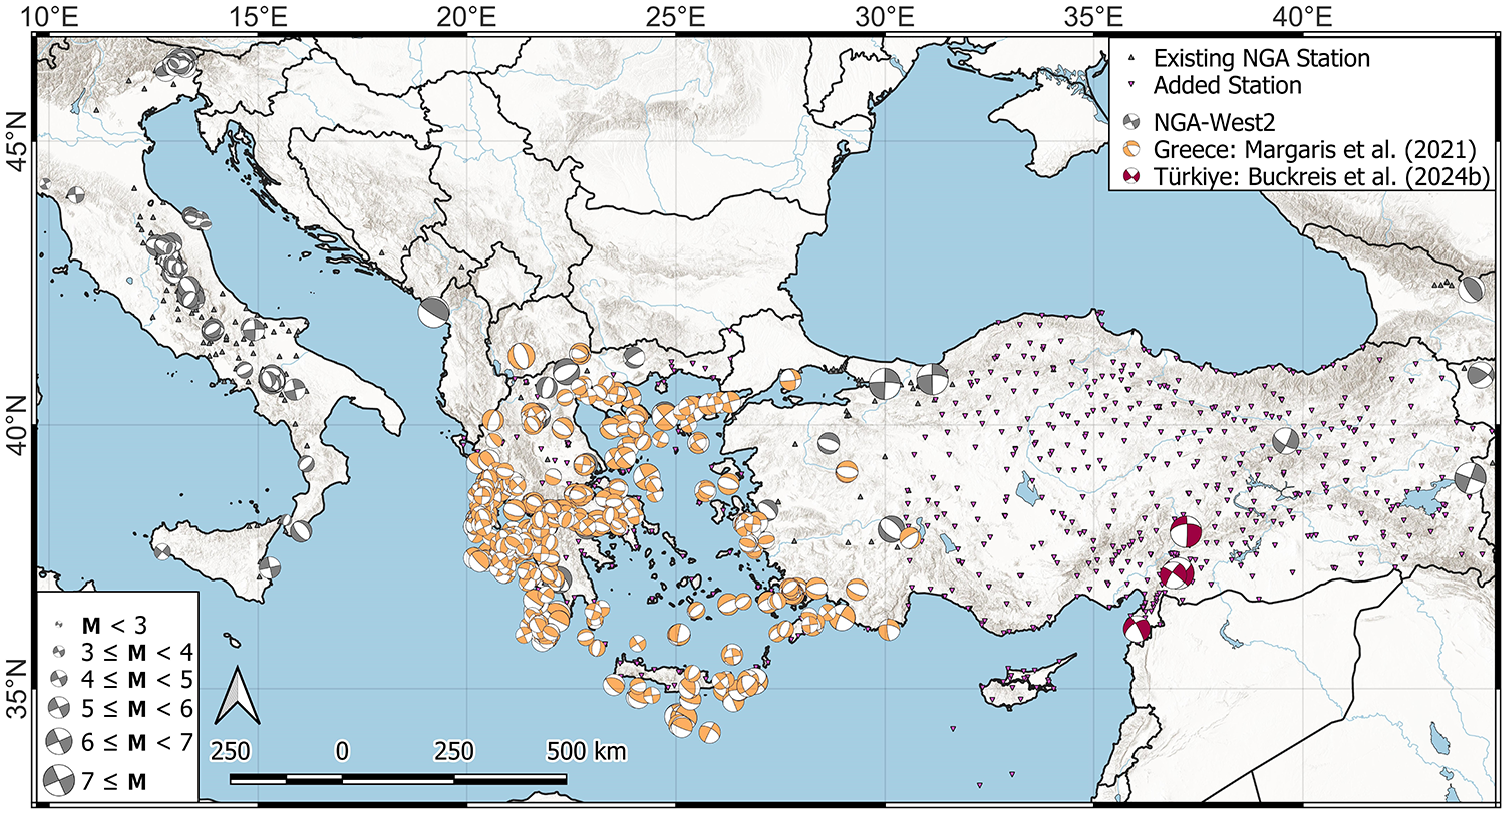
Locations of event focal mechanisms and stations in the Mediterranean. Symbol colors represent different studies as shown in the legend.
Raw time-series records for all available stations for each U.S. event were obtained from the Incorporated Research Institutions for Seismology (IRIS; Trabant et al., 2012) or directly from seismic network operators. Records from events in and around California were cross-checked against those available from the Center for Engineering Strong Motion Data (CESMD) data repository maintained by the California Strong Motion Instrumentation Program (CSMIP) (https://www.strongmotioncenter.org/) and those from the California Department of Water Resources (DWR) seismic network. Buckreis et al. (2024b) obtained waveforms from the Earthquake Data Center System of Türkiye (TDVMS; https://tdvms.afad.gov.tr/) and IRIS. For all regions, data screening was performed to remove apparently unreliable and duplicated records, which may exist due to multiple collocated instruments at a site. In the event of collocated accelerometers and seismometers with meaningful recorded signals, which occurred for portions of the data processed by Kishida et al. (2014), Ahdi et al. (2020), Wang (2020), Buckreis et al. (2022), Buckreis et al. (2024b), Ramos-Sepúlveda et al. (2024), and Mohammed et al. (2024), we preferred the motion recorded by the seismometer unless there is evidence of amplitude clipping, in which case the time-series recorded by the accelerometer is used. In the case of data prepared by Mohammed et al. (2025), and anticipated future efforts, the motion with the widest usable bandwidth as a function of corner frequencies selected during signal processing and sampling rate are preferred.
Each record component was processed individually according to standard protocols developed within NGA projects (e.g. Goulet et al., 2021). In the case of the records assembled in Ahdi et al. (2020), Wang (2020), and Buckreis et al. (2022, 2024b), signal processing was performed manually in R (R Core Team, 2022) using a processing code developed during NGA-West2 (Ancheta et al., 2014). The records assembled by Ramos-Sepúlveda et al. (2024) and Mohammed et al. (2025, 2024) were processed semi-automatically using a version of gmprocess (Thompson et al., 2025) that automatically adjusts high-pass corner frequencies to remove displacement artifacts and includes a manual review using a tool that allows corner frequencies to be adjusted or records to be rejected (Ramos-Sepúlveda et al., 2025). Because every record is reviewed and potentially adjusted by an analyst, the manner in which we have used gmprocess is equivalent to the NGA processing procedure, but is significantly more efficient because the automated selections made by gmprocess often agree with analysts’ judgments. Both the manual and semi-automated methods consider SNR of the windowed Fourier amplitude spectra (FAS), assess the displacement trace in the time domain, and assess the shape of the pseudo-acceleration response spectrum to select high- and low-pass corner frequencies applied using acausal Butterworth filters. The high-pass corner frequencies selected using gmprocess are lower on average than those selected manually, which can affect long-period response spectral ordinates (e.g. Section 3.2.3.2 of Kramer and Stewart, 2025).
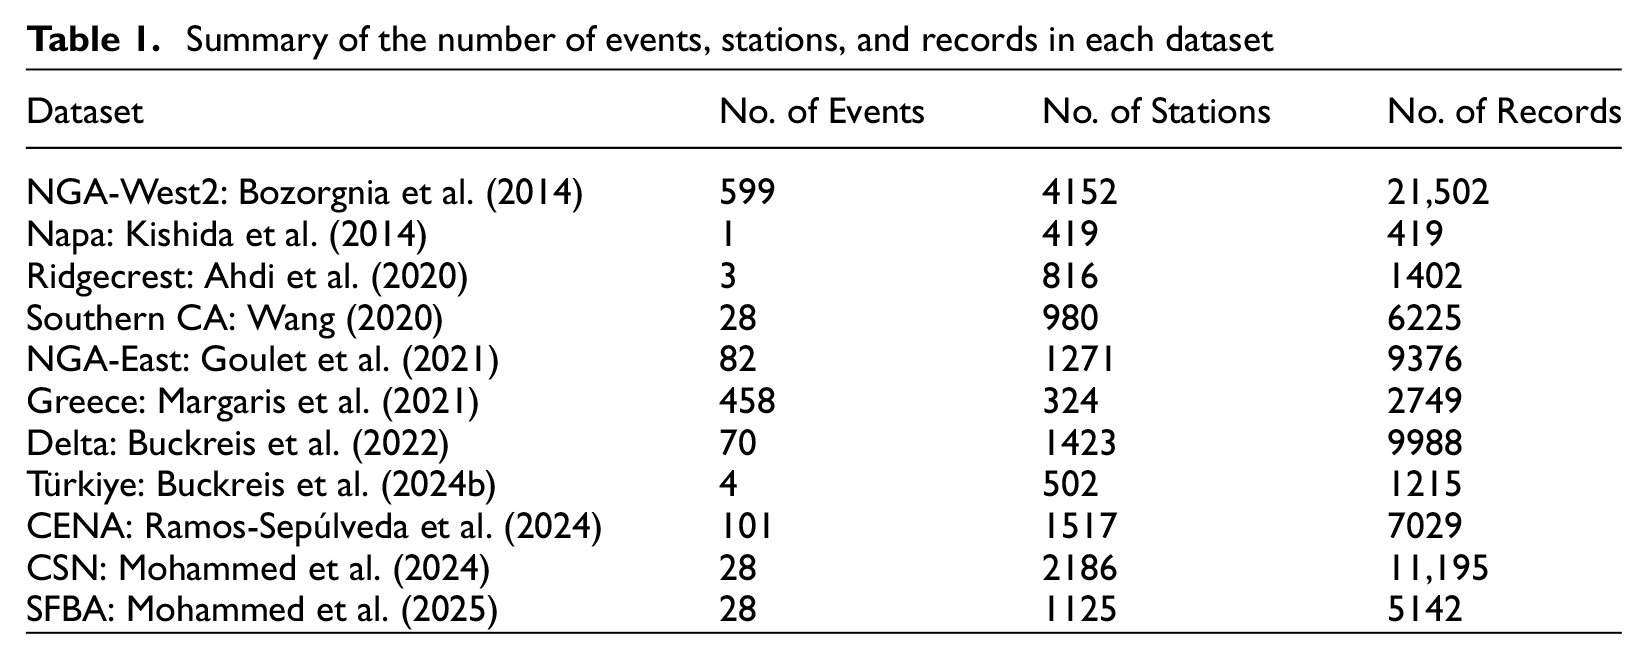
In total, we processed 34,371 records in California, 7029 records in CENA, and 1215 records in Türkiye as summarized in Table 1. The distribution of these data with respect to
Summary of the number of events, stations, and records in each dataset
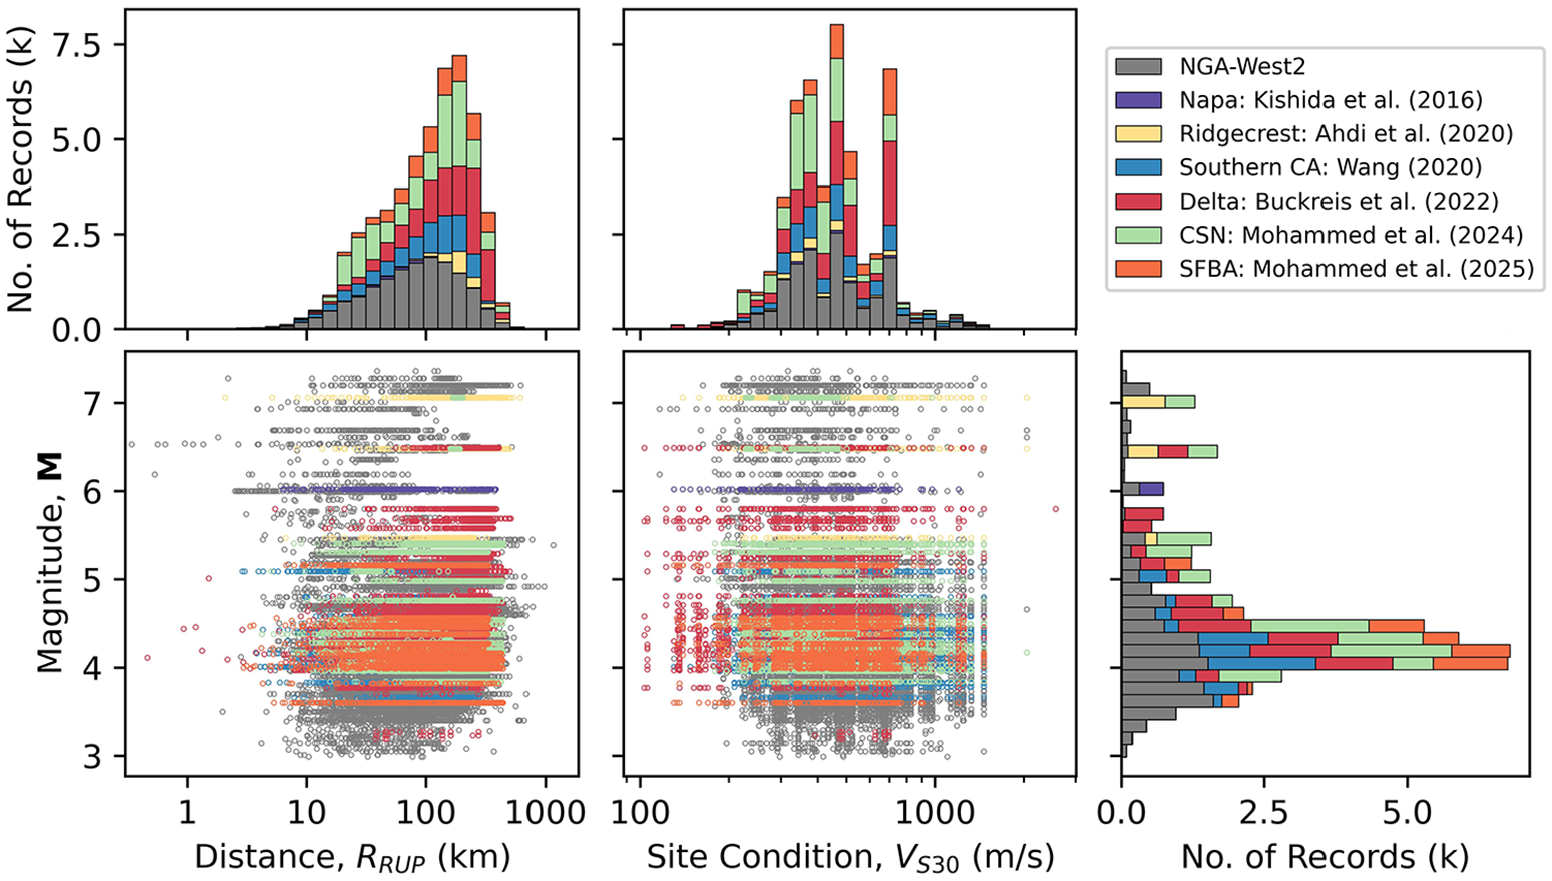
Data distributions for California and neighboring states with respect to magnitude (
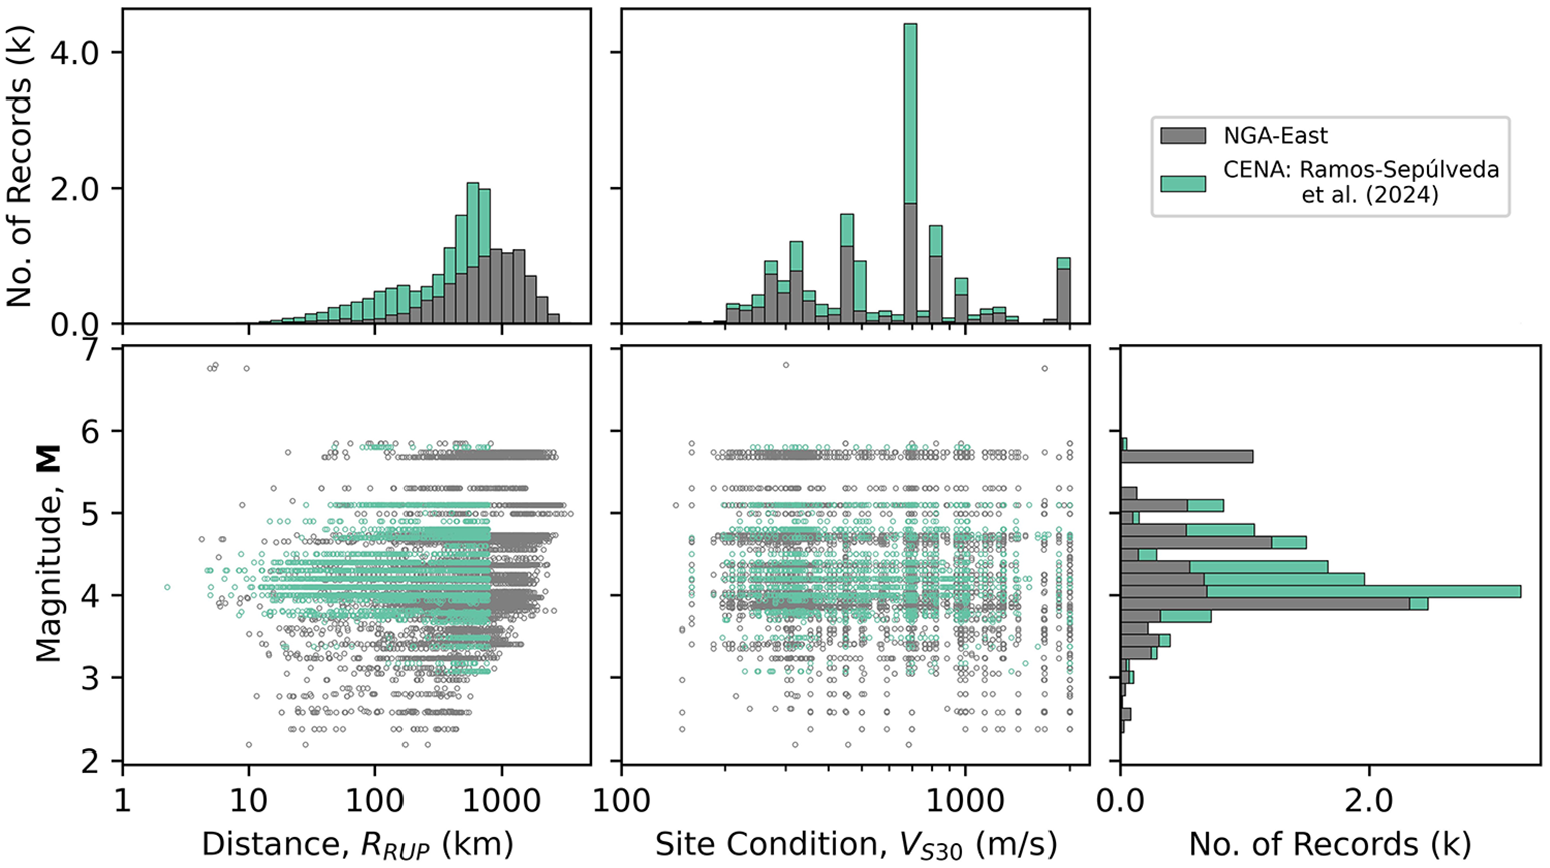
Data distributions for CENA with respect to
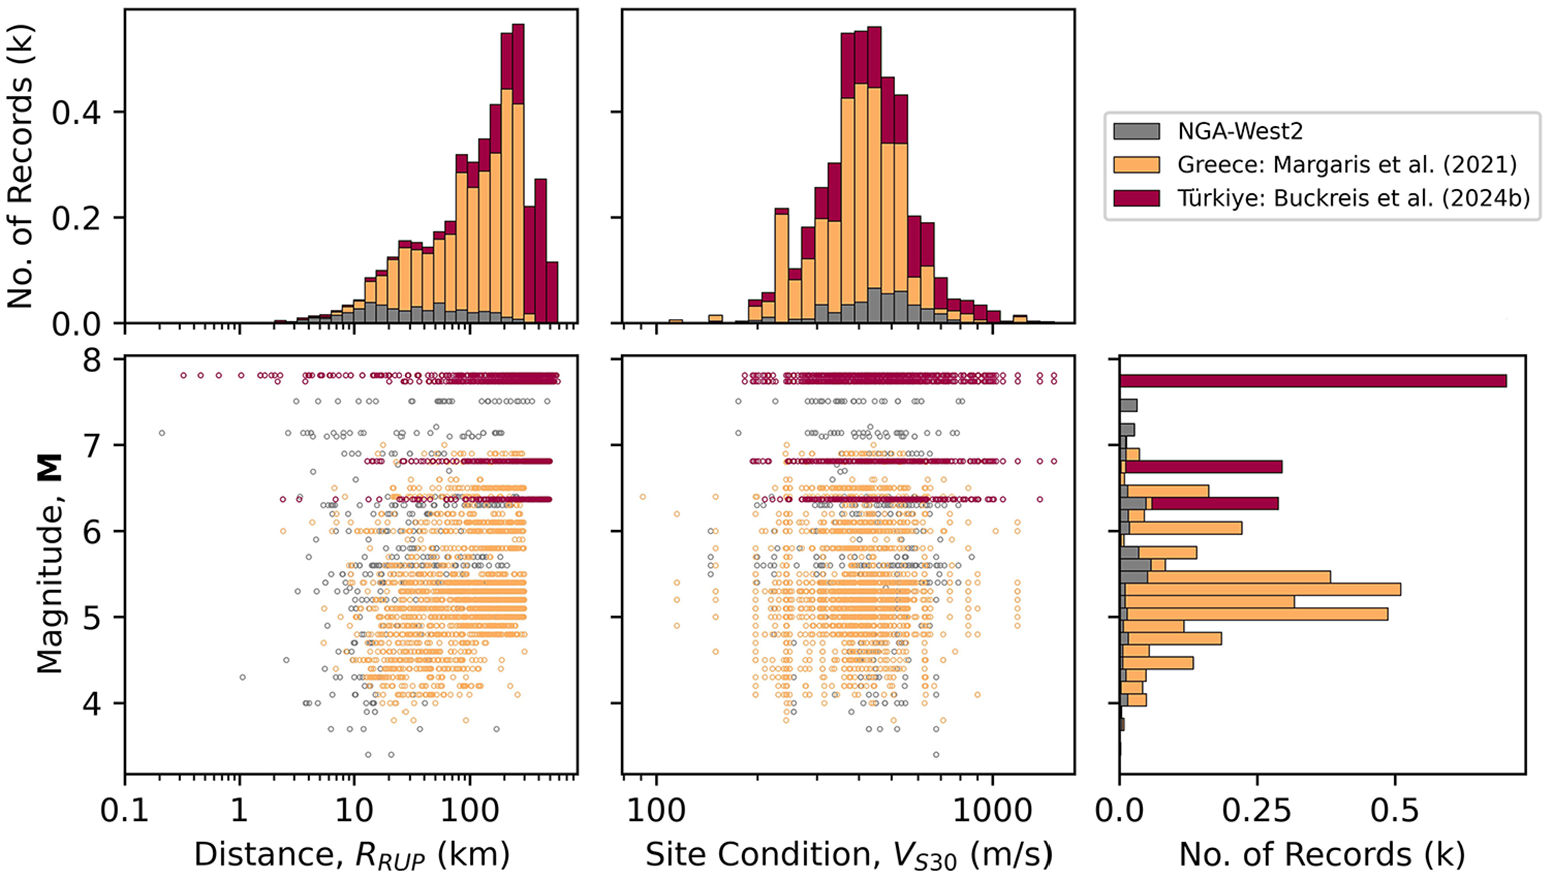
Data distributions for the Mediterranean region with respect to
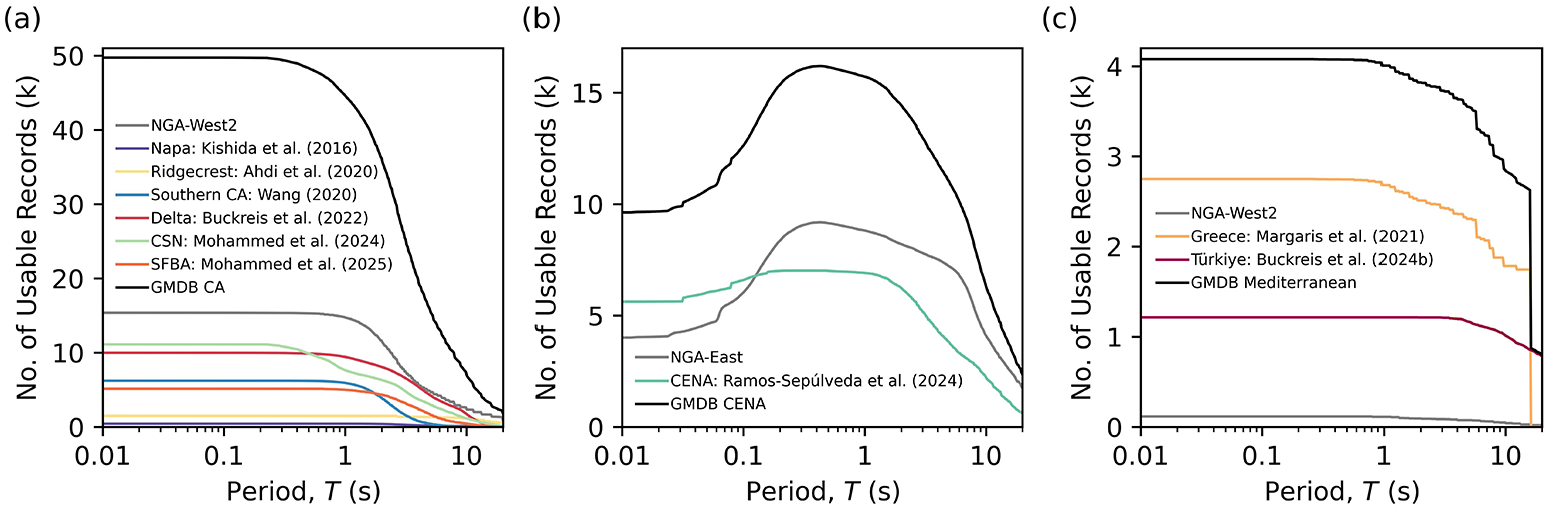
Number of usable ground motion as a function of period for (a) California and neighboring states, (b) Central and Eastern North America (CENA), and (c) Mediterranean region.
Intensity measures
Intensity measures (IMs) are parameters computed from ground motion time-series and are commonly used to quantify certain engineering attributes of ground motions. NGA databases typically include peak IMs such as peak ground acceleration (PGA) and peak ground velocity (PGV), 5%-damped pseudo-spectral accelerations (PSA) for 111 oscillator periods between 0.01 and 20 s, Arias Intensity (IA; Arias, 1970), and times corresponding to select percentiles of IA used to facilitate calculation of significant durations (IA-times). NGA-Sub and NGA-East expanded the selection of IMs to include Equivalent Amplitude Spectra (EAS), which combines the two horizontal components of FAS along with smoothing and downsampling (Kottke et al., 2021). Other IMs include the cumulative absolute velocity (CAV; Electrical Power Research Institute (EPRI), 1988) and the CAV computed on acceleration time histories considering a threshold of 5 cm/s2 (CAV5; Kramer and Mitchell, 2006).
In the present dataset, all IMs excluding EAS are calculated for individual components (two orthogonal-horizontal and one vertical) as well as the combined horizontal minimum-, median-, and maximum-component (RotD0, RotD50, and RotD100, respectively) defined by Boore (2010). PGA, PGV, and PSA are obtained using the RCTC package in R (Wang et al., 2017). IA, IA-times, CAV, and CAV5 are computed using Python codes validated against NGA codes. EAS is calculated using Python routines consistent with Kottke (2020). PSA are computed at 111 oscillator periods between 0.01 and 20 s, and EAS are computed at 390 frequencies between 0.01318257 and 102.3293 Hz (100 points evenly log-sampled per decade). These periods and frequencies correspond to the standard values incorporated into NGA database products.
Metadata
The ground motion data discussed in the previous section are most useful when accompanied by source, path, and site parameters. These parameters are associated with each individual ground motion, and are required for model development and for time-series record selection for use in response history analyses and other research studies and engineering applications. This section presents the sources of metadata and the methods used to assign metadata to records, sites, and earthquakes. These methods incorporate approaches for resolving conflicts between metadata contained in the original NGA datasets in some cases.
Seismic-source parameters
Seismic-source parameters include origin date and time, hypocenter coordinates (longitude, latitude, and depth), seismic moment,
Parameters that describe the fault rupture surface as one or more rectangles (upper-left corner coordinates and dimensional length and width) are necessary to calculate source-to-site distances. Finite-fault solutions are often formulated for large magnitude events based on inversion of recorded surface motions. Of the post-NGA events in the GMDB, only the
FFMs for the remaining events were generated using the simulation procedure described in Contreras et al. (2022), performed using an updated version of the program originally developed by Chiou and Youngs (2008). This algorithm generates a stochastic set of possible rupture surfaces given the available source metadata, and selects the most probable surface that does not result in atypically short or long finite-fault distances for any given site. We re-coded the procedure for use in Python (Buckreis, 2024) and updated the procedure to include
Site / station parameters
We distinguish sites from stations because stations include information about instruments and networks that may change over time, whereas site data are constant. Furthermore, multiple stations may be installed at the same site, and separating them avoids duplication in data entry. Site parameters include location (latitude, longitude, and elevation), topographic slope, terrain class, surficial geological unit, recommended VS30, and depth parameters z1.0 and z2.5 which represent depths to VS of 1.0 and 2.5 km/s, respectively. A 30 arc-sec digital elevation model from Farr and Kobrick (2000) was used in QGIS to assign terrain class defined by Iwahashi and Pike (2007) and Iwahashi et al. (2018). Geological units for sites within California were assigned from Wills et al. (2015), sites in Oregon, Nevada, and Utah were assigned units from local geologic maps (Biek et al., 2010; Ludington et al., 2005; Rowley et al., 2006; Smith and Roe, 2015), and sites across CENA were assigned using the suite of geologic maps applied for VS30 assignments by Parker et al. (2017) (individual citations are provided in https://doi.org/10.17603/ds2-w0zm-y670).
VS 30 values were assigned according to the following order of preference:
Computed from a nearby (<150 m; same geology) measured VS profile to a depth (zp) of at least 30 m.
Estimated using the depth extrapolation relationship of Dai et al. (2013) with region-specific regression coefficients from Kwak et al. (2017a) when a nearby shallow measured VS profile exists (zp < 30 m).
Estimated using regional VS30 proxy-based relationships (e.g. peat-thickness proxy model for sites located in the Delta, described in Buckreis et al., 2025a).
Estimated using a weighted combination of Kriging-interpolated (Thompson, 2018), slope- (Wald and Allen, 2007), terrain- (Yong et al., 2012), and/or geology-based proxy models as described in Wang (2020).
Geology-based VS30 proxy models exist for California (Wills et al., 2015), Oregon (Ahdi et al., 2017), Utah (Choi, 2024; McDonald and Ashland, 2008), and CENA (Parker et al., 2017); however, no models are published for Nevada, where a significant number of new sites are located. Given the relative proximity of most Nevada sites to California, we relate geologic units given by Ludington et al. (2005) to counterparts in Wills et al. (2015) and observed good agreement at the border between California and Nevada with respect to the continuity of mapped units. On this basis, geology-based VS30 estimates from Wills et al. (2015) were applied to Nevada sites. Because most of the VS measurements in Nevada use the ReMi method (Louie, 2001), which is not considered to be reliable over the depth range considered for VS30 (Cox and Beekman, 2011), we are unable to validate that the median values reported by Wills et al. (2015) are suitable for mapped units in Nevada. Given the proximity and continuity of mapped units and the fact that geological properties are not expected to change based on political boundaries, we consider the assignments to be appropriate.
Following the hierarchy above, some sites from the NGA-West2 and NGA-East projects were updated in cases where a measured VS30 became available after the NGA data collection effort concluded. Measured VS profiles were accessed from the VS profile database (e.g. Kwak et al., 2021) and measured VS30 values were obtained from the USGS VS30 compilation (McPhillips et al., 2020). NGA-West2 had 391 sites in California with measured VS30 values, whereas the updated California GMDB subset contains 847 sites with measured VS30 values. Similarly, the number of sites in CENA with measured VS30 values has grown from 77 in NGA-East to 134 in the GMDB. Fig. 9 presents the distribution of VS30 values partitioned by assignment method (i.e. measured vs proxy-based) and geographic region.
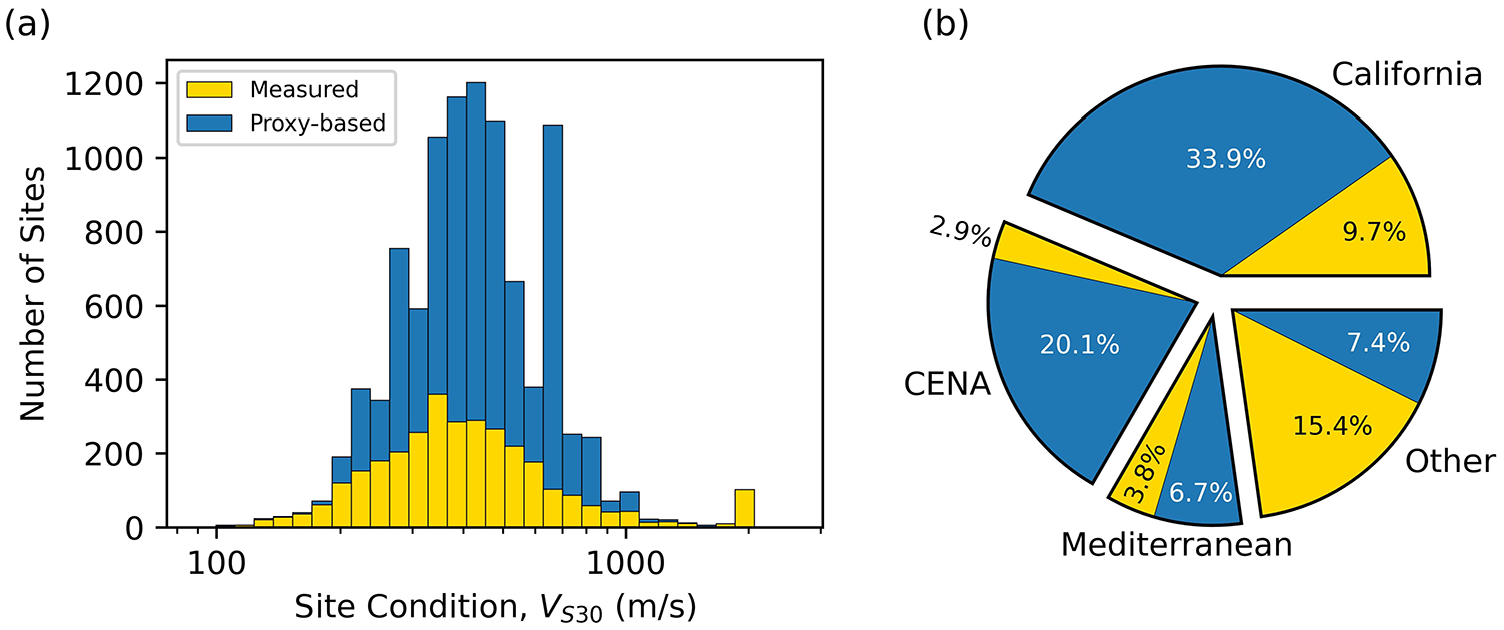
(a) Distribution of VS30 partitioned by assignment method (computed from a measured VS profile or estimated using proxy-based models); (b) distribution of measured and proxy-based VS30 assignments in different regions.
Shear-wave isosurface depth parameters (z1.0 and z2.5) were obtained from the most recently published seismic velocity models for sites located in Quaternary basins in California and the rest of the WUS (Aagaard and Hirakawa, 2021; Boyd 2022; Lee et al., 2014; Shaw et al., 2015; Magistrale et al., 2008). Sites located within the modeled domain of more than one model are assigned multiple depth values for each depth term. For California sites located outside of basins, generally having Pleistocene, Tertiary, or Mesozoic surficial deposits, a geology-based model was applied to estimate z1 (Shams et al., 2025). Non-California sites located outside of the domains of seismic velocity models are not assigned isosurface depths. For CENA, isosurface depth parameters are not available as in the WUS, but sediment-depths relating to the thickness of sediments above basement rocks in the Atlantic and Gulf coastal plains are available from Boyd et al. (2024) and are provided in the GMDB.
Station parameters include station name, location, the network and station codes specified by the Standard for the Exchange of Earthquake Data (SEED) (IRIS, 2012), station type/housing (i.e. free-field vs in a structure), sensor depth, installation and removal dates, and information about the network that operates the station. Station locations were compared among the NGA flatfiles, IRIS, NCEDC, CESMD, and the Southern California Earthquake Data Center (SCEDC) housed at Caltech. For nearly all stations, locations agreed well and data from the catalog with the most significant digits was adopted. In some cases, the station parameters were different among the different sources of information, and were handled on a case-by-case basis using a semi-automated procedure to resolve the conflicts. Stations spaced within 1 km of each other (or ∼0.01° in coordinate precision) were flagged as initial candidate duplicate stations. These stations were then further screened based on similarity of station code and station name using fuzzy logic. Fuzzy logic assigns values ranging from zero to one, which represent completely false or completely true, respectively (Zadeh, 1988). “Fuzzy string matching” is an application of fuzzy logic with the goal of identifying strings that approximately match a pattern. Using the fuzzywuzzy package in Python (Inc, 2014), this approach assigns similarity scores to pairs of station codes and names for potential matches. A normalized aggregate score is computed as the sum of individual scores divided by two, and represents the degree to which two stations can be considered a match. We found that stations with an aggregate score larger than 0.85 and separation distances less than 0.2 km (∼0.002° coordinate precision) generally corresponded to matching stations, and were flagged as such. Pairs with low aggregate scores (i.e. lower than 0.15) and separation distance larger than 0.5 km are considered distinct. The remaining pairs were sorted by aggregate score in descending order and screened manually. The same semi-automated procedure was utilized to ascertain whether the ground motions processed by the authors were from new stations, or from existing stations in NGA databases. Using this approach, 9927 seismic stations were deemed to be unique after unifying the eleven datasets. This process corrected errors in the NGA-West2 database in which stations had previously been separated and are now aggregated (e.g. Tarzana—Cedar Hill (station sequence number, SSN 340) and Tarzana—Cedar Hill A (SSN 341), which recorded different earthquakes, but are the same station (CE 24436)).
In addition to screening for duplicate stations, the aforementioned approach was adapted to assign networks (and their associated network codes) to the majority of NGA-West2 stations, because this information was not always accurately recorded. The motivation for this effort arose from the fact that it is easier to screen for duplicate stations when their unique network and station SEED code combinations, as defined by the International Federation of Digital Seismograph Networks (FDSN), are available. This process will need to be undertaken each time new data are added. We are able to assign networks to all but 94 NGA-West2 California stations by comparing NGA-West2 station metadata to all available California stations downloaded from IRIS, NCEDC, SCEDC, and CESMD. We suspect most of these 94 stations to be older-decommissioned stations that will not produce data in the future.
Path parameters
Site-to-source distances are calculated between station locations and one or more finite-fault segments used to represent the rupture surface using P4CF (Chiou, 2021). Distance metrics include RRUP, closest distance from the site to any point on the surface projection of the rupture surface (RJB), distance measured perpendicular to the fault strike from the surface projection of the top edge of the rupture surface (Rx), distance measured parallel to the fault strike from the midpoint of the surface projection of the rupture surface (Ry), the average distance to the fault plane (Ravg; Chiou et al., 2000; Ohno et al., 1993), the epicentral distance (Repi), and the hypocentral distance (Rhyp). In addition, P4CF provides the coordinates (longitude, latitude, and depth) of the closest point on the rupture surface to each site.
Relational database
The objective of the work presented herein is to develop a web-served publicly accessible relational database that users can query. Motivation for a web-served relational database is driven by three factors:
Users often desire specific fields of data that can be accessed by targeted queries rather than having to download undesired data.
The relational structure improves data/metadata integrity by avoiding repetition of data entry that would be required if all metadata were stored in a single table (e.g. site parameters for different recordings made at the same site) (Krüger, 2004).
Indexes can make database searches faster than input / output operations on local files.
The relational database utilizes the MySQL InnoDB storage engine and can be queried using Structured Query Language (SQL). Fields have predefined data types that include numeric (e.g. “INT,”“FLOAT,” etc.), temporal (e.g. “DATE” and “DATETIME”), or string types (e.g. “VARCHAR,”“MEDIUMTEXT,” etc.), which ensures data integrity by only allowing entries conforming to valid formats. This section describes the database structure, the reasoning for its organization, and other elements developed to help users access the data.
Database structure
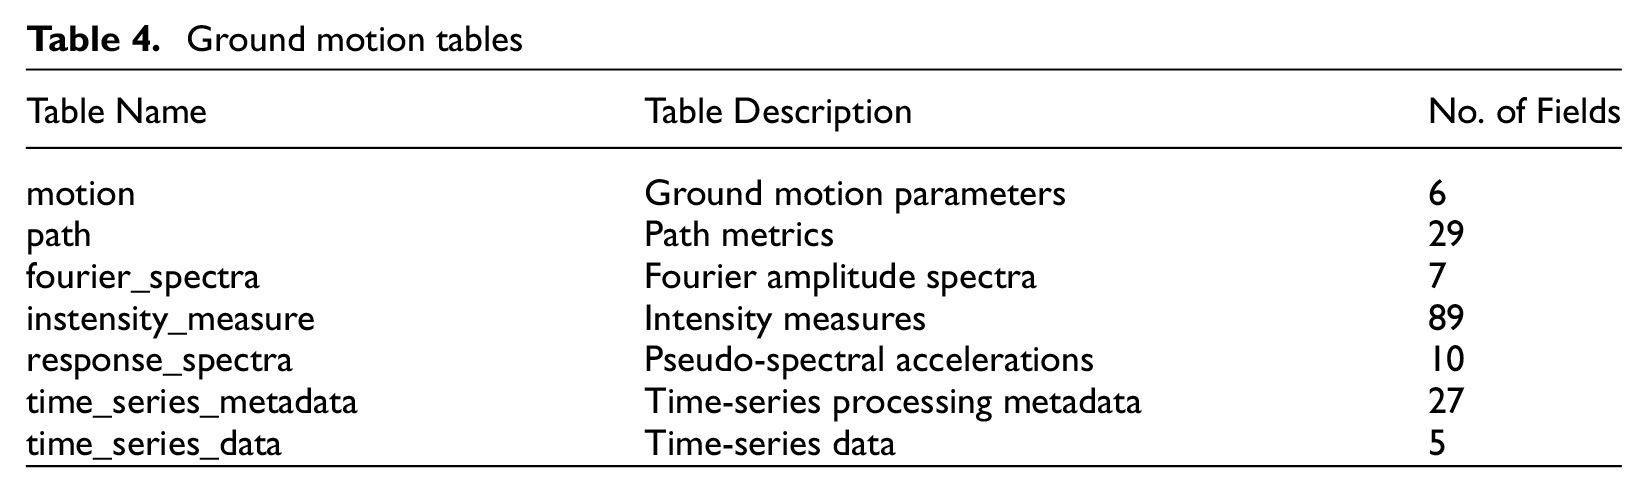
The organizational structure of the database—the schema—defines the tables, fields, and relationships among the tables in the database. The current GMDB schema contains 32 tables that can be broadly grouped into five categories: event, site/station, ground motion, auxiliary, and junction. A list of table names in each group is provided in Tables 2 through 6. A diagram depicting the tables and their relationships is presented in Fig. 10. Linkages between tables are identified by shared fields called “keys.” A primary key consists of one or more fields that uniquely identify a table entry, and a foreign key is one or more fields in a separate table that identify the entry in the table containing the corresponding primary key. For example, network_id is the primary key in the network table and a foreign key in the station table to identify that a particular station is associated with a particular network.
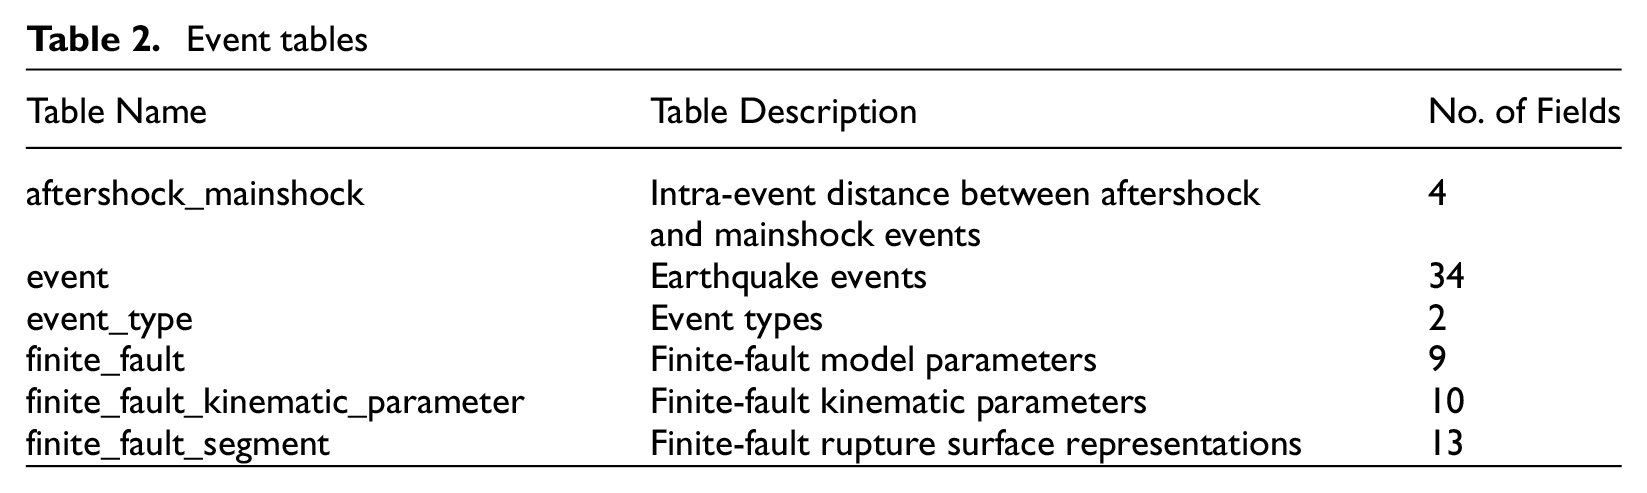
Event tables
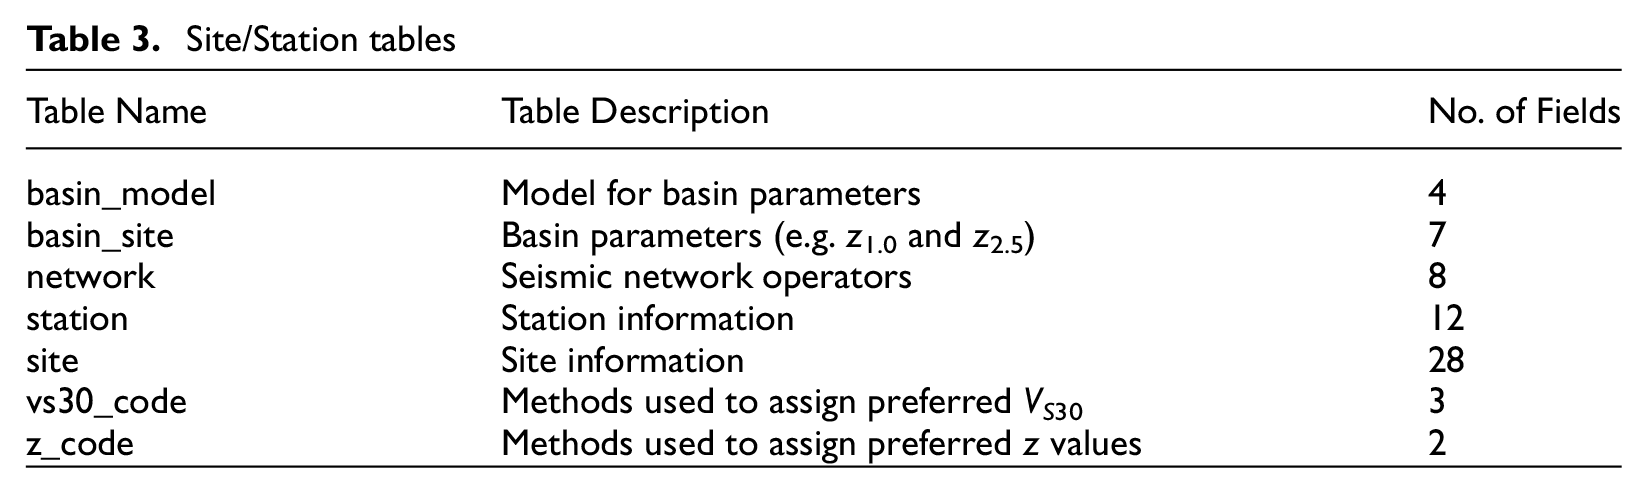
Site/Station tables
Ground motion tables
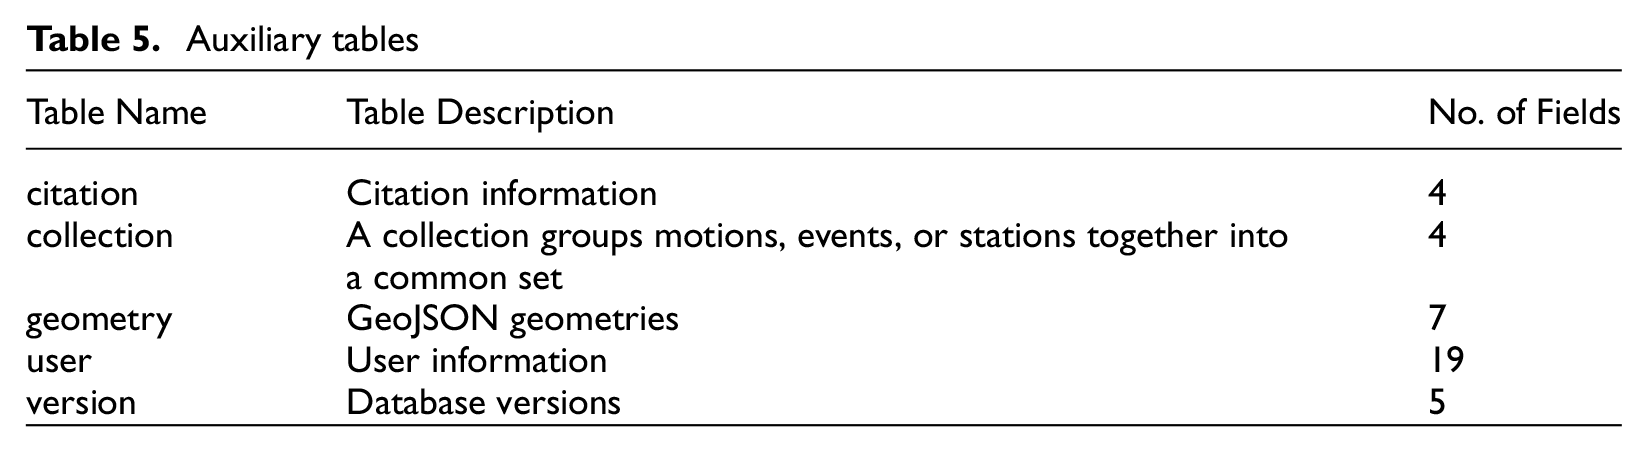
Auxiliary tables
Junction tables
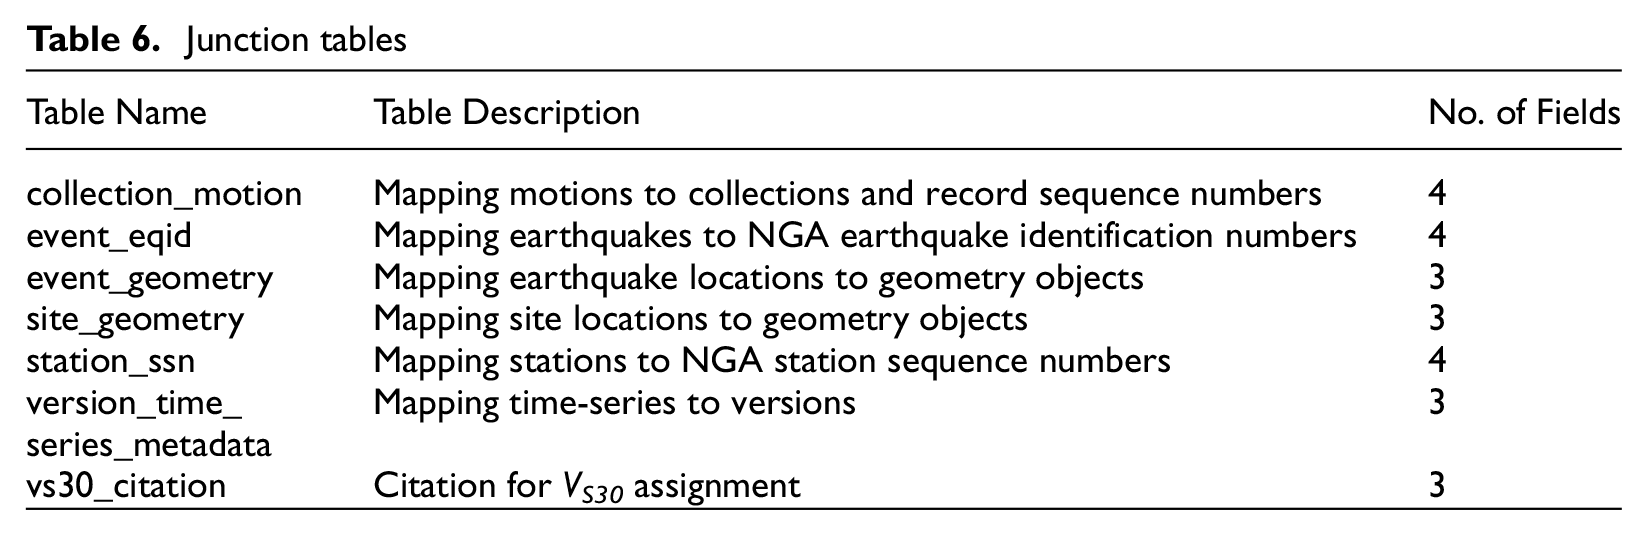
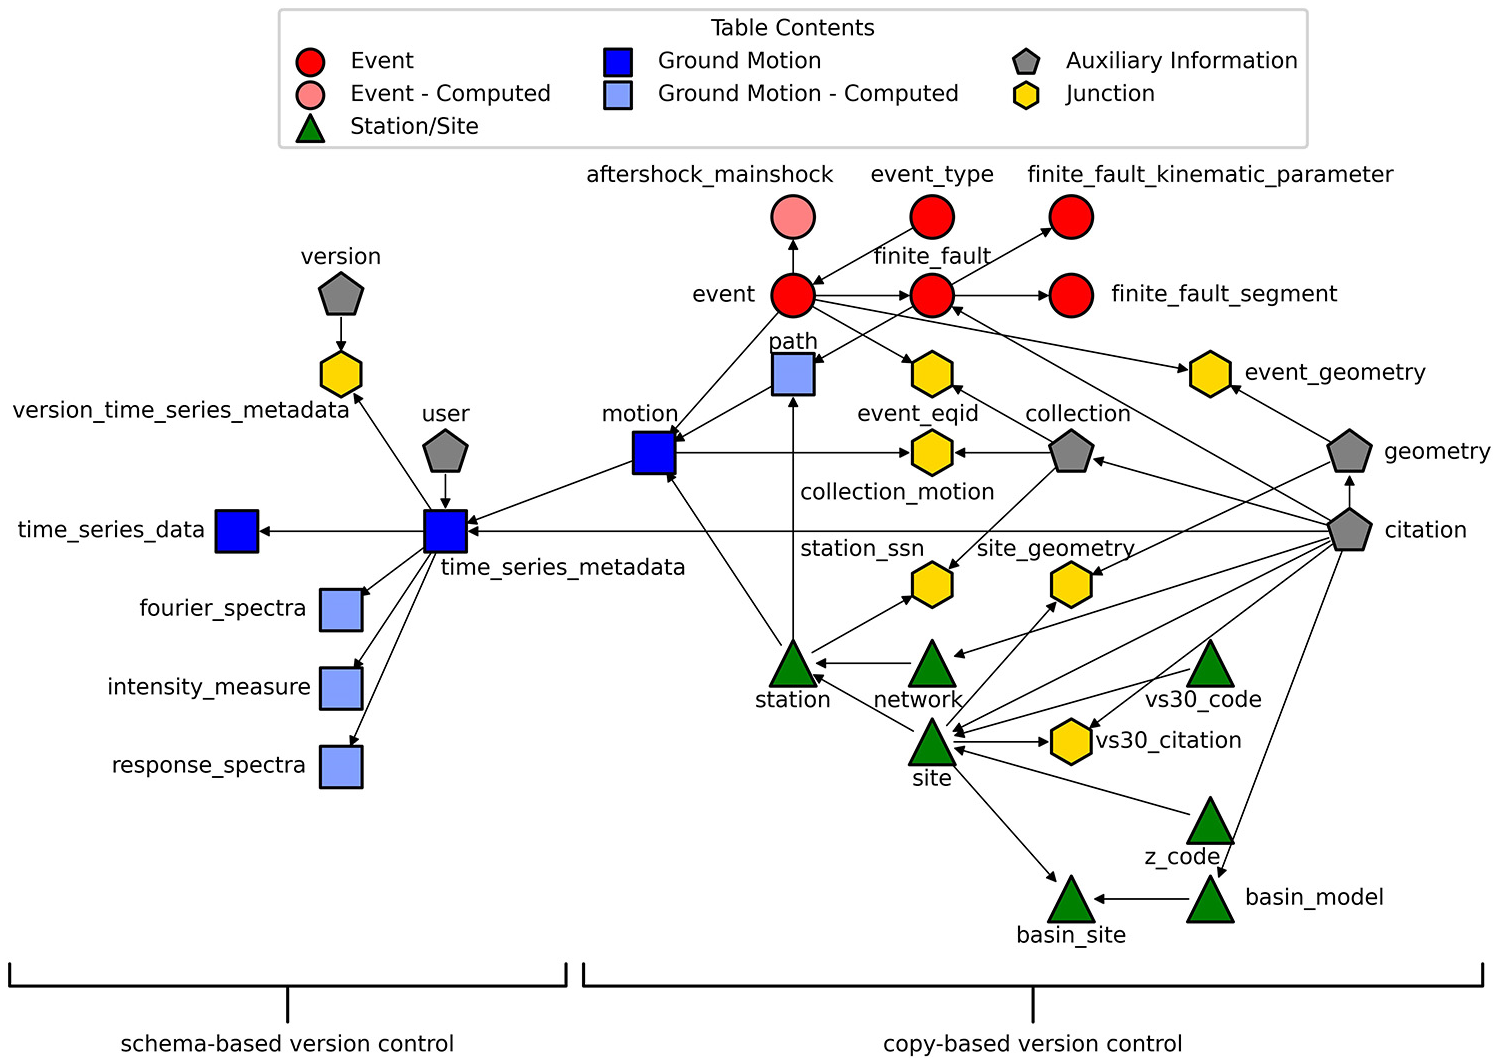
Diagram of simplified GMDB schema depicting primary and foreign key relationships; symbol colors and shapes indicate the nature of the table contents; lighter shades (e.g. path table) indicate tables whose contents are computed from values stored in other tables. Arrow direction indicates direction of foreign key dependency (e.g. event_id, path_id, and station_id are foreign keys in the motion table).
The GMDB utilizes indexed integer primary and foreign keys that are automatically assigned each time a new entry is inserted into the database. Using single integer keys facilitates simpler SQL queries when tables are joined, but does not inherently enforce uniqueness of the combination of fields that define a unique entry (which is inherent to composite keys consisting of multiple columns). We separately require certain combinations of fields to be unique using the UNIQUE INDEX option in MySQL. For example, the combination of network_code and network_name must be unique in the network table when a new network is inserted into the database. A complete description of all of the fields in each table is too lengthy to document here, but is provided at Buckreis et al. (2023a) (https://doi.org/10.34948/G4RP4K). Pertinent details about each table are included in the subsections below.
Event tables
Event metadata are organized into six tables: event, finite_fault, finite_fault_segment, finite_fault_kinematic_parameter, aftershock_mainshock, and event_type. The event table stores the most common earthquake-related metadata, including event name, hypocenter location, origin time,
Rupture surface representations and associated data for each event are stored in the finite_fault, finite_fault_segment, and finite_fault_kinematic_parameter tables. The finite_fault table stores general rupture surface information including the total length, width, area, and depth to top of the rupture model, as well as an integer FFM field which takes the value of “1” if the representation is derived from a published FFM, or “0” if the rupture surface is simulated as described earlier. The finite_fault table is connected to the event table via the event_id foreign key. Although it is possible for several FFM representations to exist for a single event, the GMDB presently only records information derived from the preferred model as selected using the approach described in Contreras et al. (2022). The location and geometric properties of each rupture surface are stored in the finite_fault_segment table, and are linked to the finite_fault table via the finite_fault_id foreign key. Fault ruptures may be represented by multiple segments; therefore, the finite_fault_id foreign key represents a “one-to-many” relationship, meaning that one finite_fault entry can be related to multiple finite_fault_segment entries. Kinematic parameters including average fault displacement, average slip velocity, and more are stored in the finite_fault_kinematic_parameter table for events with published FFMs.
The aftershock_mainshock table stores data which can be used to identify aftershocks that re-rupture the mainshock fault plane or occur within the damaged zone within a time window for aftershocks (i.e. “Class 2” events) (Wooddell and Abrahamson, 2014). Inclusion of event classes facilitates investigations of ground motion differences between “Class 1” events (mainshocks, foreshocks, triggered events, and off-plane aftershocks) and Class 2 events (e.g. Abrahamson et al., 2014; Boore et al., 2014; Campbell and Bozorgnia, 2014). The table functions as a junction table between two events in the event table, where event_id corresponds to the event_id of the Class 2 event and mainshock_event_id is the event_id of the corresponding Class 1 event. The shortest distance between the surface projection of the centroid of the rupture surface of the trial aftershock and the closest point on the edge of the surface projection of the mainshock rupture surface (CRJB) is stored in the crjb field. Only pairs of events which occur within the Gardner and Knopoff (1974) time window are considered, all others are assumed to be Class 1. Users distinguish Class 1 and Class 2 events in the aftershock_mainshock table by comparing CRJB with a specified threshold distance of their choosing (e.g. CRJB < 15 km can be used to suggest Class 2; Ancheta et al., 2013).
The event_type table specifies whether the tectonic regime is shallow crustal, subduction interface, subduction intraslab, outer-rise, induced, stable continental, or undetermined. In previous NGA projects, separate databases were organized for different tectonic regimes. However, the GMDB has been organized with anticipation of storing data from all three NGA databases in a single centralized location. We recognize that GMMs must be derived separately for different tectonic regimes, and that including data from multiple regimes marks a departure from past practices. However, there are benefits to combining them—for example, site and station data are unaffected by earthquake type, and therefore can be entered once for a given station and used for all event types. The alternative would be multiple databases with repeated entries, which introduces potential data integrity problems. For example, VS30 might be updated at a site in one database, but not in another, leaving users wondering which is more trustworthy.
Site / station tables
Station and site metadata are organized into seven tables: network, station, site, vs30_code, z_code, basin_model, and basin_site. The network table stores metadata about seismic networks including their name, SEED network code, operator, and operating dates reported by FDSN. The network_id is used as a foreign key in the station table, which contains information about individual stations including the name, SEED station code, station type/housing (e.g. free-field vs structure), depth, and location. The primary key in the station table is station_id. We considered but ultimately decided against storing instrument information in the database, such as serial numbers. Our reasons for not including detailed instrument information are (1) the GMDB contains adequate information to find detailed instrument information in IRIS; (2) if we were to scrape those data into our database, there is potential for conflicting information between the two data sources, and IRIS is a better source for this information; and (3) we anticipate that most ground motion modelers will not require this information in their work. We do, however, identify whether a ground motion was recorded by an accelerometer or seismometer.
The site table contains metadata related to the physical attributes of the location of the recording instrument, such as geologic and topographic information. Latitude, longitude, and elevation are also assigned to the site, which are used to populate other metadata fields from published maps. The station table contains site_id as a foreign key to map sites to stations in a one-to-many relationship. Most sites have only one station, so the site location is usually the same as the station location. Exceptions include vertical arrays consisting of two or more stations at the same site, collocated stations operated by different networks (with different SEED network and station codes), and stations spanning different epochs (e.g. decommissioned stations that were replaced by a new station with a different SEED station code). In some cases, VS30 and geologic conditions may vary over short distances, in which case each station may be assigned to its own site. An example is the Borrego Valley Differential Array (Kato et al., 1998), which contains stations spaced at distances as short as 10 m. Measured VS30 values are available at each station location, so a site was created for each station. Similarly, the number of sites may change over time as geophysical / geological data become available. For instance, two stations in a medium sized structure (370–1500 m3), but in opposite corners, are generally considered one site; however, hypothetically, they may be split into two sites if future site characterization deems the site conditions to be significantly different between the two corners.
The site table also records the preferred VS30 value recommended for analysis. The preferred VS30 value is that which best reflects the median estimate as obtained through agreed upon protocols that have evolved over time (e.g. Chiou et al. 2008, Ancheta et al. 2014, Wang 2020, Ahdi et al. 2022). As discussed previously, VS30 may be computed from a measured VS profile or estimated from proxy-based models. The site table includes vs30_code_id to record this type of information. An integer-valued primary key is assigned to each method in the vs30_code table, which is used to populate the vs30_code_id field. The vs30_lnstd field records the uncertainty associated with the preferred VS30 value. The vs30_reference entry provides additional information related to how the preferred VS30 was obtained, such as the reference to the VS profile used to calculate VS30 as indicated by a string containing the data provider and profile identifier (e.g., database name-unique identifier). Current providers of measured-VS information include:
Turkish Disaster and Emergency Management Authority (AFAD): AFAD—network-station code
CESMD: CESMD—network-station code
NGA-West 2 flatfile: NGAW2—ssn
NGA-East flatfile: NGAE—ssn
USGS VS30 Compilation (McPhillips et al., 2020): USGS—Id
Shear-wave velocity profile database (VSPDB, Kwak et al., 2021): VSPDB—profile id
For sites where VS30 is estimated from proxy-based methods, vs30_reference describes the type of proxy model(s) used. Abbreviations for proxy-model types include:
“Geo”: geology- or hybrid geology-slope proxies (e.g. Wills et al., 2015).
“Kri”: Kriging interpolation if site is located near measured VS30 (e.g. Thompson, 2018).
“Terr”: terrain-based proxies (e.g. Yong, 2016).
“Pea17—group number”: proxy-based VS30 estimation in CENA proposed by Parker et al. (2017).
The expanded list of proxy models implemented in the NGA-Sub project (Ahdi et al., 2022) have not yet been implemented in the GMDB.
The basin_model and basin_site tables are used to assign z1.0 and z2.5 to sites within the geographic domain of seismic velocity models. Given that the boundaries described by several such models may overlap (e.g. CVM-S and CVM-H in southern California), the GMDB needed a way to allow for multiple estimates to be assigned. We store multiple depth parameters because different parameters are used by different modelers. To meet this need, the basin_site table acts as a “many-to-many” junction between the site and basin_model tables via relationships of site_id and basin_model_id foreign keys. The basin_model table contains identifying information for each model (full name, abbreviation, etc.), and each model is assigned a unique basin_model_id. Within the basin_site table pairs of basin_model_id and site_id are assigned appropriate z1.0 and z2.5 values. An advantage of this structure is that it is flexible enough to accommodate additional estimates as newer models are published. The site table includes fields for the preferred z1.0 and z2.5 estimates with corresponding foreign keys to the z_code table to record the method by which the preferred assignment was arrived at (e.g. from a measured VS profile, proxy-based model, or CVM).
Ground motion tables
Ground-motion metadata are organized into two tables: path and motion. The path table stores all distance metrics in addition to a hanging_wall indicator defined in Ancheta et al. (2013). The motion table joins the event, path, and station tables with the time_series_metadata table, thus relating all aspects of a ground motion (i.e. source, source-to-site path, and site metadata) with the time-series and intensity measures. Each source-to-station record in the motion table is assigned a unique motion_id, and also records the user_id of the individual or entity (e.g. an NGA project) that was responsible for assembling the ground motion data.
Ground motion data are organized into five tables: time_series_metadata, time_series_data, intensity_measure, response_spectra, and fourier_spectra. The time_series_metadata table stores information directly related to the time-series data and processing. Each motion_id in the motion table relates to one entry in the time_series_metadata table for the three generalized as-recorded components (H1, H2, and V), and records information about the time-series including component azimuths, type of recorder, sampling rate, and original source of data. We depart from the SEED specification in that the GMDB does not record channel or instrument codes. Our justification is that the SEED channel code can be reconstructed from the information contained in the sampling_rate, instrument_type, and azimuth fields, which are more descriptive than channel codes. Similarly, metadata stored in the station table can be used to identify a location code by cross-checking IRIS. Processing metadata includes the method of filtering (manual vs semi-automated), filter type, filter orders, and selected high- and low-pass corner frequencies, which control record usable bandwidth.
Acceleration time-series data are stored separately in the time_series_data table, where a time_series_metadata_id foreign key is used to relate each time_series_data_id to the time_series_metadata table. The time-series data are stored within this table as a “MEDIUMTEXT” object formatted using JavaScript Object Notation (JSON), which can be read and parsed by many programming languages. The JSON strings have a dictionary-like structure where acceleration (in units of g) is represented as a list of values (e.g. {“acceleration (g)”:[a1, a2, …, aN]}, where ai represents the acceleration value and N is the number of points). Times are not stored in JSON strings because a time-array can easily be constructed from the corresponding sampling rate in the time_series_metadata table. Benefits of storing the time-series data as strings instead of “FLOAT” objects are (1) we anticipate users will rarely wish to query a portion of a time-series so we bundle them into a single string; (2) the time-series data are ordered as an array in the JSON string, but each FLOAT value would require its own time value if stored in a traditional database format; and (3) the InnoDB engine compresses strings in memory, so the JSON string format requires less memory and results in faster queries than if the data were stored as floats.
The intensity_measure table stores all IMs discussed previously except PSA and EAS for each component. PGA, PGV, CAV, CAV5, IA, and IA-times at every fifth percentile (5 to 95) are stored as “DOUBLE” objects. PSA are stored in the response_spectra table, and as-recorded component FAS and EAS are stored in the fourier_spectra table. All three tables include time_series_metadata_id as foreign keys.
Auxiliary information tables
Auxiliary information describes anything that is not inherently related to ground motion data, and is organized into five tables: citation, collection, user, geometry, and version. The citation table stores information about all references used throughout the GMDB, which includes a full citation and uniform resource locator (URL) or digital object identifier (DOI). Each reference is assigned a unique citation_id which is used as a foreign key in other tables to track the original source of data (e.g. the finite_fault_citation_id field in the finite_fault table relates the FFM data to the appropriate publication). The best practice for researchers who utilize GMDB data is to reference all original sources of data.
The collection table stores metadata related to a collection of motions, events, or stations, and includes fields for a name, description, and citation_id (if related to a publication). Types of collections include published datasets (e.g. NGA-West2), data subsets describing regional data (e.g. California ground motions), and specific datasets used by researchers in connection with a particular study. Collections referenced in the event_eqid and station_ssn tables will only be of the first type because they map unique identifiers across different databases; however, those referenced in the collection_motion table can be of any type. The primary function of “collections” is to provide a means to quickly and efficiently query sub-datasets associated with particular research projects.
The user table contains information about each user including a username, email, full name, and number of data requests. Passwords are also stored in an encrypted password field, and are used to authenticate when authorized users connect to the GMDB server. As a means of quality assurance, user_id’s are assigned to each ground motion in the time_series_metadata table and correspond to the user who processed the ground motion data. User roles are also assigned in the user table; current roles include “users,” who have read-only permissions to publicly released data, “modelers” who have read-only permissions to released and restricted data, and “admins,” who have full edit privileges. Additional roles may be created as needed.
Finally, the geometry table stores geospatial data in GeoJSON format (Butler et al., 2016) for defining geographic features. The purpose of this table is to provide a container for supplementary geospatial data commonly used in ground motion analyses (e.g. the outline of a particular sedimentary basin). Data are stored in the geometry_geojson field (“MEDIUMTEXT”), which can be read and parsed by most programming languages or GIS software. The geometry_class field is used to identify the nature of the type of data contained within the GeoJSON, and is populated using codes defined in the online documentation. Name, description, and citation_id (if associated with a publication) are also stored for each entry.
Junction tables
Junction tables are used to efficiently store many-to-many relationships between two tables. There are seven junction tables in the GMDB: collection_motion, event_eqid, station_ssn, event_geometry, site_geometry, vs30_citation, and version_time_series_metadata. The collection_motion table relates the collection and motion tables and contains a primary key (collection_motion_id), two foreign keys (collection_id and motion_id), and a “record sequence number” (RSN) assigned by an individual collection (e.g. NGA-West2). The purpose of the table is to group sub-datasets of records together within the database structure to facilitate efficient querying of routine requests, and to map RSN’s from external databases to GMDB motion_ids. The many-to-many relationships defined in the table means that a collection_id may have many motion_ids, and an individual motion_id may belong to several collection_ids.
The “earthquake ID” (EQID) and “station sequence numbers” (SSNs) assigned to events and stations in NGA products could not be adopted as primary keys in the event and station tables, respectively, because NGA-West2 and NGA-East each started their assignments at “1.” Accordingly, the EQID and SSN fields are unique within, but not between, database products. We, therefore, assign unique event_ids and station_ids to ensure that the primary keys are unique; however, users may wish to search the GMDB using familiar EQIDs and/or SSNs assigned by individual collection efforts unified in the GMDB (e.g. NGA-West2 and NGA-East). The event_eqid and station_ssn tables provide these mappings by acting as junction tables between the collection and event or station tables, respectively. Both tables contain four fields: (1) a primary key (event_eqid_id or station_ssn_id), (2) collection_id foreign key, (3) event_id or station_id foreign key, and (4) eqid for the EQID or ssn for the SSN. The relationships between the primary keys (event_eqid_id and station_ssn_id) to collection_id and event_id or station_id are both “one-to-many,” meaning that a given event_id or station_id can only have one EQID or SSN for a given collection_id; however, individual event_id or station_ids may appear numerous times if they exist in multiple collections.
Sometimes information about the location of the earthquake or site is also important, such as knowing if they occur within a particular geographic area. This type of metadata is stored in the event_geometry and site_geometry tables, which act as “many-to-many” junction tables between the geometry and event or site tables, respectively, meaning that one event or site can be related to many geometry objects, and a particular geometry can also be related to many events or sites. The relationships are defined by identifying event_id and site_ids who’s locations (hypocenter or site coordinates) map within the geometry object (if a polygon) associated with a particular geometry_id. For example, if a user is only interested in data from events that originate in the Bay Area of northern California, they can limit their query by filtering on the associated geometry_id through the event_geometry table. The information in the site_geometry table can be used to identify sites that are located inside of particular basins (e.g. Los Angeles basin), or used to assign geomorphic site categories (e.g. basin, basin_edge, valley, mountain_hill—Nweke et al., 2022), provided the necessary geometry object is defined in the geometry table.
The vs30_citation table is used to provide citations for VS30 assignments in the site table, and acts as a one-to-many junction table (i.e. if several proxy-based estimates are combined to provide the recommended VS30 for a given site, then the citation_ids for each model used are related to its site_id). In cases where VS30 is computed from a measured VS profile, the citation_id for the data publication will be assigned to the site_id.
Version control
The GMDB is constantly changing as admins enter new data and update existing fields, which poses significant challenges for reproducibility of research findings. Version control is needed so users are able to query specific data collections that were used in a study. Two general approaches for version control in relational databases are (1) schema-based, in which version information is stored within database tables and versioning is handled through SQL queries, and (2) copy-based, in which the database is copied and archived at a specific point in time and version control is achieved by querying the appropriate version. Schema-based methods are complicated to implement because they require additional tables and fields, and the SQL queries must be written specifically to retrieve data from the desired version. Copy-based methods are simple to implement, but involve significant duplication of information in the different database copies, which is inefficient with respect to memory. We adopt a blend of these approaches within the GMDB. We use a schema-based approach for the time_series_metadata, time_series_data, intensity_measure, response_spectra, fourier_spectra, user, version, and version_time_series_metadata tables, which occupy 99.85% of the total database memory. Duplicating this information with each version is deemed unnecessary and inefficient. We adopt a copy-based method for the remaining tables, which occupy only 0.15% of the database memory.
The version control approach is illustrated in Fig. 10. The schema-based version control database contains the large tables (e.g. time_series_data, intensity_measure, fourier_spectra, and response_spectra), a version table, and a junction table identifying the version of each time-series, which is easily mapped to each entry in the large tables. The version table contains the version number, description, and database name for the copy-based version control tables. Once an entry in one of the large tables is assigned a version, the version number is permanent. For example, if a time-series needs to be updated, the existing time-series will not be overwritten. Rather, a new time-series will be inserted into the time_series_data table, and the version_time_series_metadata junction table will map the time-series entities to the appropriate versions. The copy-based version control approach involves copying the small tables when new versions are released, and connecting to the correct database. By default, the API will return data from the most recent version. The best practice for researchers who utilize GMDB data is to reference the specific GMDB version used to enable reproducibility.
Application programming interface
This section discusses how the ground motion data and associated metadata in the GMDB are made publicly accessible. One approach would be to open the database to user SQL queries, but this would require users to be proficient in SQL and to understand the database structure to write queries. Moreover, allowing users to submit custom SQL queries is also a security threat. To overcome these challenges, we developed a representational state transfer (REST) API and online tool to assist users with accessing and interacting with the data. This API enables users to request data from the GMDB using relatively straightforward query string parameters appended to the end of a URL that serves as an endpoint. Using the API to retrieve data requires only a basic understanding of the database structure and no knowledge of SQL. Key features of the API are explained here, and complete documentation can be found at Buckreis et al. (2023a) (https://doi.org/10.34948/G4RP4K).
The API can be accessed through a web portal, where data can be viewed in HTML tables, or through HTTP requests, where data are returned in a JSON format. The API requires authentication and authorization to prevent unauthorized users and bots from accessing data. When using the web portal, authentication is provided through a login script, and authorization is handled by a dropdown menu defining the user’s role. When retrieving JSON data, users must first authenticate by submitting their username and password via a Basic Auth HTTP request. Successful authentication returns an authorization token that must then be included in the header of subsequent HTTP requests to retrieve data.
To request data from a certain table, the user appends an endpoint to the end of the base URL: https://gmdatabase.org/. For example, if a user is interested in earthquake-source metadata, they can query the event table: https://gmdatabase.org/events. If the URL is pasted into a web browser and the user is authenticated, results are rendered in an HTML table, as shown in the screenshot in Fig. 11 depicting a portion of the returned data. Additional query string parameters separated by ampersands can be appended following a question mark after the name of the table to refine how the data are returned. Users can sort by a specified field either ascending or descending, specify the number of records to return, or filter records by specifying a field name, delimiter, and value. For example, if the user wants to retrieve events with magnitude larger than 5 sorted from oldest to newest, the URL would be: https://gmdatabase.org/events?sort=datetime&direction=asc&magnitude>5, in which “sort,”“direction,” and “magnitude” are query string parameters and “datetime,”“asc,” and “5” are the user-defined values.
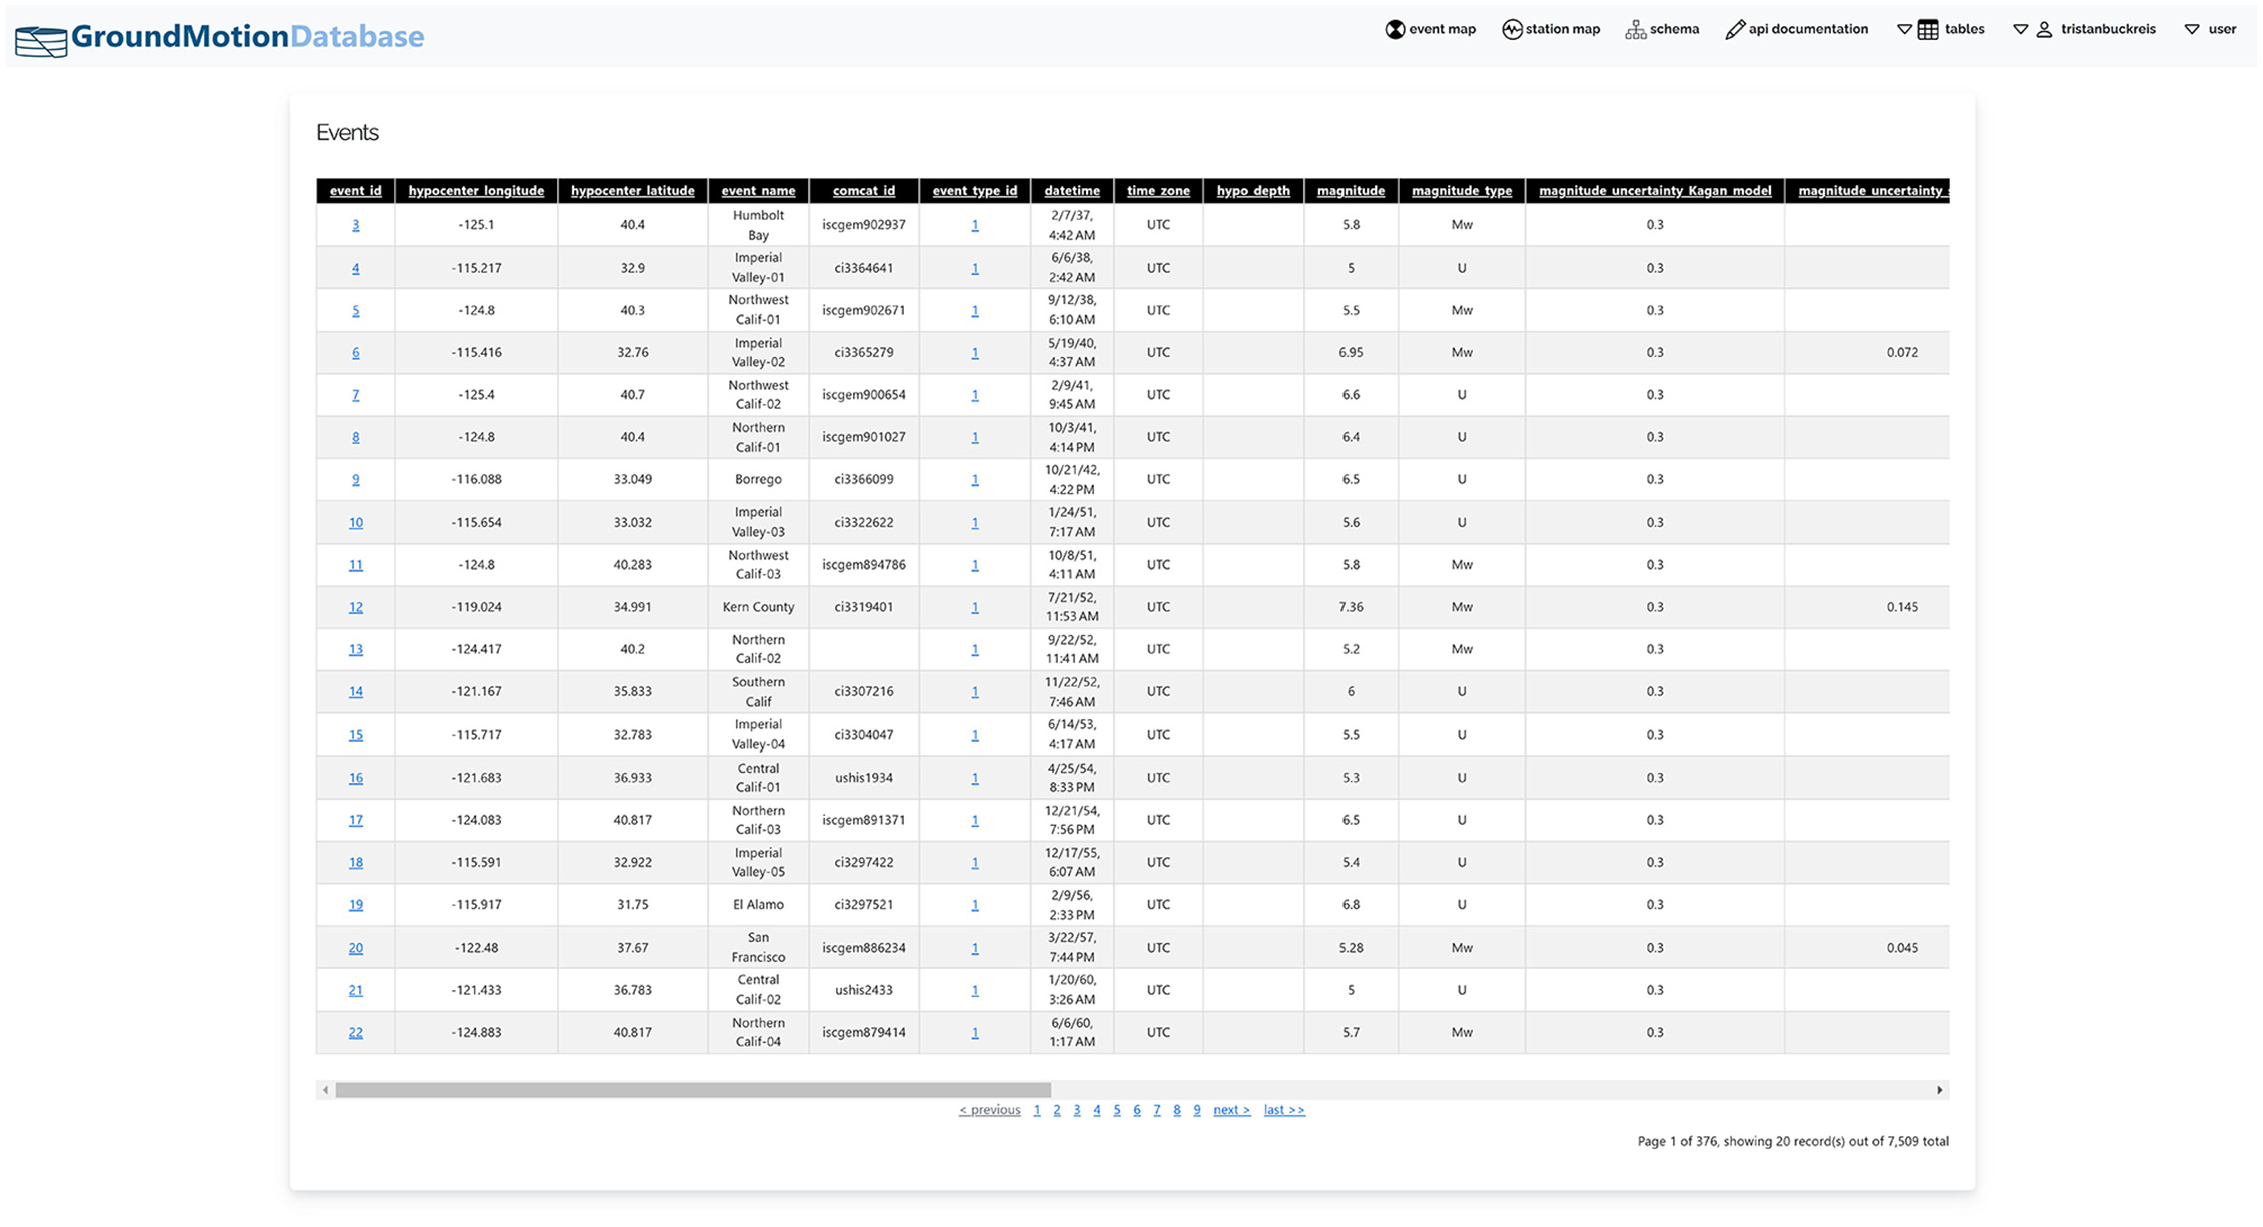
Screenshot of information returned by API (https://gmdatabase.org/events).
In addition to providing access to individual tables, the GMDB has a flatfile endpoint in which data from the following tables are joined together into a flattened representation: motion, event, station, path, finite_fault, finite_fault_kinematic_parameter, network, station, site, time_series_metadata, intensity_measure, and either response_spectra or fourier_spectra. The flatfile endpoint provides information that is similar to the publicly available NGA flatfiles. The flatfile endpoint supports the same sorting and filtering capabilities that are present for the individual table endpoints, and is accessible both through the web interface and API. A flatfile can be extracted from the database through the API using the following URL: https://www.gmdatabase.org/flatfile.
Users can view time-series data through the web GUI, though results are truncated to the first 100 characters of the JSON strings to facilitate responsive web viewing (https://gmdatabase.org/timeSeriesData). However, users can access the full JSON strings by submitting an HTTP request through the API.
Summary and recommendations
The GMDB departs from past practices for disseminating ground motion data by making data available through a web-served database via an API. The GMDB currently stores the unified ground motion data from active tectonic and stable continental regions assembled by NGA-West2, NGA-East, Kishida et al. (2014), Ahdi et al. (2020), Wang (2020), Margaris et al. (2021), Buckreis et al. (2022, 2024b), Ramos-Sepúlveda et al. (2024), and Mohammed et al. (2025, 2024) The California portion of the database contains 49,797 multi-component records from 525 events, the CENA subset is made up of 16,405 multi-component records from 183 events, and the Mediterranean subset is made of 4403 multi-component records from 559 events.
As of this writing (June 2025), multiple efforts are ongoing to extend the GMDB, including global data from shallow crustal earthquakes in active tectonic regions as part of the NGA-West3 database (Buckreis et al., 2024c). The schema was developed with these expansions in mind; however, organizational additions and/or alterations are anticipated as the database grows. The source and site metadata compiled as part of ongoing projects, such as NGA-West3, are publicly available in the GMDB since these types of information are generally compiled from public sources. However, the ground motions and associated intensity measures are restricted pending formal release by the project.
The GMDB API is a complex product that is still routinely undergoing updates and advancements. Requests for individual tables and batches of time-series data are operational, and ongoing developments aim to provide customizable datasets containing ground metadata and intensity measures in an end-to-end computing workflow for the next generation of ground motion analytics. We encourage researchers and engineers who utilize the GMDB to reference the specific GMDB version used and to cite all original sources of data and metadata.
Footnotes
Acknowledgements
The authors thank three anonymous reviewers for their input on this article.
Declaration of conflicting interests
The author(s) declared no potential conflicts of interest with respect to the research, authorship, and/or publication of this article.
Funding
The author(s) disclosed receipt of the following financial support for the research, authorship, and/or publication of this article: Funding for this study included support from the California Department of Water Resources (DWR), Agreement 4600012415; the USGS External Research Program, contract number G21AP10370 (CENA data); Pacific Gas & Electric Company (PG&E) and the California Strong Motion Instrumentation Program (CSMIP) (Ridgecrest and CSN data); the California Department of Transportation, award 65A0780 (NGA-West3); and USGS Contract G22AP00319 (SFBA data). We gratefully acknowledge this support. The views and conclusions in this paper are those of the authors and do not reflect the policy of the USGS, the State of California, or PG&E.
ORCID iDs
Data Resources
Raw time-series records were retrieved from the Incorporated Research Institutions for Seismology (IRIS) Data Management Center (https://www.iris.edu), the Center for Engineering Strong Motion Data (CESMD; https://www.strongmotioncenter.org/), the California Department of Water Resources (DWR), and from the Earthquake Data Center System of Türkiye (TDVMS; https://tdvms.afad.gov.tr/). The Community Seismic Network (CSN) waveforms were obtained from the CSN website (http://csn.caltech.edu/data). The ground motion data were processed using R (R Core Team, 2022) or gmprocess (Hearne et al., 2019; Thompson et al., 2025) with a human review GUI which is available on GitHub (https://github.com/meramossepu/HumanReviewGUI) and there is a versioned release available on Zenodo (v1.0, at the time of publication; doi: 10.5281/zenodo.10815137). The GMDB API is accessible at ![]() , and static releases of each version are available at Buckreis et al. (2025b)Archive of an earthquake ground motion relational database (GMDB) for engineering applications. DesignSafe-CI., doi: 10.17603/ds2-w0zm-y670 v1.
, and static releases of each version are available at Buckreis et al. (2025b)Archive of an earthquake ground motion relational database (GMDB) for engineering applications. DesignSafe-CI., doi: 10.17603/ds2-w0zm-y670 v1.