
Abstract
Historical minarets are generally vulnerable to earthquakes because of their poor-quality materials and high slenderness. The objective of this work is to utilize the methodology employed for seismic fragility curves to analyze historical brick minarets, specifically focusing on a specific instance minaret. For this, the minaret of the Hocaalizade Mosque, built in Bursa during the Early Ottoman Period, was chosen. Using the software Abaqus v6.13, the minaret’s finite element model was constructed utilizing shell elements for the minaret and the walls of the mosque, and wire elements for the stair. The model was updated in accordance with the operational modal analysis (OMA) that was carried out in the field. Subsequently, IDA curves were generated for the minaret using Nonlinear Incremental Dynamic Analysis, utilizing 11 actual ground motion records with two horizontal components. A probabilistic approach was utilized in order to acquire the fragility curves for each performance level, which included limited damage, controlled damage, and collapse prevention. The outcomes of nonlinear time history analyze indicate that the minaret sustains damage mostly in two areas: between the transition and shaft, and/or between the balcony and the upper part. The analyses yielded fragility curves using two intensity measures as spectral acceleration and peak ground acceleration. The statistical assessment and regression analyses between each intensity measure and the probability of exceedance indicate that both intensity measures can be considered appropriate for the studied minaret. This minaret experiences the collapse prevention limit when the spectral acceleration (peak ground acceleration) exceed ∼0.27g (0.13g), respectively, with a ∼50% likelihood.
Keywords
Introduction
Turkey is situated within a seismic zone and regularly experiences catastrophic earthquakes. Therefore, it is crucial to anticipate the behavior of historical structures during earthquakes in terms of improving or strengthening them when necessary. Historical masonry minarets are a type of historical constructions that are particularly vulnerable to the damaging impacts of earthquakes. This is because they have poor tensile and shear strength, low ductility, limited reverse load carrying capacity, and are characterized by high and/or slender structures (Rota et al., 2008). Turkey is home to many remarkable historical minarets from different architectural periods such as Seljuk, Early Ottoman and Classical Ottoman and with different structural materials such as brick, stone and wood. It is known that the oldest minarets in Anatolia, Turkey belong to the Seljuk architecture period (Creswell, 1926). While the main material of the Seljuk and the Early Ottoman minarets is mostly brick (Kuşüzümü, 2010; Makvandı et al., 2015), that of Classical Ottoman period is stone (Kuşüzümü, 2010). Historical wooden minarets in Turkey, which are fewer in number than historical brick and stone minarets, were mostly built in rural areas for public use and/or as part of a masjid.
Post-earthquake observations on historical minarets that may differ in terms of construction period and/or materials show that minaret damages mostly occur around the intersections of different parts, around the middle of the shaft and on the spire (e.g. Atmaca et al., 2024; Gürbüz and Kocaman, 2024; Ismail and Khattak, 2016; Sayın et al., 2021). Figure 1 shows photographs of such damage occurring in real different earthquakes.
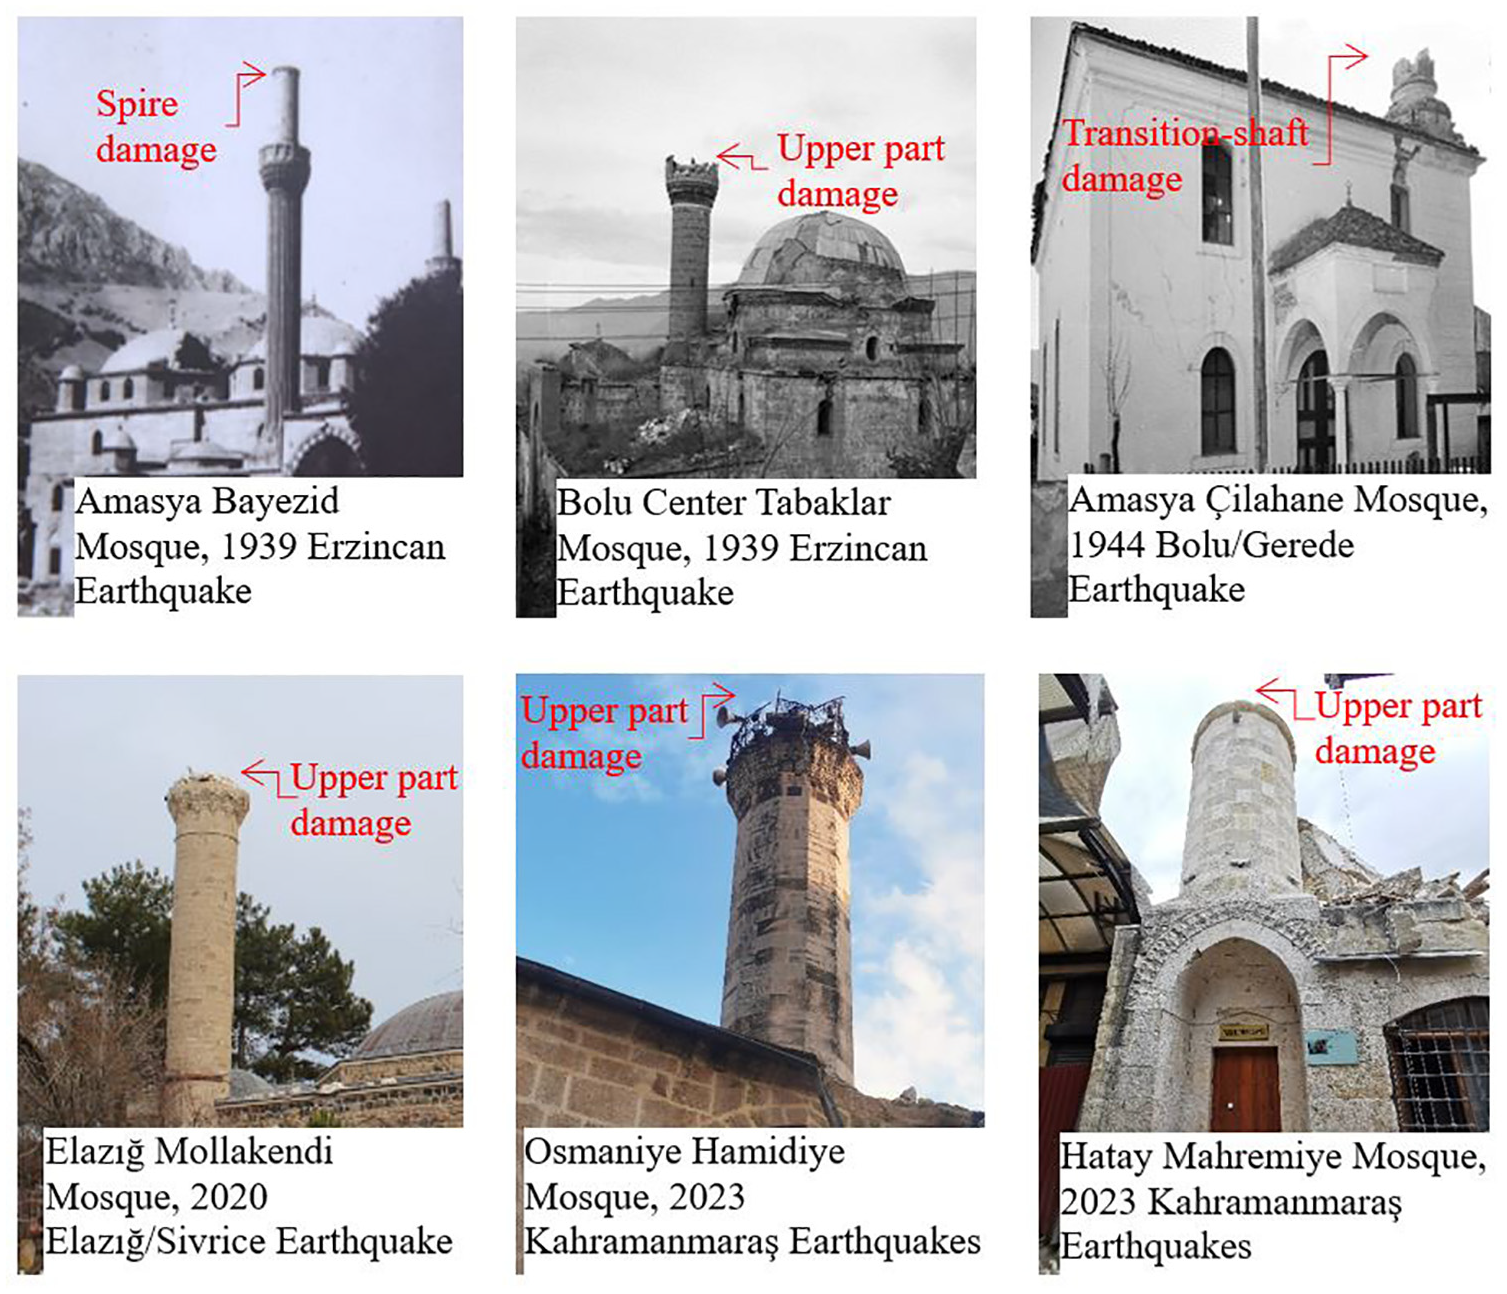
Example images of minaret damage caused by real earthquakes (the first four photographs were modified from the archives of Directorate General of Foundations in Turkey, DGF (2022, Personal communication, face-to-face and by phone)).
In addition to actual observations made after earthquakes to understand the seismic performance of historical minarets, there are also case studies in the literature that examine the seismic performance of historical minarets through nonlinear and/or linear time history analysis under ground motion acceleration record(s) (e.g. Adam et al., 2020; Aymelek et al., 2023; Ercan et al., 2017; Erkek and Yetkin, 2023; Eronat et al., 2024; Jadallah et al., 2024; Maraş et al., 2022; Matari et al., 2023; Nohutcu, 2019; Oliveira et al., 2012; Seker and Sahin, 2024; Trešnjo et al., 2023; Türkeli, 2020; Usta, 2021; Yurdakul et al., 2021). These studies show that the minarets under consideration were generally damaged in the transition-shaft and balcony-upper part transition areas. In these studies, continuous homogeneous models created with finite element method were adopted as the modeling strategy. It should be noted that the study of D’Altri et al. (2020) classifies the modeling strategies used for masonry structures as block-based models, continuum homogeneous models, geometry-based models and equivalent frame models. Due to the intrinsic characteristics of masonry, masonry modeling, especially historical masonry modeling, is a challenging task. Masonry modeling approaches are explained and compared with each other in the studies of Angelillo et al. (2014), Lourenço (2010) and Giordano et al. (2002) work.
There are very few experimental studies on minarets in the literature: The scale model of the minaret of the Hocaalizade Mosque was tested with a biaxial shaking table under Bursa-Tofas ground motion record (RSN1155) produced by the 1999 Kocaeli earthquake (Bayrak et al., 2021; Birel et al., 2021). In the minaret model, damage occurred at the intersections of both the transitional segment-shaft and balcony-upper part. This damage can be roughly defined as the separation that takes place between a row of bricks and the mortar bed junction in the horizontal plane. Khider and Al-Baghdadi (2020) modeled only the body part of the historical brick Alkifil minaret in Iran at a 1/6 scale and performed the shaking table tests of this minaret model under a ground motion record of El Centro earthquake in two phases with PGAs of 0.05g and 0.15g. The authors reported that the minaret resisted the motions with no damages. Shaking table test results of the models of the historical Kocamustafa Pasha mosque including minaret built during the Ottoman Period in Skopje were presented in the studies of Krstevska et al. (2010) and Tashkov et al. (2012). The minaret was built with stone units bonded with head/bed mortar joints. The damage of the minaret was described with a horizontal crack occurred at the base under the Montenegro-Petrovac earthquake and El Centro earthquake.
So as to preserve the historical minarets and pass them on to future generations, the seismic risk of these minarets should be estimated instead of structural analysis under one or two ground motion records. Fragility curves expressed as analytical functions, which are used to estimate probable losses and damage due to earthquakes, are one of the estimation methods of seismic risk. For given ground motion, fragility curves describe the probability of exceeding prescribed damage limits such as Limited Damage (LD), Controlled Damage (CD), and Collapse Prevention (CP) (Rajkumari et al., 2022; Vamvatsikos and Cornell, 2002, 2004). The studies on the fragility curves of the historical masonry structures are available in literature (e.g. Anzani et al., 2010; Bartoli et al., 2017; Capanna et al., 2021; Colonna et al., 2019; Kouris et al., 2021a, 2021b; Marra et al., 2017; Peña et al., 2010; Torelli et al., 2020; Valente and Milani, 2016a, 2016b). However, according to the authors’ best literature survey, a study on minaret fragility curves is not available. Therefore, this study aims to obtain the fragility curves of the Hocaalizade Mosque Minaret belonging to the Early Ottoman Period in Bursa, Turkey. A prominent feature of the minarets of this period is that they were mostly built with clay bricks bonded with the head and bed mortar joints. These minarets can be with or without a core. The function of the core located in the middle of the staircase is to support and integrate the steps. As the city of Bursa was the first capital of the Ottoman Empire, many examples of the Early Ottoman Period architecture are available in this city. Based on the geometric dimensions of 36 minarets belonging to this period in Bursa, H/D and H/t ratios were calculated in the 8–17 and 34–130 ranges, respectively. H, D, and t denotes the total height of the minaret, the outer diameter of the shaft and the thickness wall of the shaft. In this study, the minaret of Hocaalizade Mosque, with an H/D ratio of 15 and an H/t ratio of 90, was selected under the assumption that this minaret could represent early Ottoman-period brick minarets in Bursa with similar geometric parameters. Then, fragility curves were obtained to assess the earthquake risk of the minaret.
Based on the macro modeling approach in Abaqus finite element program, the model of the minaret was created using shell elements for the minaret/the walls of the mosque and wire elements for stairs. Then, the modal analysis of the model was performed, and modal updates were made by comparing them with the frequency values obtained as a result of Operational Modal Analysis (OMA) performed on site. Afterwards, adopting the Incremental Dynamic Analysis (IDA) procedure, Nonlinear Time History Analyzes of the minaret under 11 different earthquake records were carried out using the Abaqus/Explicit. Based on these analysis results, IDA curves of the minaret, which were expressed with the relationship between spectral acceleration–drift ratio and peak ground acceleration–drift ratio, were obtained. On the IDA curves, the 0.3%, 0.7%, and 1.0% limit values, which are specified in the Earthquake Risk Management Guide for Historic Buildings (ERMGHB, 2017), were marked for Limited Damage (LD), Controlled Damage (CD), and Collapse Prevention (CP), respectively, to plot fragility curves of the minaret.
Description of the minaret
The historical Hocaalizade Mosque and its minaret was built in 1453, Figure 2a. The minaret of the mosque is among the examples of Early Ottoman Period architecture, and the current appearance is given in Figure 2b. The minaret consists of eight parts: pulpit, transition, shaft, balcony, upper part, spire, end ornament and staircase, like a typical Ottoman minaret (Figure 2c). The minaret, with an approximate height of 27 m, was built without a core (Figure 2d and e) and is integrated into the main walls of the mosque as seen in Figure 4a to c. The structural materials and sizes of each part were determined by examining the existing survey drawings and making on-site measurements, Figure 2d. The pulpit of the minaret is heptagonal, the cube and balcony parts are conical, and the other parts are cylindrical. The other parts of the minaret, except the pulpit, were created with solid brick units laid at the bed and head mortar joints. The pulpit part was formed adopting the alternating masonry technique including stone and brick rows (one stone and three brick rows) bonded with mortar joints. Since it was not allowed to take mortar samples from the minaret, the type of mortar could not be determined experimentally. However, it is known that the mortar type in this type of historical minarets is lime (Binici et al., 2010; Jadallah et al., 2025; Oliveira et al., 2023) The thicknesses of the brick and stone units are 30–40 mm and 200–250 mm, respectively. The thicknesses of the bed/head mortar joints are varied between 30 and 50 mm. The other parts of the minaret, except the pulpit, were created with solid brick units laid at the bed and head mortar joints. The pulpit part was formed adopting the alternating masonry technique including stone and brick rows (one stone and three brick rows) bonded with mortar joints.
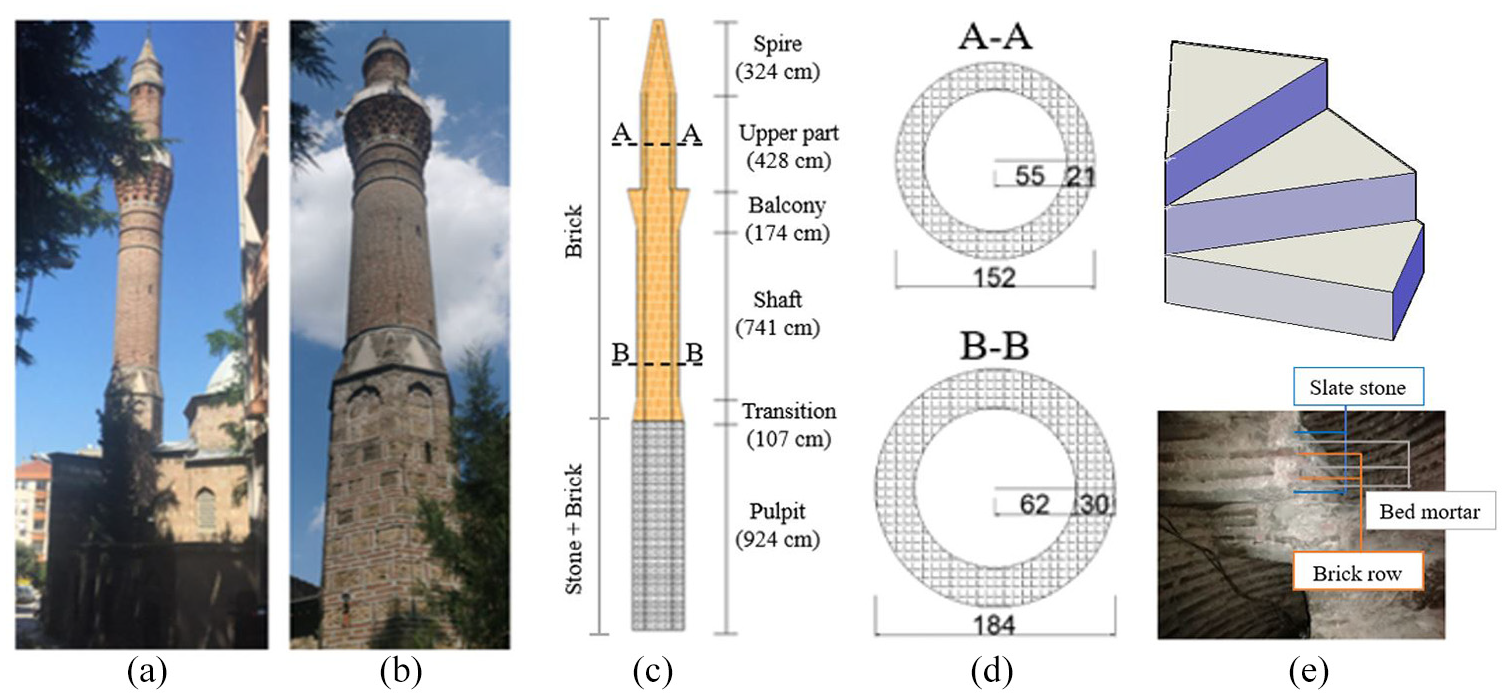
(a) The Hocaalizade Mosque, (b) the minaret of the Hocaalizade Mosque, (c) the materials, parts and dimensions of the minaret, (d) the cross-sections of the upper part and the shaft (in cm), and (e) the internal structure of the minaret (staircase and wall).
The internal structure of the minaret is shown in Figure 2d and e. The staircase is located in the middle of the minaret in a spiral shape without a core (Figure 2d and e). Each step of the staircase was made of two slate stones. The space between these slate stones supported on the minaret wall was filled with rows of bricks laid with mortar. The height of the steps is ∼250 mm and the thickness of each slate is approximately ∼50 mm.
The geometric ratios of H/D and H/t that are thought to affect the structural behavior of the minaret are calculated as 15 and 90 for the minaret under consideration, respectively. H, D and t represent the total minaret height (∼27 m), the outer diameter of the shaft (1840 mm), and the shaft wall thickness (300 mm), respectively. The wall thickness is not constant through the minaret and gradually decrease from the transition part (500 mm) to the upper part (210 mm).
Iyisan et al. (2021) reported the Vs30 value of the area surrounding the minaret to be between 360 and 480 m/s.Vs30 denotes average shear wave velocity in the upper 30 m of the soil. According to the soil classification of Türkiye Building Earthquake Code (TBEC, 2018) based on the Vs30 value, the soil class of the minaret can be accepted as ZC (very dense sand, gravel and hard clay layers or disintegrated, very cracked weak rocks).
No visible damage or cracks were detected in the minaret during the field observations, but Ozaydın (2017) reports that the upper part of the minaret was damaged in the 1855 earthquake that affected Bursa and its surroundings (Ambraseys and Jackson, 2000). Although the official authority (Directorate General of Foundations in Turkey, DGF, Personal communication, face-to-face and by phone) does not give a clear date, it is known that the upper part of the minaret was rebuilt after the 1855 earthquake (DGF, 2022, Personal communication, face-to-face and by phone). As a routine practice, where mortar joints were deteriorated, the joints were repointed: the deteriorated mortar in the joints was removed and the joints were then filled with cement (in the past) or lime mortar (in recent years) (DGF, 2022, Personal communication, face-to-face and by phone).
Ambient vibration test
In order to determine the dynamic characteristics of the minaret (frequencies and damping ratios) an ambient vibration test was carried out. The responses of the minaret to the ambient actions (people/vehicle traffic and wind effects, etc.) were measured by means of six tri-axial accelerometers. The positions of the accelerometers are shown in Figure 3a. One of the accelerometers was placed on the ground whereas the others were placed at different levels where the cross-sections change (Figure 3a). The sampling frequency of the tests was 200 Hz. A data digitizer system with a 24-bit resolution and a computer for recording the digitized data were utilized during the tests.
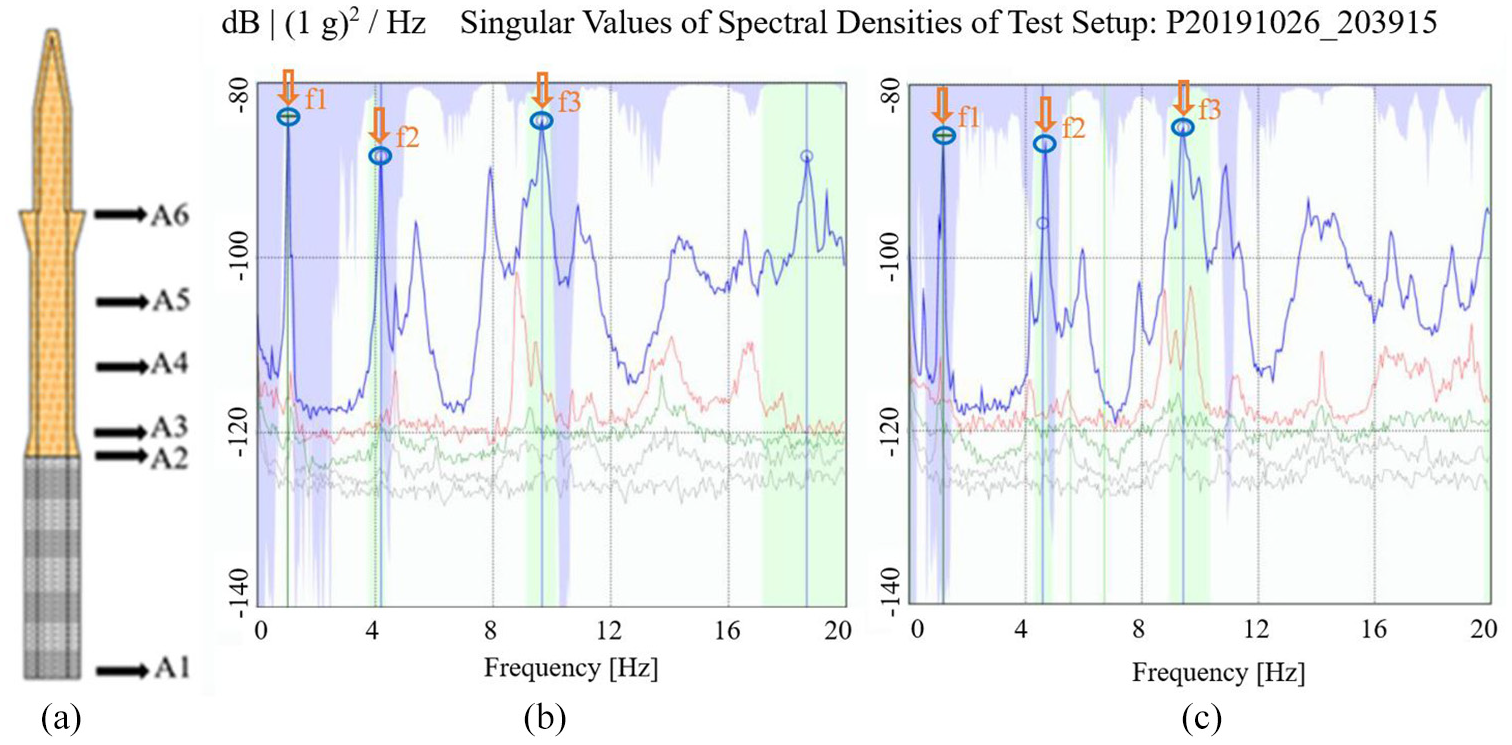
(a) The positions of the accelerometers, (b) frequency values in X direction, and (c) frequency values in in Y direction.
The acceleration-time data were analyzed with Operational Modal Analysis (OMA) on the frequency domain (Figure 3b and c). The EFDD method was adopted to obtain natural vibration frequencies and damping ratios. This method uses the power spectral density functions of single degree of freedom systems converted to the time domain by the Inverse Fourier Transform (Jacobsen et al., 2008). The frequencies of the first and second modes of the minaret were obtained as 1.04 Hz (X direction), 1.17 Hz (Y direction) and 4.19 Hz (X direction), 4.69 Hz (Y direction), respectively. The directions of X and Y, which was defined for the minaret, are shown in Figure 4. The damping ratios for the first two modes were found to be 2.50% (X direction) and 2.07% (Y direction).
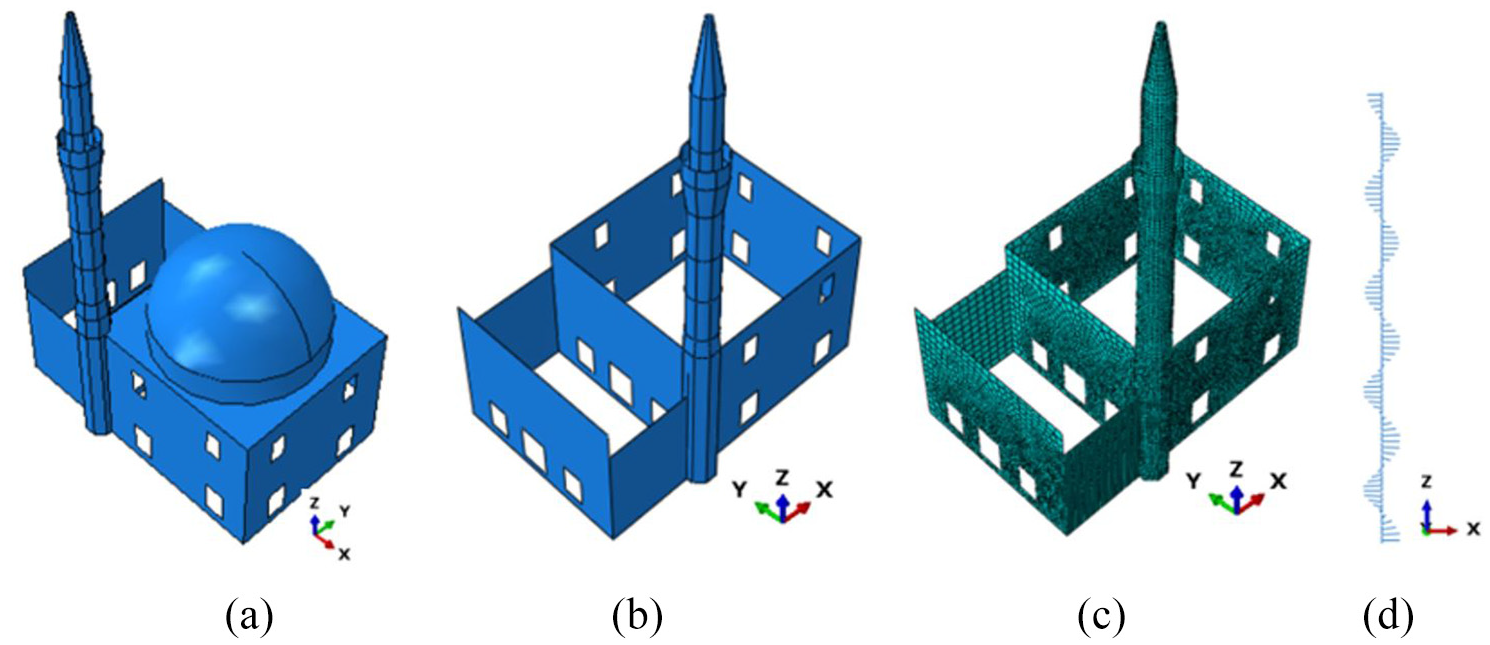
The finite element models of: (a) the minaret and mosque, (b and c) the minaret and the walls of the mosque, and (d) the staircase.
Establishment of the finite element model
Numerical model
Since the minaret is integrated into the walls of the mosque, two finite element models were created using Abaqus v6.13: the first one included the minaret and the walls of the mosque, drum and dome of the mosque (Figure 4a), and the second one included the minaret and the walls of the mosque (Figure 4b). In accordance with the recommendation of Türkiye Building Earthquake Code (TBEC, 2018) to consider soil-structure interaction for loose and/or soft soils (ZE and ZF), soil-structure interaction was not examined in this study, as the soil class in the region where the minaret is located is ZC. Modal analyzes of these two models were carried out and the boundary conditions (rotations and translations in three directions) of the bottom of the pulpit were taken as fixed. Since no significant difference was detected in the frequency values of the minaret, it was decided to use the model that included only the walls of the mosque and the minaret in order to reduce the analysis time, considering that many numerical analyzes would be made. Figure 4b to d depicts the model of the minaret that was created using finite elements. The minaret and the walls of the mosque were formed with shell elements (S4R). The element of S4R has four nodes and each node has a 6-degree of freedom. This type element was also utilized to create the model of historical constructions (e.g. De Luca et al., 2004; Hoseynzadeh and Mortezaei, 2021). The stairs of the minaret were created with linear beam elements (B31). This two-node element has 6 degrees of freedom at each node. In the models developed by Peña et al. (2010) and Lourenço et al. (2011) for historical Qutb minaret, beam elements were used to model the stairs.
Model updating
In order to establish the finite element model of the minaret, the mechanical properties of the masonry also need to be known for the macro modeling approach in which the masonry material is considered as a single homogeneous material. However, material characterization of historical structures is a challenging issue for several reasons, including the diversity of material types, significant differences in material properties, and restrictions on materials tests due to conservation concerns. In this study, based on the frequency values determined by the ambient vibration tests presented in section “Ambient vibration test,” the initially considered masonry material properties were updated by following the common approach available in the literature (e.g. Capanna et al., 2021; Ercan et al., 2017; Hökelekli et al., 2020; Illampas et al., 2020). The initial value of the compressive strength of brick walls was taken as 1.74 MPa from the study of Ilki et al. (2022), who examined the same minaret as the presented study. Masonry tensile strength (ft) was accepted as 1/30 of the compressive strength, as in the studies of Jain et al. (2020) and Bocciarelli and Barbieri (2017). The modulus of elasticity (Ed) of masonry is usually found by multiplying the compressive strength of the masonry (fd) by a constant number. This constant number differs in a wide range like 200–1667 based on the values complied from the studies of Xu et al. (2024), Eronat et al. (2024), Pouraminian (2022), Maraş et al. (2022), Hoseynzadeh and Mortezaei (2021), Valente (2021), Hökelekli et al. (2020), Adam et al. (2020), Shakya et al. (2018), Marra et al. (2017), Hejazi et al. (2016), Minghini et al. (2014), and Ispir and Ilki (2013). This range was reported as 400–1000 by Tanganelli et al. (2024) and as 82–1100 by Romero-Sánchez et al. (2023). In this study, Ed was obtained using equation (1), which is proposed by FEMA 306 (1999) as in Hoseynzadeh and Mortezaei (2021):

The initial values of the compressive strength, tensile strength, and modulus of elasticity were 1.74, 0.06, and 957 MPa, respectively, for all parts of the minaret except the pulpit and the staircase. For the pulpit part, the initial value of the compressive strength of the alternating masonry was accepted as 2.5 MPa, taking into account the compressive strength values given for masonry walls in ERMGHB (2017). The tensile strength and modulus of elasticity are calculated adopting the approach used for the brick masonry as 0.08 and 1375 MPa, respectively. For the staircase, the initial values of the compressive strength and modulus of elasticity of the slate stones were accepted as 100 and 50,000 MPa, respectively, based on the tests performed by Yağız (2011).
Due to the approaches and assumptions in determining these initial material characteristics, it was aimed to check these values based on the results of ambient vibration tests performed in the field and update them when necessary. For this purpose, after the initial moduli of elasticity were assigned to relevant parts of the minaret (Figure 4b and c), a sensitivity analysis was conducted by varying the number of elements and frequency value up to the mesh size where the frequency value was fixed. The analysis resulted in a mesh size of 200 mm for the minaret and stairs, and 500 mm for the walls of the mosque. Then, the frequency analysis of the minaret was performed by Abaqus v6.13 to get the frequency values before the model updating (Table 1). Comparing these frequency values with the frequency values obtained from the ambient vibration tests (fOMA), the error amount of each frequency is calculated, Table 1. These high numbers of errors indicate that the material properties of the minaret need to be updated. So as to reduce the error amount below 10%, the finite element model was updated by changing the moduli of elasticity of all parts except the staircase. The upper percentage of error (10%) was accepted by examining the studies of Erkek and Yetkin (2023), Aymelek et al. (2023), Capanna et al. (2021), Erdogan et al. (2019), Nohutcu et al. (2015), Shakya (2014), and Peña et al. (2010). It should be noted that the compressive and tensile strengths were also updated, as these mechanical properties were dependent on each other. The updated material properties of all parts except the pulpit and the stairs were obtained as 5.6 MPa for compressive strength, 0.19 MPa for tensile strength and 3080 MPa for modulus of elasticity. The updated material characteristics of the pulpit part were obtained as 3.0 MPa for the compressive strength, 0.10 MPa for the tensile strength, and 1650 MPa for the modulus of elasticity. The literature studies conducted for brick minarets show that the compressive strength of brick masonry varies between 4.2 and 9.9 MPa (Adam et al., 2020; Al-Omari and Khattab, 2021; Ercan et al., 2017; Erdil et al., 2018; Hökelekli et al., 2020). The study’s model update yielded a material compressive strength that fell within this range.
Frequency values of the minaret
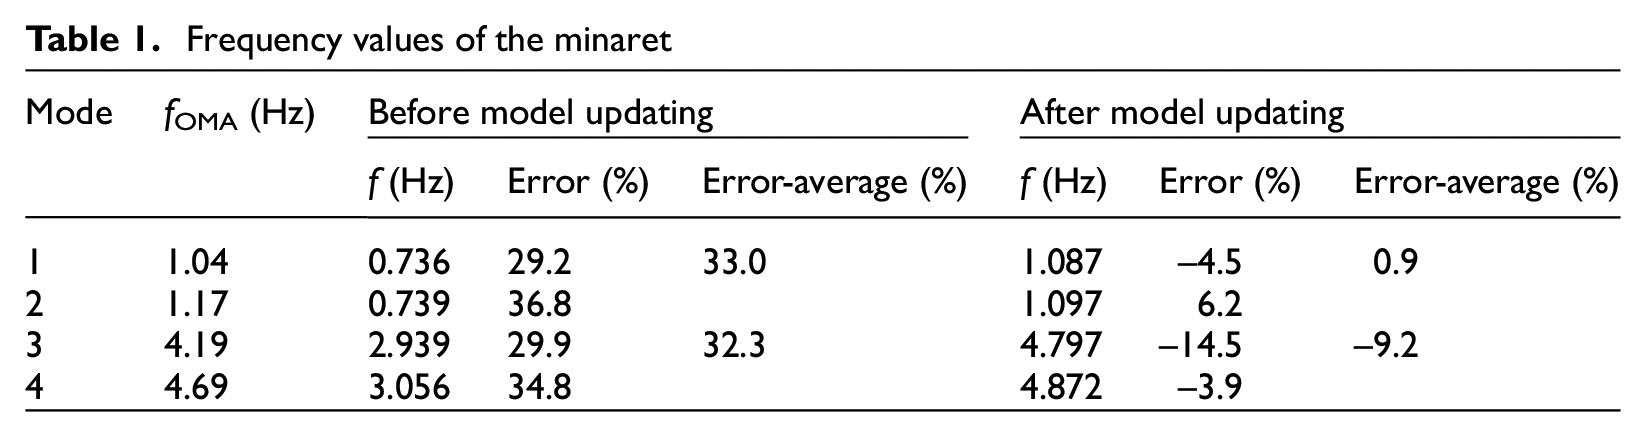
The result of the sensitivity analysis using the updated material characteristics is given with frequency-number of element relationship in Figure 5a. The mode shapes and corresponding frequency values were determined using frequency analysis of the updated material characteristics (Figure 5b). The first two modes of the minaret display in-plane flexural characteristics, with frequency values of 1.09 and 1.10 Hz, respectively.
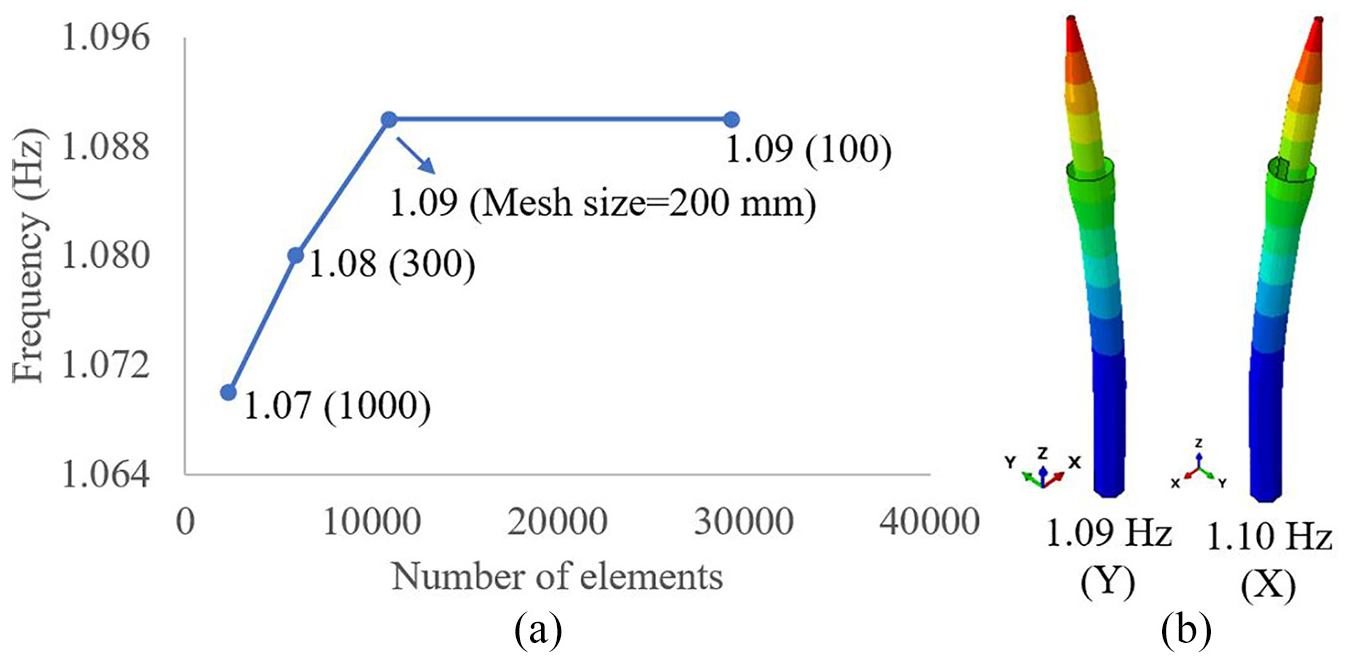
(a) Variation of first mode frequency with number of elements, and (b) the first two mode shapes.
Material model
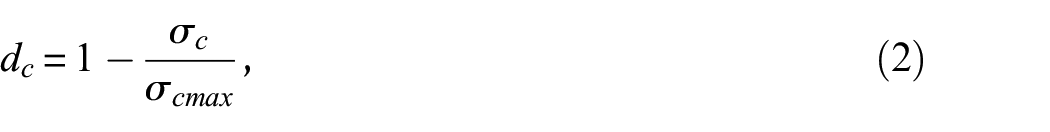
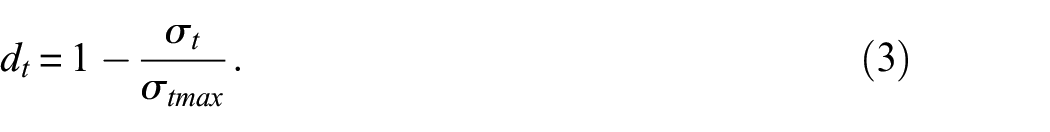
In order to obtain IDA curves, a series of nonlinear time-history analyzes was executed using the finite element program of Abaqus v6.13. For these analyzes, the material behavior was represented by the Concrete Damaged Plasticity (CDP) material model available in the finite element program. The compression, tension, and cyclic behavior of the material are described with the plots in Figure 6. In these plots, σt and ϵt are the tensile stress and tensile strain, σc and ϵc are the compressive stress and strain, Eo is the initial modulus of elasticity, wc and wt are stiffness recovery factors for compression and tensile behavior. In the studies of Borah et al. (2020) and Zhang et al. (2020), the values of wc and wt were taken as 1 and 0, respectively. dc and dt are defined as compression and tension damage parameters, respectively. These damage parameters are calculated by equations (2) and (3). In these equations, σcmax and σtmax indicate compressive strength and tensile strength, respectively:
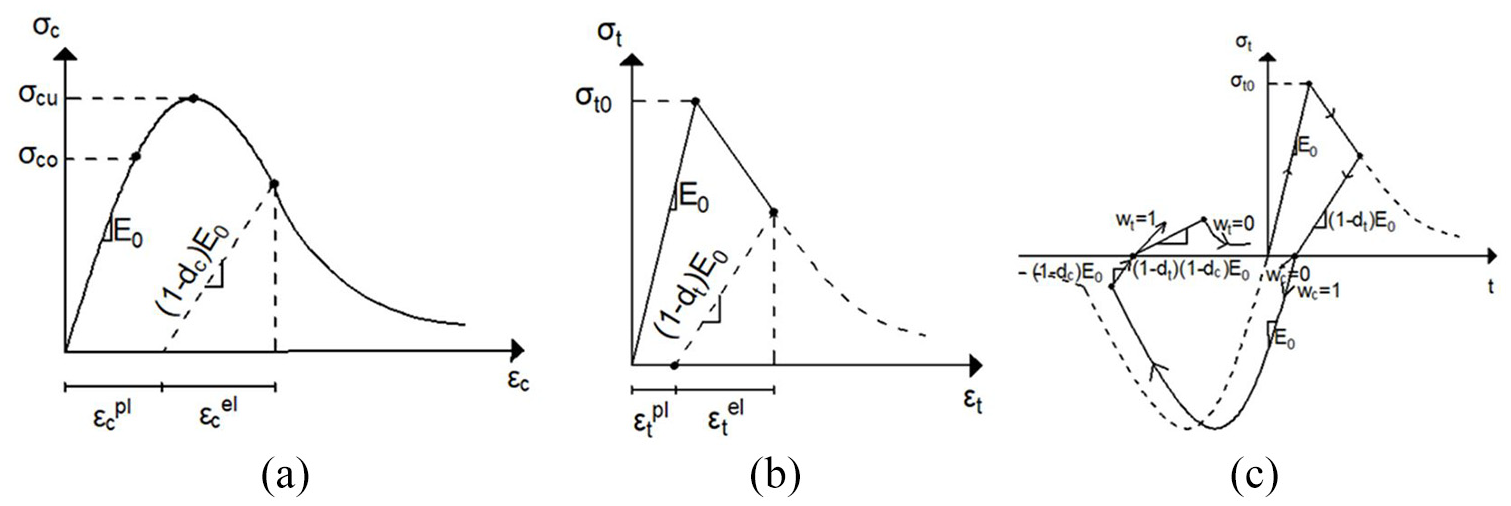
The CDP material behavior relationships are (a) compressive stress–strain, (b) tensile stress–strain, and (c) cyclic behavior.
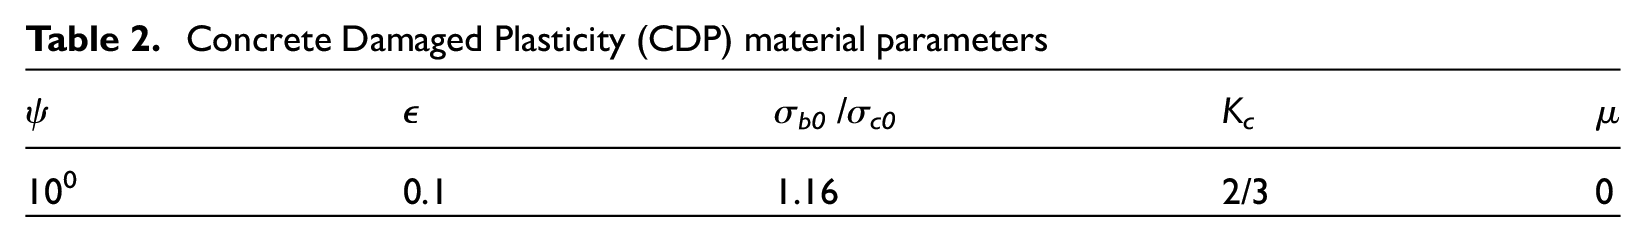
Parameters required for the Concrete Damaged Plasticity (CDP) material model are dilatation angle (ψ), flow potential eccentricity (
Concrete Damaged Plasticity (CDP) material parameters
In order to specify the compressive stress–strain relationship of the brick masonry wall needed for the macro modeling technique, equation (4) proposed by Kaushik et al. (2007) was adopted (Figure 7a). While Ravichandran et al. (2021) and Hökelekli et al. (2020) use equation (4), Zizi et al. (2021) use the similar parabolic function by taking the constants of −0.95 and 1.98 as 1 and 2, respectively. Ispir and Ilki (2013) suggest a parabolic function with the constants of −0.95 and 1.95 on the basis of the experimental data of the historical brick masonry specimens. Based on this literature survey, the normalized relationship of Kaushik et al. (2007) was used for the alternating masonry part of the minaret, considering that the parabolic relationship may be suitable for structural masonry materials with higher compressive strength than tensile strength. In equation (4), the σc, ϵc, and ϵf denote compressive stress, axial strain, and axial strain at peak stress, respectively. The literature survey shows that the axial strain corresponding to the compressive strength of brick masonry is not constant: for example, this value was taken as 0.5% in Tanganelli et al. (2024); 0.69% in Valente (2021); 0.4% in Hökelekli et al. (2020) and 0.7% in Valente and Milani (2016b). In this study, the axial strain corresponds to a value of 0.33%. The tensile behavior of the masonry was defined by two lines, as in the study of Illampas et al. (2020), Figure 7b:
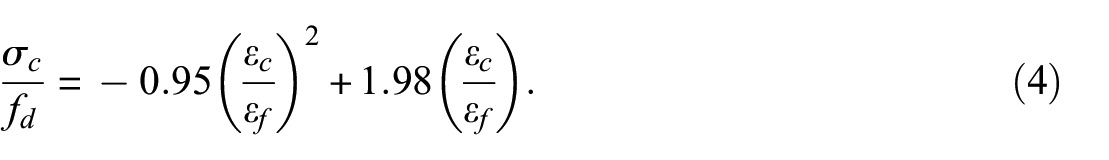
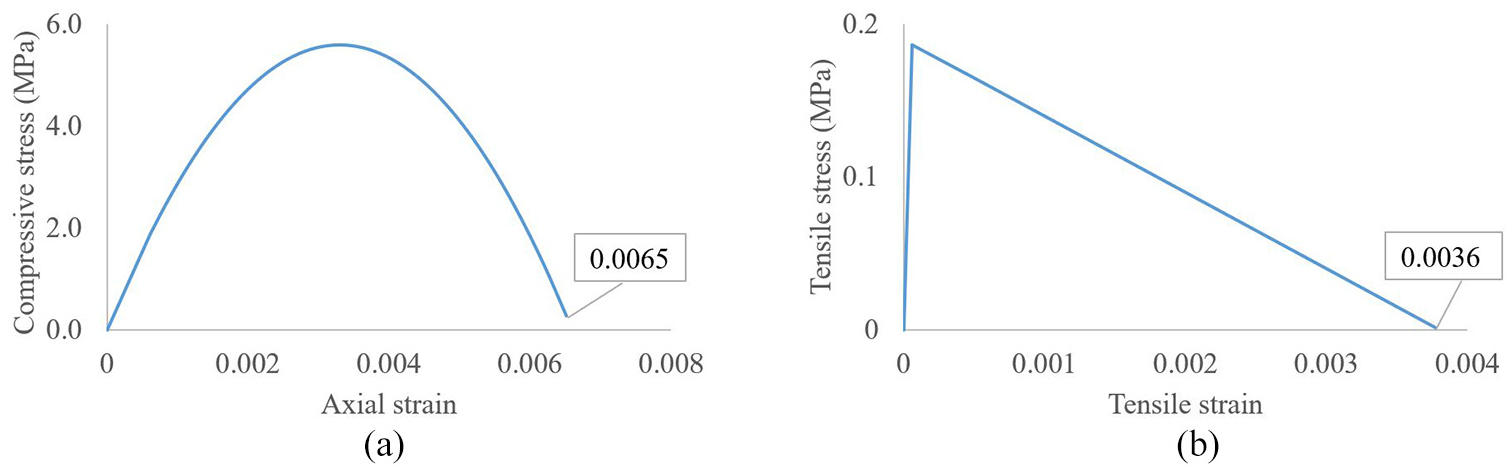
(a) Compressive stress-axial strain and (b) tensile stress–strain relationships.
The last parameter required for the CDP material model is the damping ratio. For this, the Rayleigh damping ratio approach defined by Chopra (2015) was used. The Rayleigh damping ratio is defined by the coefficients of α proportional to mass and β proportional to stiffness. Chen et al. (2014, 2015) reported that taking the β coefficient to zero does not affect the analysis results much and reduces the analysis time to reasonable levels. By adopting this approach, the β value is taken as zero, and the α coefficient is calculated by equation (5):
In this equation, ξ is the damping ratio, and T1 is the natural period corresponding to the first mode. Since damping ratios obtained through the ambient vibration tests are based on low amplitude vibrations, these damping ratios may not represent seismic situations (Peña et al., 2010). Therefore, instead of the damping ratio obtained from the ambient vibration test of the minaret, the damping ratio (ξ) was taken as 4%, and thus the α coefficient was calculated as 0.55 using equation (5). The literature survey conducted on the numerical studies of historical brick masonry structures show that the damping ratio varies between approximately 2.0% and 5.2% (Bayraktar and Hökelekli, 2020; Castellazzi et al., 2018; Fathi et al., 2020; Ghezelbash et al., 2024; Giamundo et al., 2016; Parajuli, 2012; Xie et al., 2020).
Earthquake ground motion records
Eleven ground motion records were selected with the perspective provided by FEMA P-1051 (2016), considering the high seismic activity, fault rupture mechanism and soil conditions of the region where the minaret is located: The moment magnitudes (Mw) of the selected ground motions are between 5.28 and 7.62. The fault rupture mechanism of the eight records is the strike-slip rupture, which is the same as the fault rupture mechanism in Bursa. The soil classes of the five stations are ZC, which is the same as the soil class of the region where the minaret is located, Table 3. In the earthquake record selection, the fault distance was also considered as the city is affected by both near-field and far-field faults (Table 3). In accordance to FEMA P-1051 (2016), the nonlinear dynamic three-dimensional response was determined under two horizontal components of each ground motion.
Earthquake ground motion records selected for structural analysis
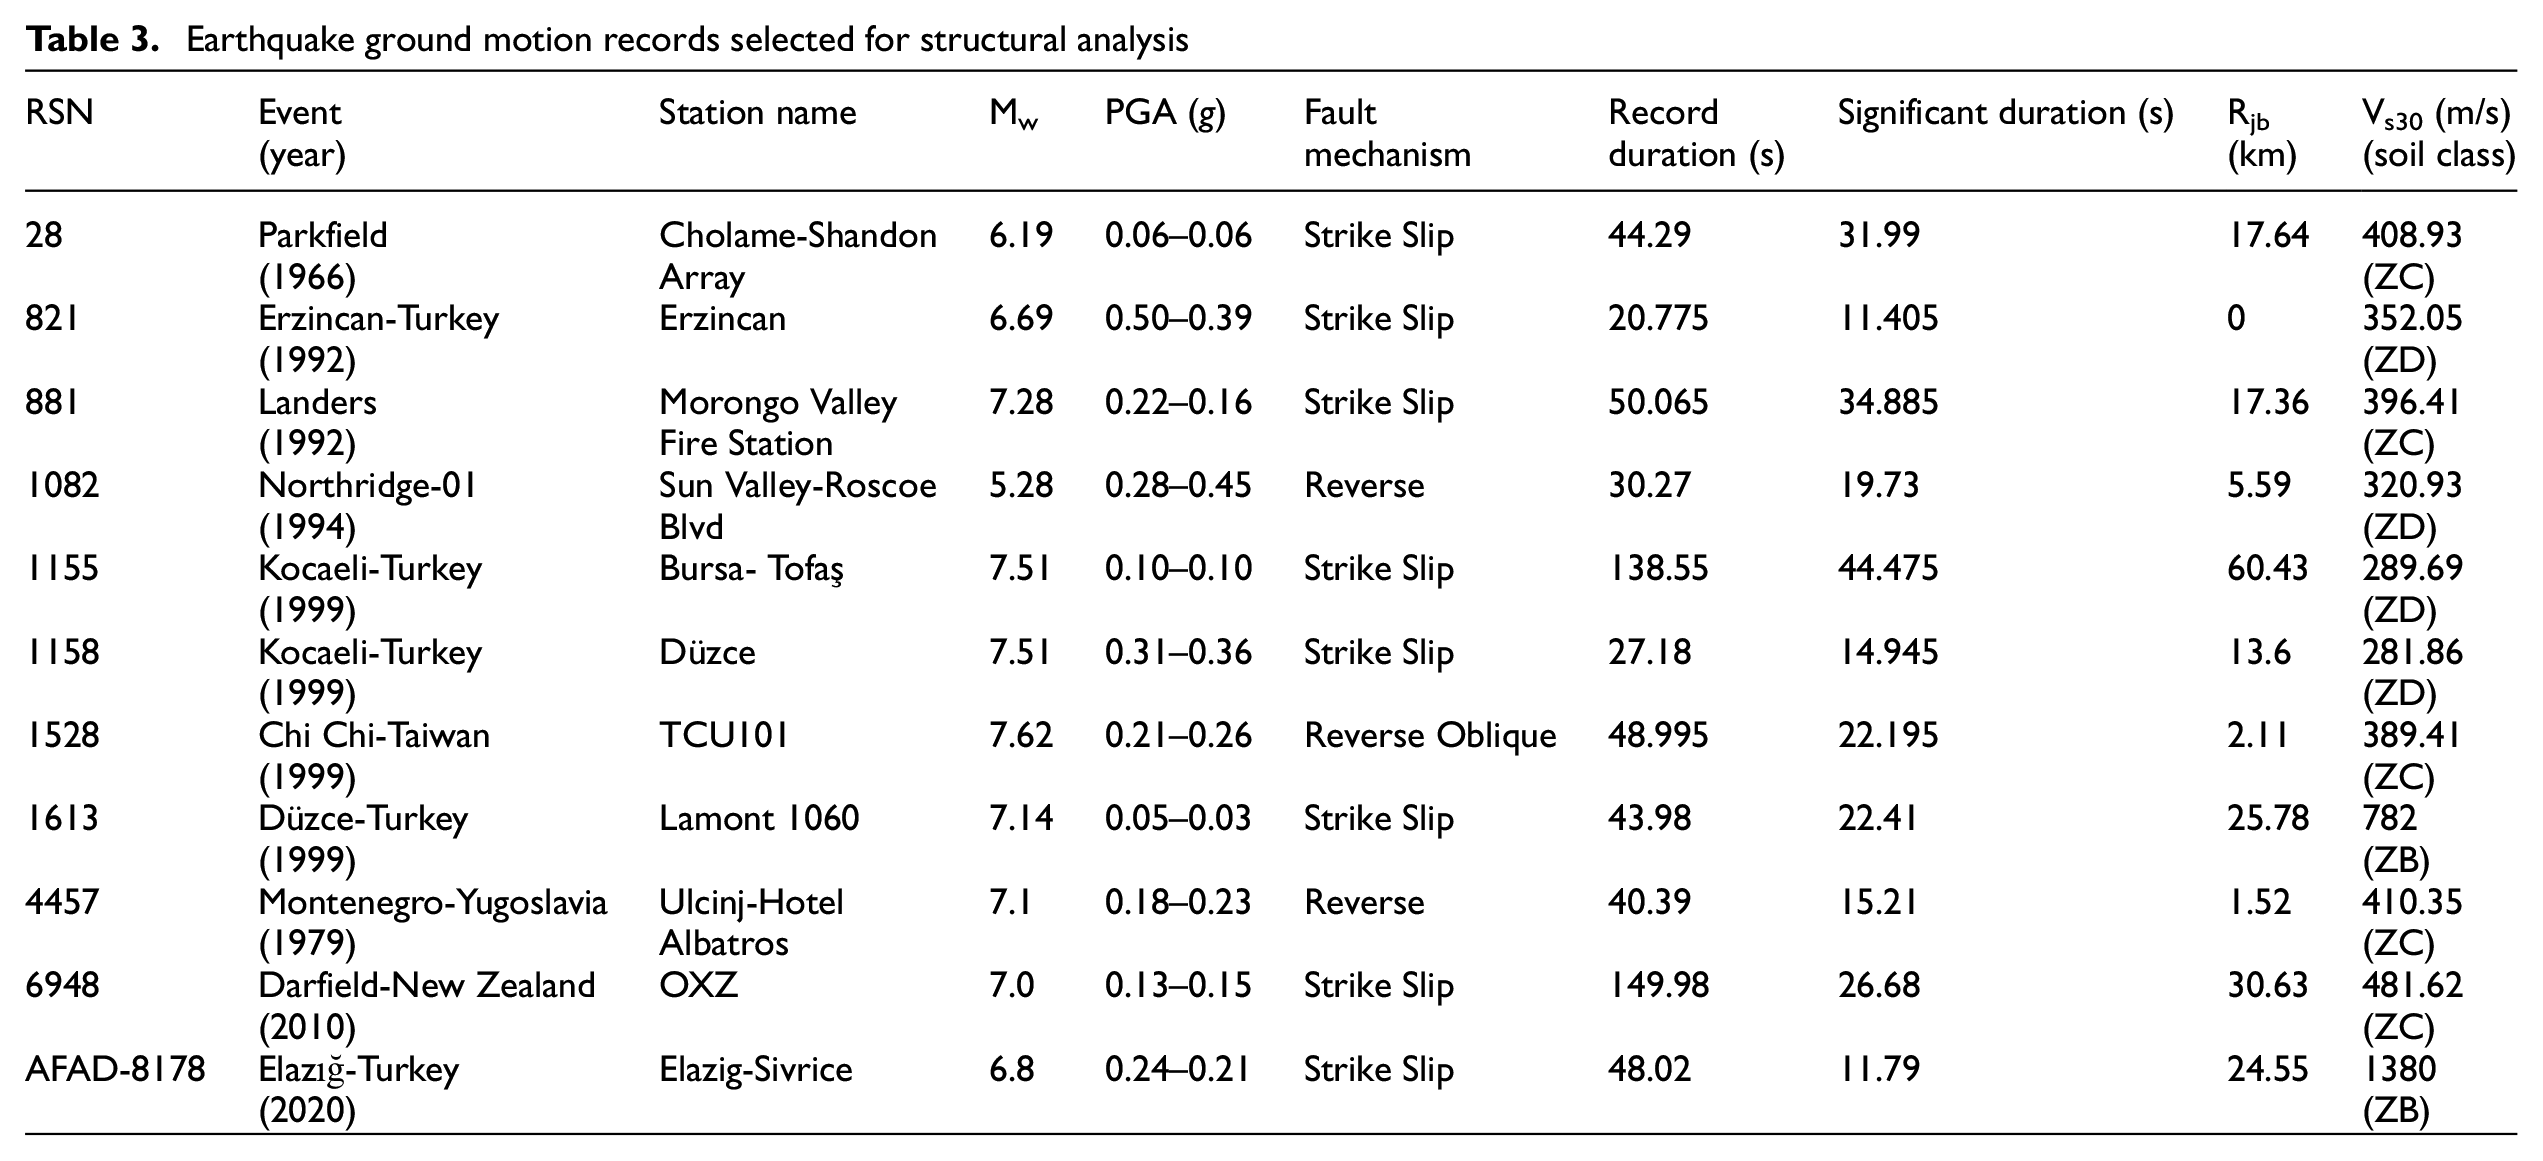
The variation of ground motion accelerations with time are given in Figure 8. The features of these earthquake records are listed in Table 3. In this table, PGA, Rjb, and Vs30 show the peak ground motion acceleration, the closest distance to the horizontal projection of the earthquake rupture plane, and the average shear wave velocity at the upper 30 m of soil, respectively. The earthquake records were taken from the Pacific Earthquake Engineering Research Center (PEER, 2022) and Disaster and Emergency Management Presidency (AFAD, 2022) databases.
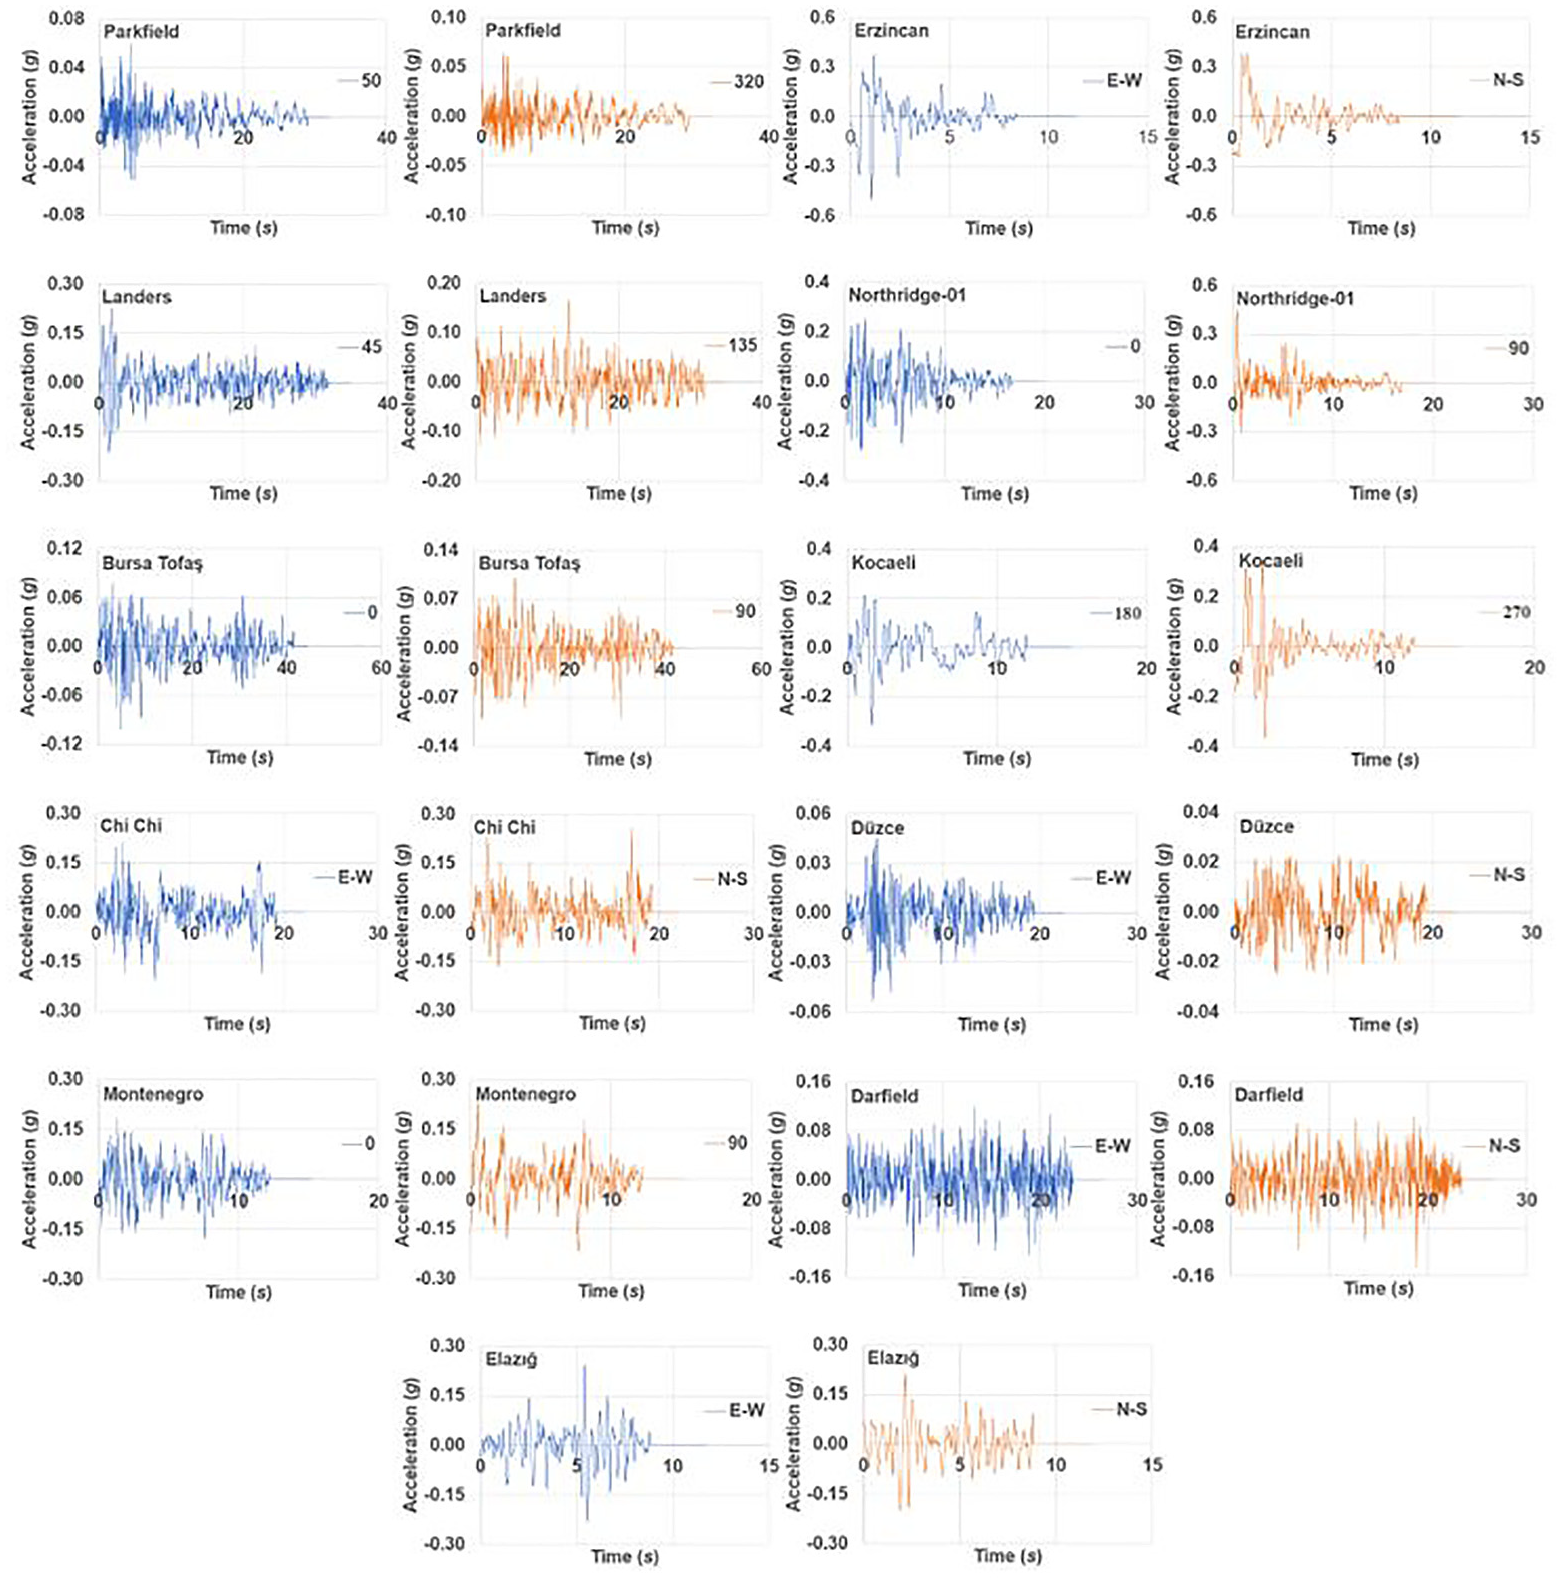
Ground motion acceleration records.
Figure 9 shows the acceleration response spectra of each earthquake ground motion. So as to eliminate the direction dependence of the acceleration spectrum, the horizontal components of spectral acceleration (SaX, SaY) were combined with equation (6). To reduce the computational time of structural analyzes, each record was shortened, similar to some studies on historical masonry (e.g. Camata et al., 2023; Kallioras et al., 2018; Kita et al., 2020; Martínez et al., 2025). The significant duration was determined as the total time between 5% and 95% of the Arias intensity, which is the accumulated energy of the acceleration (e.g. Chen et al., 2024; Freddi et al., 2021; Kempton and Stewart, 2006; Sun et al., 2024). The SeismoSignal (2022) program was used to shorten ground motion records. The analyzes were carried out by adding 3 s as observation time to the significant duration of each record. It should be mentioned that the ground acceleration records were not matched with the design elastic spectrum of the examined minaret:
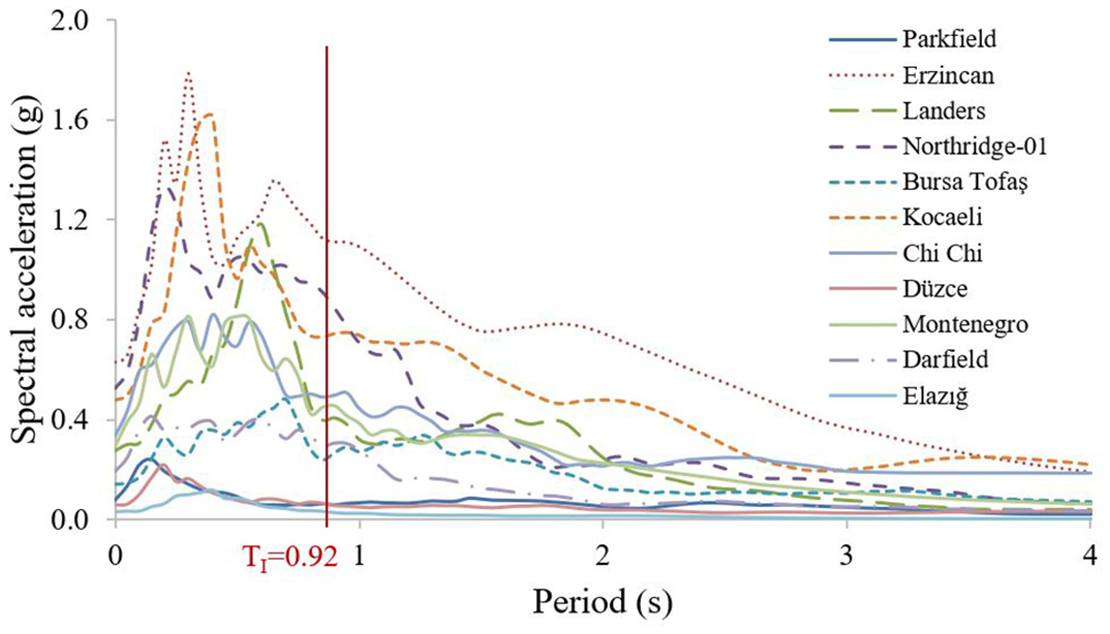
Acceleration response spectrums of the ground motions.
IDA curves
This research aims to determine the seismic risk of the historical minaret by means of fragility curves. As mentioned by Sangadji et al. (2023), fragility is the conditional probability of damage exceeding a predefined limit in seismic intensity. In order to provide data for constructing fragility curves, the Incremental Dynamic Analysis (IDA) procedure, the steps of which were described by Vamvatsikos and Cornell (2002, 2004), was followed. The application of this procedure produces an IDA curve refers to the relationship between the intensity measure of the ground motion record (IM) and the response (damage measure) parameter (DM), for each ground motion record. In this study, 11 records were employed (Table 3), and to reflect feature of the ground motion record, the PGA and the 5%-damped first-mode spectral acceleration, Sa(T1) were selected as the intensity measures. The maximum drift ratio was taken as the damage parameter, which shows the response of the minaret to the record. The procedure followed in this study to obtain the IDA curve for each ground motion is as follows:
1. Peak Ground Acceleration (PGA) values of the two horizontal components of the ground motion record were determined.
2. The scale coefficient was determined so that the lowest value of the two PGA values determined in Step 1 was 0.02g. Then, to scale the earthquake record, the acceleration values of the two horizontal components of the ground motion were multiplied by this scale coefficient.
3. Under this scaled ground motion record, the nonlinear time history analysis of the minaret was performed. The nonlinear time history analysis involved two consecutive steps: In the first step, gravity load was applied to the minaret and the boundary conditions (rotations and translations in three directions) of the bottom of the pulpit were taken as fixed as in the modal analysis. In the second step, ground motion record was imposed simultaneously in two horizontal main directions to the bottom of the pulpit. During this step, the translations in these directions where the earthquake ground motion was applied were released.
4. From the analysis results, the drift ratios in the specified critical sections of the minaret were calculated for two main horizontal directions (X and Y). These critical sections, where geometrical forms and dimensions change, and the upper level of the door opening are considered critical sections (Figure 10). The drift ratio was calculated as the relative translational displacement between two consecutive critical sections divided by the height between these two sections.
5. The nonlinear time history analysis under the scaled ground motion record in Step 3 produces the first ordered pair (x, y) to be plotted on the IDA curve. In this study, the x-component of the pair was taken as the absolute maximum value of the horizontal drift ratios calculated in Step 4, equation (7). In this equation, θmax represents the maximum value of the drift ratios calculated at the specified sections of the minaret (Figure 10):

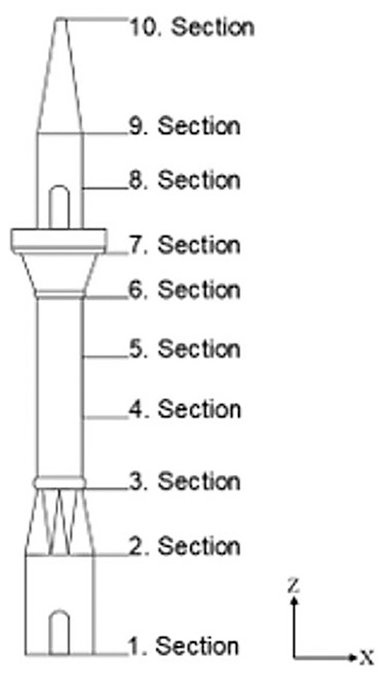
Critical sections of the minaret.
The y-component of the pair was the intensity measure (IM) of each scaled ground motion record. The study represented IM with spectral acceleration Sa(T1, 5%), which is the spectral acceleration at the natural period corresponding to the first mode with 5% critical damping. The spectral accelerations in the two directions were combined with equation (6) and the obtained value is indicated as the y-component on the IDA curve.
6. Different scale coefficients were specified as in Step 2, in order to obtain sufficient (x, y) pairs to draw the IDA curve showing both the linear and nonlinear response of the minaret. These coefficients were determined in increments of 0.02g until the PGA value of the ground motion record reached 0.10g. Then, an increase of 0.01g was adopted. By following Steps 3–5, for each scaled ground motion, the pairs (x, y) were specified. In this study, the scale factors were varied between 0.05 and 3.94.
7. These points were marked on the x-y coordinate axes to draw the IDA curve, indicating the relationship between the spectral acceleration and drift ratio of the minaret under the ground motion record.
By following the Steps 1–7 above for 11 ground motion records in Table 3, the IDA curves for the minaret were obtained, Figure 11.
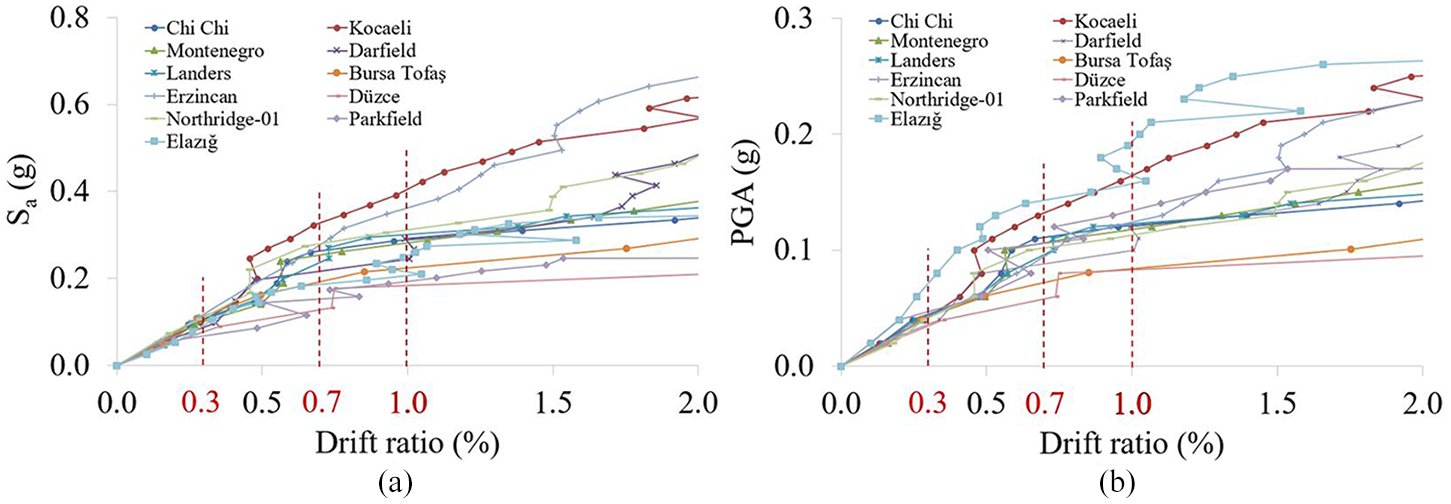
IDA curves: (a) drift ratio–spectral acceleration, (b) drift ratio–peak ground acceleration.
When the IDA curves in Figure 11 are examined, it is seen that the seismic response of the minaret shows a large distribution due to variations in ground motion characteristics. As expected at low IM values, the dispersion in the seismic response is not large: the minaret exhibits linear elastic behavior underground motions with Sa less than about 0.2g. The peak drift ratio where this section ends is around 0.5%, Figure 11. Then, as Sa increases, the minaret exhibits a nonlinear response and the scatter in the response gradually increases, Figure 11.
The suitability of PGA and Sa (g) as IM can be determined by examining the values of correlation coefficient (r) and coefficient of determination (R2) between IM and drift ratio. The correlation coefficients (r) between IM and drift ratio variables were found to be as 0.918 for Sa–drift ratio and 0.915 for PGA–drift ratio relationships. According to Schober et al. (2018), the r-values between 0.90 and 1.00 indicate a very strong correlation between the variables, and being a positive value of r means that the variables are changing together in the same direction. Simple linear regression analyzes on IM-DM data result in a high degree of fit, and the high R2 values (0.8431, 0.8363) also confirm the strong relationship between IM and DM variables, Figure 12.
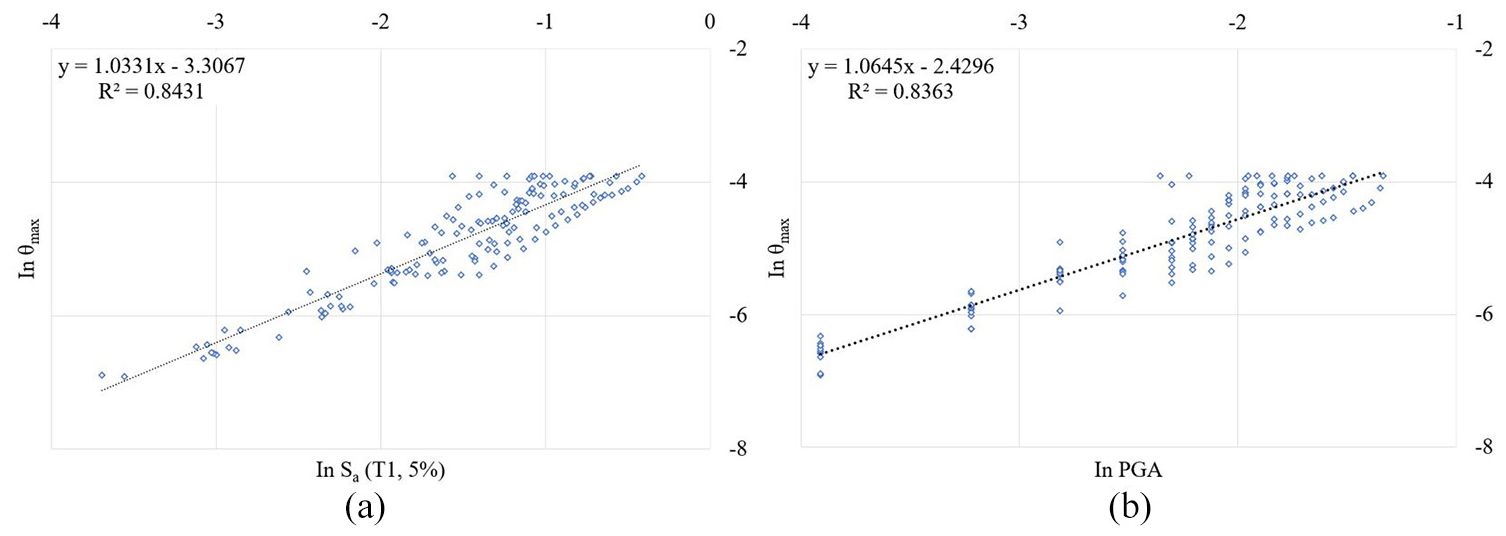
Linear regression analysis: (a) spectral acceleration–drift ratio, (b) peak ground acceleration–drift ratio.
Fragility curves
The probabilistic evaluation of IDA curves can be explained by fragility curves. Fragility curves show the probability of exceeding a given performance level defined by damage limits. In these curves, the IM of the ground motion and the probability of exceeding the specified performance level are indicated on the x-axis and the y-axis, respectively.
In this study, by accepting the performance limits defined by (ERMGHB, 2017), the fragility curves were obtained from IDA curves. Earthquake Risk Management Guide for Historic Buildings (ERMGHB, 2017) defines three performance limits based on the drift ratio for historic buildings as 0.3% for LD, 0.7% for CD, and 1% for CP. In order to plot fragility curves, these drift ratio limits were drawn on the IDA curves in Figure 11a and b, and the spectral acceleration (Sa ) and PGA values corresponding to the damage limits were specified as listed in Table 4.
Sa and PGA values for the performance limits
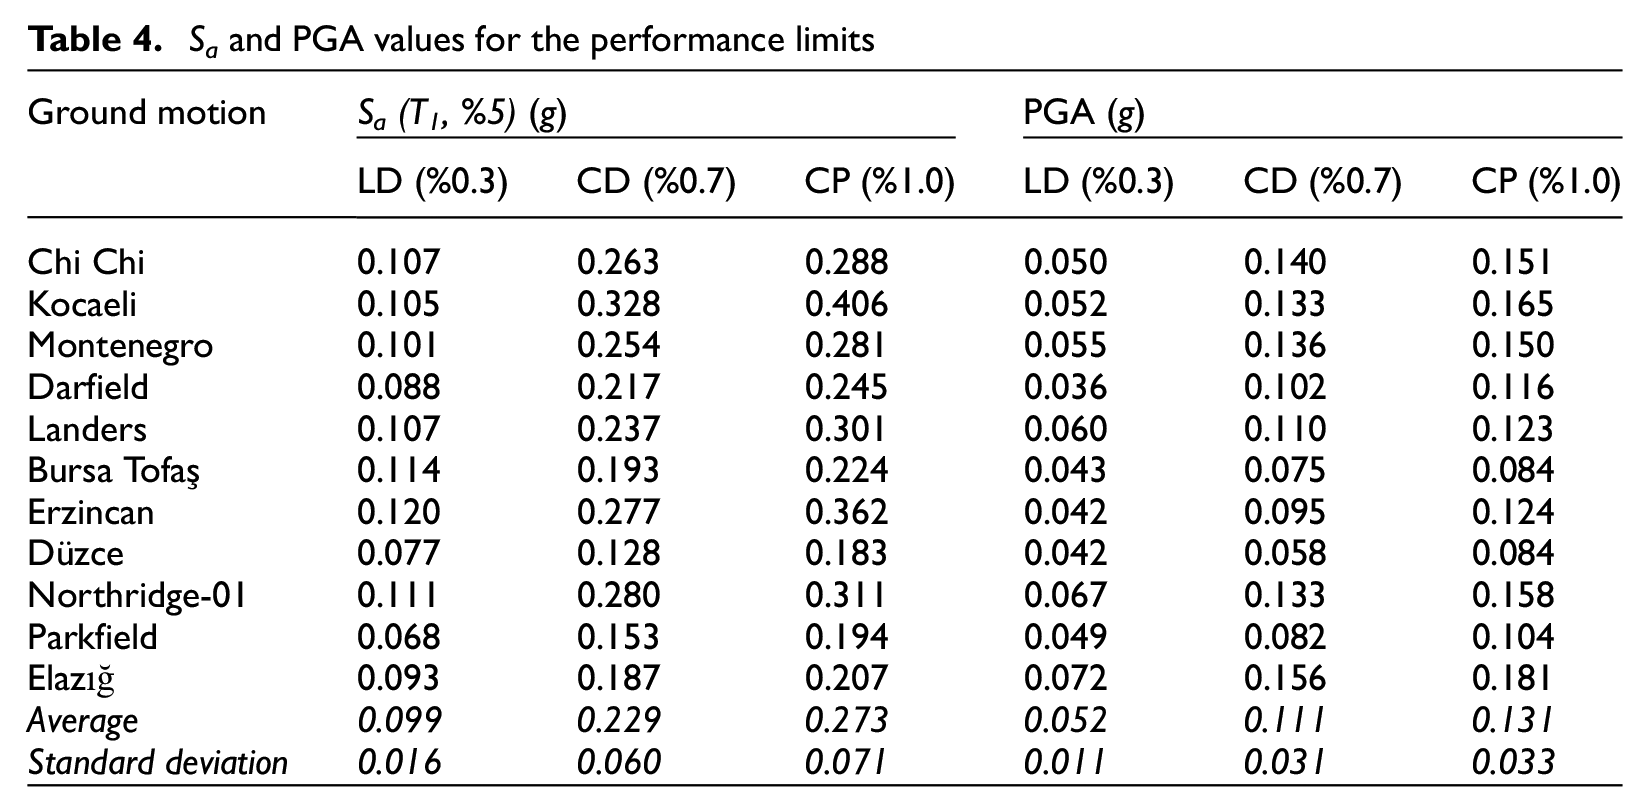
The Sa and PGA values corresponding to each performance limit varied depending on the ground motion records. In order to understand these variations for each performance limit, box plots are drawn in Figure 13a and b, and the average and the average ±standard deviation of Sa and PGA values are plotted in Figure 13c and d. The rectangular box, “×” in the box and the horizontal line in the box and the horizontal end points (Figure 13a and b) represent the width of interquartile range, the average, the median, and the upper/lower points of the data, respectively. The widths of the range of Sa (PGA) variation for CD and CP are larger than those for LD (Figure 13a to d). The average Sa (PGA) values are calculated as 0.099g (0.052g) with a coefficient of variation (CV) of 0.16 (0.21) for LD, 0.229g (0.111g) with a CV of 0.26 (0.28) for CD, and 0.273g (0.131g) with a CV of 0.26 (0.25) for CP. These plots, CV values and Figure 13c and d show that the Sa (PGA) values corresponding to the LD performance level vary within a narrower range than the other two performance limits. The normalized average Sa (PGA) values at CD and CP with respect to those at LD are calculated as 2.31 (2.15) and 2.76 (2.53), respectively.
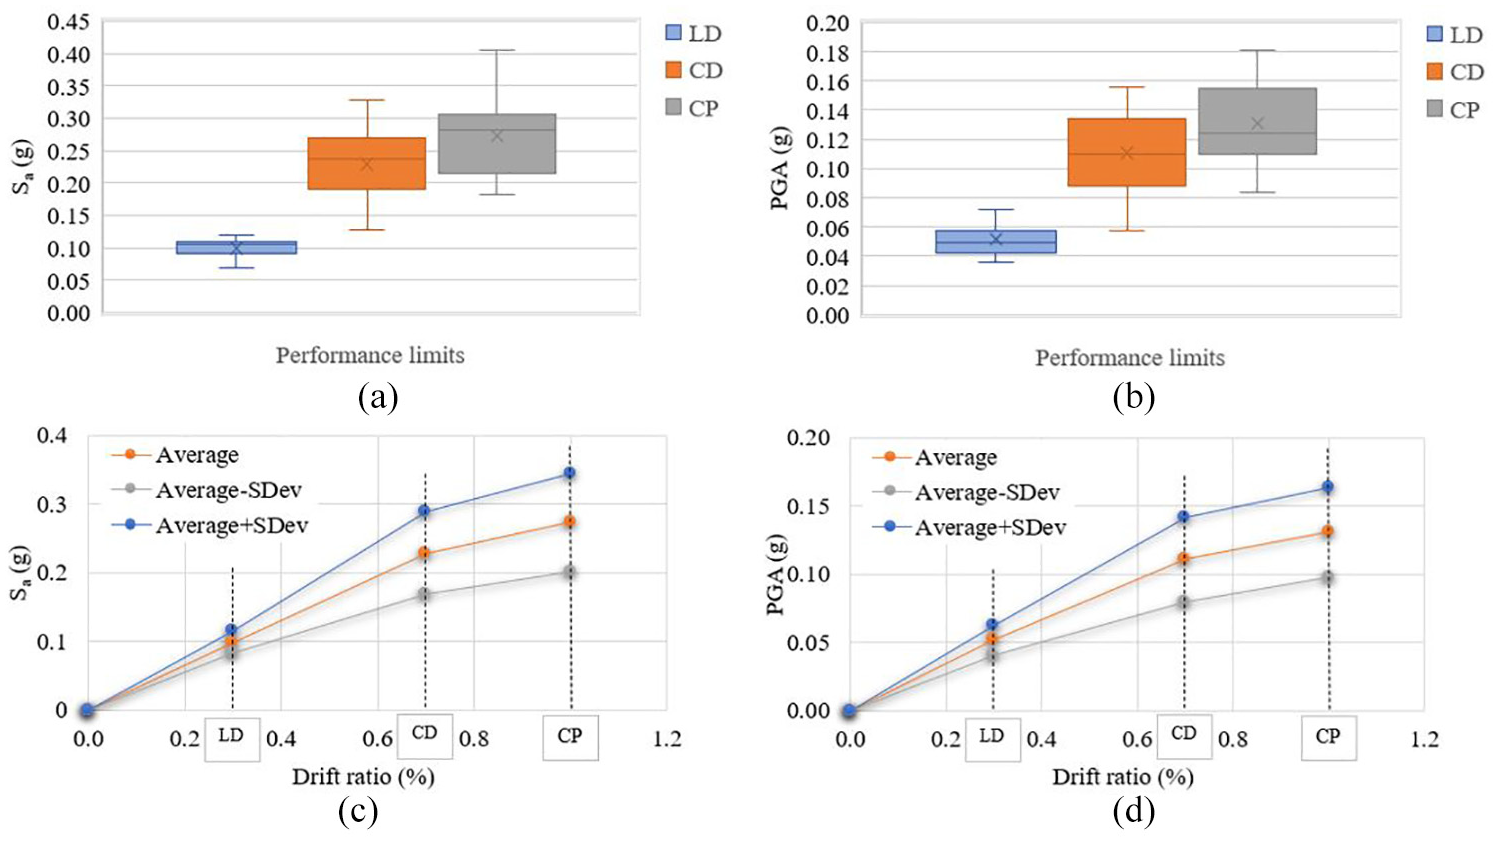
Box plots of (a) spectral accelerations and (b) peak ground acceleration, and the relationships of (c) spectral acceleration–drift ratio and (d) average peak ground acceleration–drift ratio.
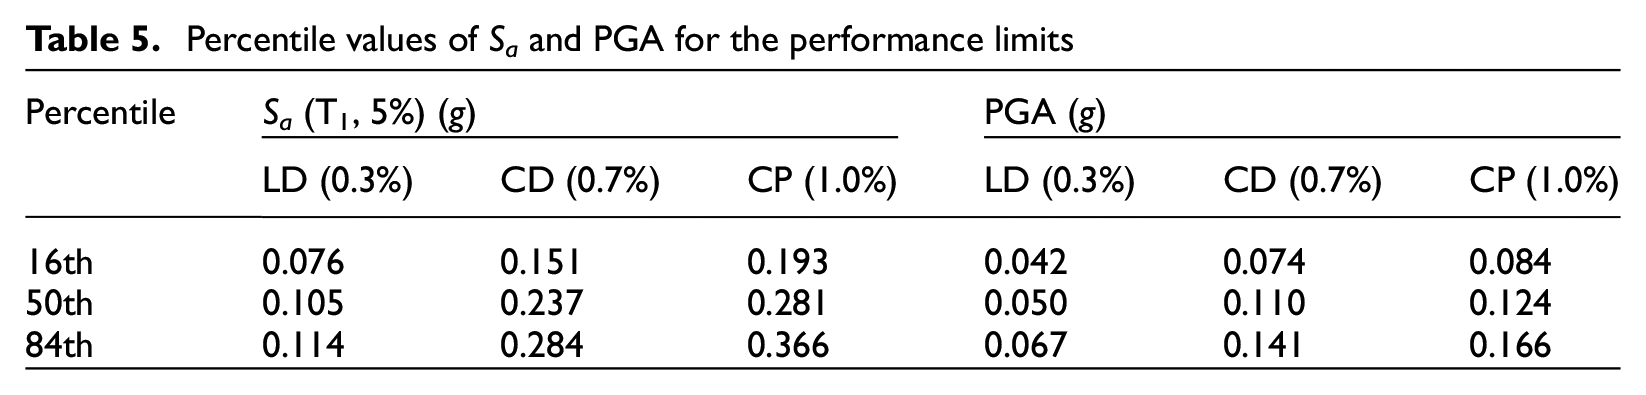
The percentile values of IMs corresponding to the adopted performance limits are calculated from IDA curves and listed in Table 5. For example, at Sa = 0.284g (PGA = 0.141g) level, the 84th percentile of the ground motion records forces the minaret to exceed the limit of CD.
Percentile values of Sa and PGA for the performance limits
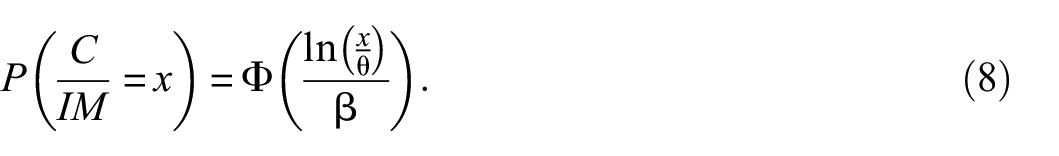
Based on the IDA curves, fragility curves were obtained using equation (8). In this equation, P(C/IM = x) is the probability that a ground motion with IM = x causes the structure to collapse; IM is Intensity Measure (i.e. PGA, Sa ), C is Damage Boundary State, Φ is Cumulative Standard Normal Distribution Function (CDF), θ is the median of the fragility function, and β is the standard deviation for ln (IM). Equation (8) means that the IM values that cause collapse in a given structure are distributed in a lognormal manner. “θ” and “β” need to be estimated based on the results of structural analysis:
By substituting the average and standard deviation values listed in Table 4 into equation (8), the probabilities of exceeding the spectral acceleration and peak ground acceleration were calculated separately for the LD, CD, and CP performance levels, Figure 14.
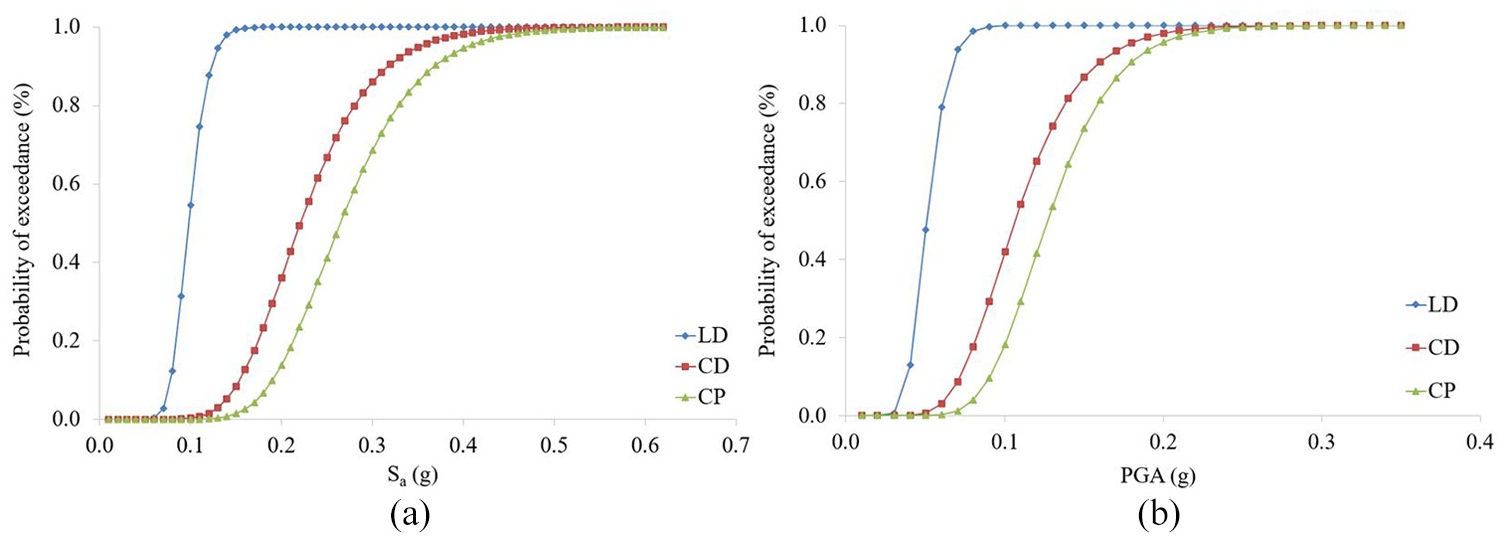
Fragility curves for three performance levels: (a) Sa (g) and (b) PGA (g).
Using the fragility curves in Figure 14, the spectral acceleration (PGA) values corresponding to the probability of exceeding a value of the LD, CD, and CP limits can be estimated for the minaret under consideration (Figure 14a and b). For Sa (PGA) values less than 0.08g (0.05g), the probability of exceeding the LD limit is almost zero. In addition, the probability of a performance level for the minaret may be predicted at a specified value of Sa. When Sa is 0.11g, the minaret is expected to be exposed to slight damage with a probability of 54.6%. The examination of the fragility curves of the minaret shows that the Sa values at the probability of exceeding approximately 100% (50%) of the LD, CD, and CP limits are approximately 0.18g (0.10g), 0.56g (0.23g), and 0.62g (0.27g), respectively (Figure 14a). The Sa (T1) value corresponding to the ∼100% exceedance probability for the CP performance level was obtained as 0.62g. The Sa (T1) values corresponding to the CP limit for each earthquake record are given in Table 4. While obtaining fragility curves, all earthquake records are evaluated together. Therefore, the Sa (T1) value corresponding to the CP limit value may be smaller for some earthquake records, while it may be larger for others.
At the 0.2g-Sa value, the probability exceedance of LD, CD, and CP limits is 100%, 36.1%, and 13.7%, respectively (Figure 15a). The minaret at 0.2g-Sa might experience slight damage with a probability of 63.9%, moderate damage with a probability of 22.4%, and extensive damage with a probability of 13.7% (Figure 15a). In addition, the probability of a performance level for the minaret may be predicted at a specified value of PGA. The examination of the fragility curves of the minaret shows that the PGA values at the probability of exceeding approximately 100% (50%) of the LD, CD, and CP limits are approximately 0.11g (0.05g), 0.30g (0.11g), and 0.31g (0.13g), respectively (Figure 14b). The minaret exhibits the CP performance level at an average PGA value of 0.13g (Table 4) due to the occurrence of tensile damage at a tensile strain of 0.0036 (Figure 7). This is consistent with the inference of Yurdakul et al. (2021) that a historical minaret subjected to a ground motion record with PGA values of 0.17g and 0.18g (in the horizontal directions) failed due to tensile damage. It should be noted that the minaret studied by Yurdakul et al. (2021), which was built in 12th century, is similar to the minaret examined here in terms of parts and materials.
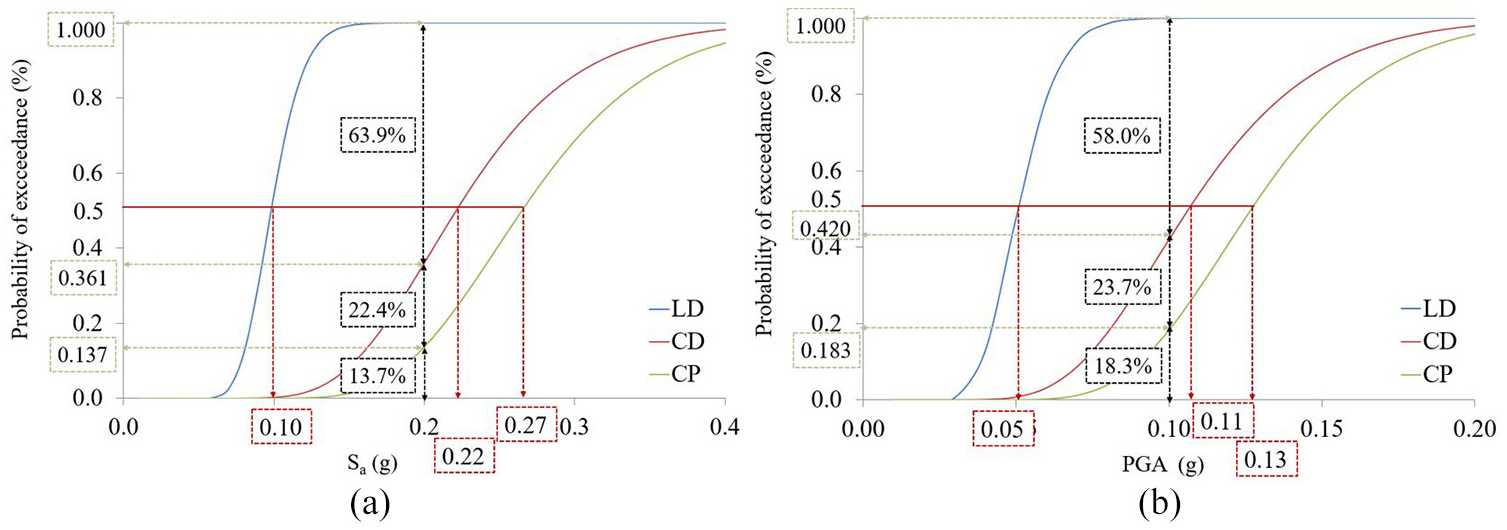
Marking some points on the fragility curves: (a) Sa (g) and (b) PGA (g).
At the 0.1g-PGA value, the probability exceedance of the LD, CD, and CP limits is approximately 100%, 42.0%, and 18.3%, respectively (Figure 15b). The minaret at 0.1g-PGA value might experience slight damage with a probability of 58.0%, moderate damage with a probability of 23.7%, and extensive damage with a probability of 18.3% (Figure 15b).
The finite element analyzes conducted on the minaret indicate that tensile stress concentrations (tensile damage) are generally present in the areas where there are changes in the cross-sectional shape, particularly in the transition regions between the balcony and the upper part (in 90.9% of the minaret analyzes) and/or between the transition and the shaft (in 9.1% of the minaret analyzes), Figure 16. This aligns with the assertion made by Ozaydın (2017) that the upper part of the minaret sustained damage during the earthquake of 1855. The surface-wave magnitude (Ms) of this earthquake is predicted as 7.1 (Ambraseys, 2000). Ozaydın (2017) also reports that the upper parts of the Early Ottoman Period minarets of Sultan Orhan Gazi, Ulu (east and west), Çelebi Mehmed (Yeşil), Hüdavendigar (I. Murat) and Kayhan mosques in the city of Bursa, in addition to the minaret under consideration, were damaged due to the 1855 earthquake. It should be noted that the geometric ratios of these minarets built with brick masonry vary between 9-15 for H/D and 32-92 for H/t, and those of the minaret under consideration are in these ranges.
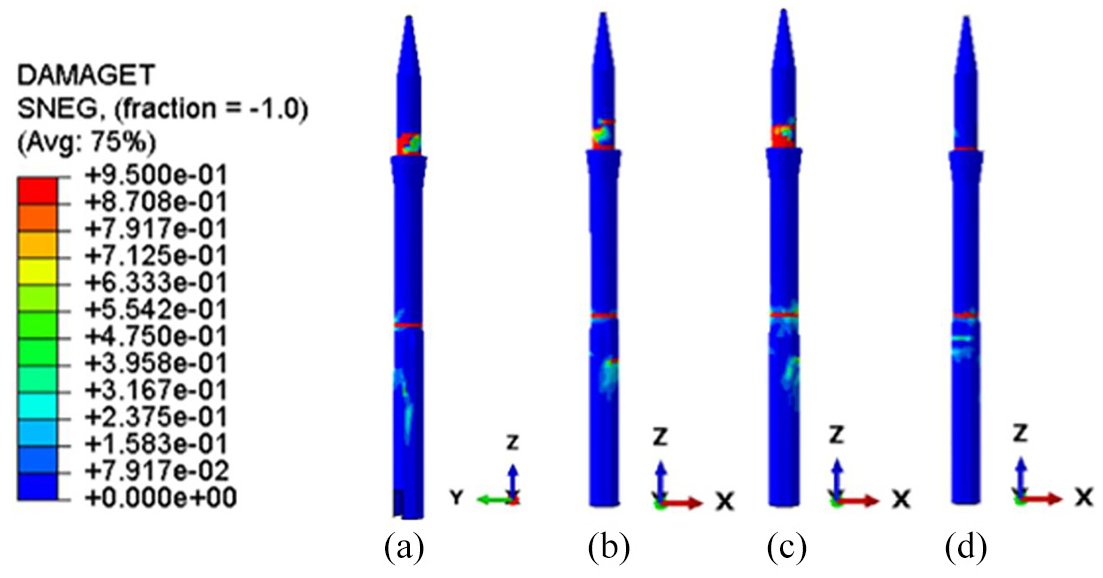
Tensile damage state under (a) Landers, (b) Chi Chi, (c) Montenegro, and (d) Erzincan earthquakes.
Analysis results of this study show that the damage is not distributed through the minaret and non-critical areas show linear elastic behavior. Hence, a simple model, which has a capability of producing similar damage, can be developed or the material model of the non-critical regions can be defined as linear elastic. In this way, it is possible to reduce the required computer capacity and analysis time.
Conclusion
This study aimed to assess the seismic risk of the historical Hocaalizade minaret, which is an exemplar of Early Ottoman Period brick architecture, by obtaining fragility curves for three different performance levels. In order to generate these curves, a total of 190 nonlinear time history analysis were conducted. These analyzes involved applying a set of scaled earthquake ground motion records to the base of the minaret in two different horizontal directions. The main results obtained from this study are outlined as below:
The vulnerability of the minaret to seismic activity was clarified through the use of fragility curves, which were derived from a probabilistic assessment of the IDA curves. When the value of Sa (PGA) is less than 0.08g (0.05g), the likelihood of surpassing the LD limit is nearly negligible. When the value of Sa (PGA) reaches approximately 0.10g (0.06g), it is likely that the minaret will experience minor damage. The Sa values at the probability of exceeding approximately 100% (50%) of the LD, CD, and CP performance limits are approximately 0.18g (0.10g), 0.56g (0.23g), and 0.62g (0.27g), respectively. The PGA values at the probability of exceeding approximately 100% (50%) of the LD, CD, and CP performance limits are approximately 0.11g (0.05g), 0.30g (0.11g), and 0.31g (0.13g), respectively.
The compatibility of PGA and Sa (g) as IM was investigated on statistical measures and the degree of relationship between IM and DM. The statistical measures (box plot, average, standard deviation, coefficient of variation) of IM values at the specified performance limits show that the performances of both IMs are similar. The fact that the relationships between ln Sa–ln θmax and ln PGA-ln θmax have a high R2 indicates a strong correlation between IM and DM and the suitability of both IMs for the minaret under consideration.
Nonlinear time history analysis results show that no compression damage occurred, and tensile damage was observed to be concentrated at the intersection region between the balcony and the upper part in 90.9% of the minaret analyzes, and at the intersection region between the transition and the shaft in 9.1% of the cases.
The fragility curves obtained from this study may be used to evaluate the seismic risk of historical masonry minarets, which were built as brick masonry in the Early Ottoman Period and whose geometric parameters are around H/D = 15 and H/t = 90.
Footnotes
Acknowledgements
The authors wish to thank to AFAD-UDAP for this support. The contributions of Asst. Prof. Dr. Cem Demir, MSc Civil Eng. Fikret Kuran and Asst. Prof. Dr. Ömer Tuğrul Turan are gratefully acknowledged.
Declaration of conflicting interests
The author(s) declared no potential conflicts of interest with respect to the research, authorship, and/or publication of this article.
Funding
The author(s) disclosed receipt of the following financial support for the research, authorship, and/or publication of this article: This study was supported by AFAD-UDAP (Disaster and Emergency Management Presidency-National Earthquake Research Program, G-18-07).