
Abstract
Rupture of an active fault across the Noto Peninsula, Japan, generated a moment magnitude 7.5 earthquake on 1 January 2024 causing multiple cascading hazards with significant impacts on communities. This study focuses on the fire-following-earthquake aspects of the 2024 Noto Peninsula earthquake. Along with a summary of ignition records collected from municipal fire departments and field observations in several large fire-affected areas, the fire-following-earthquake risk that would have been estimated for the building stock is quantified using a hypothetical earthquake source model developed prior to the earthquake. Using this case study, the effect of future climate change on regional fire-following-earthquake risk assessments is also investigated. The 17 fires following the earthquake included both shaking-induced and tsunami-induced fires, 3 of which enlarged significantly outside and within the tsunami inundation zone. The two fires within the tsunami inundation zone started from an inundated building and an inundated automobile and spread to 18 tsunami-inundated buildings in total. The inferred ignition rate for the shaking-induced fires, mostly from electricity-related ignition sources, was high relative to recent large earthquakes in Japan. Conventional factors, including delayed fire detection, unavailable fire hydrants resulting from seismic damage to water supply systems, and inaccessible fire cisterns resulting from collapsed buildings, led to a large fire in downtown Wajima that destroyed ~240 buildings. This fire loss corresponded to a 1.9% conditional exceedance probability according to 6000 stochastically synthesized fire-following-earthquake scenarios. Typical meteorological year data based on global warming projections allow synthetic future hourly weather parameter values to be linked to long-term probabilistic fire losses, revealing that the average increases in hourly air temperature and wind velocity and average decreases in hourly relative humidity in future climate change projections can increase fire loss exceedance probabilities. These findings emphasize that further efforts to reduce the risk of fires following earthquakes are essential.
Keywords
Introduction
The moment magnitude (Mw) 7.5 earthquake that struck the northern Noto Peninsula, Japan, on 1 January 2024 demonstrated that the risk of fires following earthquakes still exists in modern Japanese society, as is likely the case in other earthquake-prone countries with wooden buildings. This large earthquake, potentially resulting from the rupture of mapped submarine active faults (Fujii and Satake, 2024), caused a wide variety of cascading hazards, including geological uplift, liquefaction, landslides, tsunamis, and fires, as well as ground shaking (Suppasri et al., 2024). In particular, strong ground shaking had a destructive impact on communities, resulting in over 6000 heavily damaged buildings (Fire and Disaster Management Agency (FDMA), 2024). In addition, a large tsunami inundated over 1.9 km2 of land (Yuhi et al., 2024), though its impact on communities was smaller than that of the ground shaking.
The ground shaking and tsunami subsequently triggered 17 fires (Fire and Disaster Management Investigation Commission Based on the Great Wajima City Fire (FDMIC), 2024): 15 fires outside the tsunami inundation zone and 2 fires within the tsunami inundation zone. The most notable fire in terms of the burned area started in downtown Wajima, Ishikawa Prefecture, a coastal urban area with wooden buildings that was not inundated by the tsunami. Except for the two fires within the tsunami inundation zone, this was the only fire that developed into a conflagration, involving approximately 240 buildings (FDMIC, 2024); the other fires, conversely, did not enlarge significantly. The ignition of the large fire in Wajima was likely attributable to ground shaking; this is a conventional type of fire following earthquake that has been observed historically, including following the 1906 San Francisco (Scawthorn et al., 2006), 1923 Kanto (Scawthorn et al., 2023), 1994 Northridge (Scawthorn et al., 1996), and 1995 Kobe (Hokugo, 1997) earthquakes.
The two fires within the tsunami inundation zone, which were not as large as the fire in Wajima, should not be ignored, because these fires support the occurrence of fires as a consequence of tsunami inundation, referred to as tsunami fires or tsunami-induced fires, an emerging type of fire following earthquake that has been recognized since the 2011 Tohoku earthquake (Hokugo et al., 2013; Nishino et al., 2024; Nishino and Imazu, 2016, 2018; Porter et al., 2013). In the 2011 Tohoku earthquake, the tsunami fires mostly started from tsunami debris (including wooden houses, automobiles, and various other items) that was washed away and accumulated by the tsunami, or started while tsunami debris was being transported by the tsunami and then accumulated while burning. Subsequently, the fires spread to nearby accumulated debris and remaining houses not washed away by the tsunami, burning more than 61 ha in the tsunami inundation area (Japan Association for Fire Science and Engineering (JAFSE), 2016). It has been suggested that flammable gases related to the tsunami debris, such as vaporized gasoline leaking from automobile fuel tanks and vaporized liquefied petroleum gases (LPGs) leaking from household LPG cylinders, may have contributed to the occurrence of these fires (JAFSE, 2016). Meanwhile, there were also tsunami fires following the 2011 Tohoku earthquake caused simply by the presence of water in areas where the tsunami intensity was not high; these may have originated from electrical systems in buildings and automobiles inundated by the tsunami (JAFSE, 2016). Fires as a consequence of tsunami inundation here refer to these various types of fires in tsunami inundation areas and suggest a fire safety issue for important facilities in tsunami inundation areas, such as tsunami vertical evacuation structures.
One of the noteworthy aspects of the 2024 Noto Peninsula earthquake is that, although a government-commissioned project (Ministry of Land, Infrastructure, Transport and Tourism (MLIT), 2014) previously published hypothetical earthquake source models that characterized the possible rupture of submarine active faults in the vicinity of the Noto Peninsula (Figure 1), including those that potentially ruptured on 1 January 2024 (Fujii and Satake, 2024), these source models were not sufficiently used in local government earthquake consequence predictions and risk reduction planning. Specifically, joint inversions of tsunami waveform and GNSS data from the 2024 Noto Peninsula earthquake (Fujii and Satake, 2024) suggest that the coseismic slip on 1 January 2024 occurred solely on the F43 active fault, which was proposed in 2014 by a government committee jointly supported by the Ministry of Land, Infrastructure, Transport and Tourism (MLIT) (2014), the Ministry of Education, Culture, Sports, Science and Technology, and the Cabinet Office of Japan, and that the estimated slip on the F43 fault and the Mw of the 2024 earthquake were slightly smaller than the 2014 government committee predictions (specifically, the F43 fault model proposed in 2014 has a Mw of 7.6). Prior to the 2024 event, Ishikawa Prefecture (2017), and a study by Mulia et al. (2020), conducted tsunami hazard assessments using the F43 fault model proposed in 2014. However, no additional assessments were conducted focusing on other earthquake hazards and risks, including not only post-earthquake fires but also ground shaking. As a result, the consequence predictions for earthquake hazards other than tsunamis in Ishikawa Prefecture remained the same as those in 1998, which did not include the F43 fault, and the risk reduction strategies for those hazards were not updated.
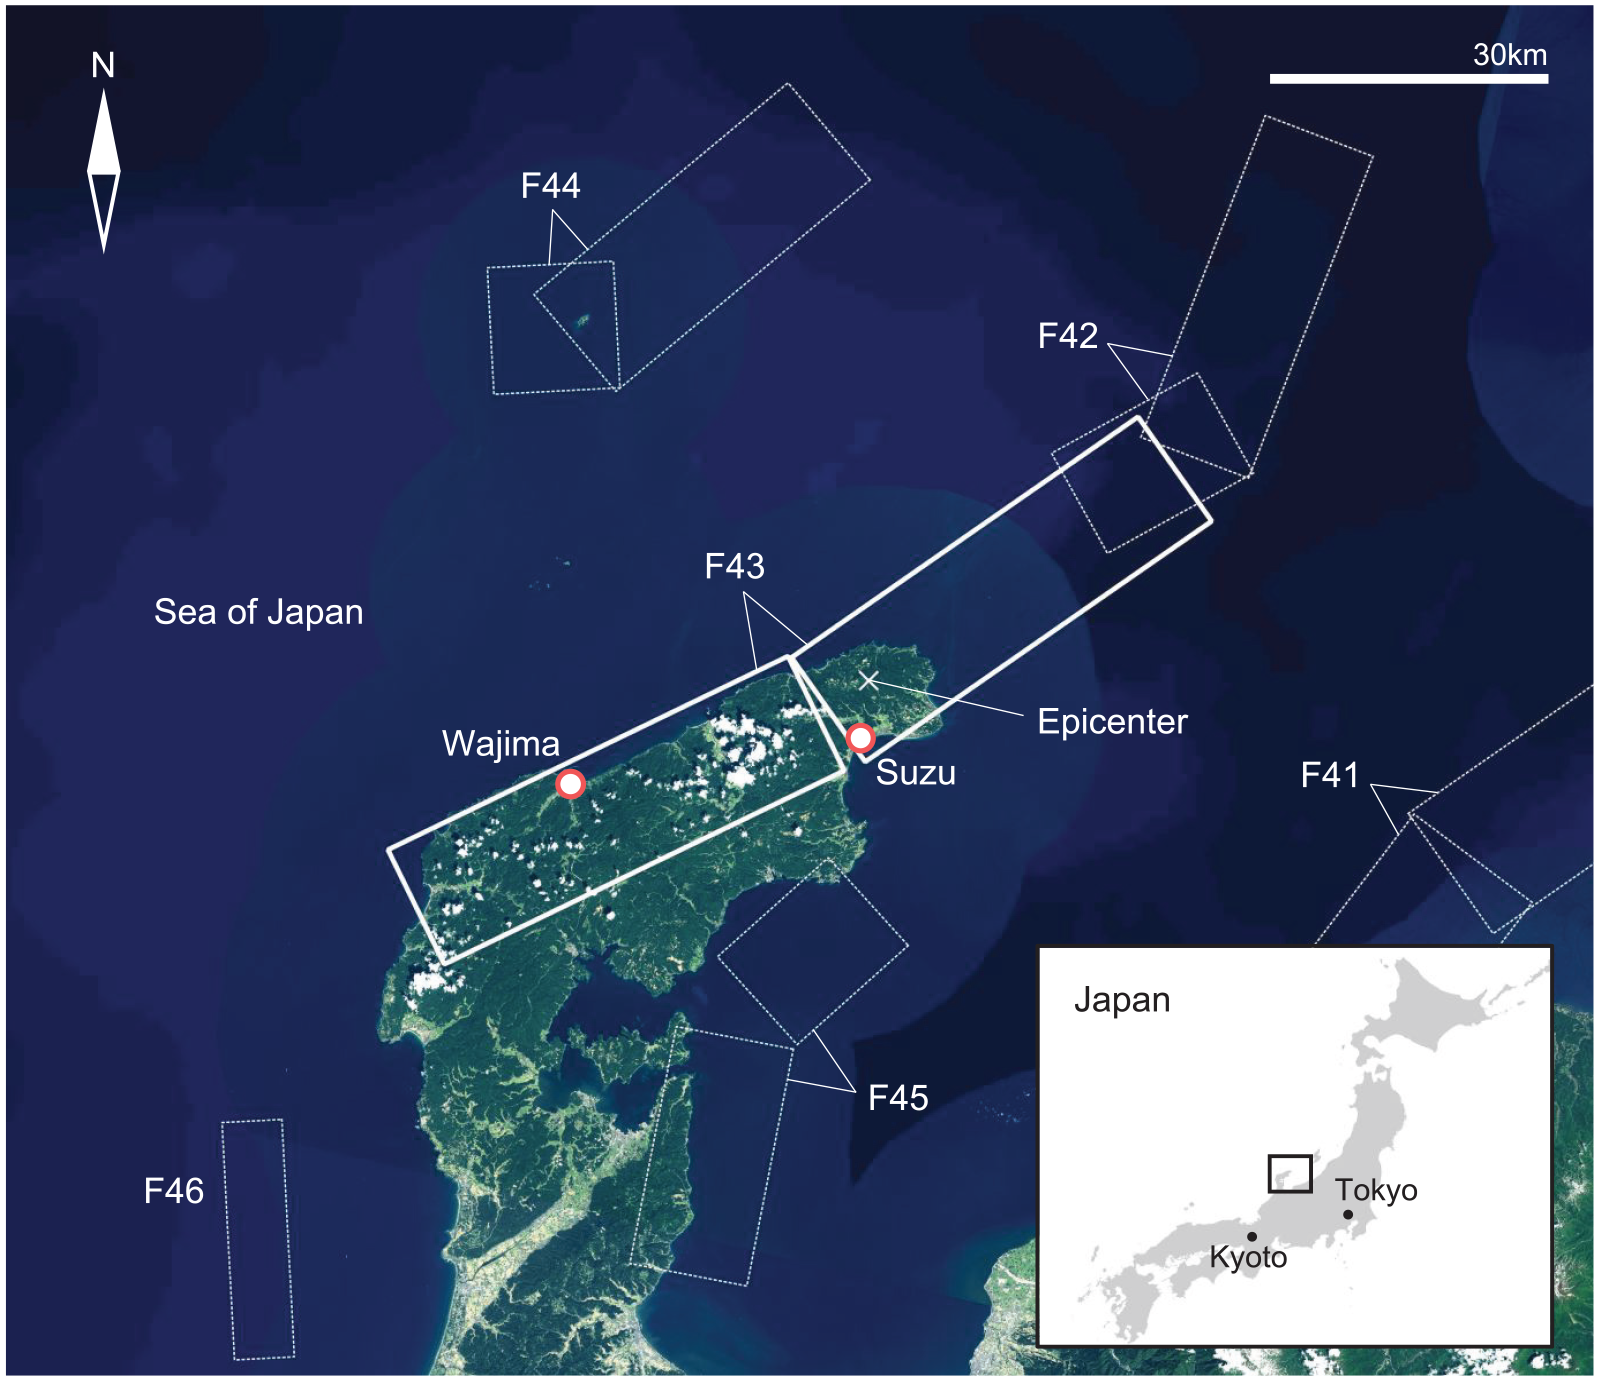
Locations of submarine active fault models in the vicinity of the Noto Peninsula proposed in 2014 (MLIT, 2014): surface projection of the fault models displayed on an aerial photograph provided by the Geospatial Information Authority of Japan.
Given that the 2024 Noto Peninsula earthquake was similar to the underutilized F43 fault model in terms of its source region and Mw, the following question arises with respect to fires following earthquakes. If a quantitative regional risk assessment had been conducted for fires following earthquakes using the F43 fault model, what would have been the results and how would they have related to the actual consequences of the fires following the 2024 Noto Peninsula earthquake?
Regional fire-following-earthquake risk assessments (Coar et al., 2021; Cousins et al., 2012; Julia et al., 2021; Mascheri et al., 2024; Nishino, 2023b; Nishino et al., 2012; Scawthorn, 2011; Scawthorn, 2021) typically combine multiple process models, including ground shaking, ignition, fire spread, and firefighting models, and provide probabilistic information concerning fire losses to a building stock by considering various fire scenarios depending on aleatory uncertainties, such as the time of day, the number and location of ignitions, and the wind velocity and direction. Epistemic uncertainty, that is, uncertainty caused by lack of knowledge in selecting the best empirical ignition model, can also be incorporated into fire-following-earthquake risk assessments by considering alternative models (Nishino, 2023a). In particular, using different ignition models, which are typically regression models based on data from past large earthquakes, has a significant impact on fire-following-earthquake risk estimates (Nishino, 2023a). These methodologies allow us to address the above question, leading to an increase in practical information concerning fire-following-earthquake risk assessments as well as a better understanding of the fires following the 2024 Noto Peninsula earthquake.
Incidentally, an attempt has been made to incorporate fire-following-earthquake models into seismic risk assessments, which have evolved into regional cascading multi-hazard risk assessments (Nishino, 2023b). These assessments focus on direct economic losses to a building stock caused by the combined effect of ground shaking and post-earthquake fires and quantify the exceedance probability of the regional shaking–fire losses in a predefined future period (e.g. within 50 years) by considering various shaking- and fire-related uncertainties via Monte Carlo simulations. Because fire losses, unlike shaking losses, are highly dependent on weather conditions, this groundbreaking study raises a new question. How much will future climate change affect the fire-following-earthquake risk in the context of long-term seismic risk assessments? Several climate models used in the Intergovernmental Panel on Climate Change (IPCC) (2007) Fourth Assessment Report, based on different possible future greenhouse gas emission scenarios, have projected that, by the end of the twenty-first century, global average temperatures will increase by 1.1°C to 6.4°C relative to the 1980–1999 average. These projections have stimulated the development of various future weather data available for building performance simulations to consider future climate change in building design, as reviewed by Arima et al. (2023) and Nielsen and Kolarik (2021). For example, Soga (2018) synthesized global warming projections with hourly observed weather data, developing future typical meteorological year (TMY) data. TMY data refer to a set of hourly weather data for a 1-year period that represents typical meteorological conditions for a given location (Hall et al., 1978). Data are selected for each month over a long period of time (e.g. 10 years or more), and such data for 12 typical months are strung together as a synthetic 1-year weather sequence. Future TMY data should also be useful for obtaining better assessments of the long-term risk from fires following earthquakes.
Accordingly, the key objectives of this study are (1) to gain insights into the 2024 Noto Peninsula earthquake with a special focus on fire-following-earthquake aspects and (2) to investigate the effect of future climate change on regional fire-following-earthquake risk assessments using synthetic weather data based on global warming projections. First, to capture the overall situation and characteristics of the fires following the 2024 Noto Peninsula earthquake, the ignition records collected from municipal fire departments and field observations in several large fire-affected areas, including outside and within the tsunami inundation zone, are summarized with a statistical analysis of the ignitions and a qualitative discussion focusing on the large fires. Then, the fire-following-earthquake risk that the building stock had prior to the 2024 earthquake is quantified using the previously published but underutilized F43 fault model and its correlation with the actual consequences of the fires following the 2024 earthquake, such as the number of burned buildings, is discussed. This assessment focuses on downtown Wajima, which comprised an urban area with closely spaced wooden buildings prior to the 2024 earthquake and experienced the largest fire following the 2024 earthquake. An up-to-date regional fire-following-earthquake risk model of Japan (Nishino, 2023a, 2023b), developed prior to the 2024 earthquake, is used to generate fire loss exceedance curves and to map burn probabilities for individual buildings, considering both aleatory and epistemic uncertainties. Finally, by incorporating future TMY data based on global warming projections, the risk model is extended to include the effects of possible future climate change. In addition to outdoor air temperature and wind velocity and direction, relative humidity is newly included to consider its effect on the moisture content in the exterior walls of wooden buildings. Using this extended model, fire loss exceedance curves are quantified for two TMYs of the baseline (1981–1995) and future (2077–2095) periods as a derivative of the above case study for downtown Wajima using the F43 fault model.
Note that, because this is a prospective assessment (i.e. the assessment is performed as if it had been performed prior to the earthquake), the risk model components, including the seismic hazard model, building stock model (exposure model), ignition model, fire spread model, and firefighting model, are implemented without being calibrated to the actual situation of the 2024 earthquake. Of course, a retrospective analysis is also important to better understand the 2024 earthquake and to improve our prediction models; that is, the actual urban fire spread must be simulated based on the actual ground motions, the actual time of day, and the actual winds. Because an important question arises from the non-negligible circumstance that a fault model similar to the 2024 earthquake had been previously published but was underutilized in earthquake-consequence prediction practice, this study takes a different approach from that usually taken, with the retrospective analysis left to future work.
Ignitions and large fire damage
Based on the author’s survey and publicly available information, this section presents and interprets data concerning the fires following the 2024 Noto Peninsula earthquake, focusing on ignitions and large fire damage. Because three large fires were known from publicly available information no later than 2 days after the earthquake, a field survey was conducted on 13 January and 4 February 2024 to observe the damage caused by these fires. Subsequently, to capture all fires associated with the earthquake, self-administered questionnaires were mailed to seven municipal fire departments affected by the earthquake on 1 March 2024. The questionnaires were designed to gather data concerning each fire, including the location; type (i.e. building fire, wildland fire, vehicle fire, ship fire, aircraft fire, and others); cause (i.e. ignition source, ignition sequence, and first fuel ignited); date and time of ignition, detection, initiation of firefighting, control, and extinguishment; extent of damage; and other relevant information. Five completed questionnaires were collected before 29 March 2024. In the remaining municipal fire departments, the fire information is based on a report published by a government committee jointly supported by the Fire and Disaster Management Agency and the Ministry of Land, Infrastructure, Transport and Tourism (FDMIC, 2024).
Data
Figure 2 plots the locations of fires following the 2024 Noto Peninsula earthquake on a map of the estimated peak ground velocity (PGV) distribution provided by a quick estimation system called QUIET+ (Kozo Keikaku Engineering (KKE), 2023) and on a map showing the tsunami inundation zone identified by the Geospatial Information Authority of Japan (GSI) (2024). A total of 17 fires, including 15 outside and 2 within the tsunami inundation zone, affected 10 municipalities in 3 prefectures. In particular, the Oku-Noto Fire Emergency Medical Service, the fire department whose service area included the epicenter and covered several municipalities, responded to six fires that occurred in its service area; eventually, three of these fires significantly enlarged, although the fire engines (excluding volunteer fire departments) outnumbered the fires when viewed as a whole. The 15 fires outside the tsunami inundation zone occurred not only on the peninsula close to the epicenter (with high seismic intensities) but also in areas distant from it (with low seismic intensities). These fires included 13 building fires; of these, 12 building fires occurred or likely occurred as a consequence of ground shaking (hereinafter referred to as the shaking-induced fires, including possible shaking-induced fires), such as fires caused by damage to and movement and overturning of goods and equipment and by electrical power restorations, while the remaining fire was strongly related to human factors rather than ground shaking.
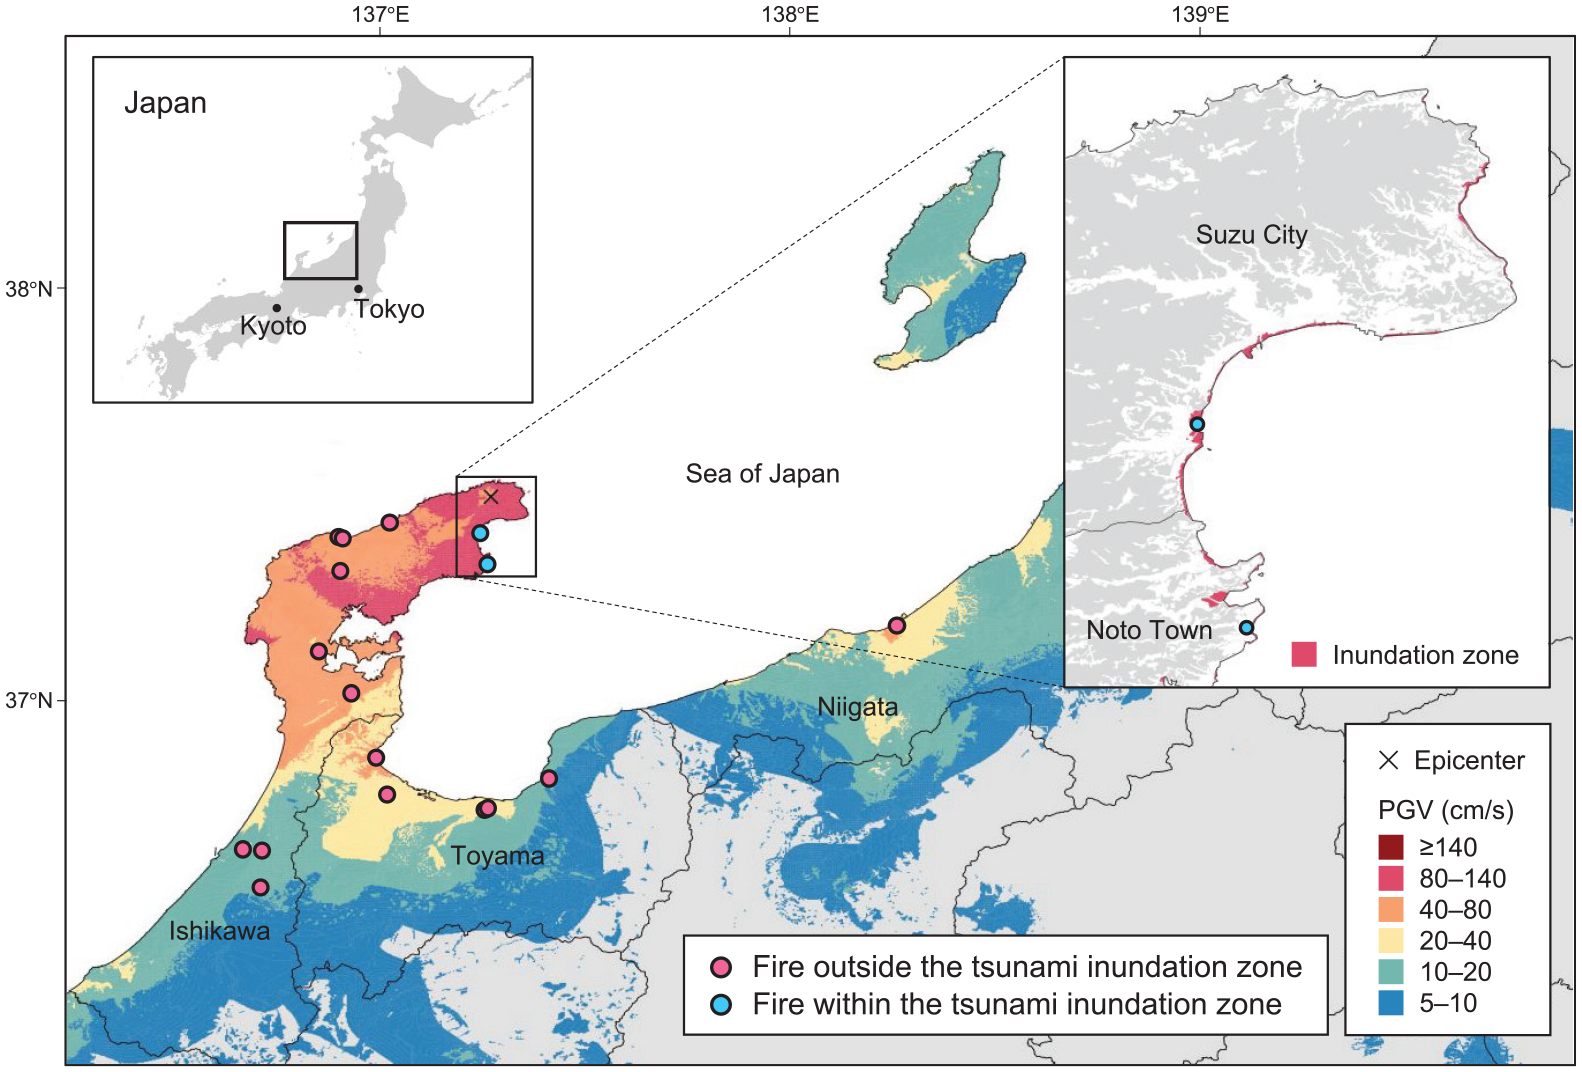
Locations of the fires following the 2024 Noto Peninsula earthquake plotted on the estimated peak ground velocity (PGV) distribution provided by QUIET+ (KKE, 2023) and on the tsunami inundation zone identified by the Geospatial Information Authority of Japan (GSI) (2024).
Of the 12 shaking-induced building fires, 11 occurred on the day of the earthquake (1 January 2024) and 1 occurred on the following day. Details of the fire on the following day are as follows. The homeowner returned to the house from a shelter the day after the earthquake. When the homeowner smelled a burning smell approximately 2 h later and checked the house, the homeowner found that the floorboards had been burned by a storage heater that had fallen over in the hallway.
The two fires within the tsunami inundation zone occurred on the day of the earthquake. These fires occurred or likely occurred as a consequence of tsunami inundation (hereinafter these are referred to as the tsunami-induced fires, including possible tsunami-induced fires); specifically, one started from a building inundated by the tsunami and the other originated from a battery in the engine compartment of a tsunami-inundated automobile (FDMIC, 2024).
Focusing on the 12 shaking-induced building fires, Figure 3 summarizes the ignition sources and compares this with data from six major earthquakes in Japan from 1995 to 2022 (Nishino, 2023a). Of the 12 shaking-induced building fires following the 2024 Noto Peninsula earthquake, 6 resulted from electricity-related sources, such as electrical appliances, equipment, and wiring; 2 resulted from oil heaters; 2 resulted from other sources, such as molten metal in factories; and the remaining 2 had unknown causes. This supports the qualitative tendency of fire-following-earthquake ignition sources that has been observed over the last 30 years in Japan. Namely, electricity-related fires have accounted for the majority of fires following earthquakes, while conventional ignition sources, such as gas appliances, oil heaters, and open flames, have not caused many fires.
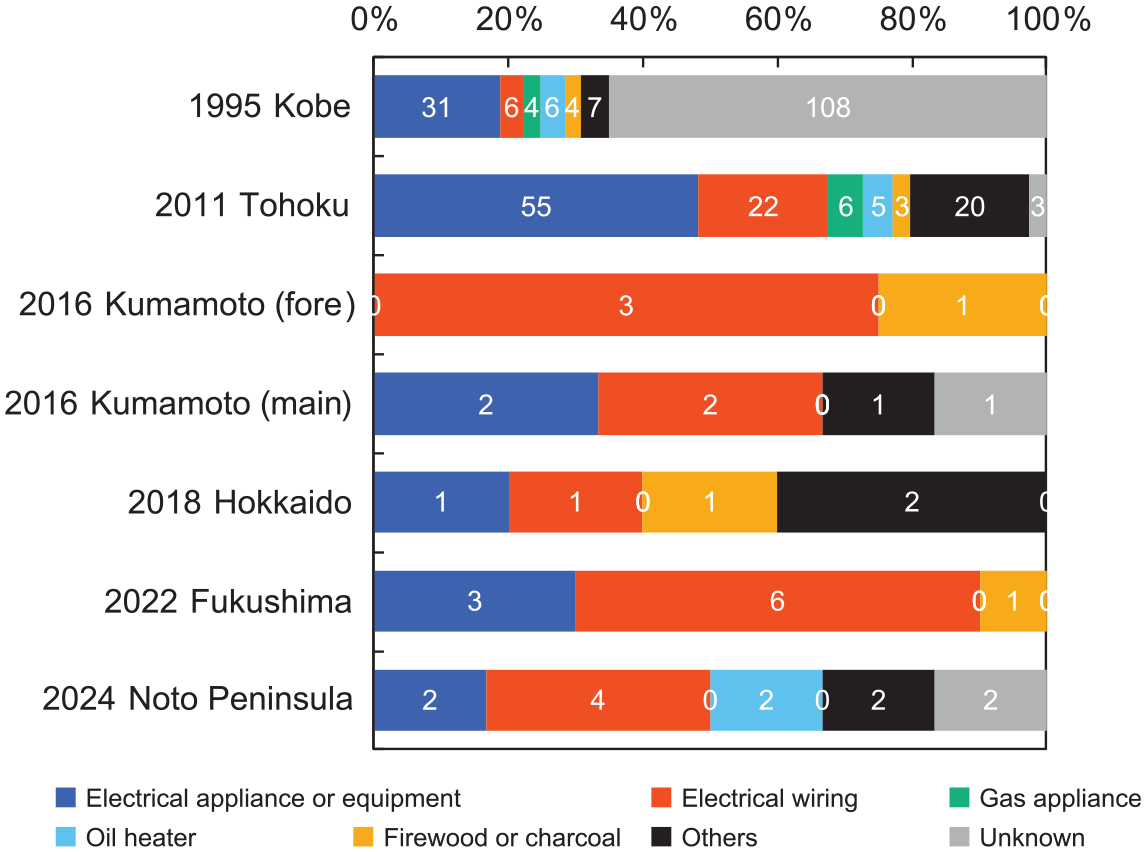
Ignition sources for the 12 shaking-induced building fires following the 2024 Noto Peninsula earthquake and comparison with data from major earthquakes in Japan from 1995 to 2022 (Nishino, 2023a).
Three fires following the 2024 Noto Peninsula earthquake became significantly enlarged. Figure 4 shows several images reflecting the post-event situation in these large fire-affected areas. The three enlarged fires were (FDMIC, 2024) (1) a fire in Kawai Town, Wajima City, Ishikawa Prefecture, that burned approximately 4.9 ha of a coastal urban area not inundated by the tsunami, including 240 burned buildings; (2) a fire in Ukai District, Horyu Town, Suzu City, Ishikawa Prefecture, that burned approximately 0.09 ha of a fishing village inundated by the tsunami, including 7 burned buildings; and (3) a fire in Shiromaru District, Noto Town, Ishikawa Prefecture, that burned approximately 0.17 ha of a fishing village inundated by the tsunami, including 11 burned buildings. The fire in Kawai Town, Wajima City, was a conventional type of urban fire following earthquake, similar to those following the 1995 Kobe earthquake, in which seismic damage to buildings, roads, and water supply systems impeded firefighting and enhanced urban fire development. In contrast, the remaining two fires, called tsunami fires or tsunami-induced fires (Hokugo et al., 2013), were an emerging type of fire following earthquake highlighted by the 2011 Tohoku earthquake, in which fires were initiated as a consequence of tsunami inundation and spread by floating or accumulated tsunami debris and buildings not washed away by the tsunami.
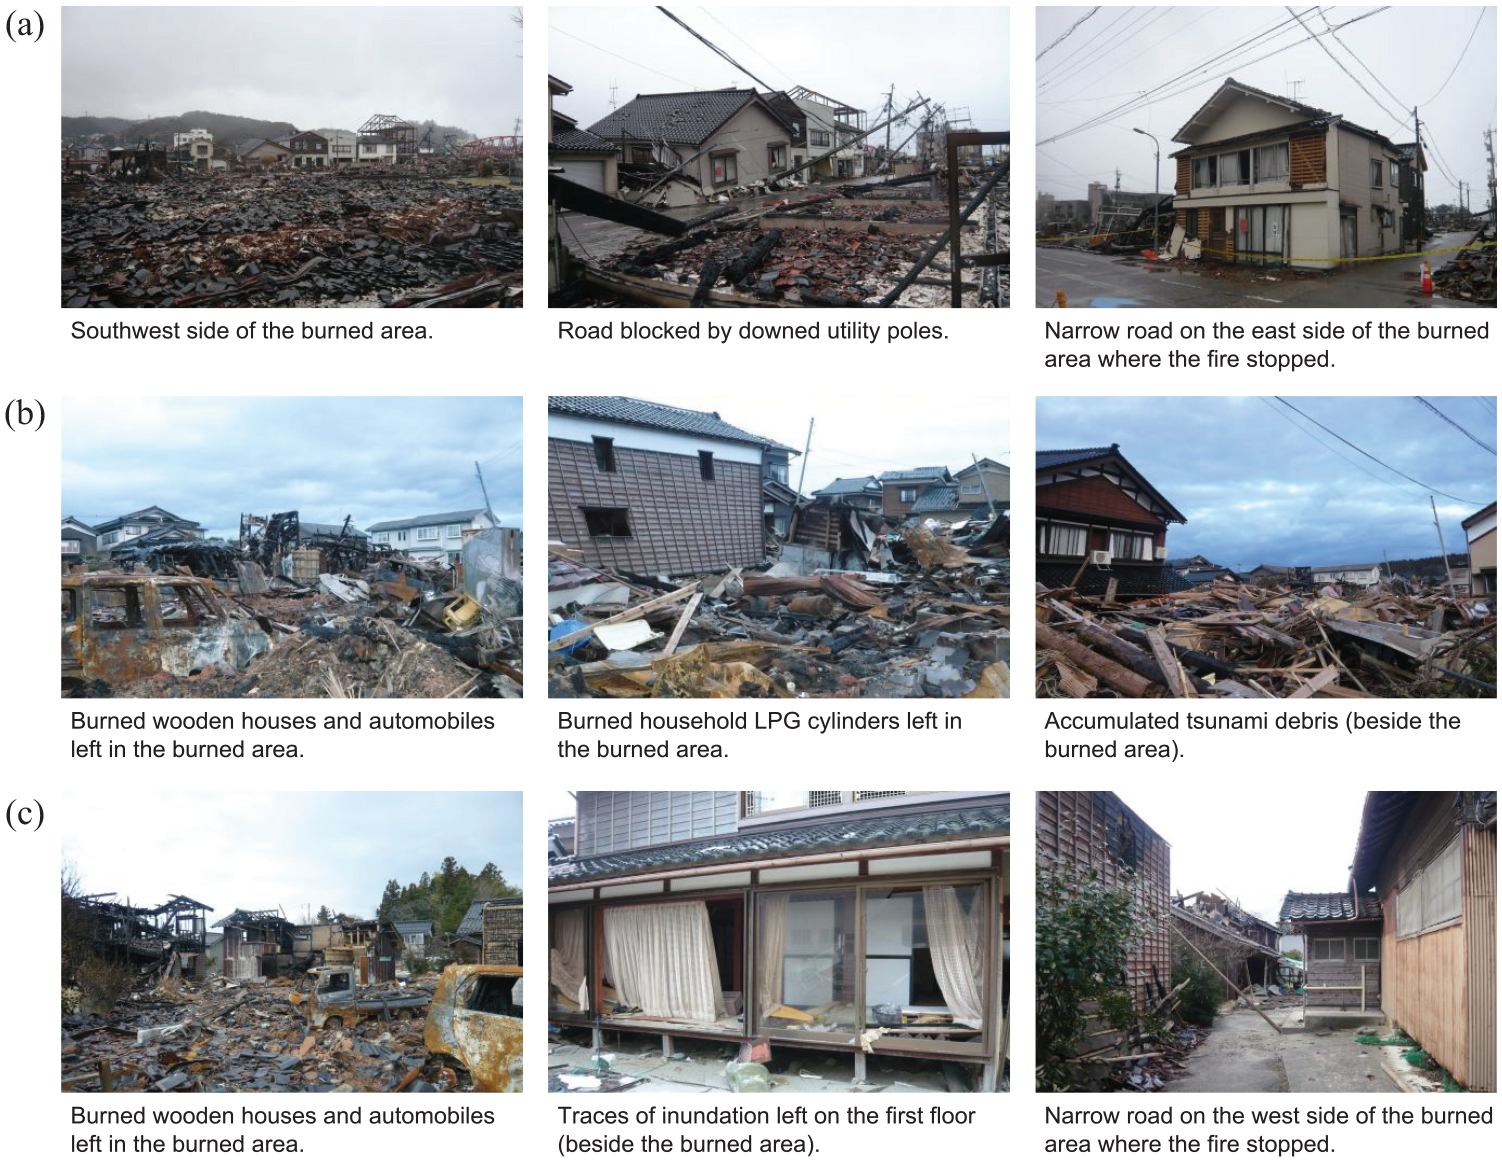
Post-event situation of the areas affected by the three large fires following the 2024 Noto Peninsula earthquake: (a) the fire in Kawai Town, Wajima City, (b) the fire in Ukai District, Horyu Town, Suzu City and (c) the fire in Shiromaru District, Noto Town.
Figure 5 shows a fire progression map of Kawai Town, Wajima City. The fire destroyed a coastal urban area surrounded by the sea to the north and the river to the west, with closely spaced, mostly wooden buildings without exterior wall fire protection. The burned zone plotted on the map, with an area of approximately 4.9 ha, was identified in a field observation conducted on 13 January 2024, while the other plotted information, including the fire front lines at specific times and the locations where firefighting was successful in preventing fire spread, is based on publicly available information, such as press photographs and the government committee report (FDMIC, 2024).
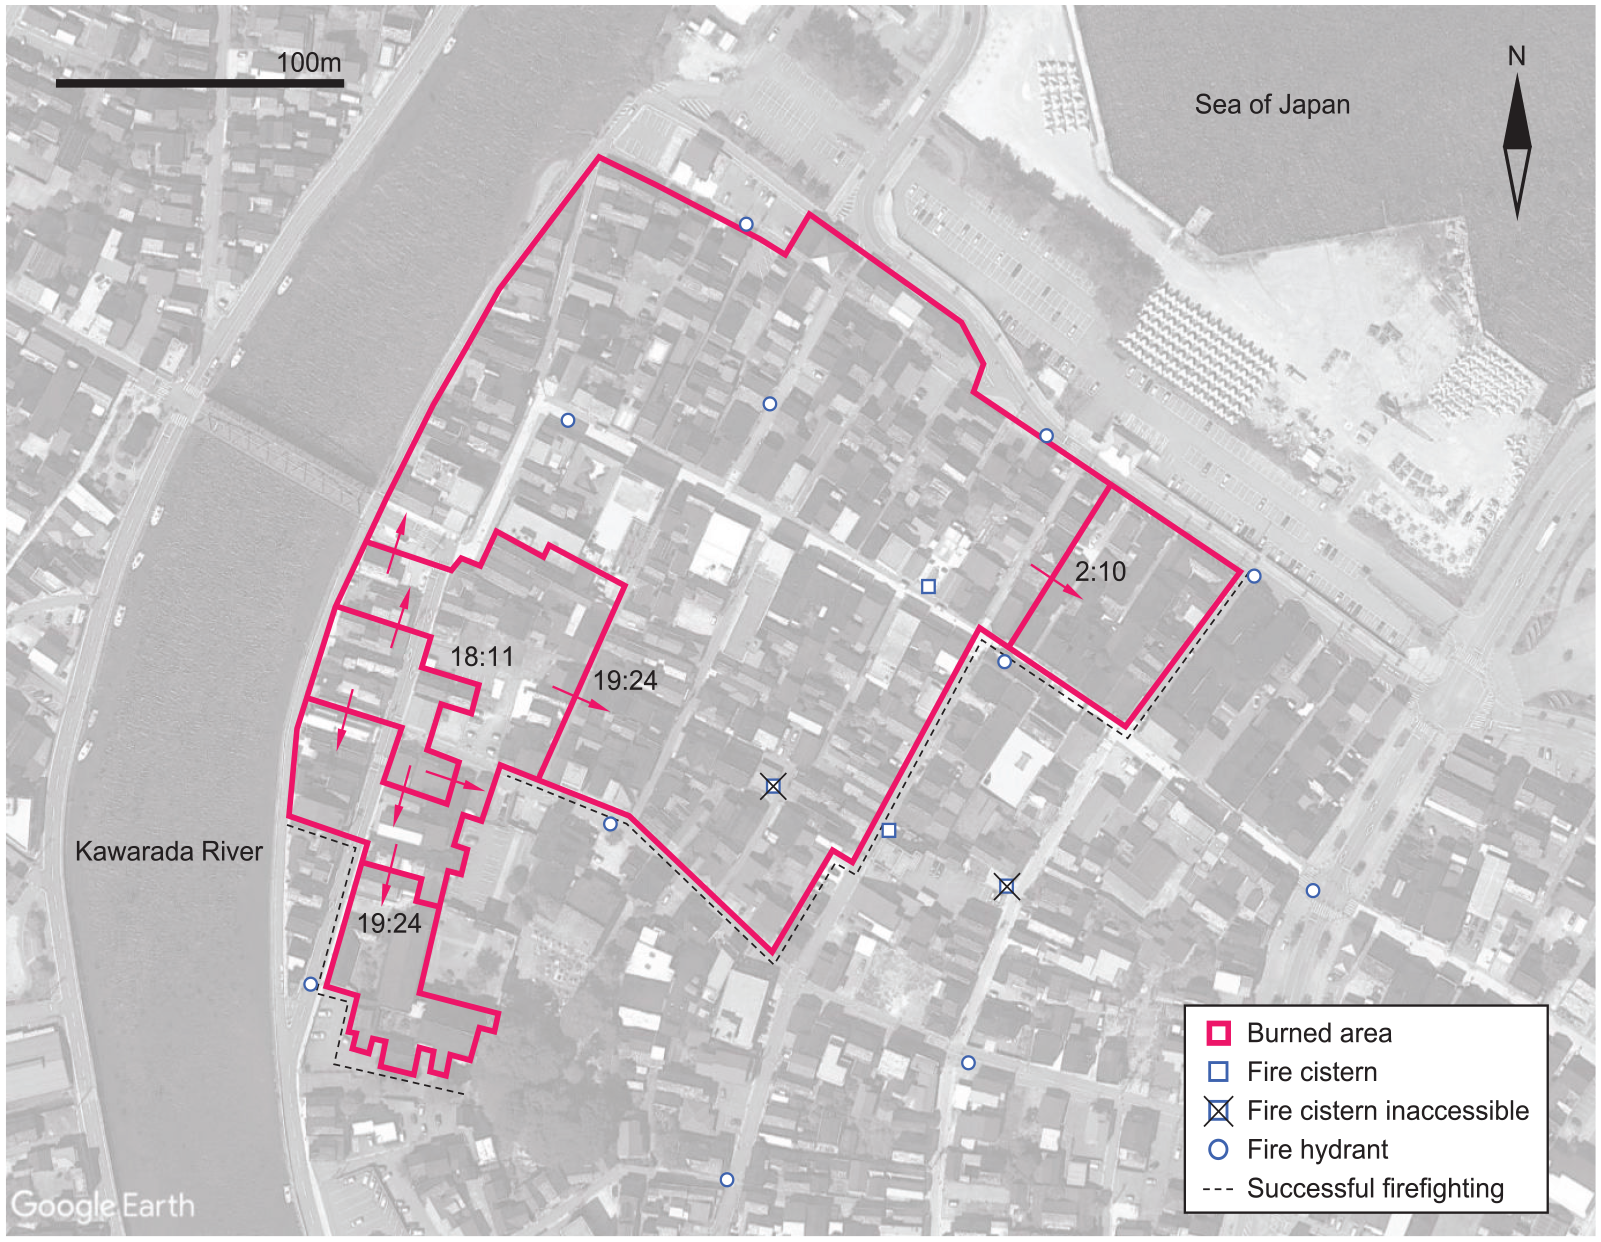
Area in Kawai Town, Wajima City, burned by the urban fire following the 2024 Noto Peninsula earthquake.
The observed damage in Ukai District, Horyu Town, Suzu City, a region primarily composed of old wooden houses, is plotted in Figure 6 on aerial photographs taken before and soon after the earthquake provided by the Geospatial Information Authority of Japan. The burned zone, with an area of approximately 0.09 ha, was identified in a field observation conducted on 4 February 2024 while the tsunami inundation zone was based on an interpretation of aerial photographs (GSI, 2024). According to numerical tsunami simulations (Masuda et al., 2024), extensive tsunami inundation may have occurred in this district 30–40 min after the earthquake, and the burned zone and surrounding area may have been inundated up to a depth of 3 m prior to the fire. Indicated by white dotted lines, the buildings washed away by the tsunami were located near the coastline; these buildings were identified by comparing aerial photographs taken before and after the earthquake.
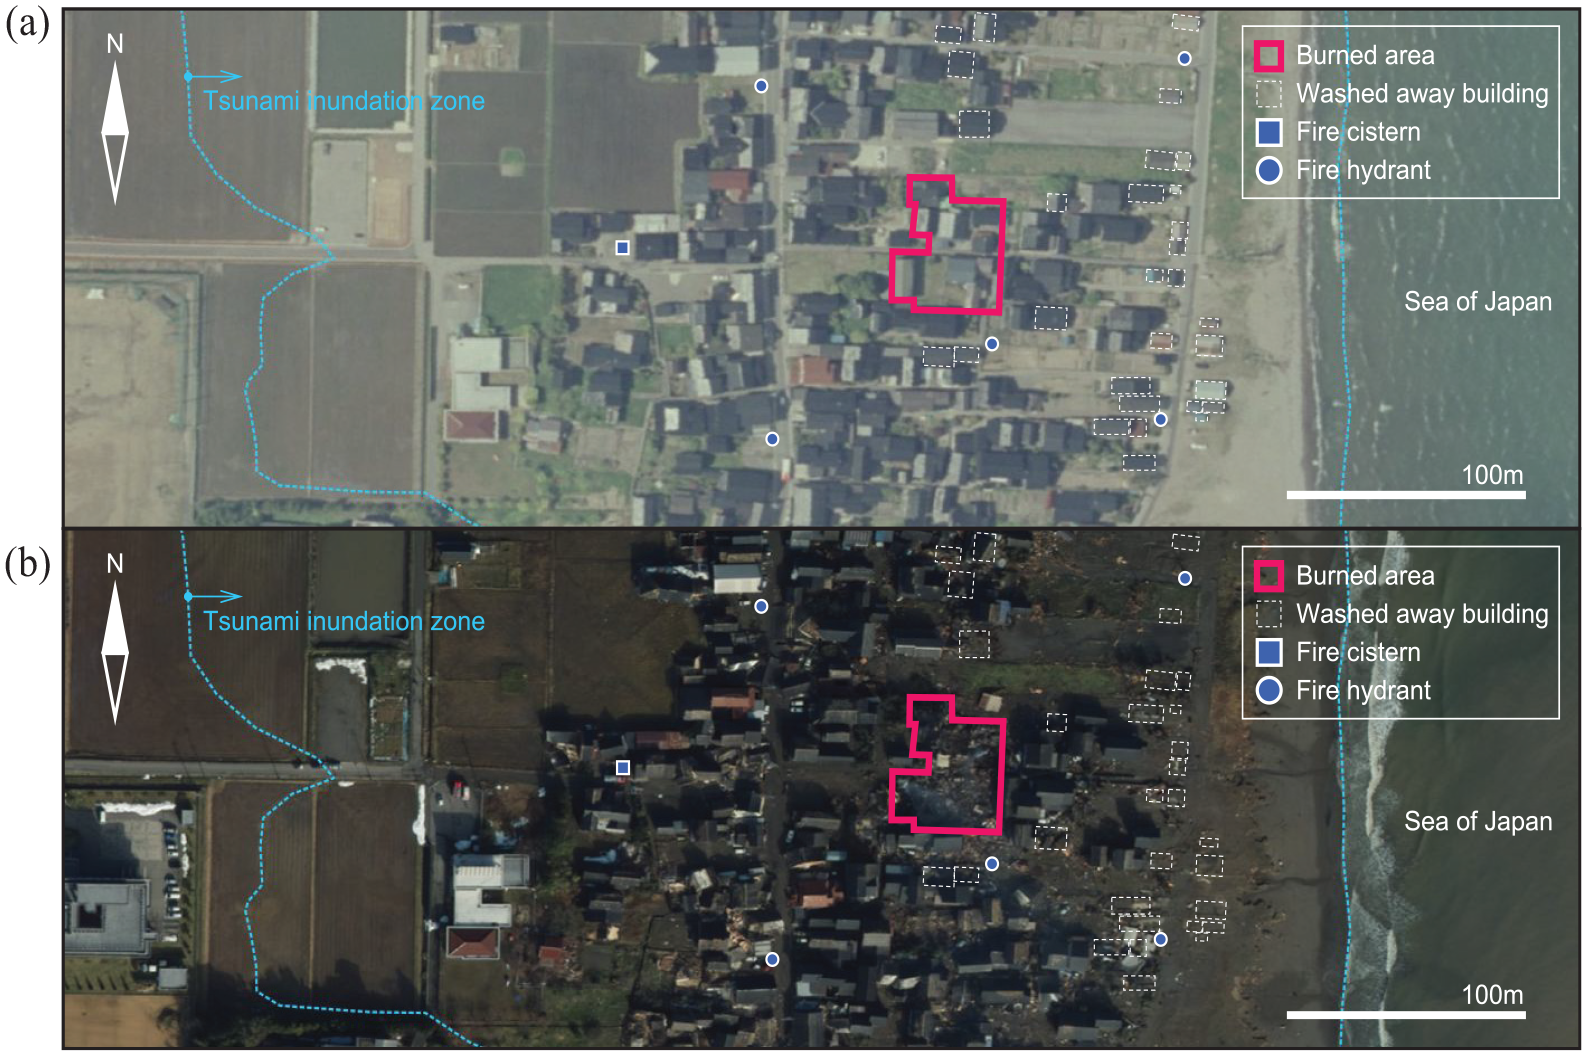
Area in Ukai District, Horyu Town, Suzu City, burned by the tsunami-induced fire following the 2024 Noto Peninsula earthquake: damage displayed on aerial photographs taken (a) before and(b) soon after the earthquake.
In a similar manner, Figure 7 summarizes the observed damage in Shiromaru District, Noto Town, the other area affected by a tsunami fire. Similar to the Ukai District, this area was primarily composed of old wooden houses and was first affected by tsunami inundation (as well as by strong ground shaking) and then by fire. The burned zone, with an area of approximately 0.17 ha, was identified within the tsunami inundation zone in a field observation conducted on 4 February 2024.
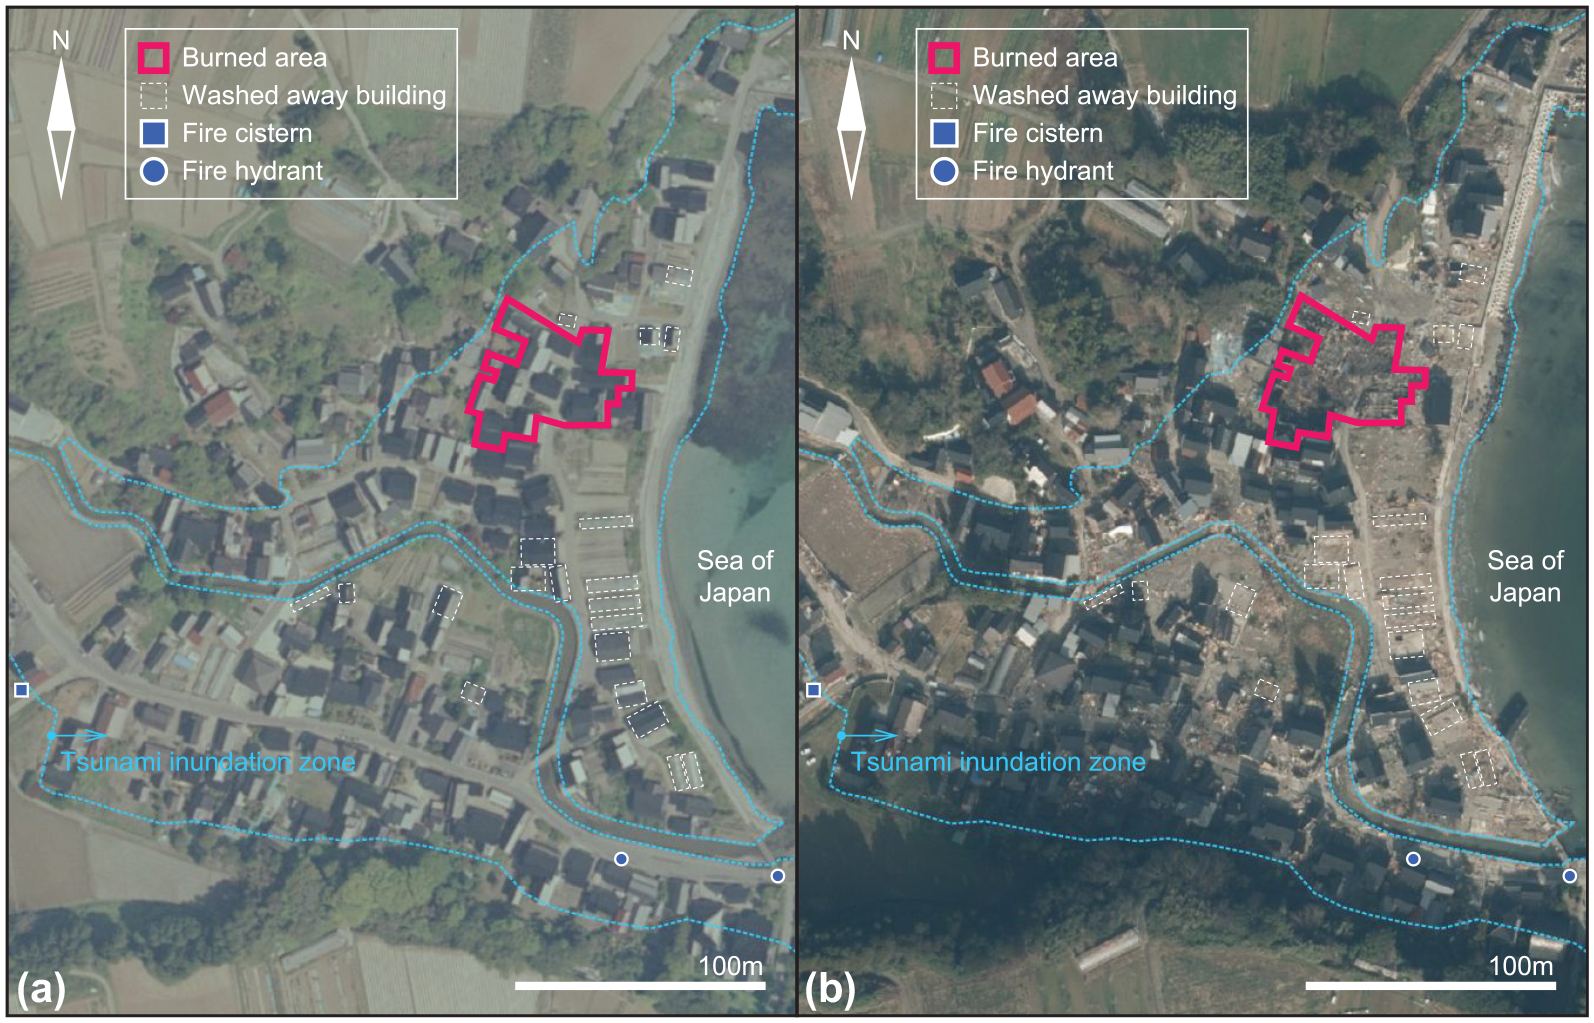
Area in Shiromaru District, Noto Town, burned by the tsunami-induced fire following the 2024 Noto Peninsula earthquake: damage displayed on aerial photographs taken (a) before and (b) soon after the earthquake.
Analysis and discussion
Fire-following-earthquake ignition data are typically correlated to seismic hazard data and exposure data via regression analyses (Anderson et al., 2016; Davidson, 2009; Khorasani et al., 2017; Lee et al., 2008; Nishino, 2023a; Nishino and Hokugo, 2020; Scawthorn, 2009; Tong and Gernay, 2022; Zhao et al., 2006). Namely, statistical relationships between the probability of ignition per floor area or per person and the ground motion intensity are of interest for use in regional fire-following-earthquake risk assessments; such ignition models are derived from past earthquake data.
Following a previous study (Nishino, 2023a), a Poisson regression model was applied to data associated with the 12 shaking-induced building fires, yielding an empirical ignition model specific to the 2024 Noto Peninsula earthquake (Figure 8). The PGV, which has been found to be the most effective of typical intensity measures for ignition modeling (Nishino, 2023a), was treated as a ground motion intensity measure in this analysis. The analyzed data consisted of counts of the number of ignition incidents and the exposed population corresponding to specific PGV bins based on the locations of the ignition incidents, estimated PGV map (KKE, 2023), and census data. A maximum likelihood estimation was then applied to the regression model, yielding an equation that computes the probability of ignition per person p
ig
as a function of the PGV v (in cm/s):
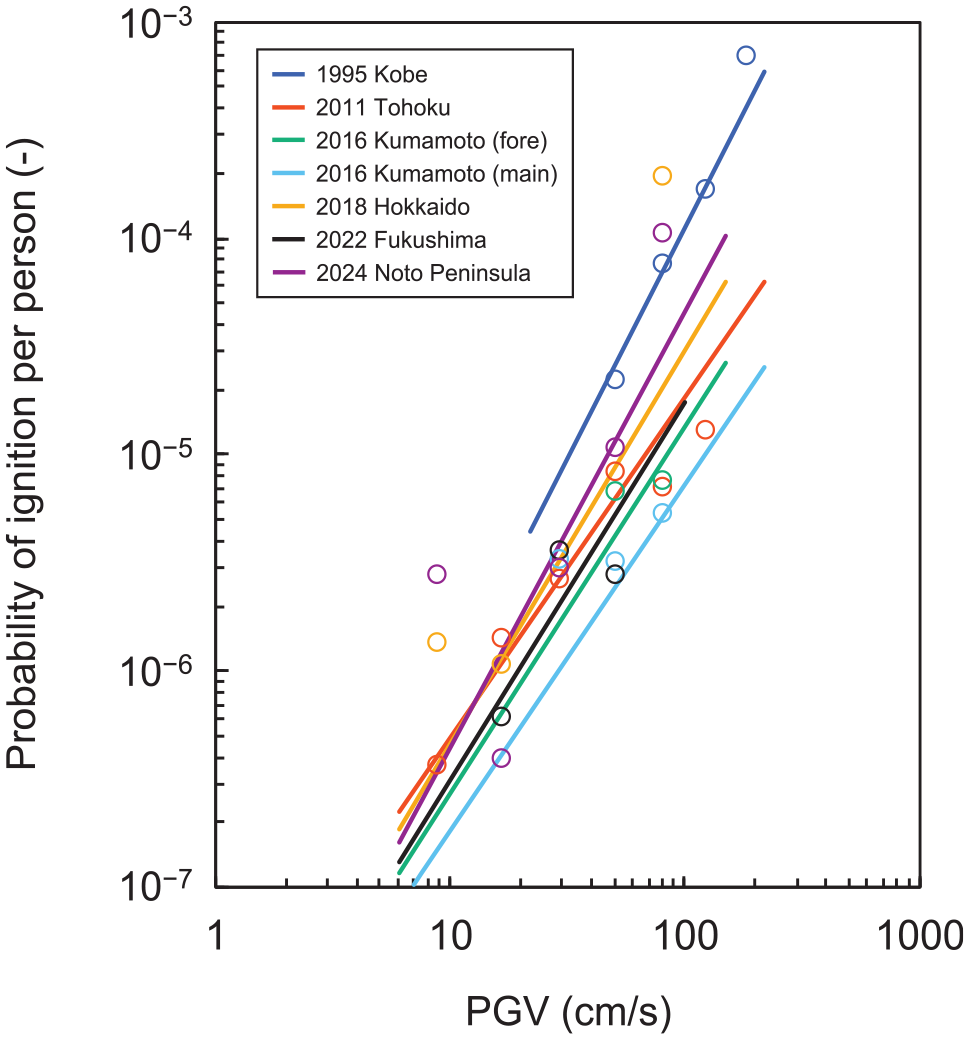
Statistical relationship between the probability of ignition per person and the peak ground velocity (PGV) inferred from the 2024 Noto Peninsula earthquake data and comparison with those for major earthquakes in Japan from 1995 to 2022 (Nishino, 2023a).
As suggested by a previous study (Nishino, 2023a), empirical ignition models involve large inter-event variability; that is, the empirical relationship between the ignition probability and the PGV varies greatly depending on the earthquake. Compared with ignition models calibrated on different large earthquakes in Japan from 1995 to 2022 (Nishino, 2023a), the ignition model for the 2024 Noto Peninsula earthquake has a relatively high level of ignition probability (Figure 8), falling between the 1995 Kobe and 2011 Tohoku earthquakes, which have large sample sizes. Specifically, focusing on a PGV of 80 cm/s, the ignition probability for the 2024 Noto Peninsula earthquake is approximately 2.2 times that of the 2011 Tohoku earthquake and approximately 0.4 times that of the 1995 Kobe earthquake. As demonstrated by a previous study (Nishino, 2023a), this emphasizes a need to consider epistemic uncertainty associated with empirical ignition models in regional fire-following-earthquake risk assessments.
One noteworthy aspect of the fire in Kawai Town, Wajima City (Figure 5), is that this area was under a timely major tsunami warning issued 12 min after the earthquake by the Japan Meteorological Agency; specifically, a tsunami height of over 3 m was predicted at the early stage, requiring coastal communities to immediately evacuate to safe locations such as high ground or tsunami vertical evacuation buildings. Ultimately, there was no tsunami inundation in this area; however, the decisions made by communities and firefighters were likely influenced by the possible tsunami risk. Specifically, the possible tsunami risk likely rendered the residents’ firefighting efforts during the early stages of the fire and the firefighters’ operations more difficult.
The fire in Kawai Town, Wajima City, whose ignition time is unknown, started at a mixed-use building (a dwelling combined with a store) before it was detected by the municipal fire department at 5:23 p.m. on the day of the earthquake (i.e. approximately 70 min after the earthquake) (FDMIC, 2024). As suggested in Figure 5, the fire spread to neighboring buildings in all directions, except toward the river, during the early stage, was contained relatively quickly by firefighting and the open space to the southwest, and then spread primarily to the north and east. Consequently, the fire destroyed approximately 240 buildings before being controlled at 7:30 a.m. on the following day (FDMIC, 2024).
According to the weather records observed at the meteorological station closest to the burned zone, which is missing data from 6:50 p.m. on the day of the earthquake to 2:50 p.m. on the following day, the 10-min average wind speed was up to 2.9 m/s until 6:40 p.m. on the day of the earthquake and the predominant wind direction was approximately to the north. From Figure 5, the average rate of spread during the early stage of the fire was estimated to be approximately 20–35 m/h. This is not unusual given the weak wind. Not surprisingly, the fire even entered buildings with non-combustible construction materials, such as reinforced concrete and steel, through exterior wall openings. As shown in Figure 4, seismic damage to buildings and roads was observed in the vicinity of the burned zone; such damage included building collapse, falling of non-combustible exterior wall finishes (mortar) for fire protection on wooden buildings, and cracks and bumps in roads. It is highly likely that such damage also occurred in the burned zone, potentially affecting building-to-building fire spread and impeding firefighting.
Details of the firefighting can be found in the literature (FDMIC, 2024); an outline is as follows. During the early stage of the fire, three fire engines, including one fire engine owned by volunteer firefighters, were positioned on the south side of the burning area to prevent fire spread in the southerly direction. At this time, water was pumped from the river because fire hydrants were not available as a result of seismic damage to water supply systems, and the nearest fire cistern was not accessible because of collapsed buildings. However, some of the fire engines could not pump river water because the water level was lowered by ground uplift. Subsequently, fire engines arriving later were positioned on the east side of the burning area and the firefighting was shifted to prevent fire spread in the easterly direction. Eventually, 10 fire engines, including 3 fire engines owned by volunteer firefighters, responded to the fire; the majority were positioned on the coast to pump water from the sea. However, pumping from the sea was difficult for a while because timely tsunami warnings were in effect. This firefighting successfully contributed to preventing the fire from spreading across the narrow streets on the east and southeast sides of the burned zone.
The fire in Ukai District, Horyu Town, Suzu City (Figure 6), was initiated around 5 p.m. on the day of the earthquake, was detected by the municipal fire department at 6:31 p.m. on the same day, and was extinguished at 8:30 a.m. on the following day, resulting in seven burned buildings (FDMIC, 2024). As described above, extensive tsunami inundation may have occurred in this district 30–40 min after the earthquake and the burned zone and surrounding area may have been inundated up to a depth of 3 m prior to the fire (Masuda et al., 2024). This information and the observed damage (Figure 6) suggest possible fire development in this area. First, wooden houses, automobiles, and various other items located near the coastline were washed away by the tsunami. This floating debris accumulated in the gaps between the remaining houses. Then, the accumulated debris or remaining wooden houses were ignited by some type of heat source. Finally, the fire spread to nearby accumulated debris and remaining wooden houses, resulting in a large fire. This is typical of a tsunami fire and is similar to fires observed in many tsunami-affected areas after the 2011 Tohoku earthquake (Hokugo et al., 2013), such as in Yamada Town, Iwate Prefecture (Nishino and Imazu, 2016). According to publicly available information, firefighters used a fire cistern outside the tsunami inundation zone to extinguish the fire.
For the fire in Shiromaru District, Noto Town (Figure 7), while houses along the Shiromaru River were washed away by the tsunami, indicating deep tsunami inundation, houses near the burned zone were not washed away, indicating shallow tsunami inundation. This suggests that houses located in the burned zone remained standing even after tsunami inundation, until they were affected by the fire, and that floating or accumulated tsunami debris may not have had a significant effect on the spread of the fire, even though the ignition of the fire was reported to have been a consequence of tsunami inundation, specifically to have resulted from a tsunami-inundated automobile battery (FDMIC, 2024). Namely, the spread of the fire was likely similar to typical building-to-building fire spread behavior in normal times. According to the government committee report (FDMIC, 2024), the fire, whose ignition time is unknown, was detected by the municipal fire department at 10:16 p.m. on the day of the earthquake and was extinguished at 0:26 a.m. on 3 January resulting in 11 burned buildings.
Fire risk
This section describes a regional fire-following-earthquake risk assessment using the previously published but underutilized F43 fault model (MLIT, 2014). This model is similar to the 2024 Noto Peninsula earthquake in terms of its source region and Mw. As shown in Figure 9, downtown Wajima, an urban area situated between mountains and the sea, was selected as the study area. The assessment here considers 9088 mostly wooden buildings that existed prior to the 2024 earthquake in the domain shown in Figure 9, which is expansive enough to encompass the entire urban area, extending 5.3 km from east to west and 4.5 km from north to south. As described in the Ignitions and Large Fire Damage section, this domain was partially destroyed by the fire following the 2024 earthquake. Accordingly, the question addressed here is as follows. If a fire-following-earthquake risk assessment had been conducted for the building stock in downtown Wajima using the F43 fault model, what would have been the results and how would they have related to the actual consequences of the fire following the 2024 earthquake? Namely, the probabilities for fire losses to the building stock are discussed given a hypothetical Mw 7.6 earthquake occurring on the previously mapped F43 fault. Although regional risk assessments typically focus on direct economic losses for a portfolio of buildings, the assessment here simply considers the number of burned buildings as the fire-following-earthquake loss to the building stock, because this can be compared with observations, and neglects the replacement cost of buildings. The second question addressed here is as follows. How much will future climate change affect regional fire-following-earthquake risk assessments? This question is investigated by taking advantage of the above case study for downtown Wajima. Namely, differences between the fire loss exceedance curves for the building stock in downtown Wajima are discussed for two TMYs of the baseline (1981–1995) and future (2077–2095) periods given the above hypothetical earthquake.
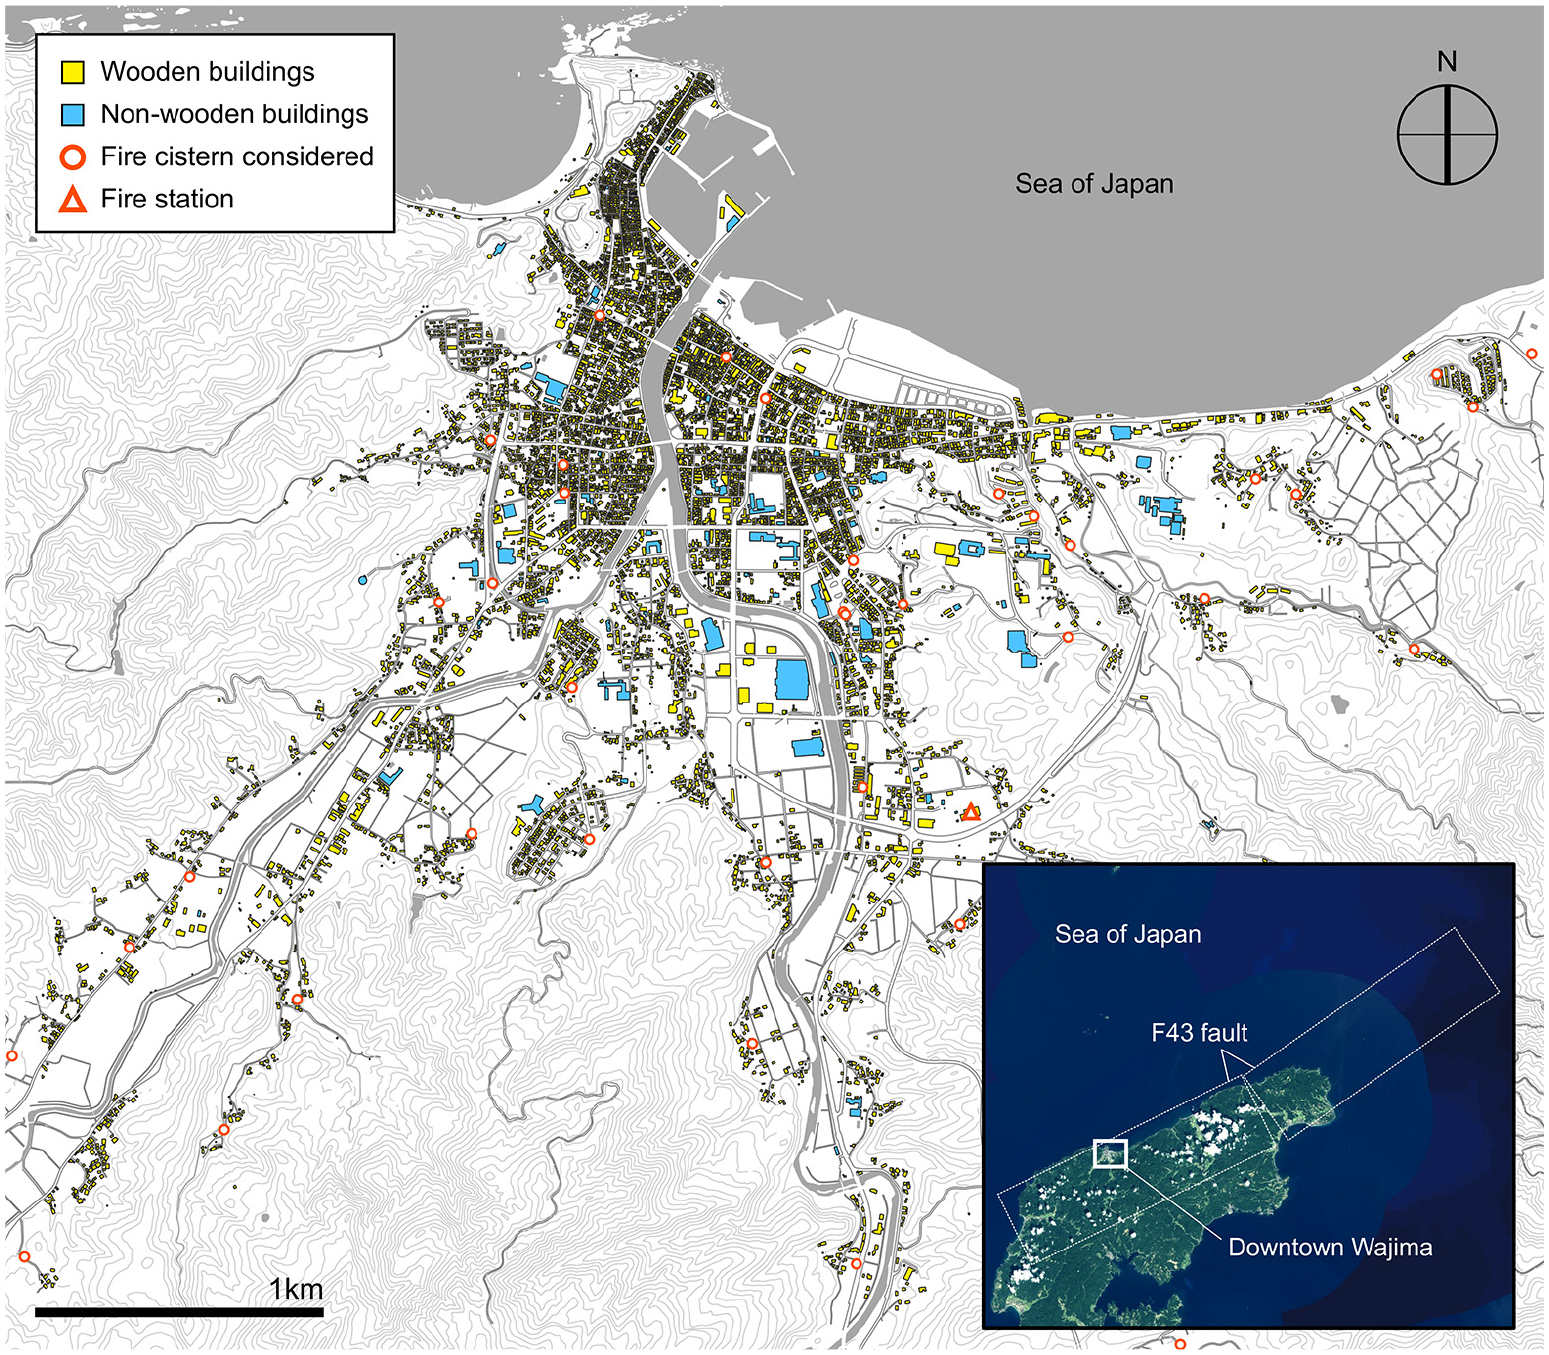
Overview of downtown Wajima as the study area.
Methodology
An up-to-date regional fire-following-earthquake risk model of Japan (Nishino, 2023a, 2023b), developed prior to the 2024 earthquake, is applied without additional calibration in response to the 2024 earthquake and then the model is extended in response to the need for long-term assessments by incorporating synthetic future hourly weather data based on global warming projections. The adopted risk model is an extension of a typical seismic risk model that includes a fire-following-earthquake model, that is, a set of multiple component models, including the post-earthquake ignition, weather, urban fire spread, and firefighting models, as well as seismic activity, ground motion, building stock (exposure), and seismic fragility models. This risk model can not only incorporate the uncertainty in the earthquake occurrence, ground motion intensity distribution, damage to buildings resulting from ground shaking, post-earthquake fire occurrence, weather conditions, fire brigade response, and damage to buildings resulting from post-earthquake urban fire spread, but also the uncertainty in the implemented models (i.e. epistemic uncertainty) into the risk assessments, enabling an evaluation of the exceedance probability of the direct economic losses to a portfolio of buildings caused by the combined effect of ground shaking and post-earthquake fires in a predefined future time period via Monte Carlo simulations. However, as described above, the analysis here simply evaluates the exceedance probability of the number of burned buildings as a consequence of fires following a specified potential earthquake by assuming a particular magnitude, location, and fault-rupture geometry, neglecting the earthquake occurrence uncertainty and the replacement cost of buildings. This risk assessment builds on a detailed building stock model that contains information concerning the spatially distributed individual buildings, including the building location, footprint, floors, and construction type. This detailed building stock model is required for post-earthquake urban fire spread simulations, as opposed to seismic damage simulations.
Accordingly, the risk here is defined as the probability of the number of burned buildings as a consequence of post-earthquake fires L F exceeding a given value l, given that a specified potential earthquake E occurs. This risk can be numerically evaluated via Monte Carlo simulations in which numerous fire-following-earthquake scenarios are stochastically generated by comprehensively considering associated uncertainties. Hence, its definition is expressed as
where n
MCS
is the number of trials, LF,i is the number of burned buildings in the i-th trial, and
The number of burned buildings in the i-th trial LF,i can be written as
where n bldg is the number of buildings and DF,ij is a dummy variable that takes a value of 1 when fires spread to the j-th building in the i-th trial; otherwise, it takes a value of 0.
While the evaluation of Equation 1 provides a gross risk, DF,ij allows a measurement of the burn probabilities for individual buildings, enabling a visual representation of buildings that are highly likely to be subjected to post-earthquake fires. Using the indicator function
The model implementation for evaluating the above equations is as follows. Note that the implemented models were not updated in response to the 2024 Noto Peninsula earthquake because the analysis here is prospective (i.e. the analysis is performed as if it had been performed prior to the earthquake).
1. The Mw, location, and fault-rupture geometry of a considered earthquake are based on the F43 fault model proposed by the government committee in 2014 (MLIT, 2014).
2. The building stock model is based on nationwide fundamental geospatial data provided by the Geospatial Information Authority of Japan and contains information concerning each building, including the building location, footprint, and type (“Futsu” building or “Kenro” building, where “Futsu” and “Kenro” buildings are defined by the authority, with the former being mostly low-rise wooden buildings and the latter being mostly reinforced concrete or steel buildings with three or more floors). The building stock model used here consists of 9012 Futsu buildings and 76 Kenro buildings, treated as two-story wooden buildings without fire protection and three-story reinforced-concrete buildings, respectively. The numerical setting of the building properties, which influence the urban fire spread simulations described below, such as the thermal properties of the exterior walls, the mass density of the movable and fixed combustible objects, and the area of the exterior wall openings, follows that of a previous study (Nishino, 2023b).
3. The PGVs at the building locations, as an intensity measure used in this analysis, are stochastically evaluated using an up-to-date empirical ground motion prediction equation (GMPE) for Japan (Morikawa and Fujiwara, 2013). This GMPE includes correction terms for the site amplification as a result of deep sedimentary layers and shallow soft soils. These correction terms are determined from nationwide shear-wave velocity structure models provided by the Japan Seismic Hazard Information Station (National Research Institute for Earth Science and Disaster Resilience (NIED), 2019).
4. The damage states resulting from ground shaking (completely destroyed and semi-destroyed), which influence the building burning and building-to-building fire spread behaviors, are stochastically evaluated for individual buildings using empirical seismic fragility functions for Japanese low-rise wooden buildings (Midorikawa et al., 2011; Wu et al., 2016; Yamaguchi and Yamazaki, 2001). This is reflected in the urban fire spread simulations described below. To consider the effect of epistemic uncertainty, three seismic fragility functions derived from different earthquakes in Japan are used as alternative models with equal weights.
5. The post-earthquake fire-starting buildings, which are used as inputs in the urban fire spread simulations described below, are stochastically determined by evaluating the ignition probabilities for individual buildings using the empirical equations described in the Ignitions and Large Fire Damage section. Similar to the seismic fragility functions, two ignition probability equations based on large samples derived from the 1995 Kobe and 2011 Tohoku earthquakes (Nishino, 2023a) are used as alternative models with equal weights to consider the effect of epistemic uncertainty. These equations compute the ignition probability per person; accordingly, this probability is converted to the ignition probability per building following a previous study (Nishino, 2023b). The possibility of occupant firefighting during the initial stages is also considered; specifically, a value of 0.204, the ratio of the fires against which occupant firefighting was effective with respect to all fires following the 1995 Kobe earthquake, is considered following a previous study (Nishino, 2023b).
6. The time histories of the weather parameters are sampled from 1-year hourly weather data for the meteorological station closest to the study area by randomly specifying the month, day, and hour of the earthquake occurrence; that is, the starting date and time of the simulation time window are randomly specified along with a separately specified simulation period. Accordingly, the weather parameters change over time during the urban fire spread simulations described below. Initially, the weather parameters considered included the outdoor air temperature and wind velocity and direction; however, the relative humidity is also included for the long-term assessments considering future climate change. Specifically, the relative humidity at the randomly specified date and time of the earthquake occurrence is used to determine the initial moisture content of the exterior walls of wooden buildings. This is based on the relationship between the equilibrium moisture content of wood and the relative humidity at normal temperatures (Kollmann, 1951).
The time histories of the weather parameters for the analysis based on the first research question are sampled from the observed records in 2022, while those for the analysis based on the second research question are sampled from the TMY data for the baseline (1981–1995) and future (2077–2095) periods provided by the Meteorological Data System Co., Ltd.. The future TMY data are based on the forecast values reported in the Global Warming Projection Vol. 8 (GWP8) of the Japan Meteorological Agency (JMA). GWP8 (JMA, 2013) is based on a 5-km resolution run of the non-hydrostatic regional climate model developed by the JMA. Lateral boundary values are taken from a 20-km resolution global climate model with the IPCC SRES A1B scenario as the external forcing via a 15-km resolution regional climate model. The baseline TMY data are based on observed weather records, while the future TMY data are based on adding the amount of change in the GWP8-synthesized daily values between the baseline and future periods to the hourly values for the baseline TMY data.
7. The fire brigade response times are stochastically evaluated for each fire outbreak considering the empirical probability distribution of the time to detection derived from the 1995 Kobe earthquake (Nishino, 2023b), which has a large sample size for high ground motion intensity levels.
8. The time-varying behaviors of urban fire spread are numerically simulated using a physics-based urban fire spread model including fire brigade firefighting (Nishino, 2019, 2023b) under the stochastically determined ignition, weather, and fire brigade response conditions, enabling the evaluation of DF,ij in Equations 2 and 3.
In the urban fire spread simulations, targets for water spray by firefighters, who follow predefined decision-making rules, are automatically specified depending on the simulated fire spread situations. The effect of preliminary water spray on the exterior walls of unburned buildings for ignition prevention is reflected via physics-based mathematical formulations (Nishino, 2023b). Only fire cisterns next to wide roads are considered as post-earthquake available water sources because fire hydrants are typically unavailable after large earthquakes as a result of seismic damage to water supply systems. Natural water sources, such as the sea and river, are also not considered for simplicity. Information concerning fire stations, fire cisterns, and fire engines is obtained from publicly available information. This analysis considers the two fire engines owned by the Wajima Fire Station, a fire station located in the study area, prior to the 2024 earthquake. Additional details concerning the implemented models can be found in the literature (Nishino, 2023a, 2023b)
To obtain reliable risk estimates, a sufficient number of trials need to be performed. As a result of trial and error, 6000 trials were performed, that is, 1000 trials per combination of seismic fragility function and ignition probability equation. Unlike seismic hazard and damage simulations, 72-h urban fire spread simulations were performed. This is because urban fires are expected to decrease in intensity, at the latest, 72 h after an earthquake.
Results and discussion
Several examples of simulated post-earthquake fire spreading are shown in Figure 10 to demonstrate that the adopted fire-following-earthquake risk model generates various scenarios with different numbers and locations of ignitions and wind velocities and directions, successfully synthesizing realistic urban fire spread behaviors with different characteristics. In panel (a), two fires simultaneously occurred in strong winds of approximately 8 m/s blowing from the south, and one of these fires spread significantly in the downwind direction. Around 180 min after the earthquake, spot fires were caused by firebrands, which enhanced the development of the urban fire. In panel (b), at least three fires spread significantly despite weak winds. One of these simultaneous fires started in Kawai Town, which actually suffered an urban fire following the 2024 earthquake; the buildings burned by this synthesized fire are similar to those actually burned by the fire following the 2024 earthquake, although the fire-starting building is different. As expected, the buildings affected by the simulated fires varied greatly depending on the scenario, while the illustrated examples show a similarity in that the simulated fires simultaneously started from multiple buildings at different locations, spread to adjacent buildings, and began to burn out in sequence closer to the fire-starting buildings, forming belt-like burning regions along the fire fronts. Such variability in the number and location of fire-starting buildings is expected to have a particularly significant effect on the variability of eventual fire losses to the building stock, combined with the spatial heterogeneity of the urban structure, as well as the stochastic seismic damage to buildings and time-varying wind velocity and direction.
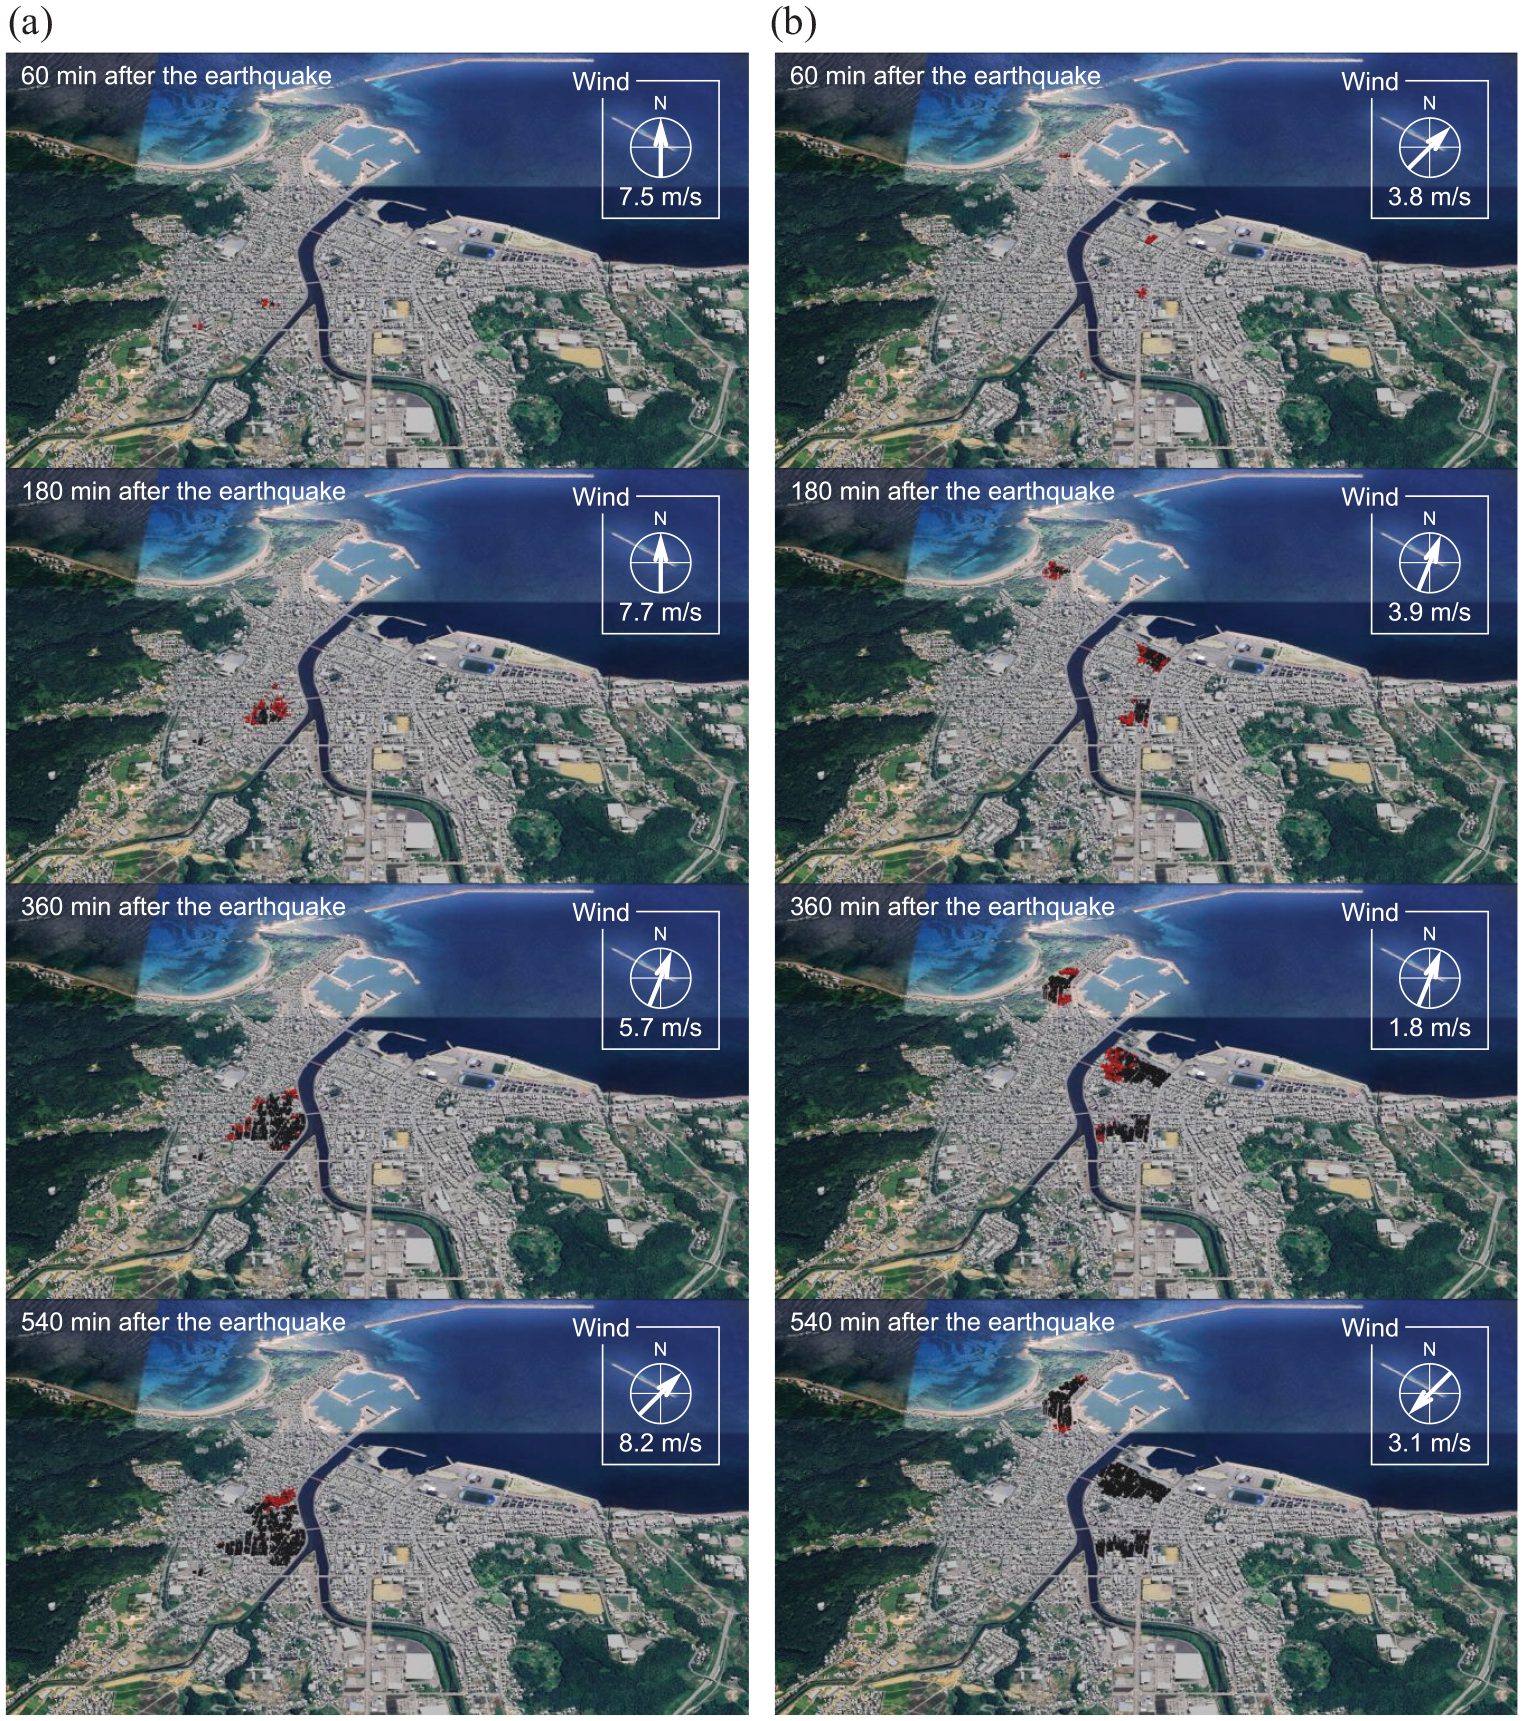
Examples of simulated post-earthquake fire spreading in downtown Wajima: (a, b) two different scenarios visualized using Google Earth.
Figure 11 shows the fire-following-earthquake loss exceedance curves evaluated using Equation 1 conditioned on a hypothetical Mw 7.6 earthquake on the F43 fault. As described in the Methodology section, this analysis used two different empirical ignition probability equations as alternative models to consider the epistemic uncertainty; accordingly, equally weighted loss exceedance curves were obtained for each ignition probability equation and were ultimately combined into a single loss exceedance curve. Note that the effect of using the three different empirical seismic fragility functions, as described in the Methodology section, is reflected in the plotted loss exceedance curves; that is, each equally weighted curve was derived from 3000 trials, while the combined curve was derived from 6000 trials. For reference, the loss exceedance curves evaluated under the no-wind assumption are also shown (dashed lines) to discuss the effect of incorporating the uncertainty in the wind velocity and direction into the assessments.
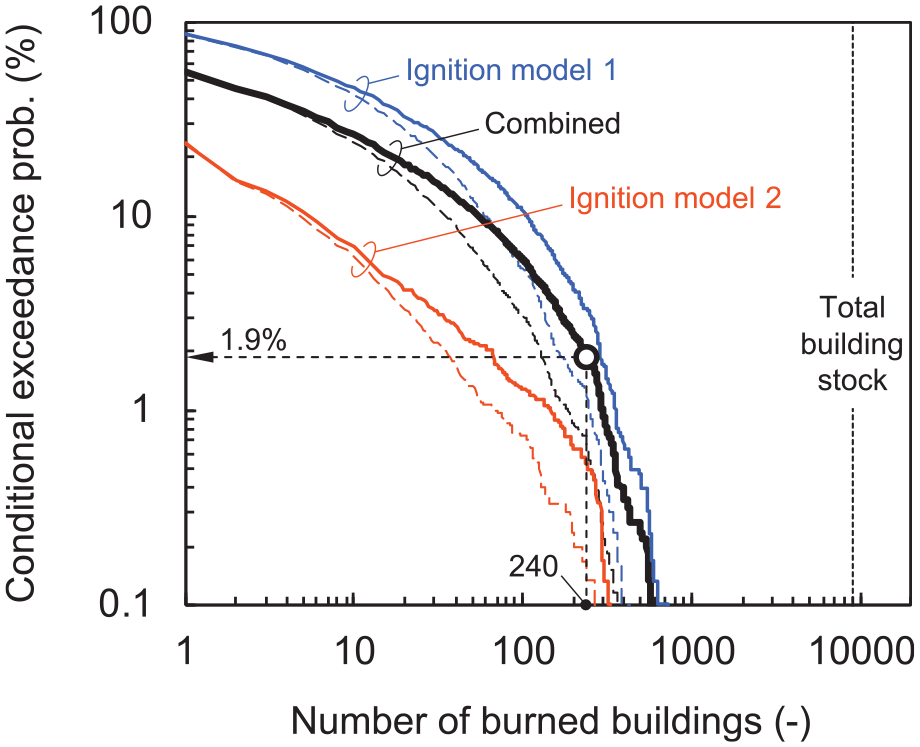
Fire-following-earthquake loss exceedance curves (solid lines) conditioned on a hypothetical Mw 7.6 earthquake on the F43 fault evaluated for the downtown Wajima building stock model.
As demonstrated in a previous study (Nishino, 2023a), using the different ignition probability equations had a significant effect on the evaluated loss exceedance curves. As expected, the ignition probability equation for the 1995 Kobe earthquake (ignition model 1) provided larger loss exceedance probabilities compared with that for the 2011 Tohoku earthquake (ignition model 2). For example, using the ignition probability equation for the 1995 Kobe earthquake increased the number of burned buildings corresponding to a 5% conditional probability of exceedance by approximately 9 times compared with using that for the 2011 Tohoku earthquake. This is, of course, because the former more frequently generated scenarios with a larger number of ignitions than the latter (Figure 12); specifically, the number of ignitions predicted by the former ranged from 0 to 10 (1.98 on average), while the number of ignitions predicted by the latter ranged from 0 to 3 (0.27 on average). For reference, two ignitions actually occurred following the 2024 earthquake within the computational domain (note that there was a single building fire in addition to the urban fire) and this observed number of ignitions is included in the range of the predictions. Meanwhile, the uncertainty in the wind velocity and direction had a relatively small effect on the loss exceedance curves compared with the uncertainty in the empirical ignition models, although, of course, the wind must be considered because otherwise the loss exceedance probabilities will be underestimated. This highlights that considering the uncertainty in empirical ignition models is an important element in regional fire-following-earthquake risk assessments and that using a combination of different ignition models is preferable.
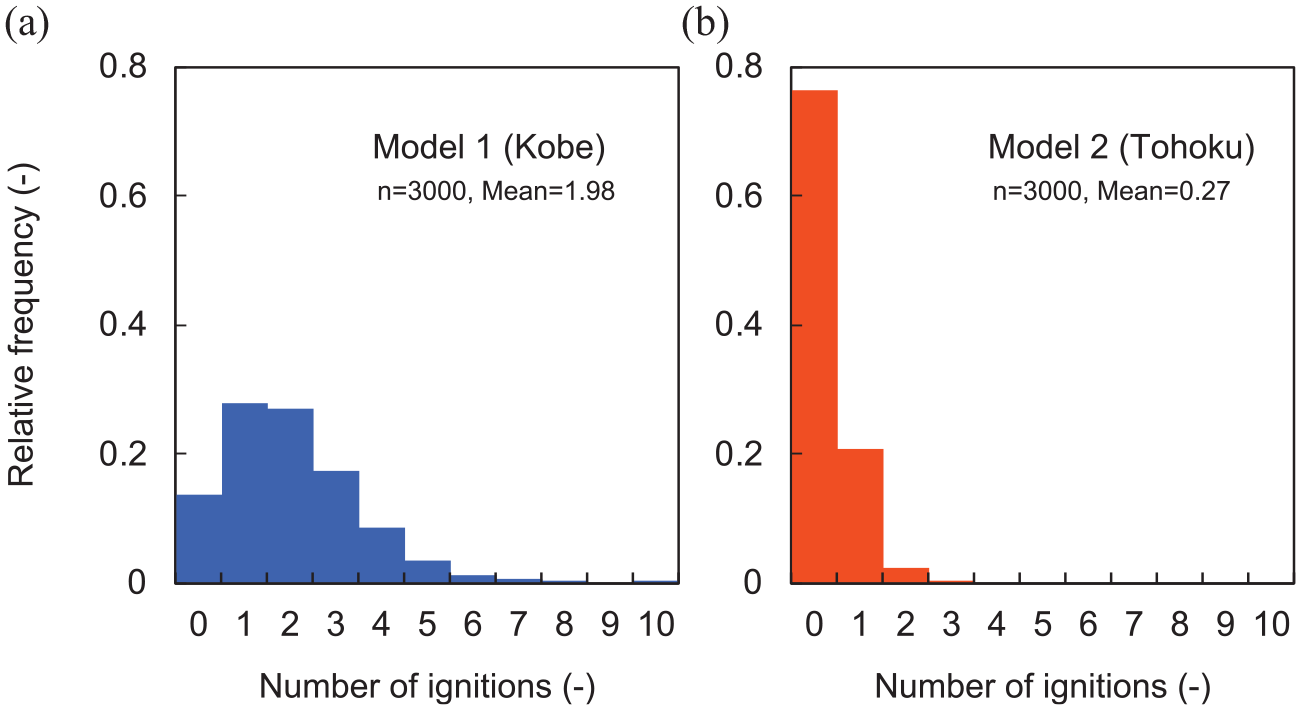
Predictions of the number of ignitions in downtown Wajima conditioned on a hypothetical Mw 7.6 earthquake on the F43 fault using the ignition probability equations for the (a) 1995 Kobe and (b) 2011 Tohoku earthquakes.
The combined loss exceedance curve indicates that, even if a Mw 7.6 earthquake had occurred on the F43 fault, no fires or small fires involving up to 10 buildings would have occurred in most cases and that large fires involving more buildings would have occurred less frequently. Specifically, the conditional probability of the number of burned buildings not exceeding 10 is approximately 74%. Because ignition predictions are probabilistic, in some scenarios, unlike the 2024 event, no fires were generated, while in other scenarios, even if fires were generated, they started in completely different locations than the actual burned area following the 2024 earthquake and spread little depending on their position relative to neighboring buildings, the wind conditions, and the fire brigade response.
Meanwhile, wind uncertainty may have had a relatively small effect on the variability of the fire loss calculations. This is because strong wind scenarios, which can significantly enhance fire spread, were rarely generated from the 1-year hourly weather records used here. Specifically, the 10-min average wind speed exceeding 10 m/s occurred 0.8% of the time (approximately 70 h per year); that is, strong wind periods are very limited during the year in this area. Therefore, the inability to predict ignitions deterministically may have significantly increased the variability of the fire loss calculations.
The number of buildings destroyed by the fires following the 2024 Noto Peninsula earthquake, approximately 240 buildings, corresponds to a conditional exceedance probability of approximately 1.9%, which belongs to the class of infrequent but large fires for the synthesized fire-following-earthquake scenarios. Note that the actual fire loss does not have to correspond to synthesized likely scenarios, such as scenarios with a 50% or 75% conditional exceedance probability, and that the analysis here does not allow us to discuss possible underestimation (or overestimation) because this can only be discussed via retrospective analyses based on deterministic approaches that eliminate uncertainties as much as possible. Although this result depends on the data used, the models implemented, and the assumptions made, the inferred fact that an infrequent but large fire actually occurred following the 2024 Noto Peninsula earthquake provides powerful information for the practice of regional fire-following-earthquake risk assessments that focus on possible future earthquakes. Namely, this inferred empirical conditional exceedance probability serves as a reference for engineers to determine an anticipated exceedance for possible future earthquakes, allowing the effect of countermeasures to be quantified as a reduced loss at that exceedance level.
Figure 13 maps the burn probabilities for individual buildings evaluated using Equation 3 conditioned on a hypothetical Mw 7.6 earthquake on the F43 fault. The generated burn probability map highlights buildings that are more or less likely to be destroyed by fires. In particular, buildings with a burn probability of 0.5% or greater are concentrated in at least seven locations, forming clusters of several tens or hundreds of buildings. In these clusters, even if a fire does not start in a particular building, a fire that starts in one of the surrounding buildings is highly likely to spread to that building, suggesting that a group of buildings is susceptible to spreading fires as a whole. The area destroyed by the fire following the 2024 Noto Peninsula earthquake roughly corresponds to one of these clusters. This result means that a large post-earthquake fire actually occurred in a numerically determined high-risk area, demonstrating that the adopted fire-following-earthquake risk model can serve as a tool for visualizing priority areas for fire risk reduction measures.
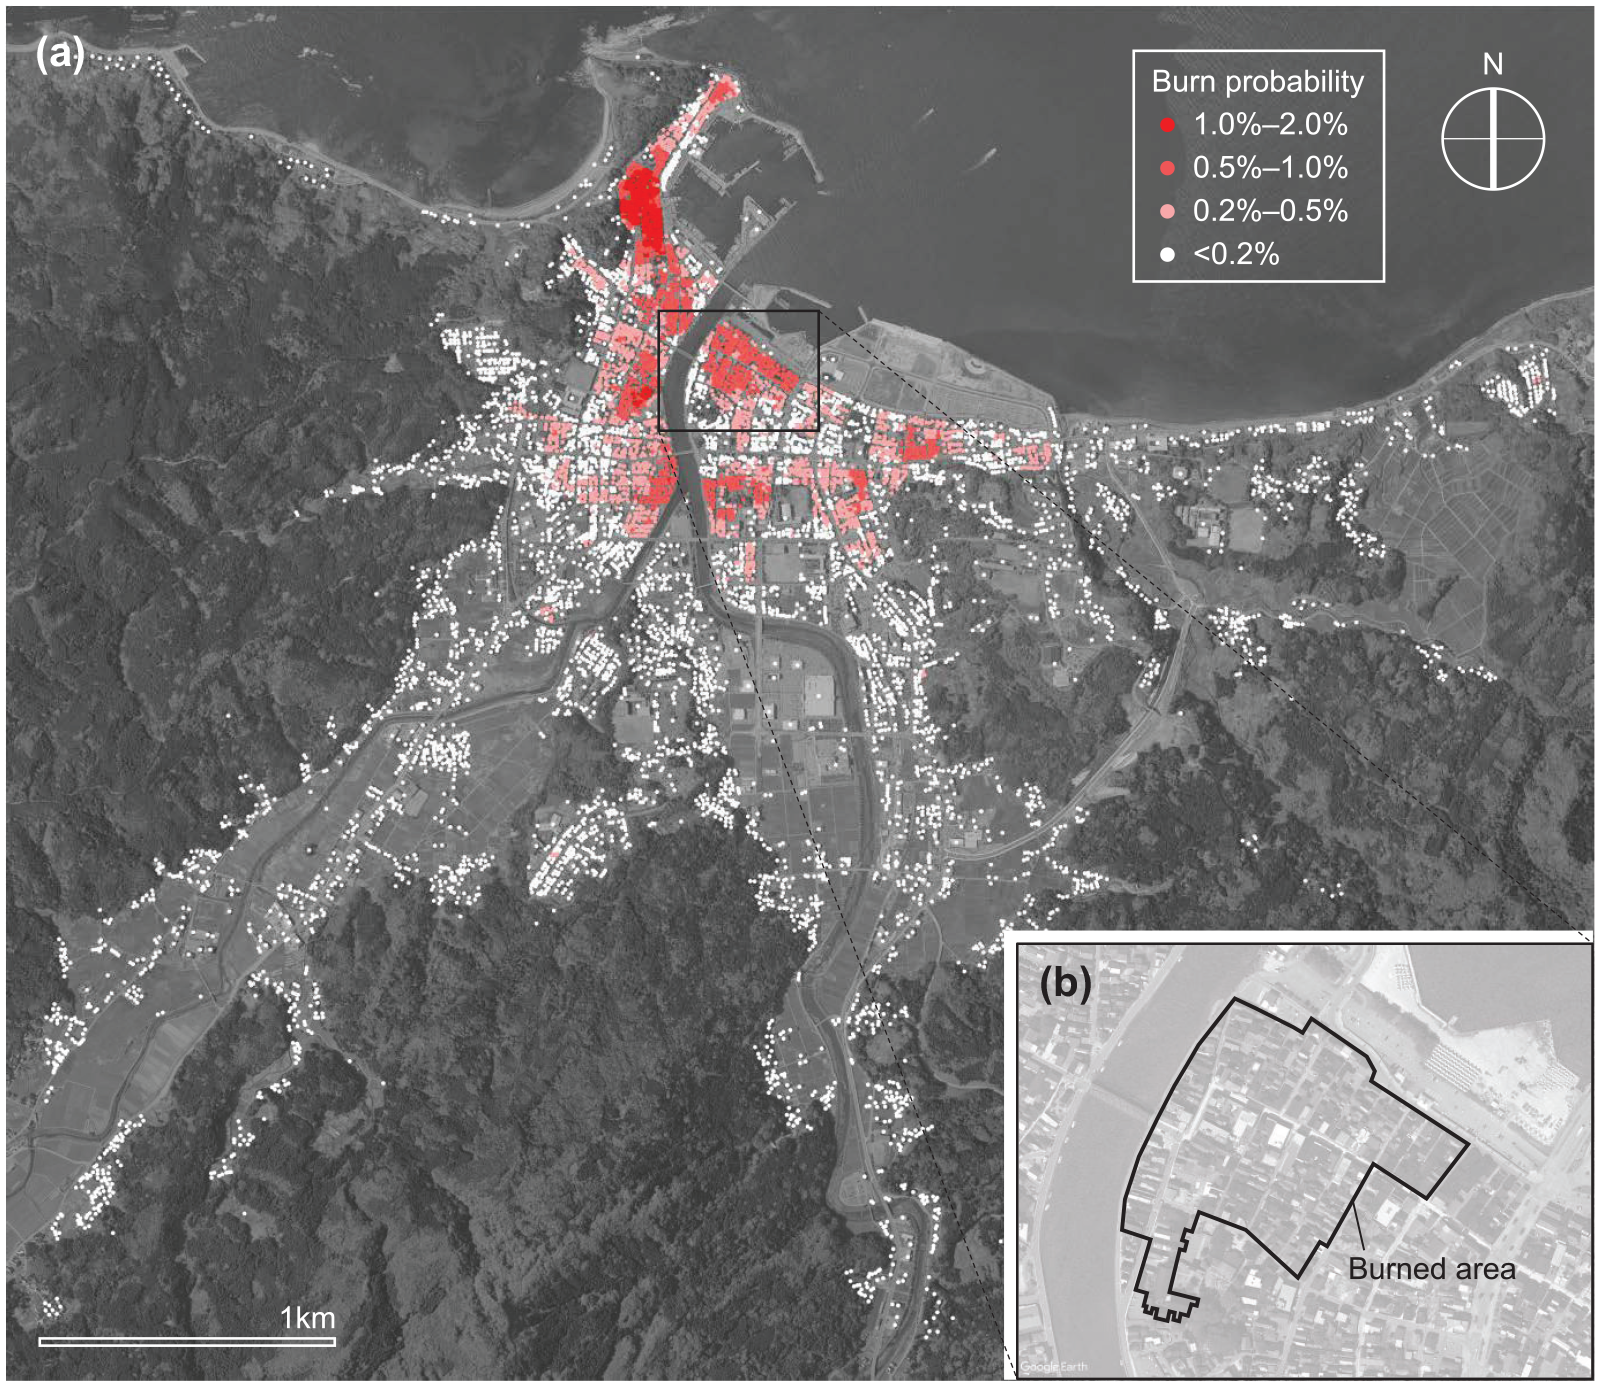
(a) Burn probability map evaluated for the downtown Wajima building stock model conditioned on a hypothetical Mw 7.6 earthquake on the F43 fault, and comparison with the (b) actual burned area following the 2024 Noto Peninsula earthquake.
Meanwhile, west and north of the actual burned area across the river, numerous buildings with even higher burn probabilities are mapped; however, these buildings were not destroyed by the fire following the 2024 Noto Peninsula earthquake. This is because the assessment here is highly sensitive to probabilistic ignition predictions. Because the number and location of ignitions cannot be predicted deterministically, scenarios can also be synthesized in which fires start at completely different locations than the actual burned area and develop into spreading fires; however, such scenarios are not certain to actually occur. Therefore, the results presented here do not indicate that the adopted fire-following-earthquake risk model can precisely determine the actual burned area but rather that there is a correlation between the actual burned area and the calculated burn probability distribution.
Figure 14 shows the fire-following-earthquake loss exceedance curves evaluated in terms of future climate change, given the above hypothetical earthquake, with a summary of the baseline and future TMY data used. The TMY data indicate that the differences in hourly weather parameter values between the baseline and future TMYs (specifically, the future value relative to the baseline) are on average 2.9°C for the outdoor air temperature, 0.1 m/s for the wind velocity, and −1.9% for the relative humidity, with standard deviations of 0.05°C, 0.28 m/s, and 1.51%, respectively. As expected, these possible long-term changes in the weather conditions clearly affected the loss exceedance curves, increasing the loss exceedance probabilities although slightly. Specifically, the conditional probabilities of the number of burned buildings exceeding 10, 50, and 100 increased by approximately 0.8%, 1.0%, and 0.7%, respectively. Possible reasons for these small future climate change effects on the risk assessments are as follows. (1) The change in outdoor air temperature is very small compared with the ignition temperature of combustible materials (e.g. 300°C–400°C for wood) and the gas temperature in building fires (e.g. up to 1000°C–1200°C during the fully developed stage). (2) The change in wind velocity is very small compared with the velocities of so-called strong winds, which are typically close to or above 10 m/s. (3) The sensitivity of the equilibrium moisture content of wood to relative humidity decreases with decreasing relative humidity, and its relative rate of change is small. Nevertheless, the results highlight the possibility that conventional fire-following-earthquake risk assessments, which neglect future climate change, underestimate the loss exceedance probabilities, suggesting the importance of incorporating future climate change into long-term fire-following-earthquake risk assessments. Note that the above results were obtained from a specific case study and cannot currently be generalized to different regions. Because synthetic future weather data are expected to vary greatly depending on the region, the climate model used, and the selection or sampling method of 1-year weather sequences, further investigation is needed to more comprehensively determine the effects of future climate change on fire-following-earthquake risk assessments.
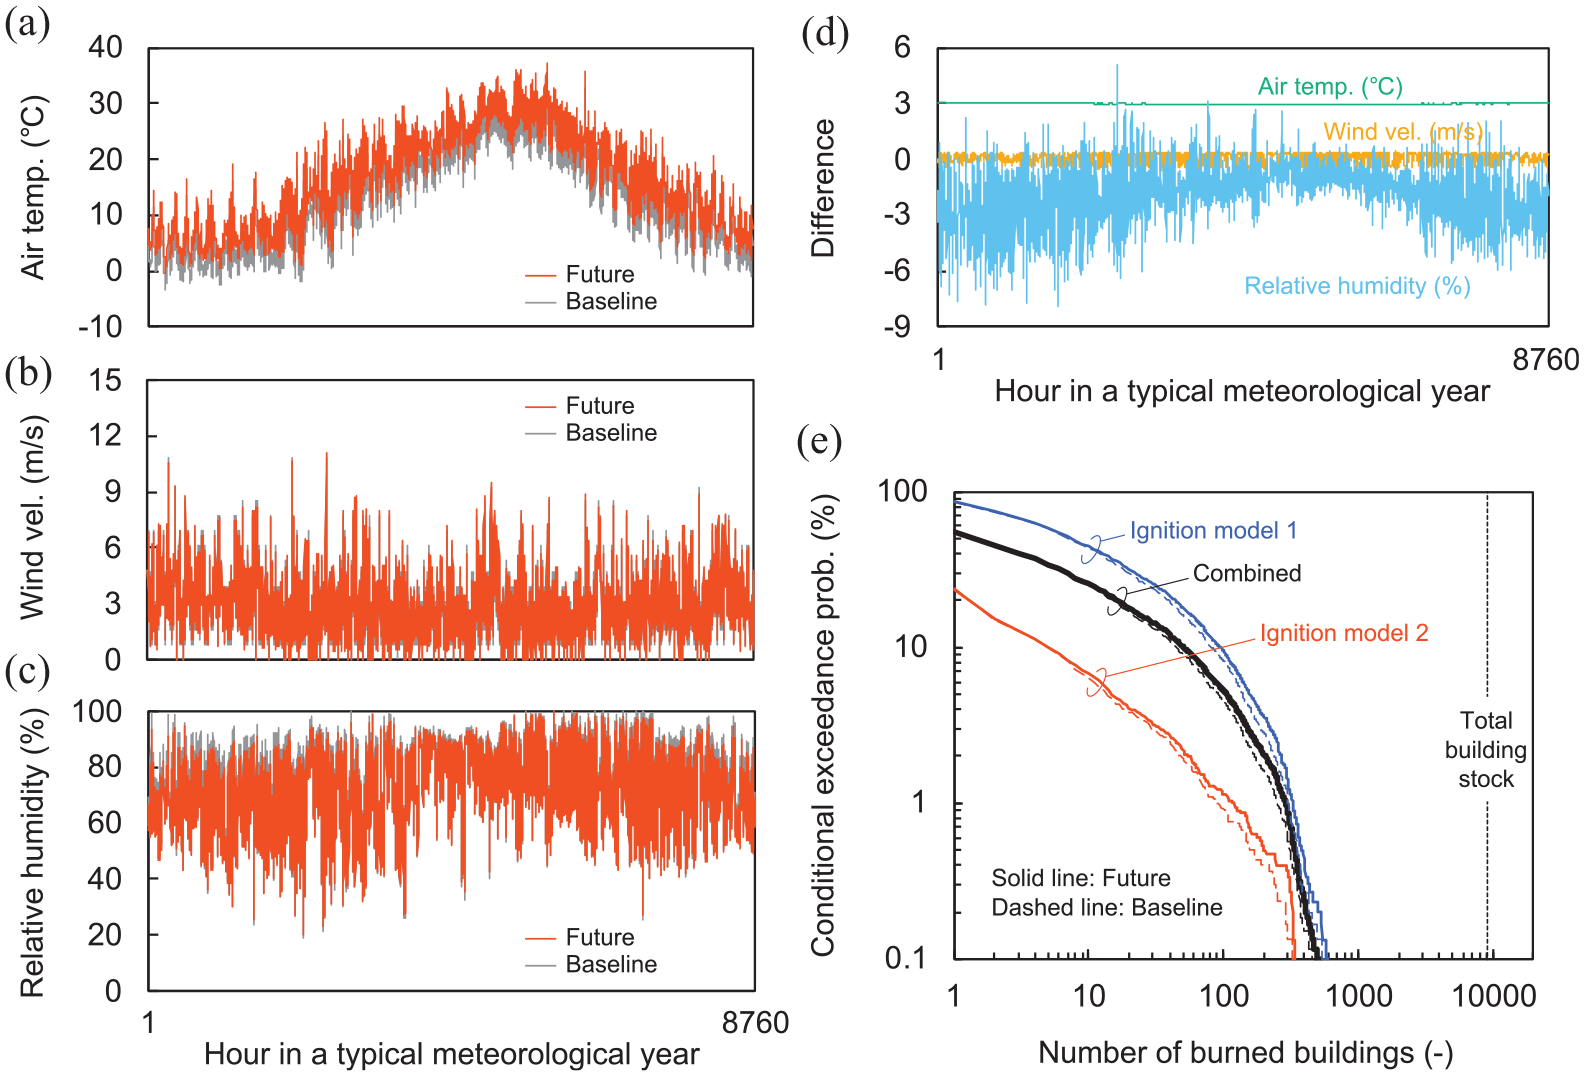
(a–d) Typical meteorological year (TMY) data for the baseline (1981–1995) and future (2077–2095) periods provided by the Meteorological Data System Co., Ltd., and (e) fire-following-earthquake loss exceedance curves evaluated using the TMY data for the downtown Wajima building stock model conditioned on a hypothetical Mw 7.6 earthquake on the F43 fault. Hourly values in the TMYs are shown for the (a) air temperature, (b) wind velocity, (c) relative humidity and (d) future values of these parameters relative to the baseline.
Conclusion
The multiple simultaneous fires following the 2024 Noto Peninsula earthquake were primarily caused by strong ground shaking; however, the earthquake-induced tsunami also caused fires originating in inundation areas. The author’s survey, including questionnaires and field observations, as well as publicly available information, suggests that the fires following the 2024 Noto Peninsula earthquake, although on a smaller scale, had few characteristic differences from the 1995 Kobe and 2011 Tohoku earthquakes (note that, following the 1995 Kobe earthquake, over 200 shaking-induced fires occurred, destroying over 46 ha, and that, following the 2011 Tohoku earthquake, over 100 tsunami-induced fires occurred, spreading over 61 ha in the tsunami inundation areas). This again raises concerns that the risk of both types of fires following earthquakes, that is, shaking-induced and tsunami-induced fires, still exists in modern Japanese society and that these fires may have a significant impact following possible future earthquakes.
The research question formulated in this study arose from the circumstance that an active fault model similar to the 2024 Noto Peninsula earthquake in terms of source region and Mw had been previously published but was underutilized in local government earthquake consequence predictions and risk reduction planning. Specifically, if a regional fire-following-earthquake risk assessment had been conducted for the building stock in downtown Wajima using the F43 fault model, what would the results have been and how would they have related to the actual consequences of the fires following the 2024 Noto Peninsula earthquake? This question was investigated using an up-to-date regional fire-following-earthquake risk model of Japan developed by the author. The long-term nature of risk assessments raised a further question in the context of future climate change. Specifically, how much will future climate change affect regional fire-following-earthquake risk assessments? This was also investigated via the case study for downtown Wajima using the F43 fault model, where the risk model was extended by incorporating synthetic future weather data based on global warming projections. Key insights from this study are summarized as follows.
Strong ground shaking caused by the 2024 Noto Peninsula earthquake may have triggered the ignition of 12 building fires, mostly from electrical appliances, equipment, and wiring, similar to other recent earthquakes in Japan, while tsunami inundation following the earthquake may have triggered the ignition of 2 fires from an inundated building and an inundated automobile. Three of these fires significantly enlarged.
The inferred ignition probabilities per person with respect to the PGV for the 2024 Noto Peninsula earthquake were relatively high with respect to other large earthquakes during the last approximately 30 years, falling between those of the 1995 Kobe and 2011 Tohoku earthquakes. At a PGV of 80 cm/s, the ignition probability for the 2024 Noto Peninsula earthquake was approximately 2.2 times that of the 2011 Tohoku earthquake and approximately 0.4 times that of the 1995 Kobe earthquake.
The suspected shaking-induced fire that started in downtown Wajima destroyed approximately 4.9 ha of an urban area not inundated by the tsunami, including 240 burned buildings. The following factors are empirically known to enhance post-earthquake fire development, all of which were observed in the Wajima fire. (1) Multiple fires occur simultaneously following an earthquake, reducing the number of fire engines available to respond to each fire. (2) Firefighters are delayed in detecting fires compared with normal times. (3) Seismic damage to water supply systems makes outdoor fire hydrants unavailable. (4) Seismic impacts on roads (e.g. cracks and bumps) and collapsed buildings make water sources (e.g. fire cisterns) and burning buildings inaccessible. (5) Even in wooden houses with exterior wall fire protection, ground shaking causes fire protection materials on the exterior walls to fall off, exposing the wood and reducing the fire protection performance.
The fire loss actually inflicted on the building stock in downtown Wajima following the 2024 Noto Peninsula earthquake belonged to the class of infrequent but large fires with respect to the stochastically synthesized fire-following-earthquake scenarios conditioned on a hypothetical earthquake based on the previously published but underutilized F43 fault model; specifically, the actual fire loss corresponded to a conditional exceedance probability of approximately 1.9%. This empirical information is useful as a reference for engineers to determine an anticipated exceedance for possible future earthquakes, allowing the effect of countermeasures to be quantified as a reduced loss at that exceedance level. The large fire in Wajima occurred in one of the high fire risk areas numerically highlighted by the individual building burn probability mapping, demonstrating that the methodology employed is useful for visualizing priority areas for fire risk reduction measures.
The fires in the fishing villages of Suzu and Noto occurred or likely occurred as a consequence of tsunami inundation and spread to a total of 18 buildings inundated by the tsunami. These likely tsunami-induced fires were an emerging type of fire following earthquake that has become a focus of attention since the 2011 Tohoku earthquake; such fires typically show the following fire development. (1) Wooden houses, automobiles, and various other items located near the coastline are washed away by the tsunami. (2) This floating debris accumulates in the gaps between the remaining houses. (3) The accumulated debris or remaining wooden houses are ignited by some type of heat source. (4) The fire spreads to nearby accumulated debris and remaining wooden houses, resulting in a large fire.
Using the TMY data for the future period (2077–2095) based on JMA global warming projections slightly increased the fire-following-earthquake loss exceedance probabilities for the building stock in downtown Wajima compared with using the TMY data for the baseline period (1981–1995) because of the average increase in the hourly air temperature and wind velocity and the average decrease in the hourly relative humidity. This suggests that conventional fire-following-earthquake risk assessments, which neglect future climate change, likely underestimate the loss exceedance probabilities. These results indicate the importance of incorporating future climate change into long-term fire-following-earthquake risk assessments, with further comprehensive investigation required to focus on differences in regions, climate models used, and the selection or sampling methods of 1-year weather sequences.
The findings from this study re-emphasize the need for continued efforts to widely implement fire-following-earthquake risk reduction measures, as well as the importance of using regional fire-following-earthquake risk assessments in developing risk reduction strategies. Because Japan has historically suffered from fires induced by earthquake shaking, various structural and nonstructural measures have been taken, such as formulating firebreaks with roads and fire-resistant buildings; improving areas with closely spaced wooden buildings; promoting post-earthquake ignition prevention measures, particularly seismic circuit breakers, which are household devices that detect shaking and automatically cut off electricity, to prevent electricity-related ignitions; and adding fire stations, pump trucks, and water sources, particularly fire cisterns. It is likely that these efforts have contributed to a certain level of reduction in the risk of conventional shaking-induced fires to date; however, continued implementation is necessary as long as the risk remains, as demonstrated by the 2024 Noto Peninsula earthquake.
In contrast, emerging tsunami-induced fires have not been considered in typical earthquake/tsunami risk management. However, the fact that, similar to the 2011 Tohoku earthquake, fires occurred within tsunami inundation areas following the 2024 Noto Peninsula earthquake re-emphasizes the critical importance of the safety of tsunami vertical evacuation buildings and highlights further challenges for fire-following-earthquake risk reduction. Although, fortunately, no incidents of tsunami-induced fire damage to tsunami vertical evacuation buildings and evacuees were reported for the 2024 Noto Peninsula earthquake, the tsunami following the 2011 Tohoku earthquake caused non-negligible situations in which tsunami-induced fires spread to tsunami vertical evacuation buildings and posed fire hazards to people who had escaped to these buildings from the tsunami. Reviewing the fire protection of existing tsunami vertical evacuation buildings is an urgent issue that needs to be addressed to improve preparedness. It is necessary to ensure that the structural components, exterior walls, and openings of tsunami vertical evacuation buildings are fire resistant and that these buildings have fire compartments to limit the spread of smoke and fire if tsunami-induced fires spread into these buildings.
Footnotes
Acknowledgements
The author is grateful to the municipal fire departments that completed the questionnaire. The author also thanks Martha Evonuk, PhD, from Edanz, for editing a draft of this manuscript.
Author contributions
Declaration of conflicting interests
The author(s) declared no potential conflicts of interest with respect to the research, authorship, and/or publication of this article.
Funding
The author(s) disclosed receipt of the following financial support for the research, authorship, and/or publication of this article: This study was supported by the Core-to-Core Collaborative Research Program (2024-K-1-2-1) of the Earthquake Research Institute at The University of Tokyo and the Disaster Prevention Research Institute at Kyoto University, funded by the Ministry of Education, Culture, Sports, Science and Technology (MEXT) of Japan under The Third Earthquake and Volcano Hazards Observation and Research Program (Earthquake and Volcano Hazard Reduction Research).
Data and resources
Questionnaire data collected in this study are not available because the respondents did not give consent for the data to be shared publicly. Some of the data used in this study can be found in the references cited. An important source for the 2024 earthquake fires is available at https://www.fdma.go.jp/singi_kento/kento/items/post-149/03/houkokusyo.pdf. Building stock data used in the fire risk analysis are available at ![]() .
.