
Abstract
We develop a methodology for modeling post-earthquake hospital needs and accessibility, coupling a probabilistic regional casualty risk model with a novel agent-based human behavior model. We use it to study hospital transportation in two socio-economically distinct districts of Lima, Peru, after a hypothetical moment magnitude 8.0 event. Our work provides insights into the infrastructure and socio-economic vulnerability factors that determine timely healthcare access, across various hypothetical behavioral and policy contexts/scenarios. In the baseline scenario that assumes households respond to the emergency independently (i.e. transport only their own members to hospital) but there is coordination among hospitals (i.e. ambulance sharing), car ownership is key for rapid healthcare access. Twenty-four percent of non-life-threatening casualties in the district with 57% car ownership will arrive at hospital in the first 45 min; only 6% of such patients in the more economically deprived district (18% car ownership) will reach hospital in that time. If car-owning neighbors help transporting patients without cars, over 96% of non-life-threatening casualties will reach hospital in the first 45 min in both districts, significantly reducing intra-regional disparities in healthcare access. Arrival times would nearly halve compared to the baseline scenario if the number of available ambulances doubled. If hospitals do not share ambulances, arrival times of non-life-threatening and threatening casualties show a notable reduction in one district (by 56% and 42%, respectively) but a significant increase in the other, more economically deprived district (by 109% and 97%, respectively), compared to the baseline case. The arrival times presented in this study are specific to the studied context, and the appropriate assumptions made. We benchmark the performance of the methodology using patient arrival times from the 2023 Turkey-Syria earthquake, yielding an acceptable outcome (i.e. similar temporal trends in the proportion of hospital arrivals). The findings can be leveraged for planning effective post-earthquake emergency response strategies.
Keywords
Introduction
Major earthquakes can produce devastating consequences in cities, including thousands of casualties due to infrastructure damage. For example, the last big earthquake that affected Lima, Peru (Mw 8.1) occurred in the subduction zone along the coast in 1974 and caused 250 deaths and 3600 injuries (Morales et al., 2023). Following these types of events, hospitals may face a sudden surge of patients who require medical treatment, far exceeding hospital admission rates in normal circumstances (e.g. Giri et al., 2018). Delays in medical treatment can be especially critical for patients with life-threatening conditions (e.g. those who require amputations or blood transfusions), as their mortality risk increases without immediate access to medical care (e.g. Guttmann et al., 2011). As cities like Lima rapidly grow and become more dense, the impact of natural hazards on public health also increases (Ceferino et al., 2020b). For instance, the February 2023 earthquakes (Mw 7.8 and 7.5) that struck south-central Turkey and north-western Syria caused more than 50,000 deaths and 107,000 injuries (e.g. Support to Life Türkiye, 2023; United Nations Population Fund, 2023). The large number of casualties makes these earthquakes the fifth-deadliest seismic event of the 21st century (Galasso and Opabola, 2024). To address these challenges, international entities such as the World Health Organization (2017) continuously encourage countries to implement policies that strengthen the capacities and coordination of hospital systems and facilitate related efficient resource allocation during emergency responses.
Many studies have proposed methodologies and models for characterizing and improving the earthquake disaster resilience of healthcare systems. Previous studies have used empirical or simulation-based approaches to estimate the number of injured people, the arrival pattern, and the length of time taken for patients to arrive at hospital emergency departments (e.g. Mahmoud et al., 2023; Palomino Romani et al., 2023). Empirical methods include scaling previous post-earthquake arrival rates based on the seismic intensity and hospital size (e.g. Cimellaro et al., 2011; Malavisi et al., 2015). For instance, Malavisi et al. (2015) estimated patient arrivals to a hospital emergency department in Turin, Italy for a 2500-year return period earthquake, by scaling the arrival rates from the Mw 6.7 1994 Northridge earthquake based on equivalent seismic intensities (i.e. peak ground acceleration [PGA] and Modified Mercalli Intensity). While practical, this approach cannot capture multiple factors that can influence patient mobility and arrival rates, such as population density, building vulnerabilities, and the transportation network (Palomino Romani et al., 2023). Other studies have proposed mixed approaches to partially overcome this issue, combining casualty models with empirical arrival data. For example, Favier et al. (2019) used the HAZUS (Federal Emergency Management Agency (FEMA), 2020) model and arrival rates from the 1994 Northridge earthquake to derive emergency access to hospital in Iquique, Chile for multiple earthquake scenarios. Further work has modeled post-earthquake patient arrivals as a non-homogeneous Poisson process with arrival rates decreasing over time (e.g. Merino et al., 2023; Palomino Romani et al., 2023).
Human behavior (decision-making) is a critical determinant of hospital patient arrival rates during natural-hazard emergencies. For instance, some injured individuals may choose to promptly seek medical assistance with the support of their relatives; others may postpone seeking help due to uncertainty about their physical condition or the accessibility of medical services. Simulation modeling techniques are increasingly used in investigations of human behavior during natural-hazard emergencies (e.g. Battegazzorre et al., 2021); agent-based models (ABMs) are among the most popular of these approaches due to their adaptability and customizability (e.g. Mls et al., 2023). An essential advantage of ABMs is their ability to represent the heterogeneity of social agents (e.g. people) at the individual level and the emergent phenomena that arise from interactions among individuals as well as between individuals and their environment (e.g. Bonabeau, 2002). ABMs can incorporate decision-making and social behavior of both individuals and groups (e.g. Cimellaro et al., 2017), which can support modelers in representing both independent actions and collaborative efforts often observed during disasters (e.g. Allier Montaño, 2018). Most previous applications of ABM to human behavior during earthquake emergencies have focused on building evacuation, predominantly at the indoor room or building level (e.g. Cimellaro et al., 2017; Xiao et al., 2016) during the initial minutes after the event, but also at the urban scale over longer timeframes extending to several hours (e.g. Battegazzorre et al., 2021; Iskandar et al., 2024; Mesta et al., 2024). Urban-scale evacuation ABMs often limit the extension of the geographical area (e.g. districts) and timeframe (e.g. hours) of analysis due to the significant computational burden associated with running large-scale simulations. In addition, ABMs have been employed to capture complex behaviors and interactions between interdependent systems (i.e. households, healthcare, schools, etc.) within urban communities, as well as to evaluate the impact of disruptions caused by various natural hazards (e.g. floods, hurricanes, tsunamis, etc.). These models have also been used to assess resilience measures for community planning purposes (e.g. Aghababaei and Koliou, 2023; Costa et al., 2021; Esmalian et al., 2022; Hassan and Mahmoud, 2018; Mas et al., 2015; Nejat and Damnjanovic, 2012; Tonn and Guikema, 2018).
Despite these efforts, a detailed investigation of the specific factors (e.g. means of transportation, number of hospitals in the area) controlling the transportation for injured people to hospitals after an earthquake remains largely absent from the literature. Post-earthquake hospital transportation for casualties presents a context-specific challenge, due to complex underlying relationships with population density, urban infrastructure, and socio-economic factors. Previous studies report that, apart from emergency medical service vehicles (i.e. ambulances), private cars are the primary mode of transportation to hospitals for injured people after an earthquake, as observed from the Mw 6.6 1995 Kobe, Mw 6.6 2013 Lushan earthquakes, and Mw 7.8 and 7.5 Turkey-Syria earthquakes (e.g. Gök et al., 2023; Kang et al., 2015; Tanaka et al., 1998). While playing a significant role in the emergency response, access to private cars may contribute to inequalities in post-earthquake accessibility of hospitals between populations from distinct socio-economic groups, as car ownership tends to increase with household income (Dargay, 2001). Other modes of transportation to hospitals typically used in normal conditions, such as public transport and taxis, may be unavailable after an earthquake, as was the case for the Mw 7.9 2007 Pisco seismic event (Andina: Agencia Peruana de Noticias, 2022). In addition, while local and national authorities have critical responsibilities for civil protection in natural-hazard events, communities are usually the first responders to take action (Shaw et al., 2011). For instance, a profound sense of collective community support emerged during the Mw 8.4 1985 Mexico earthquake, where neighbors helped each other in clearing debris to expedite the rescue of victims and improvised stretchers and means of transportation to ensure the prompt mobilization of injured people (Allier Montaño, 2018). Moreover, the unequal geographical distribution of healthcare facilities across a region may cause delays in access to emergency medical services after a disaster, as foreseen for Lima, Peru in the event of a major earthquake (Ceferino et al., 2020b; Liguori et al., 2019b).
We address gaps in the literature by investigating the influence of infrastructural and socio-economic factors on the post-earthquake accessibility of hospitals to injured populations. We use a simulation-based methodology that couples a probabilistic regional multi-severity casualty model with an ABM of human behavior to capture the transportation of relatively severely injured people to hospitals using private cars and ambulances. The methodology enables the study of hospital transportation for casualties in cities at high spatiotemporal resolutions (e.g. by analyzing arrival rates, travel times, or road usage per district or neighborhood) and facilitates the exploration of policies for improving post-earthquake healthcare accessibility. Our investigation focuses on two districts of Lima, Peru considering a Mw 8.0 earthquake scenario. The rest of the paper is structured as follows. The study area is introduced in the second section; data and methods are described in the third section; the fourth section presents and discusses the results; and conclusions of the paper are provided in the fifth section.
Study area
Lima is the capital city of Peru and home to approximately 10 million people, which is 30% of the country’s population (Instituto Nacional de Estadística e Informática (INEI), 2023). Multiple natural hazards threaten the city, including earthquakes, tsunamis, flooding, landslides, and flash floods. Among these, earthquakes, which are primarily caused by the subduction of the oceanic Nazca Plate underneath the South American Plate (e.g. Ceferino et al., 2021; Herbozo and Ampuero, 2023; Villacorta et al., 2019; Villegas-Lanza et al., 2016), stand out as the most damaging. Moreover, rapid (often unplanned) urban expansion in the city has led to widespread housing development characterized by low-quality building materials and constructed using deficient construction practices that lack appropriate seismic design provisions (e.g. Ceferino et al., 2018b; Diaz et al., 2023). These factors have contributed to high seismic exposure and physical vulnerability in Lima (e.g. Moya et al., 2022; Silva et al., 2023).
This study focuses on two districts of Lima, namely Santiago de Surco (herein referred to as Surco) and San Juan de Miraflores (herein referred to as San Juan). Situated contiguously in the southern part of Lima, these districts are 34.8 km2 and 24.0 km2 in size, respectively (Lima Cómo Vamos, 2022). With around 414,000 and 418,000 inhabitants in 2021, Surco and San Juan rank as the seventh and eighth most populated districts of Lima, respectively (Lima Cómo Vamos, 2022). These two districts have strikingly different socio-economic features. In Surco, 65% and 35% of households are high-income and middle-income, respectively. In contrast, only 22% of households in San Juan are high-income, and 68% and 9% of the district’s households are middle-income and low-income, respectively (INEI, 2020). The per capita household income ranges for the high-, middle-, and low-income brackets in Lima are set as 650.30 USD or above, between 232.82 and 650.30 USD, and 232.82 USD or below, respectively (INEI, 2020). Figure 1 shows the study area, including the extent of the two districts and the nine hospitals and road network accounted for (see Section “Agent classes” for more context). There is an unequal distribution of healthcare facilities in the two districts; four hospitals are located in Surco, one in San Juan, and the remaining four are in neighboring districts. The road densities (i.e. the length of the total road network divided by the district’s land area) in Surco and San Juan are 16.3 km per km2 and 26.5 km per km2, respectively.
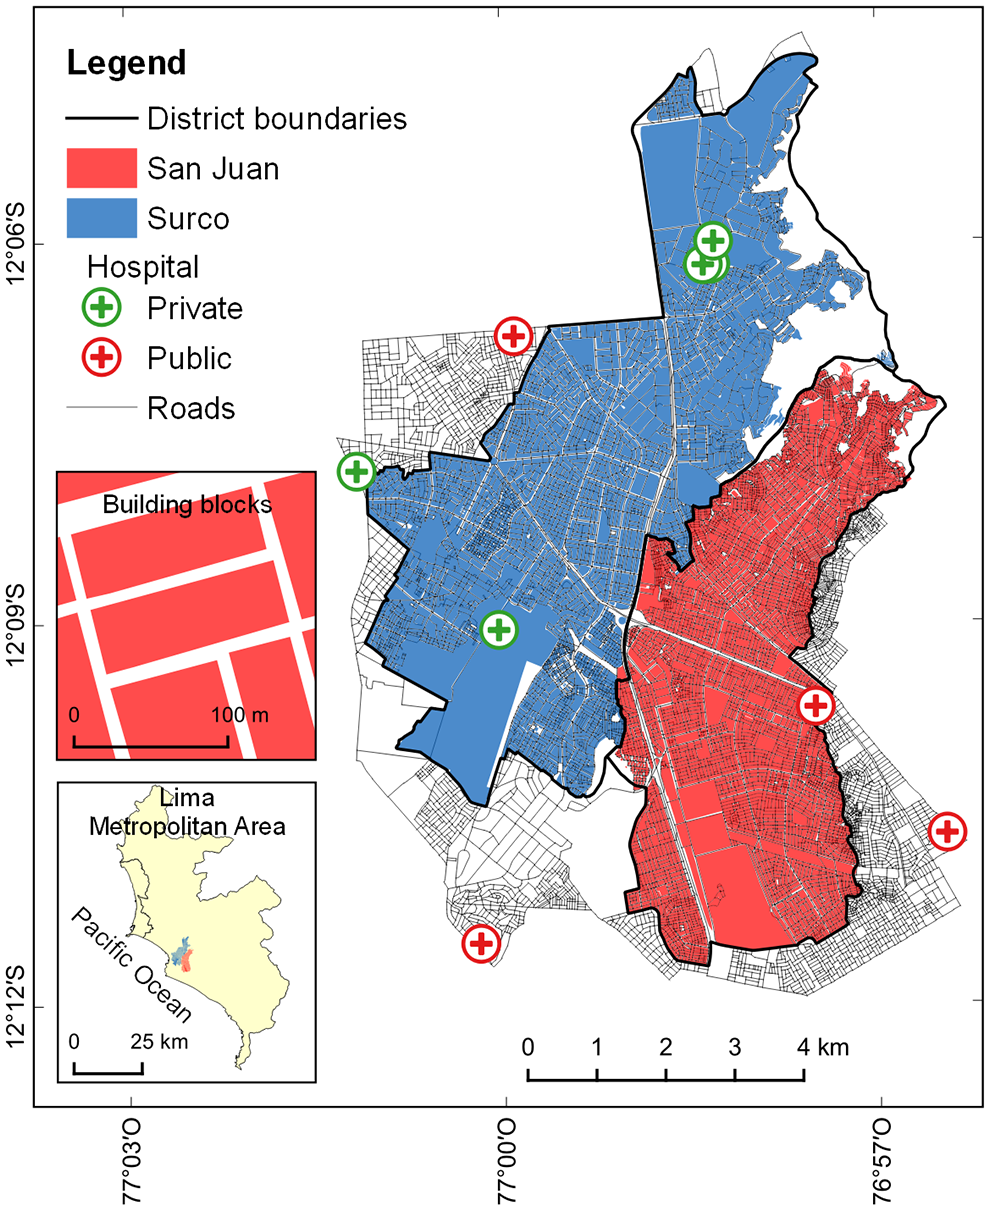
Map of the study area (with two insets showing its geographical location within the Lima Metropolitan Area, and some typical building blocks in San Juan). San Juan and Surco have similar population sizes but exhibit significant differences in terms of socio-economic characteristics, including the provision of healthcare facilities.
Materials and methods
The proposed methodology investigates the factors controlling the post-earthquake transportation for injured populations to hospitals by ambulance or private car, which are the primary modes for transporting casualties to hospitals after earthquakes (Gök et al., 2023; Kang et al., 2015; Tanaka et al., 1998). It involves two computational modules. The first module builds on a framework developed by Ceferino et al. (2018a) and evaluates the spatial distribution of earthquake-induced injuries and fatalities. The second module contains a new ABM for simulating individual and collective human behavior influencing post-earthquake patient transportation to hospital. Our simulation-based approach relies on Monte Carlo (MC) sampling within both modules to capture key uncertainties dominating the predictions of earthquake emergencies. Figure 2 provides a scheme that summarizes the methodology. The first module involves defining a deterministic earthquake rupture scenario. Then, we start a simulation by generating an exposure realization (i.e. distribution of buildings, households, and population), from which corresponding building damage and population health states are sampled for the considered earthquake scenario. In the second module, the ABM incorporates two classes of agents (person and ambulance), each defined by specific attributes and actions. Attributes are sampled independently for each agent in each simulation, as appropriate; certain attributes of the person agents (i.e. the health state and household car ownership) are informed by outcomes from the first module. Finally, post-earthquake healthcare accessibility is assessed in terms of the ratio of patients successfully transported to hospitals over time. (Alternative metrics, such as travel times or road usage, can also be derived from the model.)
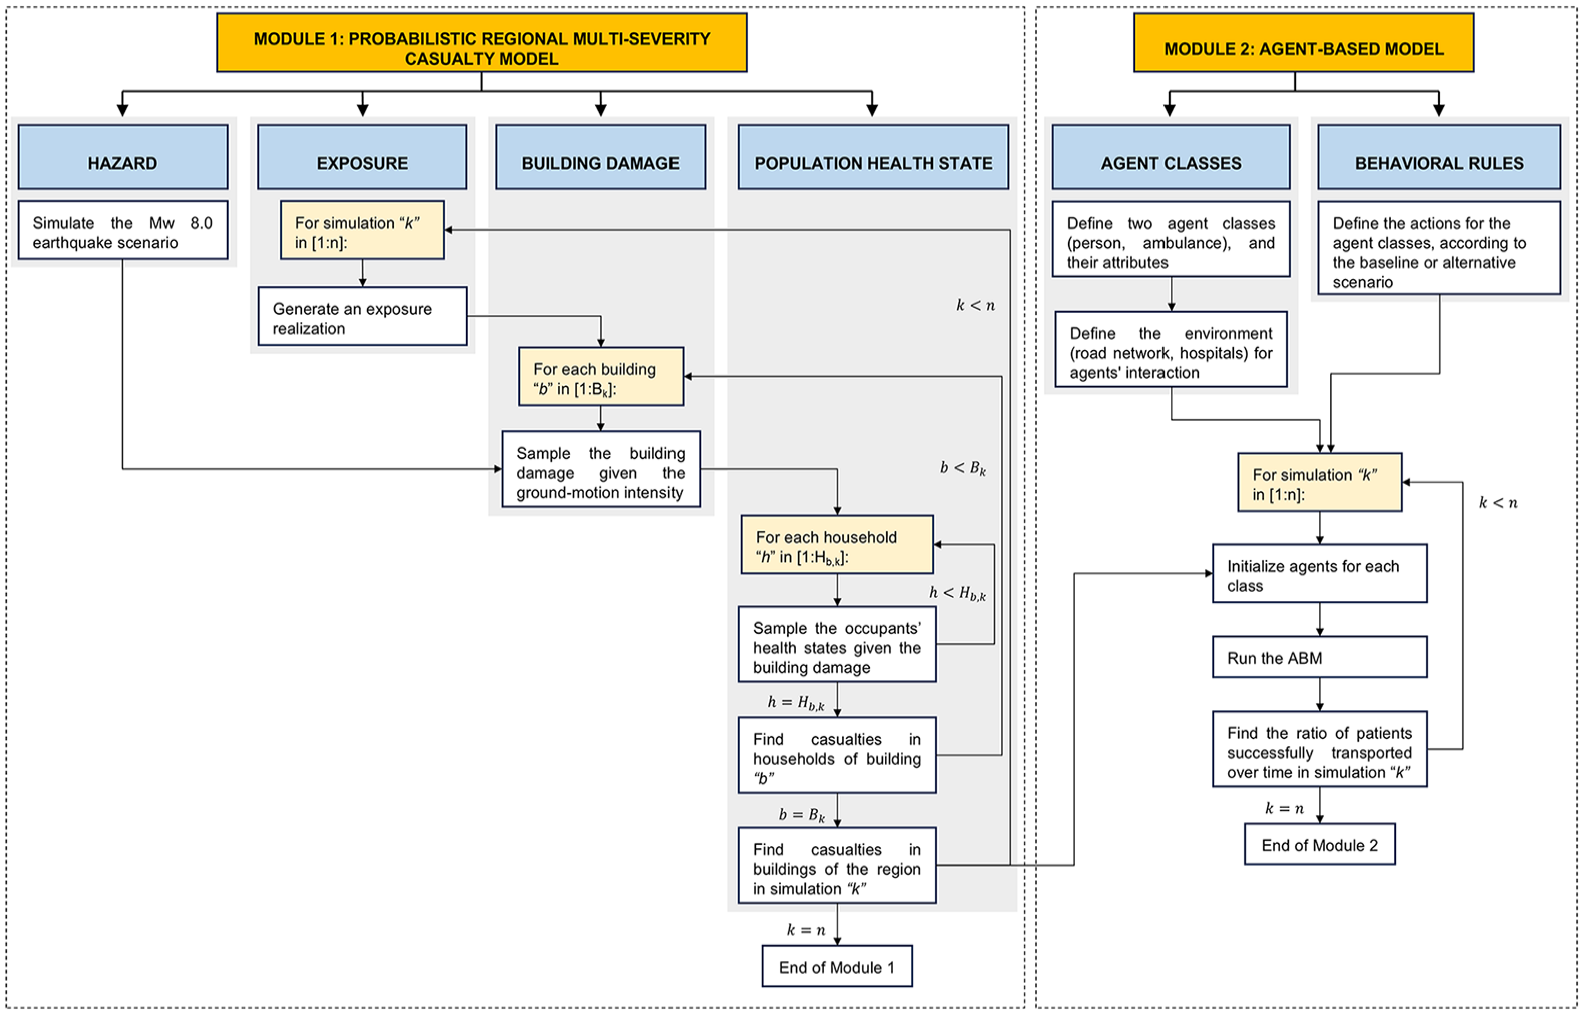
Overview of the modeling approach used in this study. k is the number of a specific simulation, n is the total number of simulations, b is a specific building of the total B k buildings in simulation k, h is a specific household of the total Hb, k households living in building b of simulation k.
Although simulations from the first module pose minimal computational demand, running an ABM with a large spatial scale (e.g. incorporating over 600,000 agents) and high temporal resolution (i.e. each simulation is conducted in time increments of 1 min, and some simulations extend up to 15 days) requires significant computational resources (see Section “Results” for more context). Therefore, the methodology is implemented using 100 MC simulations as a tradeoff between computational efficiency and the accuracy and stability of the results (see Tables S4 and S5 of Supplemental Material).
Module 1: probabilistic regional multi-severity casualty model
The probabilistic casualty model comprises four steps: (1) hazard modeling, (2) exposure modeling, (3) building damage modeling, and (4) population health state modeling. While our approach remains consistent with the original formulation of Ceferino et al. (2018a), we conduct the second, third, and fourth steps at a finer spatial resolution (i.e. building-block level rather than the broader district scale).
Hazard modeling
We employ a scenario-based hazard modeling approach, since it is particularly beneficial for communicating risk to policymakers and the general public, who may lack an intuitive sense of probabilities (e.g. Bonstrom et al., 2012). Given that ground-motion variability can dominate the uncertainty in scenario-based seismic risk calculations and the infrastructure and socio-economic factors under investigation are non-hazard-related, we adopt a fully deterministic earthquake rupture scenario (e.g. Cremen et al., 2022). This means that the 100 simulations propagate uncertainties only on exposure and vulnerability components of risk (to be described in detail in later sections), such that we capture the randomness in the location of casualties but not their variability in absolute numbers. We consider a nighttime earthquake scenario, such that casualties are calculated assuming that 100% of occupants are indoors during the event (in line with Chase et al., 2023). The rupture parameters of the considered earthquake scenario reflect those of the Mw 8.0 event that occurred in the subduction zone on the coast of Lima in 1940, which is described in detail by Ceferino et al. (2020b). The projection of the earthquake rupture on the Peruvian territory is shown in Figure 3.
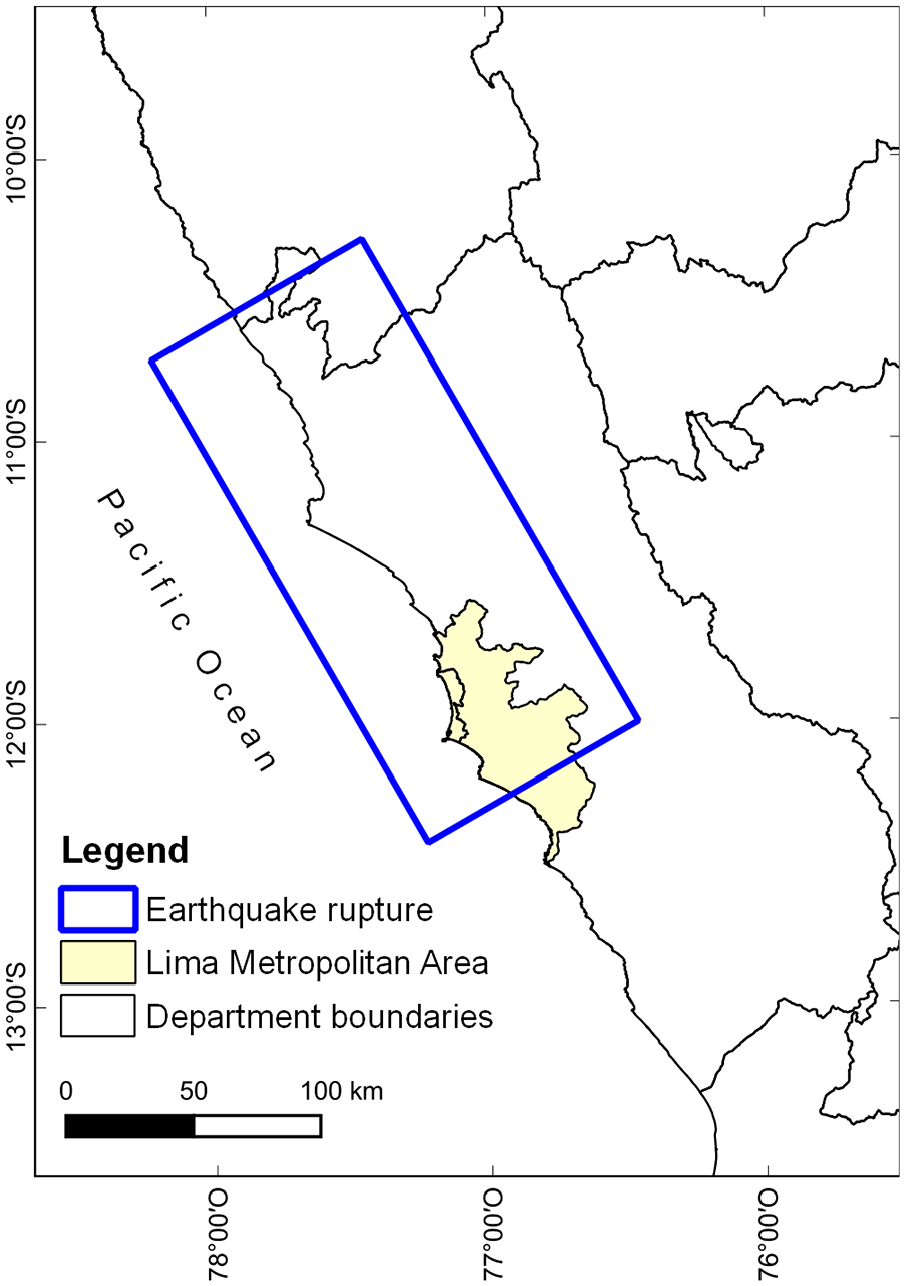
Projection of the Mw 8.0 earthquake rupture considered in the analysis.
The ground-shaking estimates for the study area are computed on a 1-km spaced grid, using the ground-motion model (GMM) of Abrahamson et al. (2016) and accounting for the correlation of intra- (Markhvida et al., 2018) and inter-event (Goda and Atkinson, 2009) residuals, as well as the site-specific soil conditions in Lima (Calderon, 2012). The GMM of Abrahamson et al. (2016) has been previously employed to characterize subduction interface events in Peru (Aguilar et al., 2017; Ceferino et al., 2020a, 2020b; Das et al., 2020). The site-specific soil conditions in Lima are characterized using Vs30 (time-averaged shear-wave velocity to 30 m depth) values, which combine direct geophysical measurements (Calderon, 2012) with coarse slope-based Vs30 estimates (Wald and Allen, 2007). The Vs30 map with a spatial resolution of 1 km is provided by Ceferino et al. (2018b) and displays values ranging from 300 to 450 m/s across a large extent of the study area. While correlation models of intra- and inter-event residuals are needed to produce more accurate ground-motion fields for regional seismic risk assessments (e.g. Galasso and Opabola, 2024; Iacoletti et al., 2024), we acknowledge that the GMM and correlation models used in this study are not fully consistent as they have been trained on different datasets of recorded ground motions.
We simulate 1000 realizations of the three required intensity measures (see Table S1 of Supplemental Material), which are PGA and two spectral accelerations at the fundamental period of considered buildings in the exposure/building damage modules, or Sa(T1): Sa(0.3 s) and Sa(1.0 s). Then, the ground-shaking intensity values to be considered are selected to be those of the realization that produce the 75th percentile mean PGA value across all locations (in line with Cremen et al., 2022). The three sets of ground-shaking intensity values associated with this realization (see Figure 4) are used for all subsequent simulations of the casualty model.
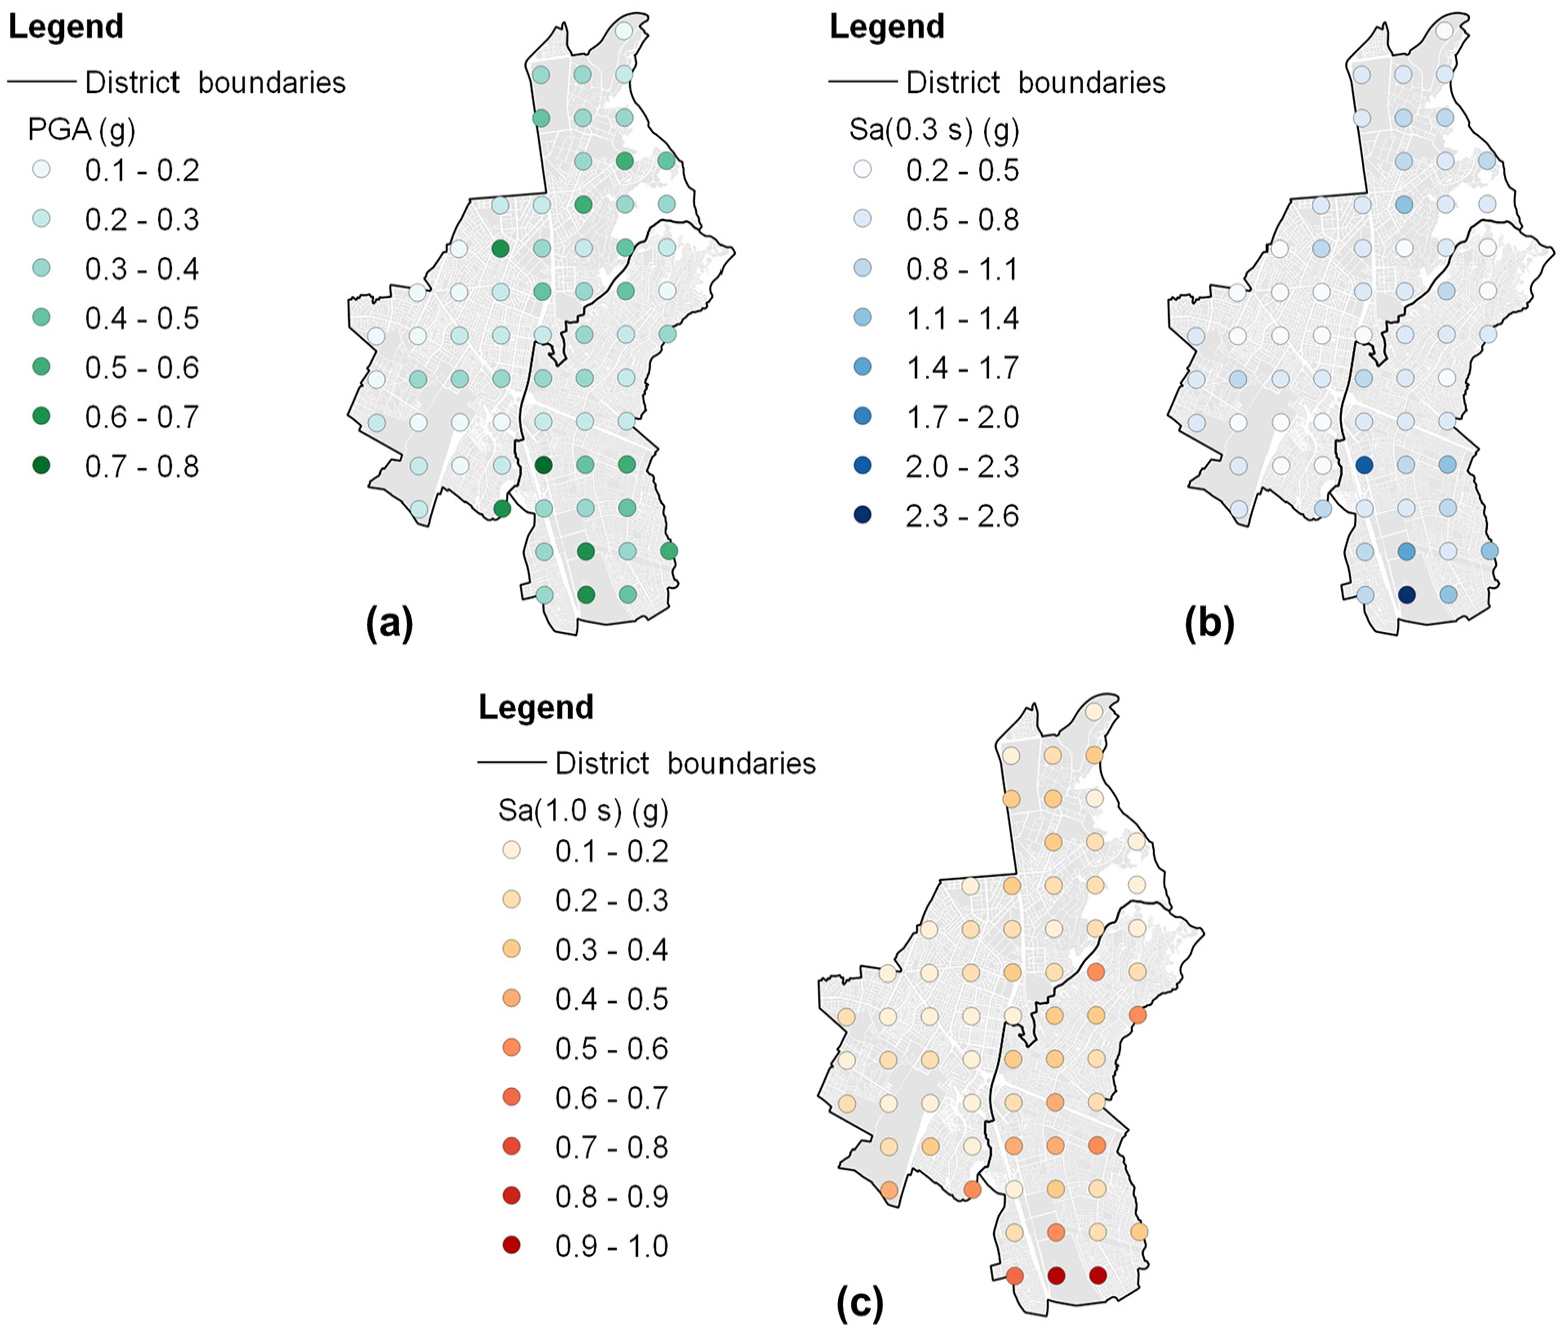
Ground-motion fields of the considered earthquake scenario: (a) PGA, (b) Sa (0.3 s), and(c) Sa (1.0 s).
Exposure modeling
We characterize exposure for both districts based on the 2017 National Population and Housing Census (INEI, 2017) and the South American residential building stock database collected in the South American Risk Assessment (SARA) project (Global Earthquake Model (GEM) Secretariat, 2015; Villar-Vega et al., 2017). The census provides the number of households, the number of people, and other demographic and socio-economic attributes of the population (e.g. household car ownership) for each block of the two districts. The residential building exposure model of the SARA project was developed at the district level, using census data from 2007 and expert elicitation. It features 36 building typologies, which are defined based on the structural system and its material, number of stories, and ductility properties. Table S1 (see Supplemental Material) lists these typologies and their proportional representation in Surco and San Juan. We integrate these different sources of information to create an exposure model of buildings, households, and population at the block level. Using the following stochastic procedure, we simulate different exposure realizations to account for uncertainties regarding the spatial distribution of building typologies, household composition, and household car ownership. First, we randomly sample buildings using district-specific proportions of each typology and assign a set number of households to each building using the scheme proposed in the SARA project (see Table S2 of Supplemental Material). The random generation of buildings is stopped when the total number of assigned households matches the corresponding household count from the census. We then use the typology of each building to determine whether the assigned households own a private car, based on city-wide trends observed using census data and physical vulnerability data from the SARA project (see Figure S1 of Supplemental Material). These trends indicate that, across districts, there is a positive correlation between the proportion of households owning a private car and the proportion of households living in reinforced/confined masonry and reinforced concrete buildings. Therefore, we assume that households associated with these structural typologies are more likely to have a private car than those living in other buildings (i.e. unreinforced masonry, wood, and earth typologies). We randomly assign households in reinforced masonry and reinforced concrete buildings as car owners to match the corresponding statistics reported by the census; households in other buildings are further randomly designated as car owners if required. Then, we assume that households in a given block contain approximately the same number of people, given that the census does not provide household information at the building level. Thus, we determine the household size as the number of people residing in each block divided by the number of assigned households.
Building damage modeling
We employ fragility relationships to characterize the probability of damage to the building stock conditional on ground shaking. The shaking intensities assigned to the buildings are determined from the nearest hazard site (i.e. a point within the 1 km spaced grid generated in the hazard modeling component). The fragility relationships assigned to the considered building typologies describe six damage states (i.e. ds1—None, ds2—Slight, ds3—Moderate, ds4—Extensive, ds5—Complete without structural collapse, and ds6—Complete with structural collapse). Villar-Vega et al. (2017) provide the fragility model for the first five damage states. This model was developed for the residential building stock in South America, including Peru. The fragility relationships for ds6 are derived as the product of the corresponding fragility relationship for ds5 and structural collapse rates from HAZUS (FEMA, 2020); more details can be found in Ceferino et al. (2018a). For each simulation, a damage state is sampled for each building using the probabilities of exceeding the damage states defined in the fragility relationships. Fragility relationships for the one-story unreinforced masonry and two-story ductile confined masonry typologies are shown in Figure 5 (panels a and b) as examples.
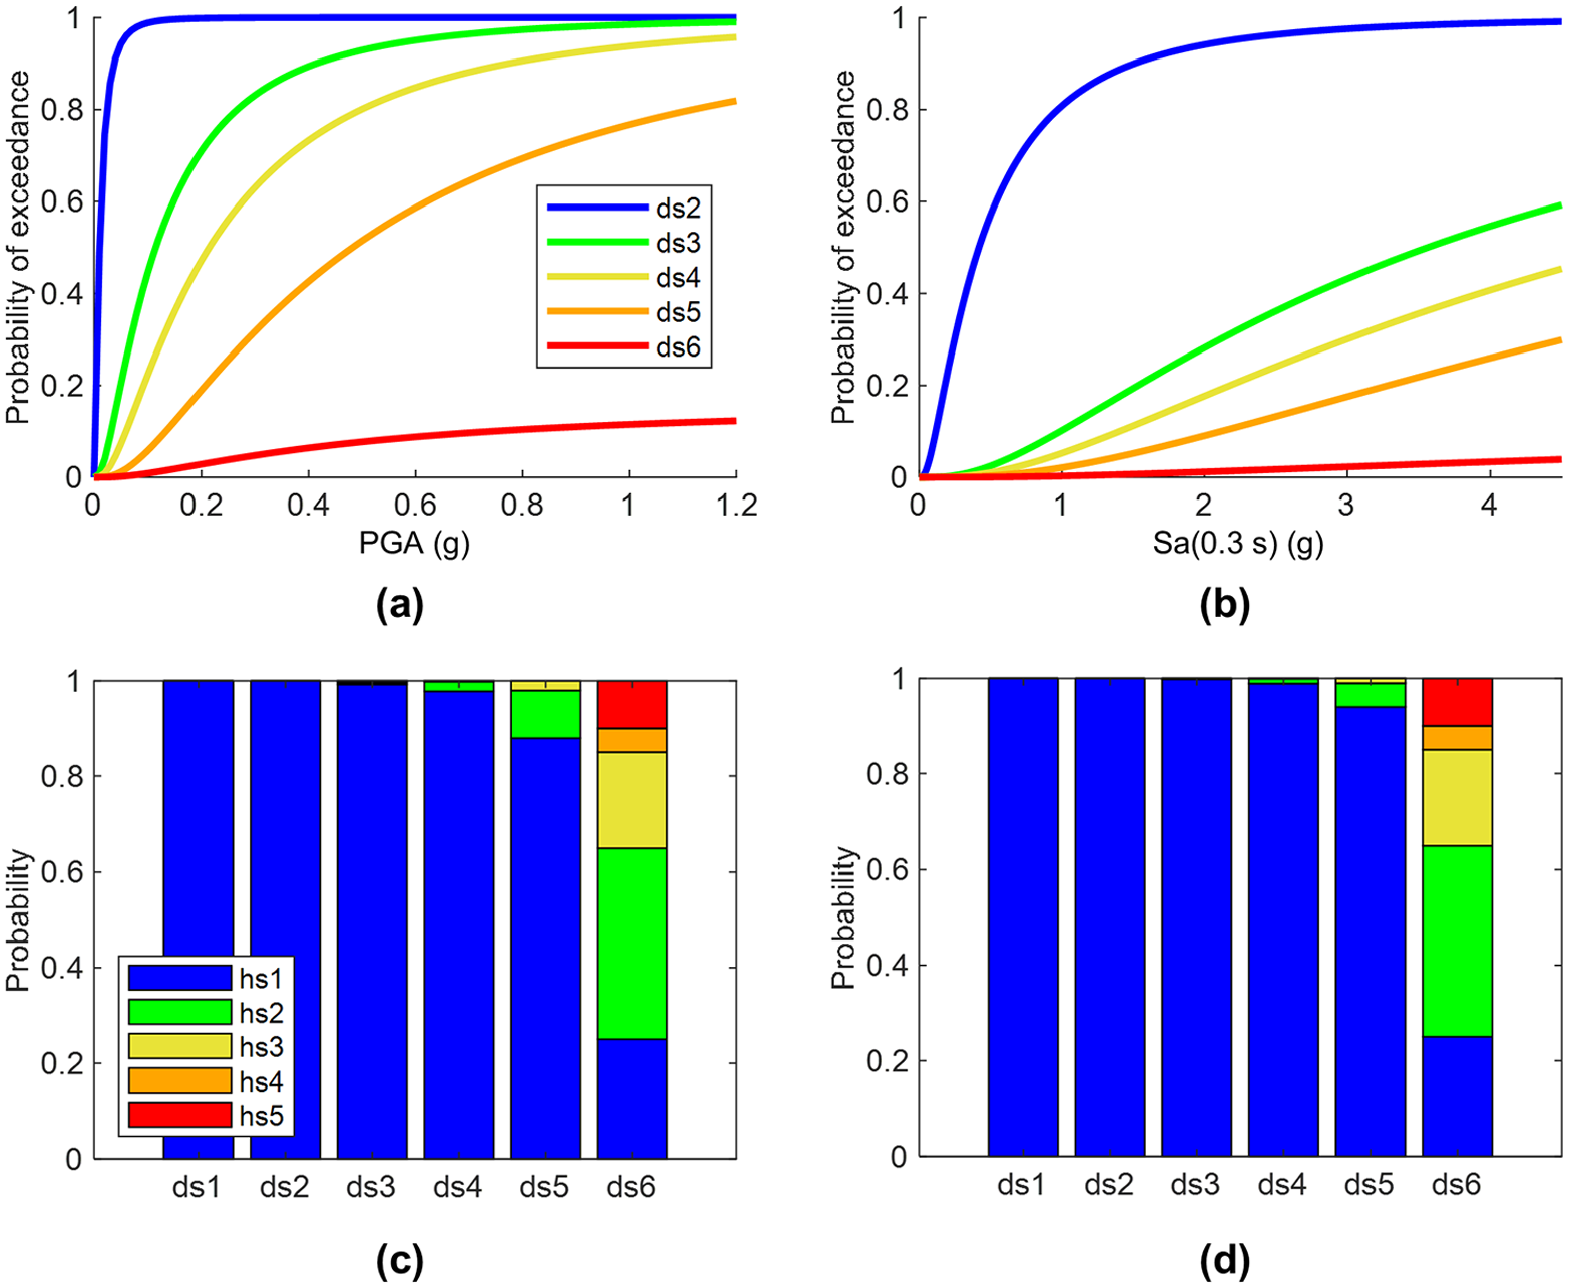
(a) Fragility relationships and (c) damage-state- (ds-) dependent probabilities of an individual’s health state (hs) for the one-story unreinforced masonry typology. (b) Fragility relationships and(d) ds-dependent probabilities of an individual’s health state for the two-story ductile confined masonry typology. ds1—None, ds2—Slight, ds3—Moderate, ds4—Extensive, ds5—Complete without structural collapse, ds6—Complete with structural collapse, hs1—Not injured, hs2—Severity-1, hs3—Severity-2, hs4—Severity-3, hs5—Fatality.
Population health state modeling
HAZUS (FEMA, 2020) casualty rates are used as marginal probabilities that each household occupant has a certain health state (hs), which depends on both the damage state and the typology of the associated building. The considered building typologies are mapped to those provided in HAZUS based on similarities in structural characteristics; more details can be found in Ceferino et al. (2018a). There are five possible health states (i.e. hs1—Not injured, hs2—Severity-1, hs3—Severity-2, hs4—Severity-3, hs5—Fatality). Severity-1 represents injuries that do not require hospitalization, severity-2 represents non-life-threatening injuries requiring hospitalization, and severity-3 represents life-threatening injuries requiring immediate hospitalization (see Section “Agent classes” for more details). The probability of hs1 is calculated so that the sum of health-state probabilities equals one. Within each household, the health states of individuals are sampled using a multinomial distribution with the number of trials equal to the number of occupants in the household. The damage-dependent probabilities of an individual’s health state for the one-story unreinforced masonry and two-story ductile confined masonry typologies are shown in Figure 5 (panels c and d) as examples.
Module 2: agent-based model
The ABM is developed in GAMA (GIS Agent-based Modeling Architecture), an open-source platform for multi-agent simulations. We select this platform due to its ability to integrate and manipulate geospatial data, its robust capacity to handle large-scale simulations, and its open-source framework, which facilitates the reproducibility and communication of the methodology (Taillandier et al., 2019). As described in the following sections, we develop a number of different modeling scenarios that vary in terms of the specific agent actions incorporated.
Agent classes
The ABM consists of two classes of agents: person and ambulance. A class is a template for an agent; when we initialize the model and run a simulation, many agents are created for each class. In addition, the agents interact in an environment that contains the road network and hospitals. Table S3 of Supplemental Material describes the structure of the proposed ABM, indicating the attributes and actions defined for each class.
The attributes of the person class include the health state computed in Module 1. We assume that only people whose health state is severity-2 or severity-3 (i.e. those requiring hospitalization) will seek hospital treatment during the emergency. People whose health state is severity-1 have minor injuries (e.g. contusions, lacerations, minor burns) and could receive medical attention in small, local medical centers. Severity-2 patients have non-life-threatening injuries, ranging from non-surgical injuries (e.g. dislocations, fractures) that can be treated in trauma or examination rooms to more complex cases such as extremity injuries (e.g. soft-tissue injuries, upper and lower limb fractures) that need surgical procedures under general anesthesia in an operating room (e.g. internal fixation, debridement, skin grafting) and a recovery process in a hospitalization bed. Severity-3 patients have life-threatening injuries, including non-extremity injuries (e.g. fractures in the head, neck, thorax, pelvis) that require major surgery in an operating room, crush syndrome, musculoskeletal injuries that require amputation procedures, and ischemic heart disease (FEMA, 2020; Merino et al., 2023). Note that attributes for private cars (e.g. travel speed) are also included in the person class, as appropriate.
The ambulance class is defined assuming that each hospital assigns one of its ambulances to transport patients in both districts; any other available ambulances are conservatively assumed to be used for mobilizing patients from the surrounding districts. Hospitals with no ambulances are assumed to use one supplied by the local government or a private institution. These assumptions align with the directives of the regional authorities, which stipulate that the integrated health networks (i.e. DIRIS—Direcciones de Redes Integradas de Salud) and emergency response agencies (i.e. SAMU—Servicio de Atención Móvil de Urgencia and Sistema de Transporte Asistido de Emergencia) in Lima have the capacity to coordinate a collaborative emergency response between hospitals of the same sector (i.e. a group of contiguous districts, as in the case of Surco and San Juan) in terms of patient to hospital transportation (Ministry of Health (MINSA), 2021). We assume that, in a post-earthquake situation, ambulances would prioritize transporting critically injured earthquake-related patients over routine cases, in line with typical emergency response protocols for mass casualty events (e.g. Pollaris and Sabbe, 2016). Some of the considered scenarios incorporate a modified allocation of ambulances among hospitals, as detailed in Section “Alternative scenarios.”
We model post-earthquake patient transportation through the coupled infrastructure of hospitals and roads. The hospitals are defined using a hospital inventory dataset (Liguori et al., 2019a; Santa Cruz et al., 2013) that includes information on hospital campuses from the public healthcare systems (i.e. MINSA, and EsSalud—Social Security) in Lima. We also include hospitals from the private healthcare system, as the regional authorities expect both public and private healthcare systems to provide medical services after a major earthquake in the city (MINSA, 2021). We consider nine hospitals; four are located in Surco, one in San Juan, and the other four in neighboring districts (see Figure 1). The analysis of post-earthquake hospital functionality is not within the scope of this study, and we assume hospitals remain capable of receiving patients. In any case, the Hospital Safety Indices (World Health Organization and Pan American Health Organization, 2015) for the four public hospitals considered in this study indicate that three (i.e. Guillermo Kaelin de la Fuente, Instituto Nacional de Rehabilitacion, Instituto Nacional de Enfermedades Neoplasicas) are anticipated to remain fully functional following a disaster, whereas the fourth (i.e. Maria Auxiliadora, located in the east of Figure 1) was deemed in a 2013 report to require urgent safety intervention measures (Santa Cruz et al., 2013) to achieve this level of post-earthquake performance (Santa Cruz et al., 2013). Accordingly, MINSA prioritized seismic structural retrofitting for Maria Auxiliadora Hospital in 2018 (MINSA, 2018). Further research is required to evaluate the post-disaster functionality prospects for private hospitals in Lima, including those considered in this study (i.e. Las Palmas, INCA, San Pablo, Tezza, Montesur).
The road network is defined using a dataset provided by the national authorities that contains all city streets, avenues, and roads. The potential failure or closure of road infrastructure as well as electricity outages affecting the traffic flow could impact post-earthquake travel times, as ambulances and private cars may be required to find alternative routes to hospitals. However, in this study, we assume the road network remains fully functional after the considered earthquake. We do not consider the impact of collapsed-building debris accumulation on roads because models to estimate debris require the use of high-resolution building-level and road network datasets (e.g. Iskandar et al. 2023; Moya et al., 2020; Xu et al., 2022) that are not available for the case study. In any case, the building stock of Surco and San Juan is predominantly low rise—mainly consisting of buildings with one (representing 50% and 67% of buildings in both districts, respectively) or two stories (representing 38% and 27% of buildings in both districts, respectively)—for which the extent of collapsed-building debris is not expected to cause substantial road blockages or significantly alter post-earthquake travel times compared to normal conditions (e.g. Argyroudis et al., 2015; Chang et al., 2019; Moya et al., 2020). In addition, the number of building collapses expected in the study area for the considered earthquake is relatively low (235 out of 67,311 buildings in Surco, 749 out of 73,135 buildings in San Juan; see Section “Results” for more context). Moreover, additional research is needed to assess the seismic vulnerability of the approximately 20 reinforced concrete or steel pedestrian bridges that span main roads in the study area, which are anyway regularly maintained by the Ministry of Transport and Communications (MTC, 2022). Furthermore, we do not consider any potential traffic congestion in the more longer term (i.e. across the days following the earthquake) due to other road users (e.g. those forced to relocate).
It is important to note that the exact number of, and rules associated with (details to follow), agents adopted in our modeling are specific to the studied context, generally reflecting the region’s hospital management and healthcare emergency structure. However, the proposed methodology is designed to be generalizable for the coupled infrastructure of hospitals and roads in any earthquake-prone region. In different contexts, additional agents may need to be introduced (e.g. emergency services such as fire trucks and police), or slightly modified emergency protocols may need to be considered (e.g. deploying mobile field hospitals in heavily affected areas), but the overall computational flow would remain unchanged.
Behavioral rules (actions)
The actions defined for the person class are summarized in Figure 6. Severity-2 patients are assumed to go to the nearest hospital along the shortest route by private car immediately after the earthquake, if two conditions are met: (1) there is at least one not-injured person in their household, and (2) their household owns a car. This assumption is supported by observations from past earthquakes (e.g. Gök et al., 2023; Tanaka et al., 1998); injured individuals with trauma injuries or requiring surgical operations often arrived at hospitals by their own means (e.g. family cars) after these events. Otherwise, severity-2 patients call for an ambulance and wait for their transport to any hospital in the area. Severity-3 patients always call for an ambulance and wait for their transport to any hospital in the area; given the significant extent of their injuries, we neglect the possibility of these patients being mobilized by their own means. We have not considered potential calls related to severity-4 (fatality) casualties. However, the arrival of unverified deaths in hospitals after an earthquake tends to be minimal (e.g. Gök et al., 2023 reported only 2% of deceased patients arriving at a hospital after the Turkey-Syria earthquakes).
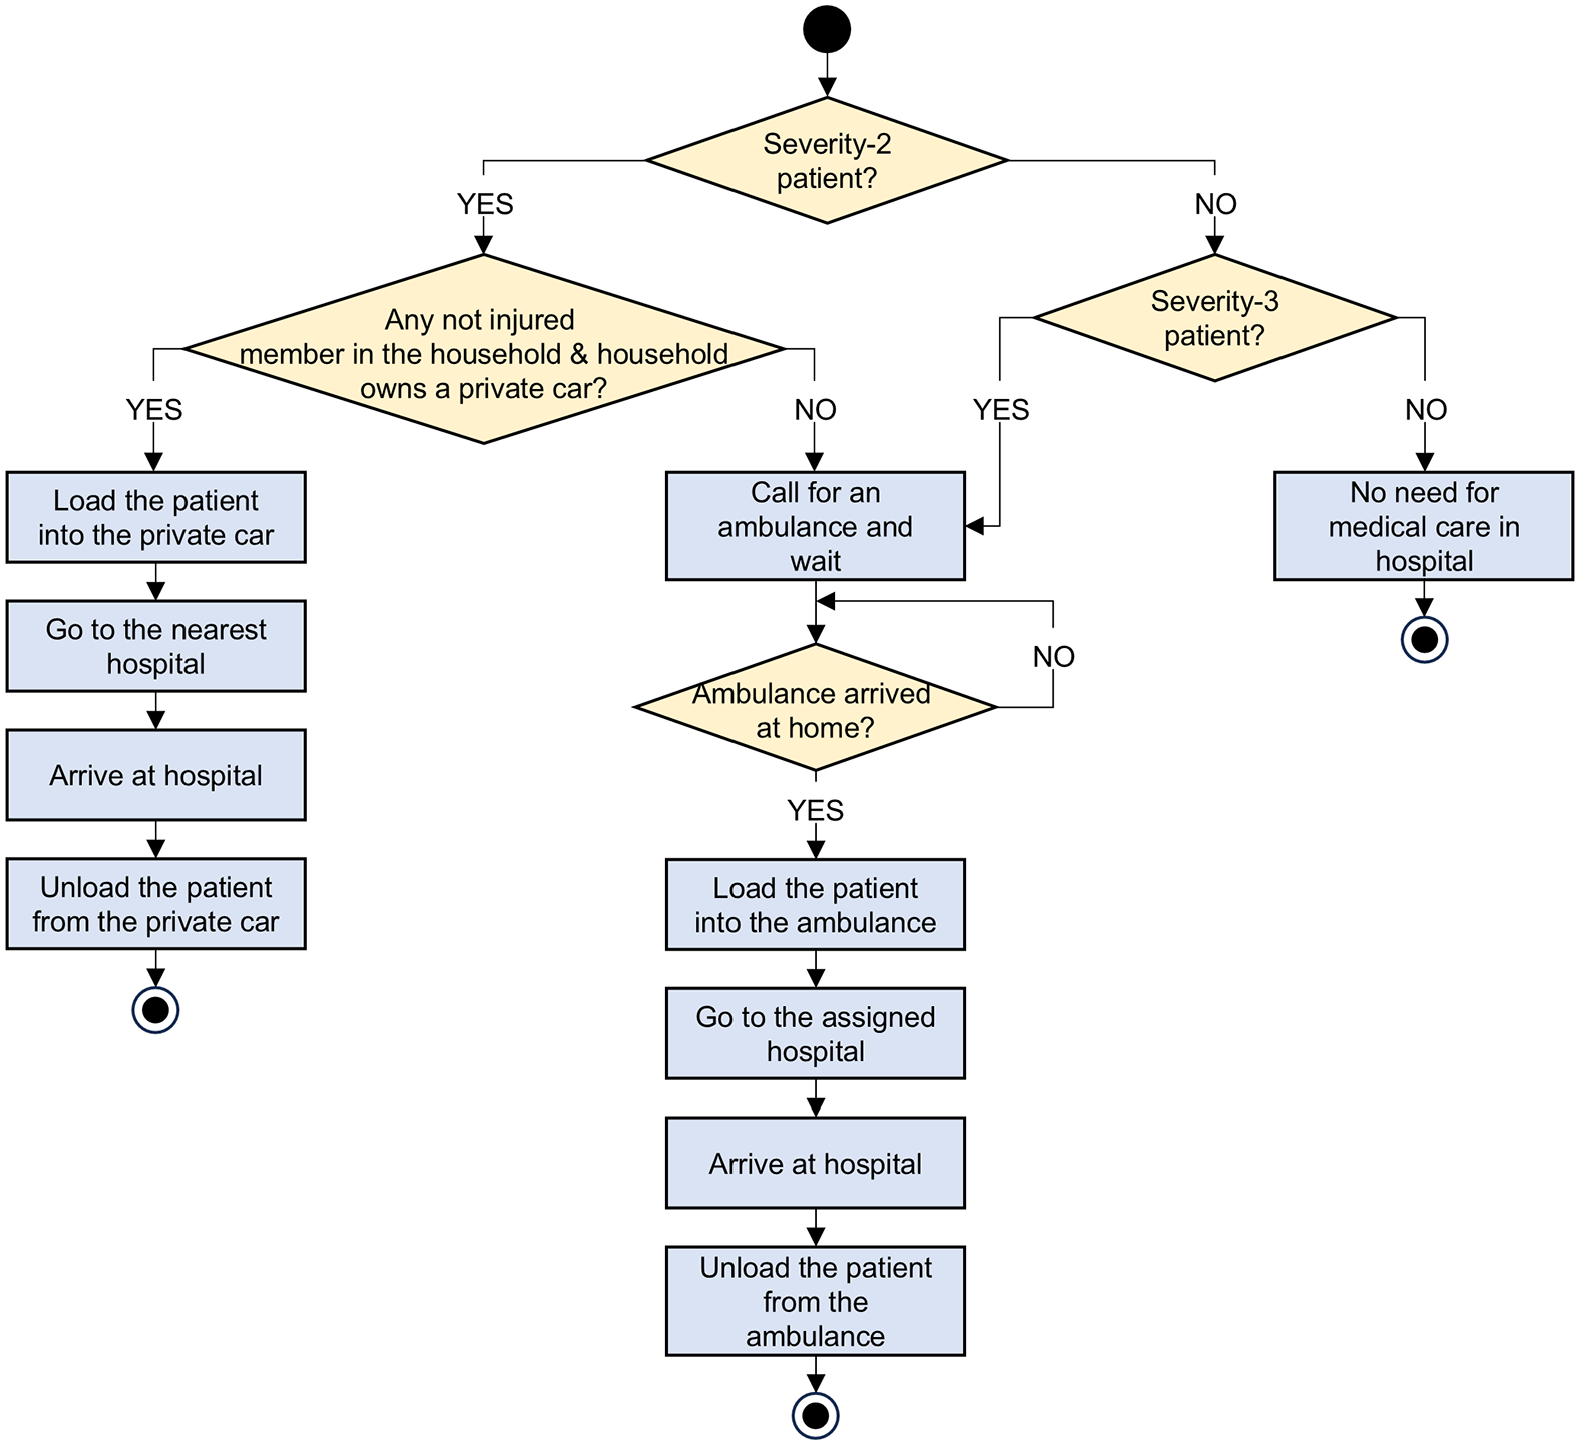
Flowchart of actions defined for the person class.
The actions defined for the ambulance class are summarized in Figure 7. We assume that phone-based triage and coordination for ambulance dispatch are performed efficiently, and the time required for these actions is, therefore, relatively negligible (consistent with the findings of Chen et al., 2024; Colla et al., 2023). We assume that ambulances transport all severity-3 patients first, given their higher priority for medical care over those in severity-2. Both the origin and destination of ambulance trips are the location of the assigned hospital; other dispatch locations are not considered in this study. Ambulances take the shortest route between the hospitals and patients’ homes. The allocation of ambulances is not based on distance from a hospital to a patient’s home; a given ambulance can transport patients from any residence in the city to its assigned hospital. Thus, patients are not necessarily transported to their nearest hospital, which is in line with general healthcare coordination expectations for the region (MINSA, 2021). Although not explicitly modeled in this study, patients can be transported to distant and/or specialized hospitals due to overwhelmed nearby facilities or injury severity prioritization protocols after an earthquake, as evidenced in past events such as the Mw 7.9 2007 Pisco earthquake and the Mw 8.8 2010 Maule earthquake (American Red Cross Multi-Disciplinary Team, 2011; Organización Panamericana de la Salud (OPS), 2010). We assume that each hospital has sufficient capacity (e.g. number of beds) or will allocate additional spaces, if needed, to accommodate patients transported by ambulances and private cars (MINSA, 2021). The time to complete loading and unloading operations from ambulances is modeled based on the work by Battegazzorre et al. (2021). Both times are sampled from a uniform distribution, with 15- and 20-min bounds for loading and 5- and 15-min bounds for unloading. We consider that ambulances work 24 h daily (MINSA, 2023), with no waiting time between ambulance trips. As the road segments contained in the road network are not distinguished between streets and avenues, the allowable travel speed is sampled from a uniform distribution between 30 km/h and 50 km/h, which are the respective speed-limit values for streets and avenues in Lima (MTC, 2021). Since ambulances have no speed restriction, we assume their speed is 50% higher than the allowable travel speed sampled (which is consistent with average ambulance speeds reported by Lupa et al., 2021; Pappinen and Nordquist, 2022). The time to complete loading and unloading operations from private cars is modeled using the same approach as for ambulances. The travel speed for these cars is sampled from the uniform distribution of allowable travel speeds. Furthermore, consistent with other studies focusing on post-earthquake casualty transportation in Lima (e.g. Ceferino et al., 2020b), our analysis does not account for the potential support from additional emergency services such as fire trucks and police, due to the unavailability of relevant public data. (If planned correctly, this extra support could help speed up patient arrivals.)
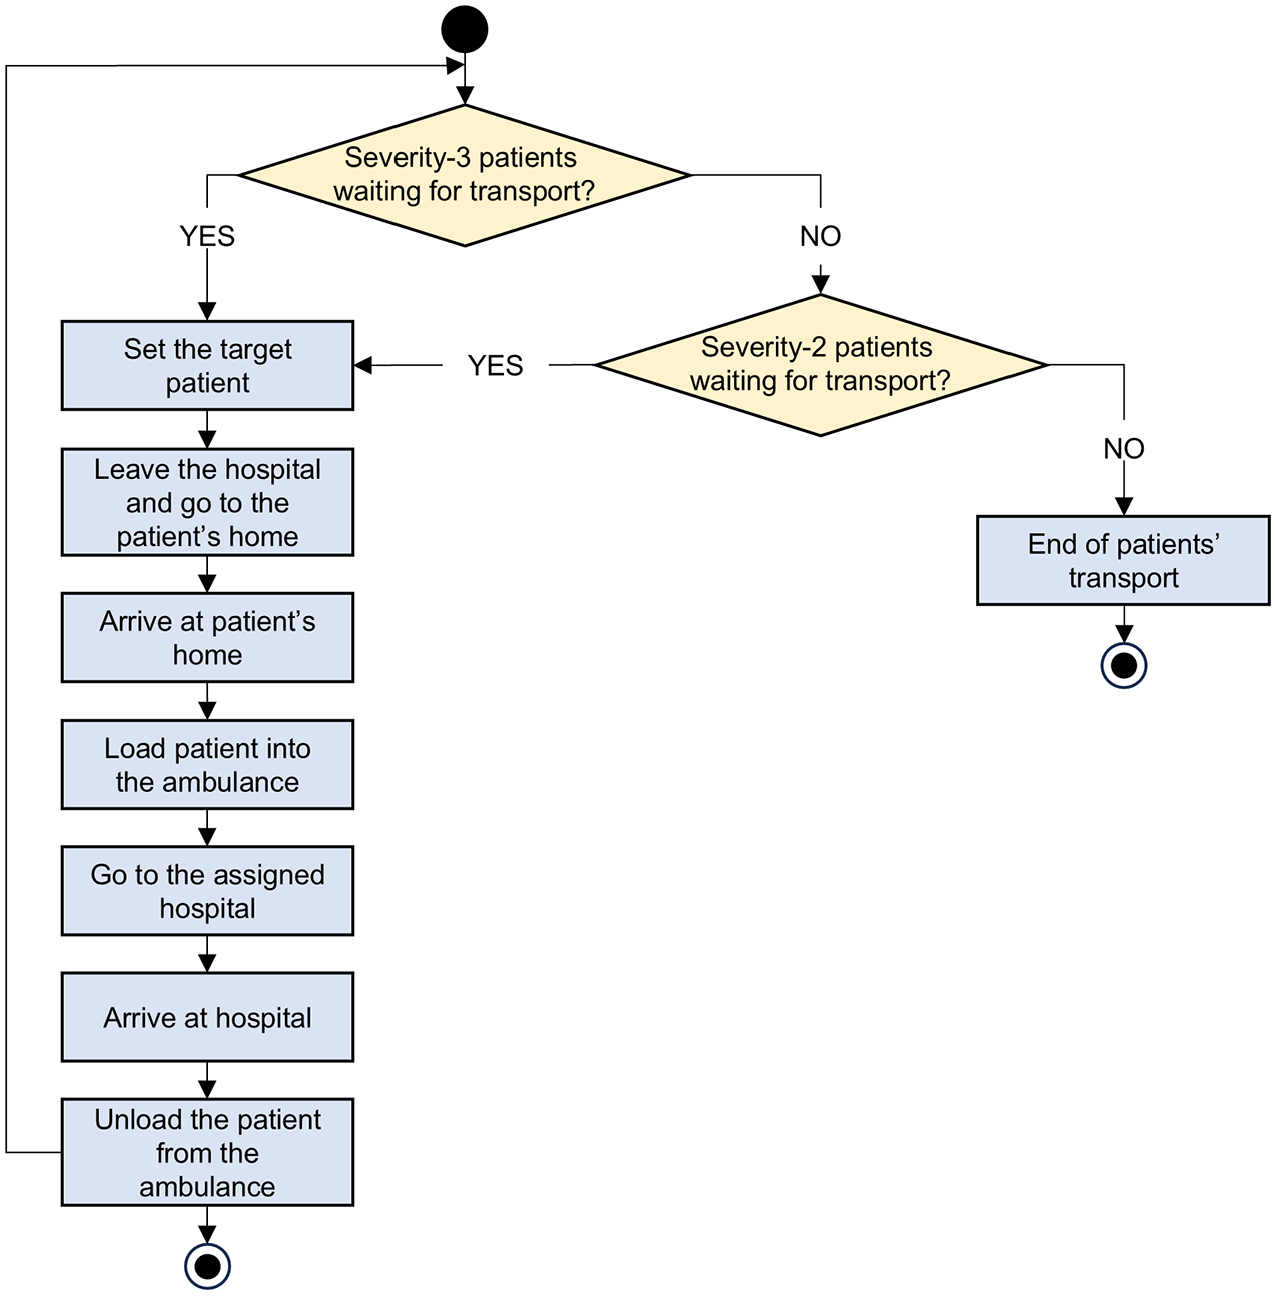
Flowchart of actions defined for the ambulance class.
Results from each run of the ABM are the absolute number of patients who have arrived at hospitals at each post-earthquake temporal instant of interest, which can be disaggregated by district, casualty category, hospital destination, and so on. We translate these absolute values into a relative metric (i.e. the number of patients successfully transported to hospitals relative to the total relevant injured population) because (1) we are simply interested in the extent of successful hospital transportation for casualties, and (2) we are not comparing hospital demand and capacity, which would require absolute numbers to be investigated; this is left to other studies. Each simulation step (or cycle) in the ABM represents 1 min; each run is stopped when all patients are successfully transported to hospital, resulting in varying cycle counts across simulations. We save results every 15 cycles to manage computational resources efficiently. Although extending the duration of cycles could reduce the significant computational demand of these large-scale simulations (see Section “Results” for more context), we neglect this option to preserve the accuracy of agents’ mobility on the road network.
Alternative scenarios
We consider four scenarios for the ABM. The baseline scenario incorporates the details outlined in Sections “Agents classes” and “Behavioral rules (Actions).” This means that it assumes independent household behavior in terms of transporting non-urgent (severity-2) patients and a collaborative hospital response across districts (i.e. sharing ambulances) in terms of transporting urgent (severity-3) patients. Scenarios 2, 3, and 4 introduce modifications to this case, as described below.
Scenario 2 considers more collaborative household behavior (i.e. support between neighbors living in the same building block). In this case, it is assumed that severity-2 patients will be transported to the nearest hospital immediately after the earthquake by people from their block if two conditions are met: (1) there is at least one not-injured person in any household of their block, and (2) they own a private car.
Scenario 3 considers an augmented fleet of ambulances in the area, to evaluate the potential impact of upgraded infrastructural resources. In this case, it is assumed that two ambulances are assigned to each hospital.
Scenario 4 considers a non-collaborative hospital response across districts, that is, that each district exclusively uses hospital ambulances within its jurisdiction. This scenario deviates from the emergency response procedure stipulated by the regional authorities but is designed to explore the potential consequences of unexpected (“extreme”) challenges that could arise. It is assumed that each of the four hospitals in Surco is assigned one ambulance for patient transportation, and the only hospital in San Juan is assigned three ambulances (i.e. each hospital employs its maximum ambulance capacity, based on the work by Santa Cruz et al., 2013). The five hospitals from neighboring districts are assumed not to employ their emergency vehicles within Surco and San Juan but to admit any patients who arrive at these hospitals by their own means. Note that the modifications proposed in Scenarios 2 and 4 result in changes to the flowcharts presented in Figures 6 and 7.
Results and discussion
We conducted the analysis on a Windows workstation equipped with an Intel(R) Xeon(R) W-2195 Processor (18 cores, running at 2.30 GHz) and a RAM capacity of 128 GB. While simulations from the casualty model were not computationally intensive, executing the ABM demanded substantial computational resources. We ran 100 simulations for each scenario of the ABM using the batch mode (i.e. executing multiple simulations in parallel, without a graphical interface) in GAMA. Individual simulations had average durations of 5.4, 1.2, 3.3, and 11.3 h in the baseline scenario and scenarios 2, 3, and 4, respectively. We completed all simulations for each scenario in approximately 46, 9, 25, and 82 h, respectively. Figure 8 provides an example simulation of the ABM, using the graphical user interface (GUI) mode in GAMA.
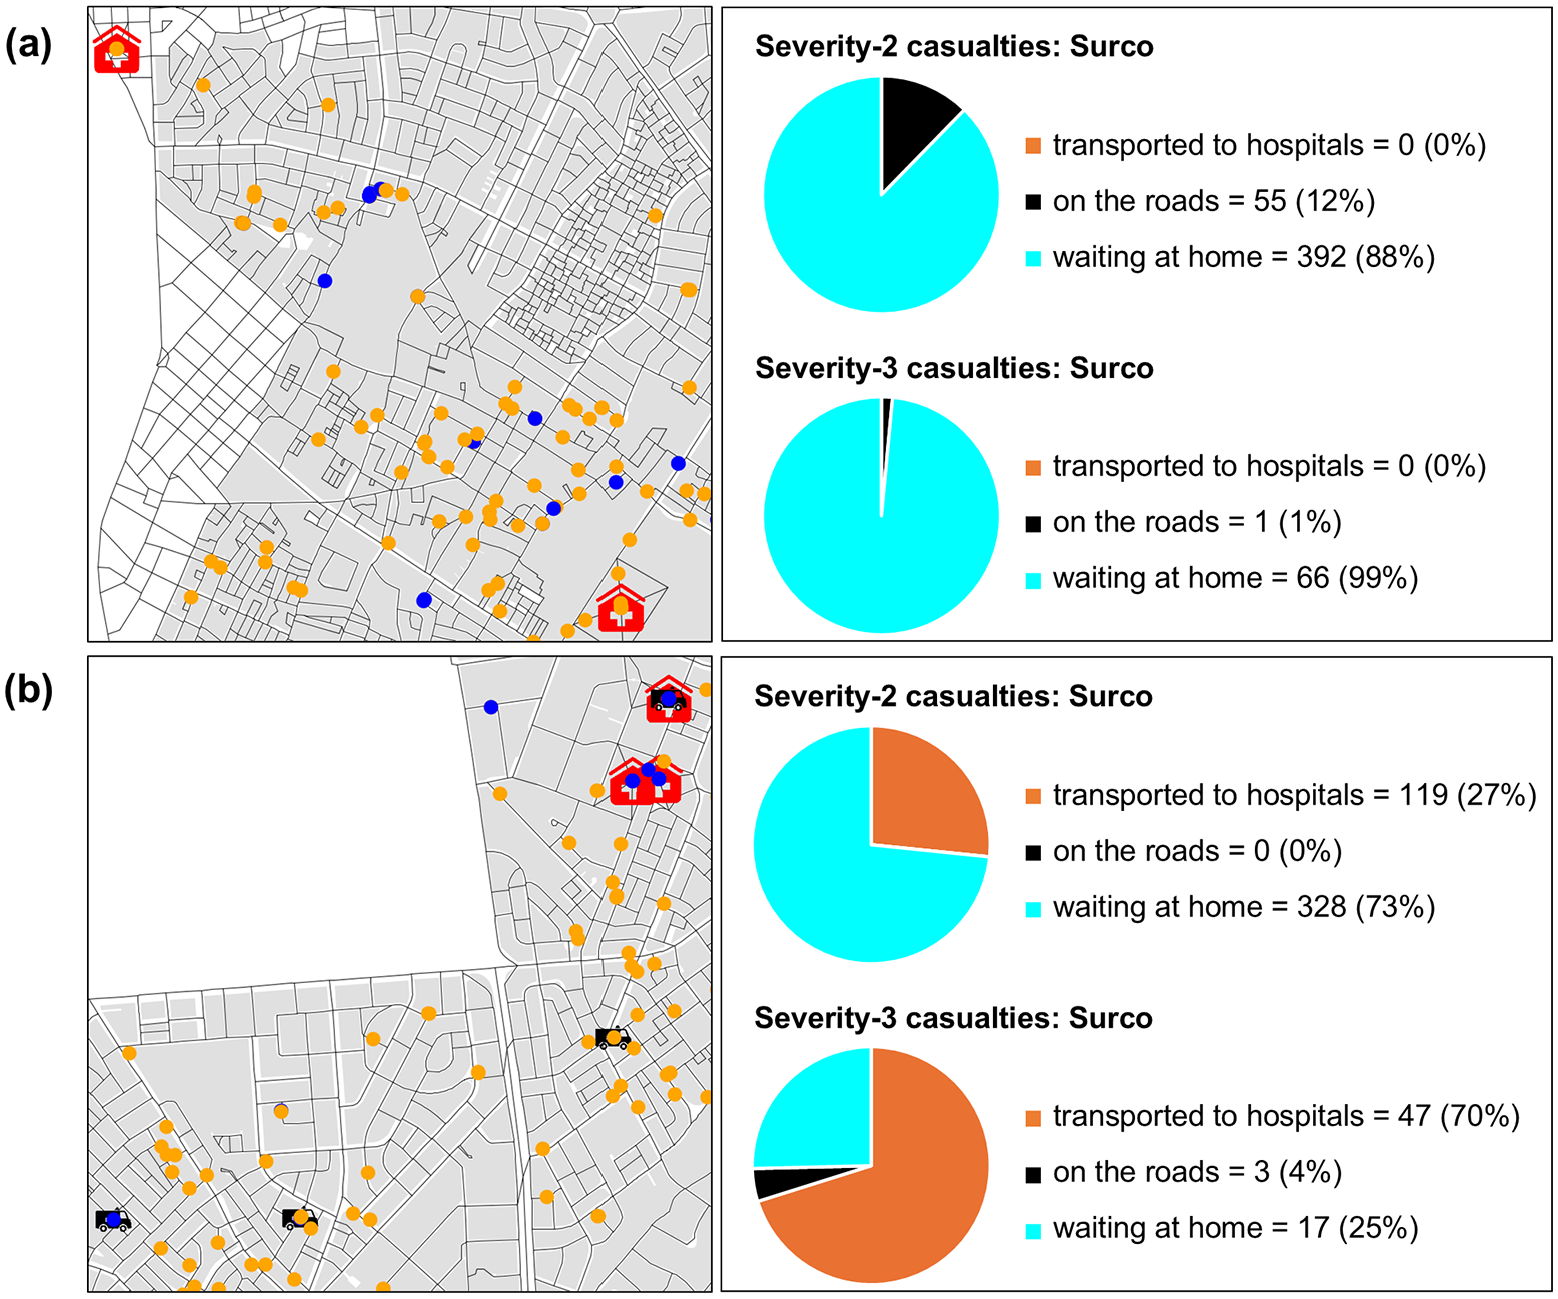
Example simulation of the ABM using the GUI mode in GAMA, with snapshots at temporal instants of (a) 25 min and (b) 16 h, after the earthquake. Left panels show severity-2 (orange) and severity-3 (blue) person agents, ambulance agents, hospitals, and the road network in selected areas of Surco. Right panels display pie charts of patient distributions in Surco, depending on their location.
Building damage
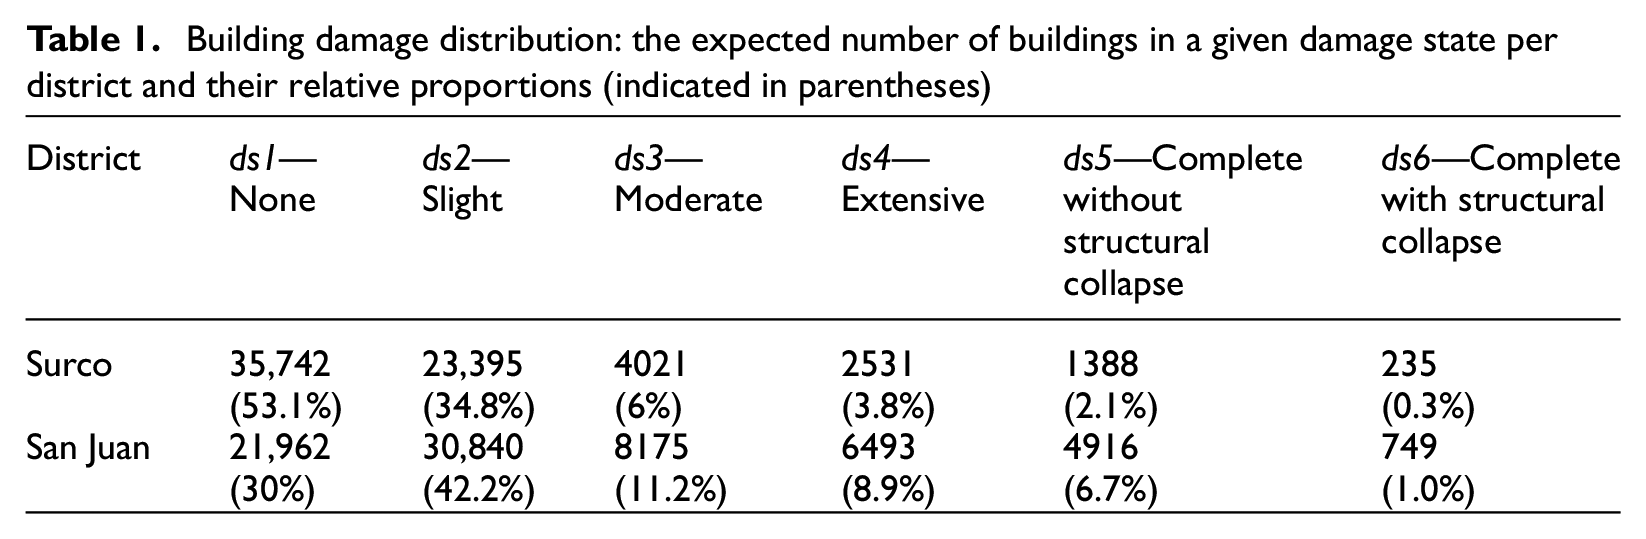
Table 1 presents mean statistics (across all simulations) on the damage distribution per district for the considered earthquake scenario. Comparing the number of buildings across the various damage states helps to understand relative differences in seismic risk between districts. While both districts have a comparable number of buildings (i.e. 67,311 in Surco and 73,135 in San Juan), San Juan has nearly three times the absolute number and relative proportion of buildings in the highest damage states (i.e. extensive, complete without structural collapse, complete with structural collapse) compared to Surco. These states (particularly the “complete” ones) are associated with significant probabilities of casualty occurrence (see Figure 5). The higher seismic risk of San Juan can be attributed to the higher level of ground shaking experienced in the region (see Figure 4) and the greater vulnerability of its building stock. In San Juan, the mean values of PGA, Sa(0.3 s), and Sa(1.0 s) across all locations are 0.41 g, 0.94 g, and 0.41 g, compared to respective values of 0.3 g, 0.61 g, and 0.22 g in Surco. Unreinforced masonry and earth building typologies (which account for most collapses in both districts) represent 50% of the building stock in San Juan, but account for only 35% of the building stock in Surco. These differences reveal an implicit correlation between a population’s income level and the building typologies in which it resides; low-income populations typically live in highly vulnerable buildings (e.g. Mesta et al., 2023).
Building damage distribution: the expected number of buildings in a given damage state per district and their relative proportions (indicated in parentheses)
Casualties
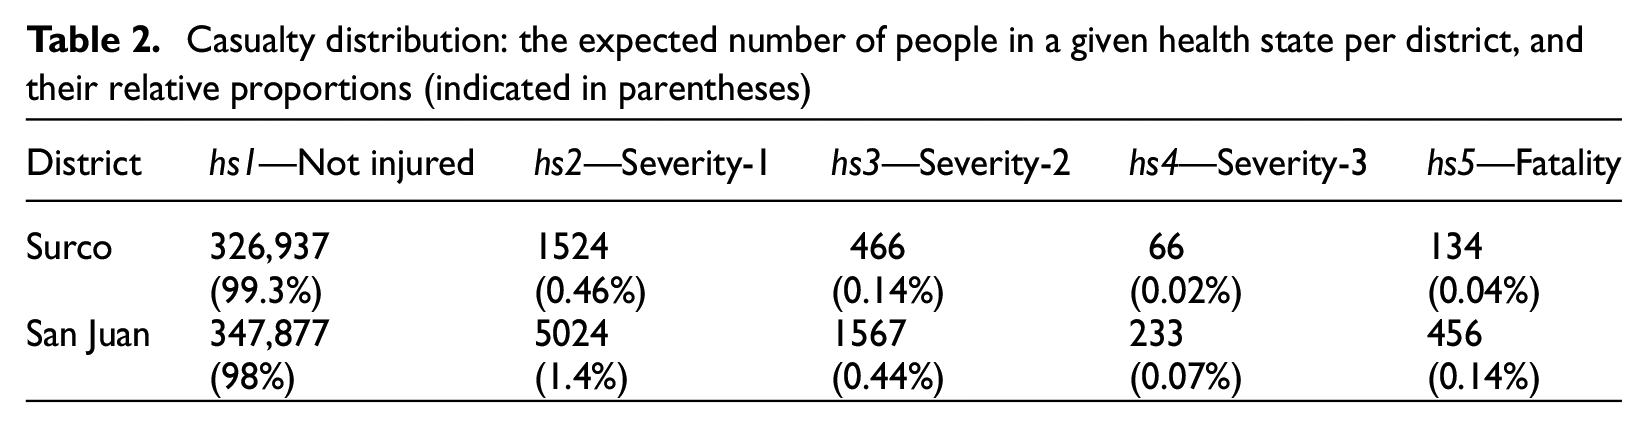
Table 2 provides mean statistics (across all simulations) on the casualty severity distribution per district for the considered earthquake scenario. While both districts have similar populations (i.e. 329,127 in Surco and 355,156 in San Juan), San Juan is associated with more than three times the absolute number and relative proportion of injuries and fatalities compared to Surco, which is consistent with the trends observed for building damage-state distribution. On average, 2032 severity-2 and 299 severity-3 patients require transport to hospitals. Figure 9 presents the spatial distribution of the mean number of severity-2 and severity-3 casualties. As expected, the locations with the highest count of these casualties closely align with the areas experiencing the strongest ground-shaking intensities (see Figure 3).
Casualty distribution: the expected number of people in a given health state per district, and their relative proportions (indicated in parentheses)
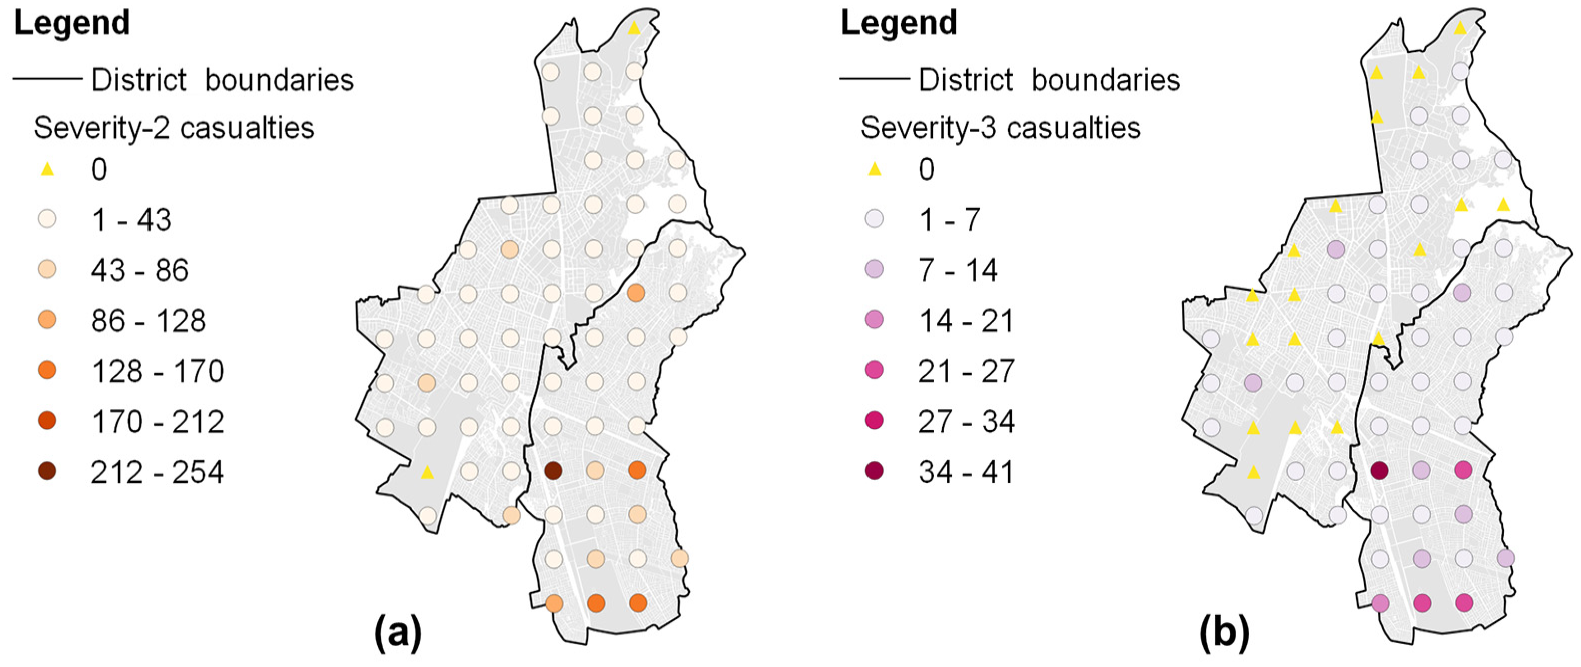
Spatial distribution of mean (a) severity-2 and (b) severity-3 casualty values (per square kilometer).
Patient arrivals in the baseline scenario
The results of this study are intended to be interpreted as the outcomes of a comparative analysis between scenarios, rather than absolute predictions. The arrival times are specific to our context, reflecting typical limitations of disaster risk models. Figure 10a presents the baseline scenario cumulative arrival curves for severity-2 patients, disaggregated by district. It can be seen that varying proportions of these patients (24.4% in Surco and 6.4% in San Juan) are successfully transported in the first 45 min after the earthquake. Many people in Surco reach hospital faster because of the district’s higher car ownership (57%) than those in San Juan (18%) (INEI, 2017), which generally reflects the higher income level of the Surco population. Despite these differences, severity-2 patients from both districts spend similar times going to the nearest hospital by their own means, on average: the mean travel time (including loading/unloading operations) for these patients in Surco is 30.9 min, compared to 32.3 min in San Juan. This is because the proximity of each district to the nearest hospital is not significantly different; it takes an average of 3.4 min on the road network from Surco to the nearest hospital, compared to 4.8 min for San Juan. Thus, the geographical distribution of hospitals within the study area does not exacerbate inequalities in hospital accessibility between the populations of both districts. Following the initial set of severity-2 patient transportation with private cars in the first 45 min, there is a second interval when severity-2 patient arrivals remain unchanged for around 21 h. Following this, ambulances are critical for transporting the remaining severity-2 injured people once they complete the transportation of severity-3 patients. Hospitals remain more accessible to Surco’s non-urgently injured people for approximately 1 week, when the relative difference in accessibility between the districts diminishes. Fifty percent of severity-2 patients in Surco are successfully transported approximately 3.1 days after the earthquake, while this proportion of hospital transportation for the same type of injuries is achieved for San Juan in around 3.9 days. All severity-2 patients are expected to be transported to hospital in 7.7 days.
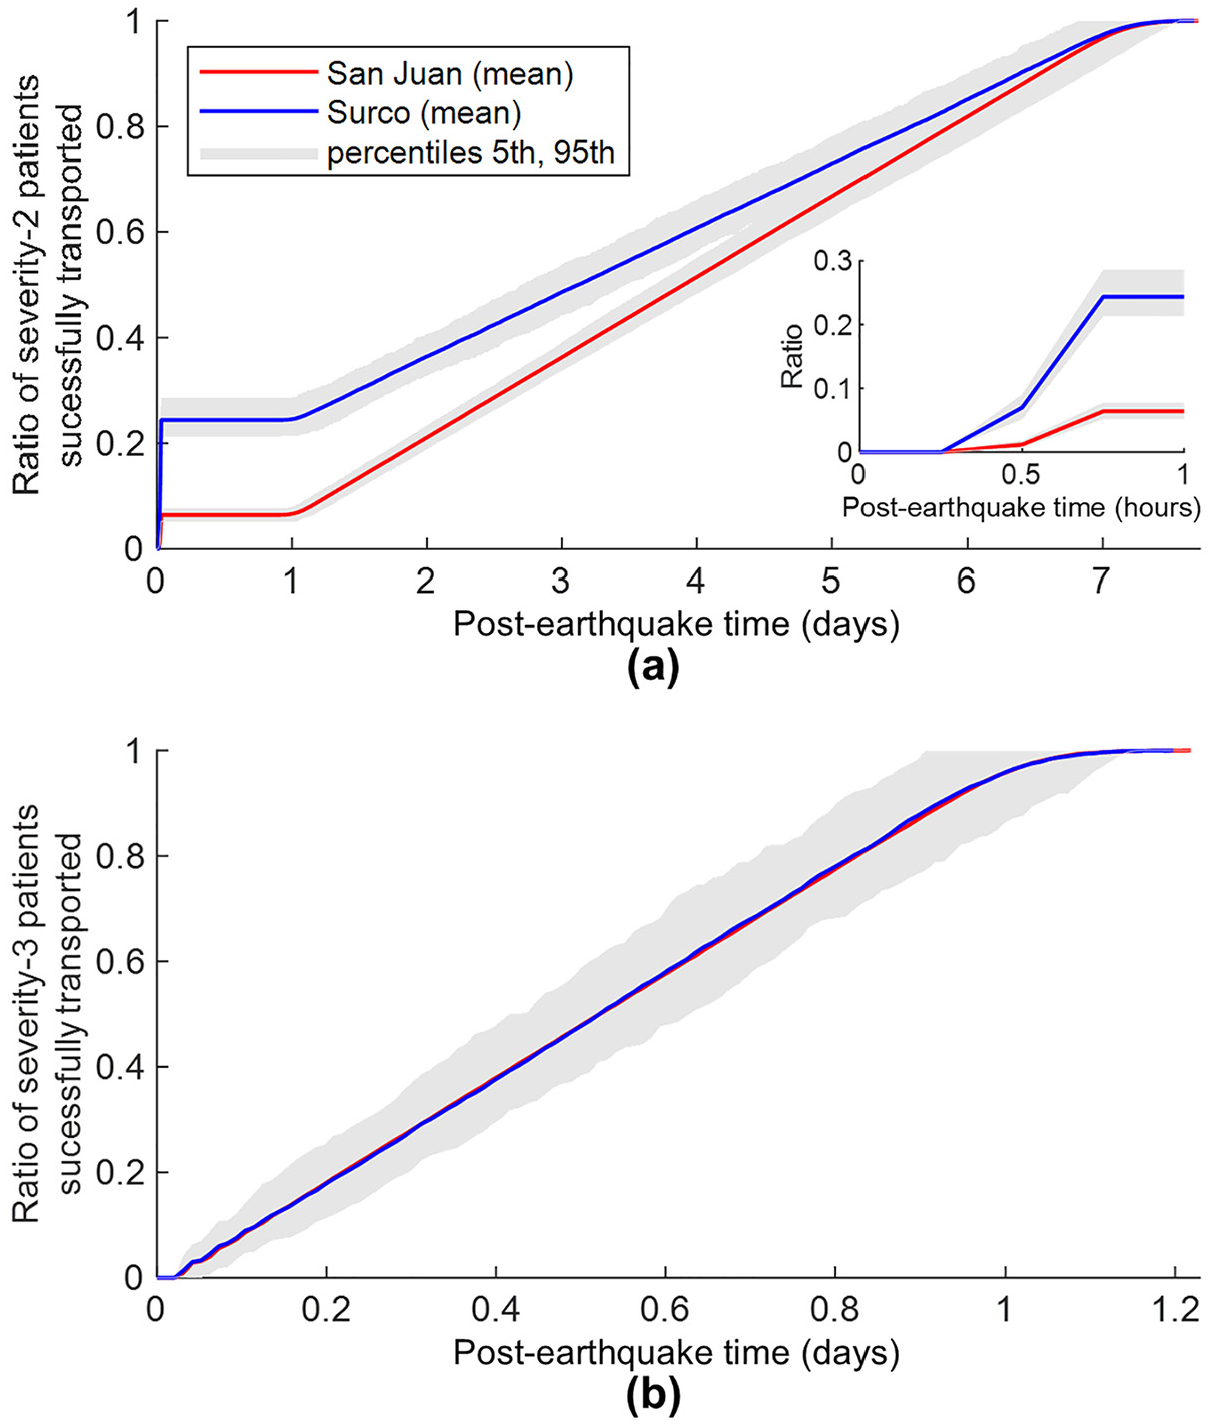
Baseline scenario cumulative arrival curves for (a) severity-2 patients (with inset focused on the first hour after the earthquake) and (b) severity-3 patients.
Figure 10b presents the baseline scenario cumulative arrival curves for severity-3 patients, disaggregated by district. The curves from both districts show almost identical trends over time, which is explained by the fact that ambulances can transport patients from either district to any hospital in the area. Therefore, assuming hospitals respond as a system by sharing their ambulance resources, differences in hospital infrastructure between districts do not influence healthcare accessibility for severity-3 patients. Despite the faster travel speeds of ambulances compared to private cars, the mean travel times for severity-3 patients are slightly higher than those for severity-2 patients transported by private cars: 33.8 min for Surco and 34.8 for San Juan. This is because ambulances generally cover greater distances than private cars that exclusively drive to the nearest hospital. The time that ambulances spend driving on the road network is 6.2 min on average for Surco, compared to 7.4 min for San Juan. The prioritization of ambulance use for mobilizing severity-3 patients and the smaller number of injured people in this health state result in shorter arrival curves for severity-3 patients than those in severity-2. Fifty percent of severity-3 patients in both districts are successfully transported approximately 12.8 h after the earthquake, and 100% are transported around 1.2 days after the earthquake.
Overall, the uncertainty around the mean values reported in the arrival curves is not too large. This can be partially explained by the use of a fully deterministic earthquake scenario. In addition, the relative uncertainty around the mean values gradually decreases over time, as the ratio of patients successfully transported eventually converges to one at the end of all simulations. For example, when time equals 45 min after the earthquake, the 5th and 95th percentile values reported in San Juan’s arrival curve for severity-2 patients are 82% and 121% of the mean values, respectively, but 94% and 106% of the mean values after 6 days.
Patient arrivals in alternative scenarios
Figure 11 presents the Scenario 2 cumulative arrival curves for severity-2 patients, disaggregated by district. Of all severity-2 patients in Surco and San Juan, 99.3% and 96.2% of these patients, respectively, are successfully transported in the first 45 min after the earthquake, representing relative improvements of 307% and 1403% compared to the baseline scenario. All severity-2 patients are expected to be transported in 1.5 days (i.e. 81% less time than in the baseline scenario). Moreover, the uncertainty around the mean values reported in the arrival curves for severity-2 patients is insignificant. For instance, when time equals 45 min after the earthquake, the 5th and 95th percentile values reported in the arrival curves of both districts represent a relative variation of approximately ±2% around the mean values (i.e. many simulations achieve very high ratios—95%—of patients successfully transported at earlier times). Although the modified set of actions considered in this scenario—involving a significant willingness to help others—may be somewhat idealistic (i.e. possibly requiring a heightened sense of risk awareness and some careful neighborhood coordination/planning), the results demonstrate that relatively small individual actions taken at the neighborhood level can greatly benefit the district/overall city. Cumulative arrival curves for severity-3 patients remain the same as in the baseline case, because there are no modifications to ambulance operations in this scenario.
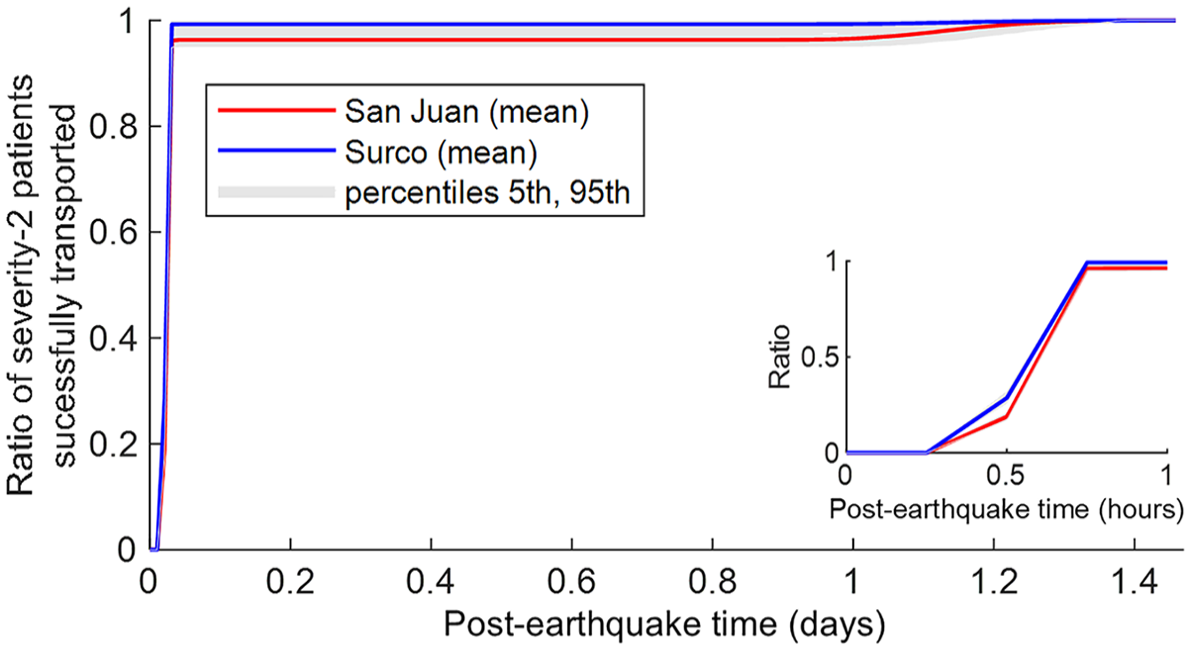
Scenario 2 cumulative arrival curves for severity-2 patients (with inset focused on the first hour after the earthquake).
Figure 12a presents the Scenario 3 cumulative arrival curves for severity-2 patients, disaggregated by district. After the immediate arrival of severity-2 patients by private cars in the first 45 min, the augmented fleet of 18 ambulances operating in the area enables the successful transport of 50% of severity-2 patients in Surco and San Juan in approximately 1.6 and 2.0 days, respectively. Moreover, all severity-2 patients are expected to be transported in 4.0 days. These arrival times are roughly half the corresponding ones estimated in the baseline scenario. Figure 12b presents the Scenario 3 cumulative arrival curves for severity-3 patients, disaggregated by district. The curves from both districts display the same trends over time. Fifty percent of severity-3 patients in both districts are successfully transported approximately 6.8 h after the earthquake (47% less time than in the baseline scenario), and 100% are transported within around 15.5 h (47% less time than in the baseline scenario). Scenario 3 demonstrates that an augmented ambulance fleet can result in comparable benefits for both severity-2 and severity-3 patients. The uncertainty around the mean values reported in the arrival curves follows a similar pattern as observed in the baseline scenario.
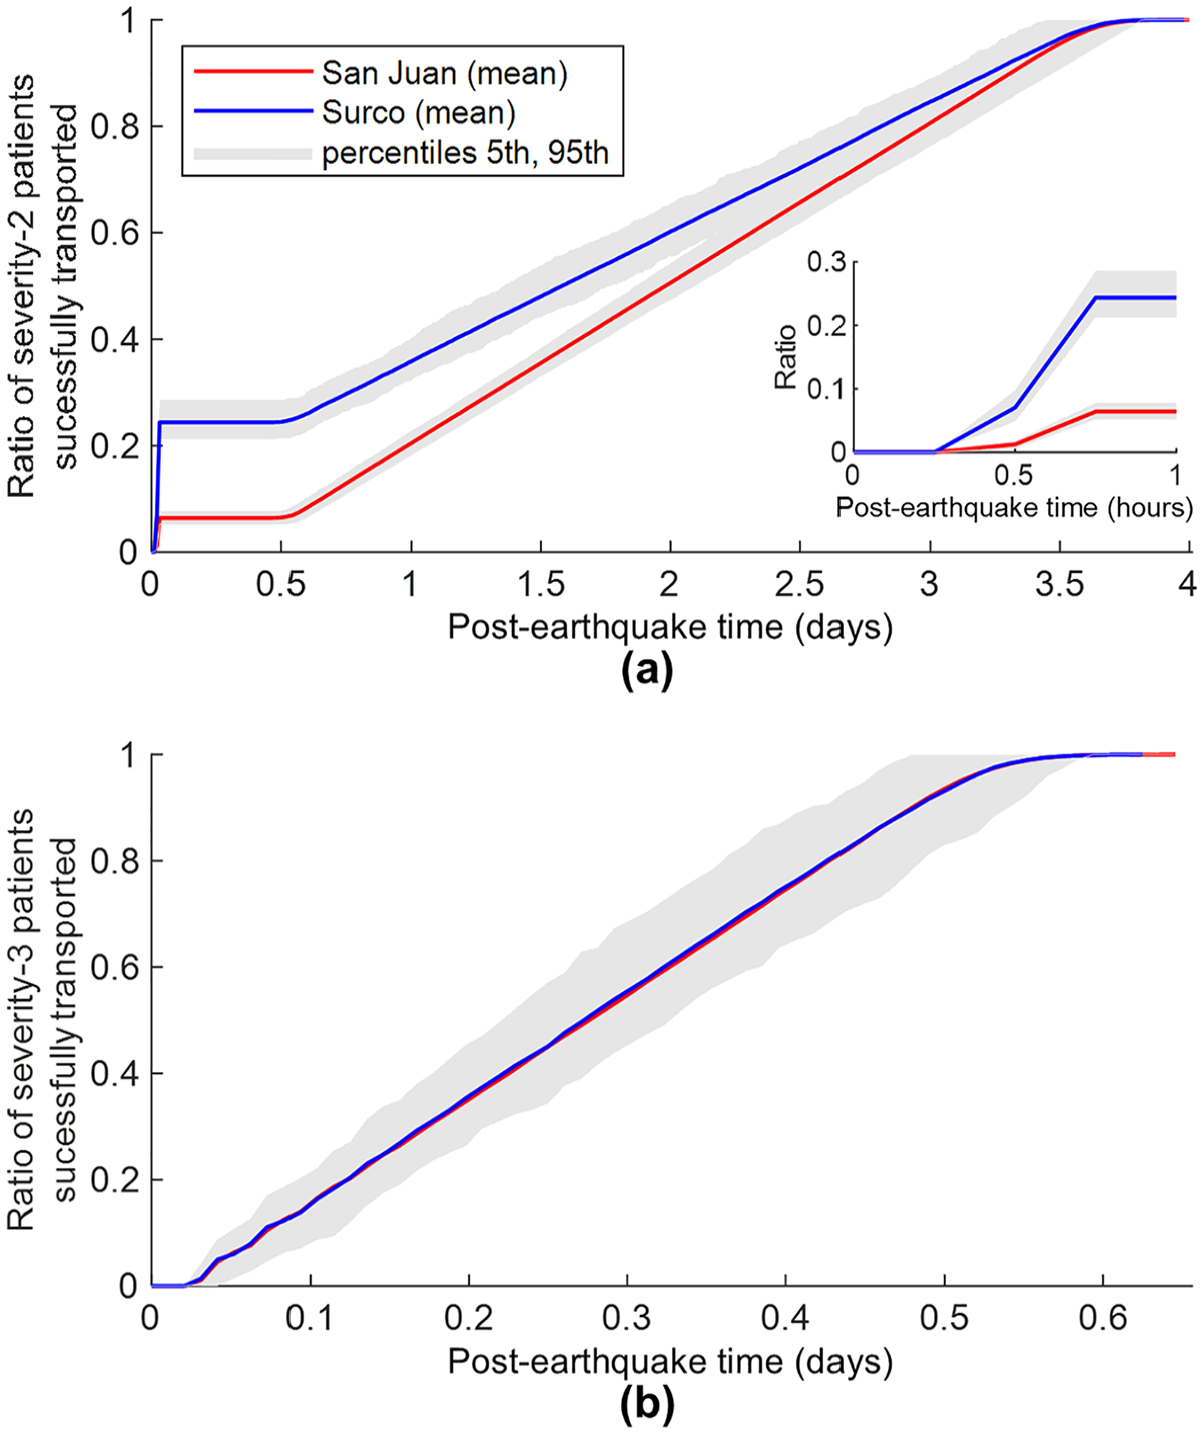
Scenario 3 cumulative arrival curves for (a) severity-2 patients (with inset focused on the first hour) and (b) severity-3 patients.
Figure 13a presents the Scenario 4 cumulative arrival curves for severity-2 patients, disaggregated by district. Allocating four ambulances for exclusively transporting a relatively small number of injured people within the Surco jurisdiction significantly improves timely hospital accessibility in this district compared to the baseline scenario. Conversely, the allocation of three ambulances to transport a considerably higher number of patients within the San Juan jurisdiction decreases hospital accessibility for this district compared to the baseline scenario. After the arrival of severity-2 patients by private cars in the first 45 min, the relative difference in hospital accessibility between the two districts for these injuries increases over time, in contrast with the baseline scenario. Fifty percent of severity-2 patients in Surco are successfully transported approximately 1.3 days after the earthquake (i.e. 58% less time than in the baseline scenario), while the same statistic is achieved for San Juan in around 7.8 days (i.e. 99% more time than in the baseline scenario). All severity-2 patients in Surco are expected to be transported in 3.3 days (i.e. 56% less time than in the baseline scenario). In comparison, the same statistic is achieved for San Juan in 16.1 days (i.e. 109% more time than in the baseline scenario).
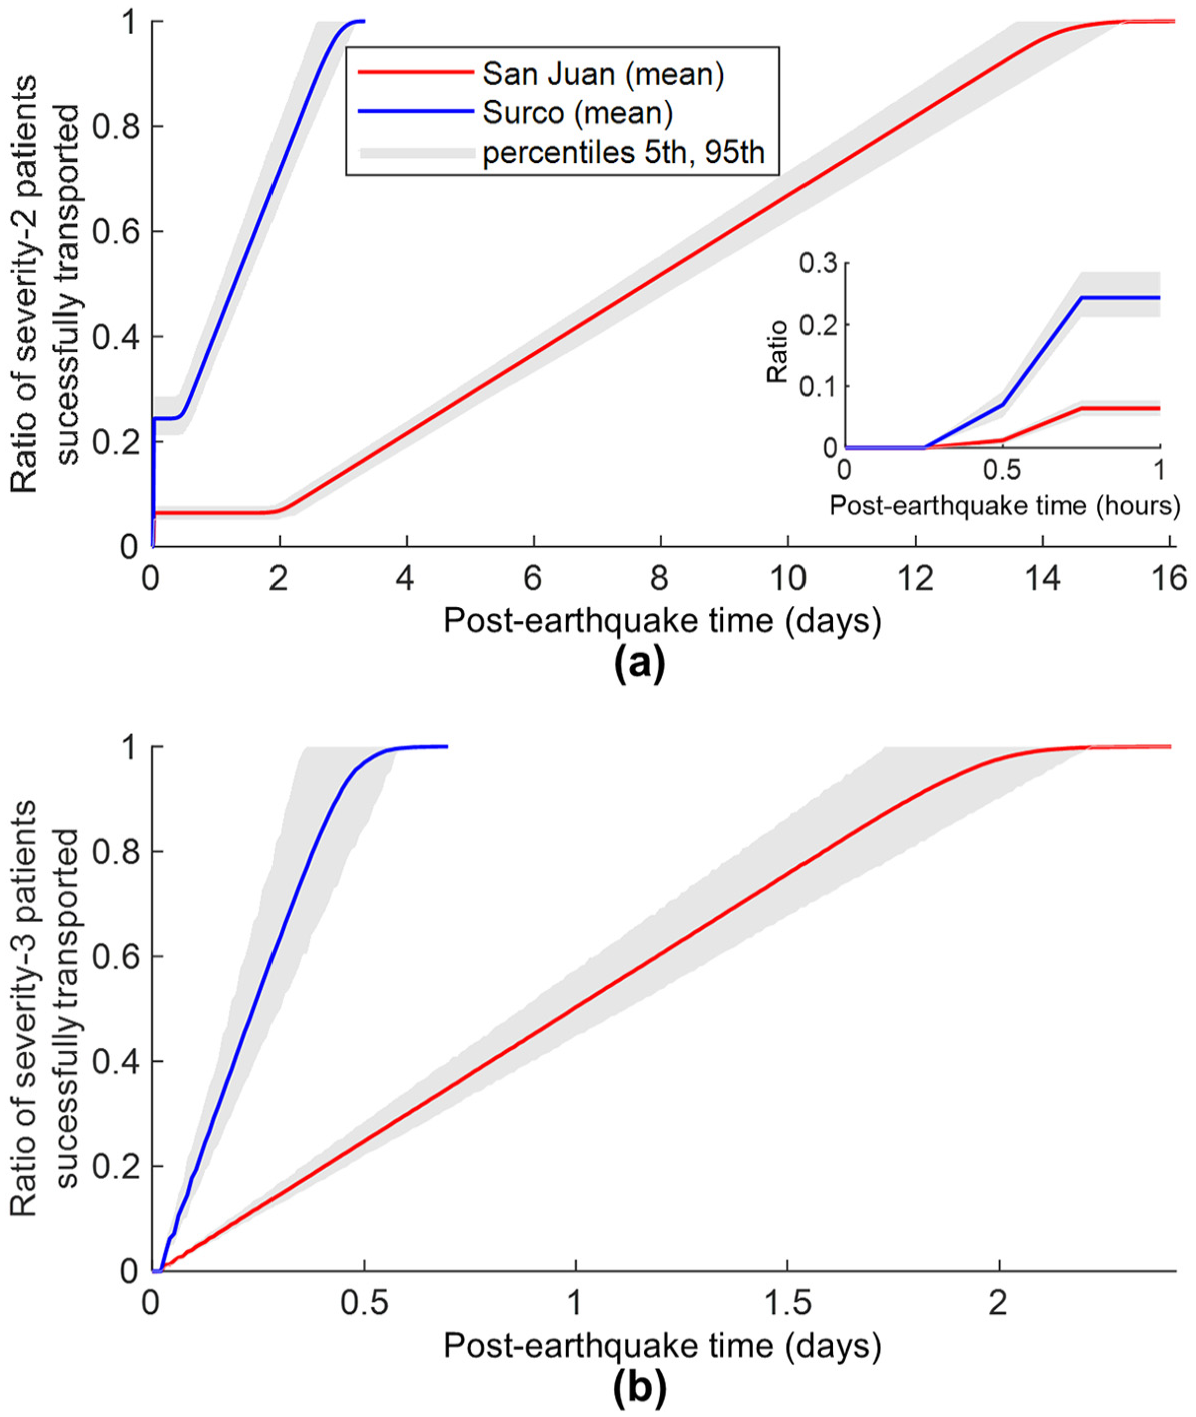
Scenario 4 cumulative arrival curves for (a) severity-2 patients (with inset focused on the first hour after the earthquake) and (b) severity-3 patients.
Figure 13b presents the Scenario 4 cumulative arrival curves for severity-3 patients, disaggregated by district. The relative differences in hospital accessibility between the two districts also increase over time for these injuries. Fifty percent of severity-3 patients in Surco are successfully transported approximately 5.8 h after the earthquake (i.e. 55% less time than in the baseline scenario), while the same statistic is achieved for San Juan in 24 h (i.e. 88% more time than in the baseline scenario). One hundred percent of severity-3 patients in Surco are expected to be transported in 16.8 h (i.e. 42% less time than in the baseline scenario), while the same statistic is achieved for San Juan in 2.4 days (i.e. 97% more time than in the baseline scenario). Overall, the considerably (i.e. up to four times) longer arrival curves for patients in San Juan demonstrate that limited coordination between hospitals can result in inefficient and uneven distribution of resources, at least if notable spatial mismatches between earthquake-induced casualties and medical emergency resources exist. The uncertainty around the mean values reported in the arrival curves follows a similar pattern as observed in the baseline scenario.
Comparison of predicted arrival times to past earthquakes
Figure 14 shows the number (panel a) and the ratio (panel b) of patient arrivals per day in the baseline scenario, for three selected hospitals. These hospitals are approximately centrally located within the study area. Maria Auxiliadora and Las Palmas, respectively situated in San Juan and Surco, are the most accessible (i.e. closest) for people in the study area, achieving the highest first-day number and ratio of patient arrivals among the nine considered hospitals. INCA clinic registers the lowest number of patient arrivals among all hospitals (across all days), due to its location on the periphery of the study area. On the first day after the earthquake, each of these hospitals receives a sudden surge of incoming patients, mainly those of severity-2 that are transported using private cars. From the second day onwards, the hospitals maintain a relatively constant number of patient arrivals, which can be attributed to the continuous transportation of casualties by ambulance. Patient arrivals then gradually decrease, reaching zero just after the seventh day.
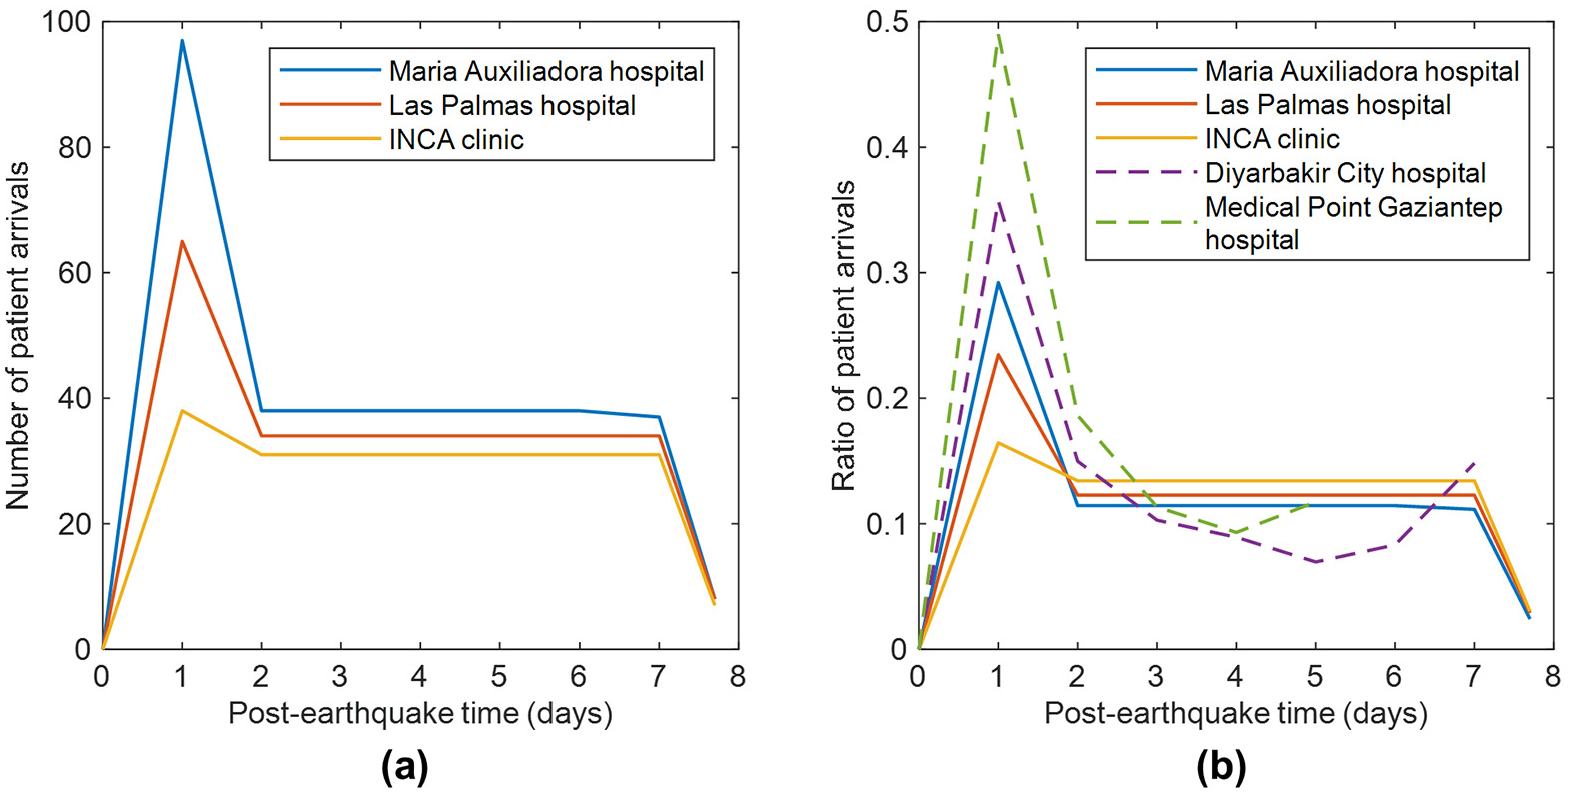
(a) Number and (b) ratio of patient arrivals for three selected hospitals in the baseline scenario. Panel (b) also includes two observations from the 2023 Mw 7.8 and 7.5 Turkey-Syria earthquakes.
Several factors are anticipated to influence the arrival times of injured populations to hospitals after an earthquake, including the intensity of the event and the resulting damage to the built environment, the distribution of casualties, the socio-economic characteristics of the affected population, the distance to healthcare facilities, the efficiency of medical emergency services, and so on. These numerous variables make it challenging to validate the results of this study using observational data of patients’ arrival from past earthquakes. Still, a comparison with statistics recorded from previous events offers valuable additional context to our findings.
The trends of Figure 14 generally align with observations from the recent 2023 Mw 7.8 and 7.5 Turkey-Syria earthquakes (see Figure 14b). There was a notable influx of injured people at hospitals on the first day after these seismic events, followed by a decreased and somewhat stable arrival of patients over subsequent days. Gök et al. (2023) documented the arrival of patients in the emergency department of the Medical Point Gaziantep Hospital, located 30 km from the epicenter of the first earthquake. They reported the number of hospital admissions for the first five days after the earthquakes as 121, 46, 28, 23, and 29 patients, representing a patient arrival distribution of 49%, 19%, 11%, 9%, and 12%. These patients arrived at the hospital by their own means and by ambulances, and were categorized based on triage tags as follows: 25% were green (minimal priority), 50% were yellow (delayed priority), 23% were red (immediate priority), and 2% were black (expectant). For the same disaster, Sarı et al. (2023) documented the arrival of patients to a tertiary medical faculty and a training and research hospital in Diyarbakir city, situated 288 km from the epicenter of the first earthquake. They reported hospital admissions for the first seven days after the disaster as 236, 99, 68, 59, 46, 55, and 98 patients (249 out of these 661 patients were transported to Diyarbakir from other affected cities), representing a patient arrival distribution of 36%, 15%, 10%, 9%, 7%, 8%, and 15%. Eighty percent of these patients were treated in emergency services (37% were rescued from the rubble, 40% sustained injuries while attempting to escape the earthquake, and 3% presented with nontraumatic reasons) and 20% were deceased. The anatomical site of injuries included extremities (66%), trunk (15%), spine (15%), and head (10%). Gaziantep and Diyarbakir are the capital cities of two provinces heavily affected by the earthquakes and are characterized by a dominant presence (> 87%) of reinforced concrete buildings. Similarities between the distributions of patient arrivals in Gaziantep and Diyarbakir and those obtained in our analysis may be attributed to some commonalities between different consolidated urban areas. Gaziantep and Diyarbakir are likely to have comparable capacities to facilitate patient transport as those of San Juan and Surco, in terms of mobility resources (e.g. private cars and ambulances) and transportation infrastructure (e.g. the presence of dense road networks).
In contrast, other authors report that the arrival of injured people to hospitals can extend to weeks after an earthquake under certain circumstances. For instance, Giri et al. (2018) documented the arrival of patients to the Dhulikhel Hospital after the Mw 7.8 Gorkha, Nepal earthquake in 2015, reporting the weekly number of patients admitted in the first 3 weeks as 896, 411, and 442. The authors mention that an overwhelming number of patients arrived at the hospital in the first two days, but the patient registration system did not work adequately. Thus, problems with data recording led to an underestimation of patient arrivals immediately after the event. The authors also indicate that the extended period of high hospital admissions can be attributed to many injured people arriving from rural and mountainous regions of Nepal, where continuous landslides affected transportation and prevented timely access to health facilities. Moreover, the high number of patients still arriving during the third week included injuries resulting from the aftershock that occurred seventeen days after the main event. Xie et al. (2011) describe the arrival of patients at the West China Hospital of Sichuan University after the Mw 8.0 Sichuan earthquake in 2008, stating that the number of inpatients recorded on the first day was 34, which increased to 511 within three days, 983 within 1 week, and 1530 within 2 weeks. The authors attribute the unexpected pattern of inpatient admission to various reasons. First, the areas most affected by the earthquake were primarily mountainous regions, where roads suffered severe damage, making rescue operations particularly difficult. Second, the extensive damage caused by the earthquake, including significant harm to medical institutions and equipment and injuries among medical staff, hindered the prompt mobilization of rescue workers and medical personnel. Finally, the lack of an emergency rescue plan for such a large-scale earthquake made it challenging to optimize the allocation of rescue workers and facilitate the transport of patients after triage.
Sensitivity analysis considering additional hazard scenarios (maps)
We perform a sensitivity analysis, detailed in the Supplemental Material, with two additional hazard scenarios (referred to as “maps”), representing both weaker and stronger ground shaking than that considered previously (i.e. Figure 4). The alternative maps yield very different numbers and locations of casualties compared to the main hazard map (see Tables S6 and S7, Figures S2 and S7 of Supplemental Material). Consequently, the sensitivity analysis focuses on evaluating whether the broader, general trends identified in this study might change. Notably, the cumulative arrival curves for severity-2 and severity-3 patients (see Figures S3, S4, S5, S6, S8, S9, S10, S11 of Supplemental Material) derived from the two additional hazard maps are consistent with those obtained for the main hazard map. These findings further confirm the impact of household car ownership, collective community support, and enhanced resources on the post-earthquake arrival of patients to hospitals.
Conclusions
This study examined the influence of various factors—including healthcare system characteristics and population attributes—on the post-earthquake arrival of patients to hospitals in Lima, Peru, considering a Mw 8.0 earthquake scenario. The investigation coupled a probabilistic regional multi-severity casualty model with an ABM of human behavior to simulate the transport of injured populations from two socio-economically disparate districts (i.e. Surco and San Juan) to hospitals using private cars and ambulances. Our novel ABM allowed us to explore, at fine spatiotemporal resolutions, different strategies that the community and the hospital system could adopt to facilitate patient transportation to hospital.
The key findings of this study are as follows. First, household car ownership leads to the timely arrival of non-urgent patients at hospitals during the first 45 min after an earthquake, overcoming the limitations of restricted ambulance resources. The baseline scenario indicates that only 24% of non-urgent patients in Surco and 6% in San Juan are successfully transported to hospitals within this initial hour. As car ownership is often highly correlated with household income, it does not benefit low-income injured populations as much as higher-income ones. This information is critical for informing the development of policies that aim for equitable post-disaster healthcare accessibility. Second, a cooperative neighborhood-level response that supports non-urgent patients through sharing private cars can significantly improve post-earthquake hospital accessibility. Our analysis indicates that 99% of non-urgent patients in Surco and 96% of these patients in San Juan would be successfully transported in the first 45 min in that case. Local authorities should actively support and promote this collective community effort through disaster preparedness education campaigns, for instance. Third, the number of emergency vehicles available significantly influences both urgent and non-urgent patient arrival times. We demonstrate that doubling the size of the ambulance fleet would almost halve the total arrival times for both types of patients, compared to the baseline scenario. Fourth, a non-collaborative hospital response across districts can lead to inefficient allocations of resources and challenges in mobilizing some earthquake-related patients. Our results indicate that limited coordination between hospitals would considerably increase the total arrival times for urgent (by 109%) and non-urgent patients (by 97%) in San Juan, compared to the baseline scenario. Disaster management plans should, therefore, specifically account for the number of ambulances required and stipulate a coordinated hospital system-patient mobility approach to guarantee an effective and timely post-earthquake emergency response.
Both the findings presented in this article and the results of the sensitivity analysis (included in the Supplemental Material) provide strong evidence that the general trends identified in this study (e.g. the impact of household car ownership, collective community support, and enhanced emergency resources on the post-earthquake arrival of patients to hospital) are not expected to differ significantly from those associated with other earthquake events that could occur in Lima or other cities. Our analysis relies on certain modeling assumptions (e.g. roads remaining fully functional after the earthquake, ambulances being exclusively used for earthquake-induced injuries), which limit its applicability and could be better refined with additional data. For instance, transportation systems often experience disruptions (e.g. temporary road blockages due to damaged bridges and building debris) that impede post-earthquake traffic and increase the travel times to hospitals of injured people. This is a broader limitation of the field, rather than one specific to our study, as reliable modeling of such disruptions remains a significant challenge. This challenge has prompted research devoted to simulating post-earthquake transportation resilience and assessing its impact on the accessibility of emergency facilities and essential resources (e.g. Wu and Chen, 2019, 2023a, 2023b). Another improvement to our study would involve using survey data or similar sources to more precisely capture the variability in human behavior after an earthquake. Individual decisions such as seeking medical assistance, staying at home, or helping others, can be influenced by factors such as household composition and other demographical variables (e.g. Iskandar et al., 2024). In addition, the proposed methodology could be applied to a more extensive study area (e.g. the entire Lima instead of only two districts) to test the effectiveness of more elaborate policies (e.g. the deployment of field hospitals in specific districts, incorporating search and rescue operations) at the regional level, which would entail a higher computational cost. Finally, while we applied the proposed modeling methodology to Lima, we designed it to be globally applicable to help decision-makers plan an effective emergency response to future earthquakes in other geographical contexts.
Supplemental Material
sj-docx-1-eqs-10.1177_87552930251328386 – Supplemental material for Investigating post-earthquake hospital transportation for casualties through agent-based modeling
Supplemental material, sj-docx-1-eqs-10.1177_87552930251328386 for Investigating post-earthquake hospital transportation for casualties through agent-based modeling by Carlos Mesta, Luis Ceferino, Gemma Cremen and Carmine Galasso in Earthquake Spectra
Footnotes
Declaration of conflicting interests
The author(s) declared no potential conflicts of interest with respect to the research, authorship, and/or publication of this article.
Funding
The author(s) disclosed receipt of the following financial support for the research, authorship, and/or publication of this article: Carlos Mesta was supported by a Research Scholarship from the European Center for Training and Research in Earthquake Engineering (EUCENTRE) and funds from the NYU Tandon School of Engineering. Luis Ceferino acknowledges financial support provided by the National Science Foundation (Grant No. CMMI-2332144).
Data and resources
Supplemental material
Supplemental material for this article is available online.
References
Supplementary Material
Please find the following supplemental material available below.
For Open Access articles published under a Creative Commons License, all supplemental material carries the same license as the article it is associated with.
For non-Open Access articles published, all supplemental material carries a non-exclusive license, and permission requests for re-use of supplemental material or any part of supplemental material shall be sent directly to the copyright owner as specified in the copyright notice associated with the article.