
Abstract
This article evaluates how different reinforced concrete (RC) building systems in Türkiye behaved during the extreme 2023 Kahramanmaraş earthquakes. The analysis relies on a comprehensive field survey covering 242 RC buildings across various heavily affected locations. Most surveyed buildings were low- and mid-rise RC moment frames and frame-wall (hybrid) systems, with RC wall construction being less commonly observed. Both RC frame and hybrid buildings exhibited several common deficiencies, resulting in significant structural and non-structural damage due to high drift demands. The performance of RC wall construction varied, with some buildings sustaining severe damage while others remained largely unaffected. An analysis of structural plans revealed that RC wall buildings with adequate wall amounts demonstrated exceptional performance, while those with inadequate amounts of walls experienced severe damage. In addition, fragility analyses using simplified models based on surveyed buildings reinforced these findings. The analyses suggested that RC frame and hybrid systems were insufficient in ensuring life safety during the earthquakes. Conversely, properly designed RC wall buildings are expected to perform well. This alignment between field observations and fragility analyses underscores the reliability of the study’s findings and emphasizes the effectiveness of RC wall construction in mitigating seismic risks and protecting life and property.
Keywords
Introduction
Türkiye was struck by a series of devastating earthquakes on February 6, 2023. The initial seismic event, a Mw7.8 earthquake, occurred in the southeastern part of the country. Nine hours later, a subsequent Mw7.5 earthquake hit an area approximately 80 km north of the epicenter of the initial earthquake (AFAD, 2023; Çetin et al., 2023; ITU, 2023). The resulting devastation was widespread, with significant loss of life and substantial damage to infrastructure and buildings (Ministry of Interior, 2023; Presidency of Strategy and Budget, 2023). Several provinces, including Kahramanmaraş, Hatay, Gaziantep, and others, were severely affected, with hundreds of thousands of buildings reported to have suffered varying degrees of damage or collapse. Analysis of the recorded peak ground acceleration (PGA) and peak ground velocity (PGV) levels, alongside the response spectra in the affected regions, revealed that the code-prescribed design-basis values were exceeded in numerous locations. Moreover, in certain areas, the exceedance extended to the maximum considered earthquake level, as reported by Köroğlu et al., 2024.
In response to the earthquake sequence, the American Concrete Institute (ACI)’s Disaster Reconnaissance Committee (Committee 133) deployed a mission that consisted of nearly 40 people including structural engineers, researchers, and senior engineering students. The aim of the mission is to explore possible general trends between the observed damage, ground motion intensity measures, and overall structural properties (Pujol et al., 2024). The detailed survey encompassed 242 reinforced concrete (RC) buildings across various locations around the ruptured faults. The locations and fault traces of the mentioned major events are shown on the map in Figure 1.
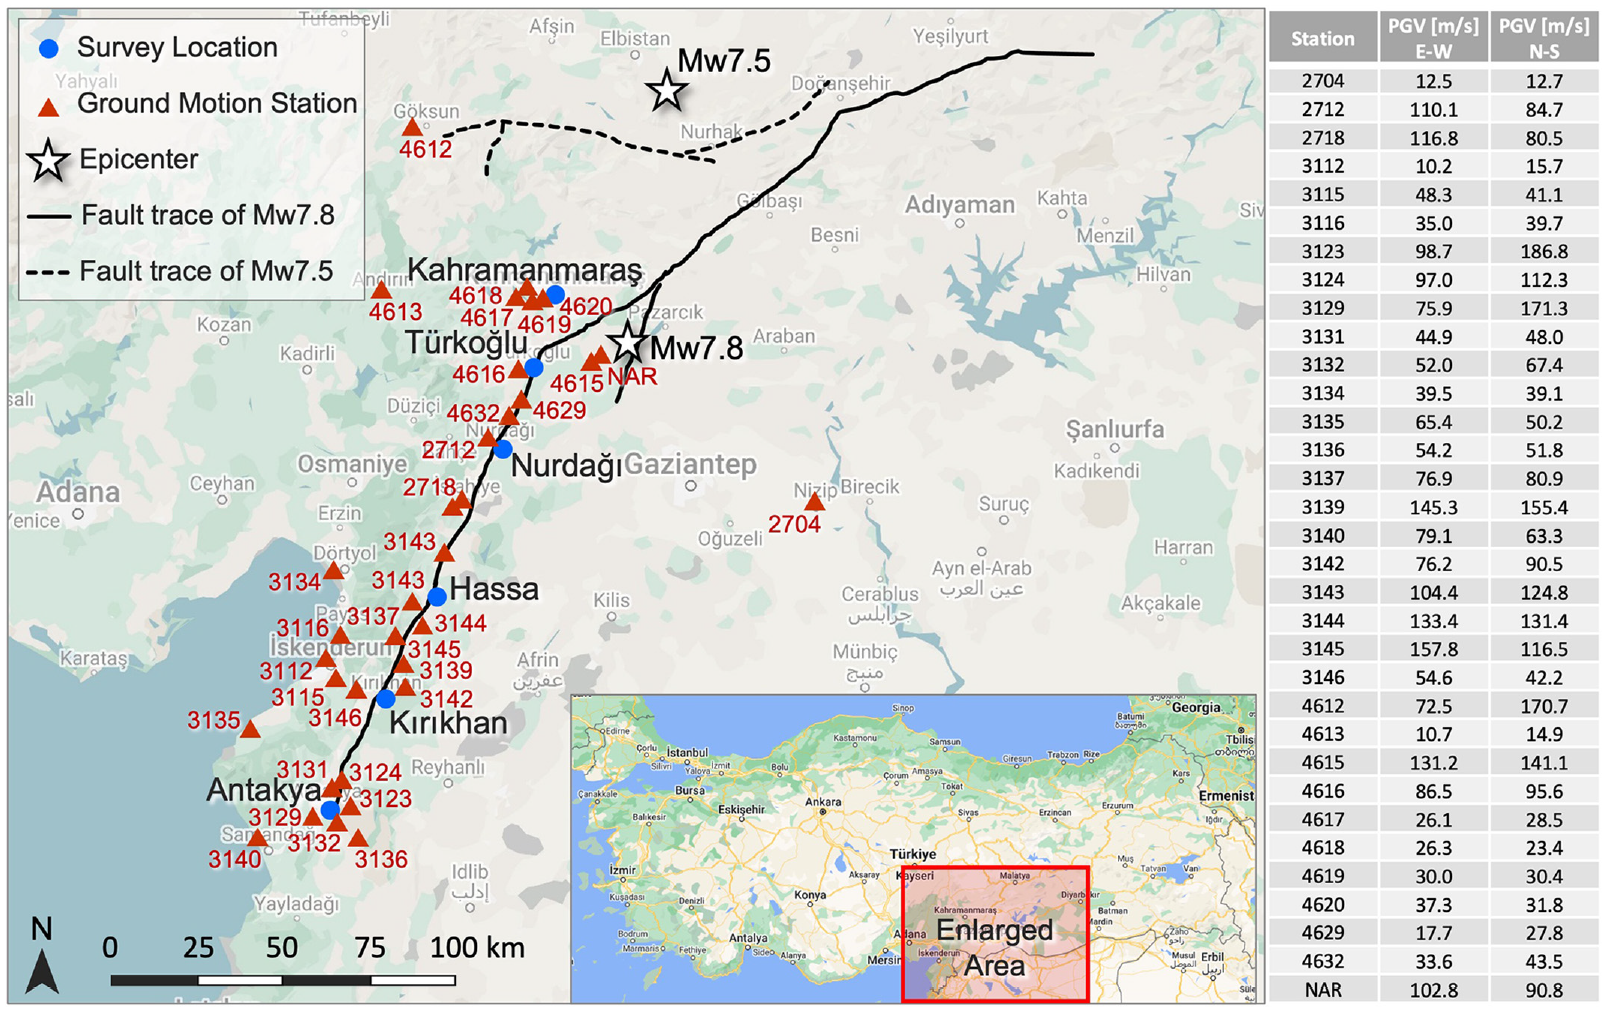
Survey locations, ground motion stations, and fault ruptures.
This article evaluates the observed damage within the context of the structural system type to understand how different systems behaved during these extreme events. The majority of the surveyed buildings was comprised of low- and mid-rise RC moment frames and frame-wall systems. A less frequently observed structural system type in the field was RC wall construction. All buildings had unreinforced brick infill walls, which often sustained damage, even in cases where structural damage was minimal or absent. In many instances, the infill damage was severe, rendering repairs impractical or economically unfeasible due to potentially high replacement costs. Moreover, occupants often perceive buildings with infill damage as unsafe even though structural damage is insignificant (Sucuoglu, 2013). Hence, besides structural damage, the damage to the infill walls is also considered during the evaluations. Since the number of the surveyed buildings was limited, fragility analyses were performed on a large group of equivalent simplified systems to corroborate and generalize the findings derived from the surveyed buildings.
The survey, structural systems, and damage frequencies
A total of 242 buildings were surveyed in the close vicinity of the ruptured faults between March 25, 2023 and April 6, 2023. These buildings were selected based on factors such as accessibility, size, and age. Safety concerns prevented the survey of collapsed or some heavily damaged structures, while undamaged buildings were mostly inaccessible due to occupancy during the survey period. The reconnaissance teams collected comprehensive data from the inspected buildings including height, age, cross-sectional dimensions of vertical elements (columns, structural walls, and non-structural walls), damage classification, irregularities, floor plan dimensions, and photographs documenting observed damages in their structural and non-structural elements. The 95% of the surveyed buildings were higher than five stories, and eight stories in average.
Determining the age of the buildings involved various methods, such as obtaining structural plans or referencing construction dates from building nameplates. Regenerating structural plans or acquiring them from official institutions provided clear insights into the building. All the surveyed buildings considered in this study were constructed after 2000, reflecting the major changes made in seismic provisions with the 1998 Turkish Seismic Design Regulation (Turkish Ministry of Construction and Settlement, 1998). Therefore, the surveyed building stock represents the relatively new construction regulations, contemporary approaches to seismic design, and modern construction practices. However, despite these advancements, various deficiencies were observed in the surveyed buildings, which will be elaborated on throughout the following section.
Structural damage to the building was classified into several levels during the survey. These classifications included “None,” indicating no visible structural damage; “Light,” characterized by hairline cracks to the beams, structural walls, and columns; “Moderate,” involving instances of cover spalling or wider cracks to structural elements; and “Severe,” indicating more significant damage such as bar buckling, concrete core crushing, or bond-splitting failure in any structural member. Buildings identified by the survey team as vulnerable to potential collapse in an aftershock due to widespread severe damage were labeled as “Critically” damaged buildings. Furthermore, buildings with the complete loss of elevation of one or several floors are categorized as “Collapsed” (Pujol et al., 2024). To ensure consistency in damage classification, the criteria were introduced to all team members before the survey commenced. Uncertainties or exceptional cases were discussed during team meetings, with all team members present, to arrive at a final decision based on the established criteria and engineering judgment after thorough discussions and a voting process.
Figure 2 shows the distribution of structural system types and the damage states (DS) of the surveyed buildings. Structural system classification was based on the lateral load resisting system utilized. Buildings categorized as “RC wall” systems rely on structural walls to meet seismic demands, whereas “RC frame” buildings either lack structural walls or do not have any shear walls at least in one direction. The category “RC hybrid” encompasses structures with both columns and shear walls serving as the lateral load resisting system. Another structural system called “Asmolen” in Turkish practice, consisting of RC frames with shallow beams (wider and shorter beams than regular beams) and joists were not addressed in this article due to the need for further assessment with a detailed analysis. The RC hybrid system was the dominant structural system observed, comprising 64% of the surveyed buildings. On the other hand, RC wall construction accounted for 7% of the surveyed buildings. More information regarding the ACI reconnaissance is provided by Pujol et al. (2024) and the survey data are open to the public for those who are interested in the survey and can be reached via the following link: https://www.dropbox.com/sh/6cmdgdn82n9ufxr/AACt-1rberSKM4fFFaDeL3_5a?dl=0. As seen from Figure 2, majority of the surveyed buildings were severely damaged. Given the extreme intensity of the earthquakes at the survey locations, the surveyed buildings exhibited ductility to some extent and fulfilled the life safety performance objective of the current seismic design code.
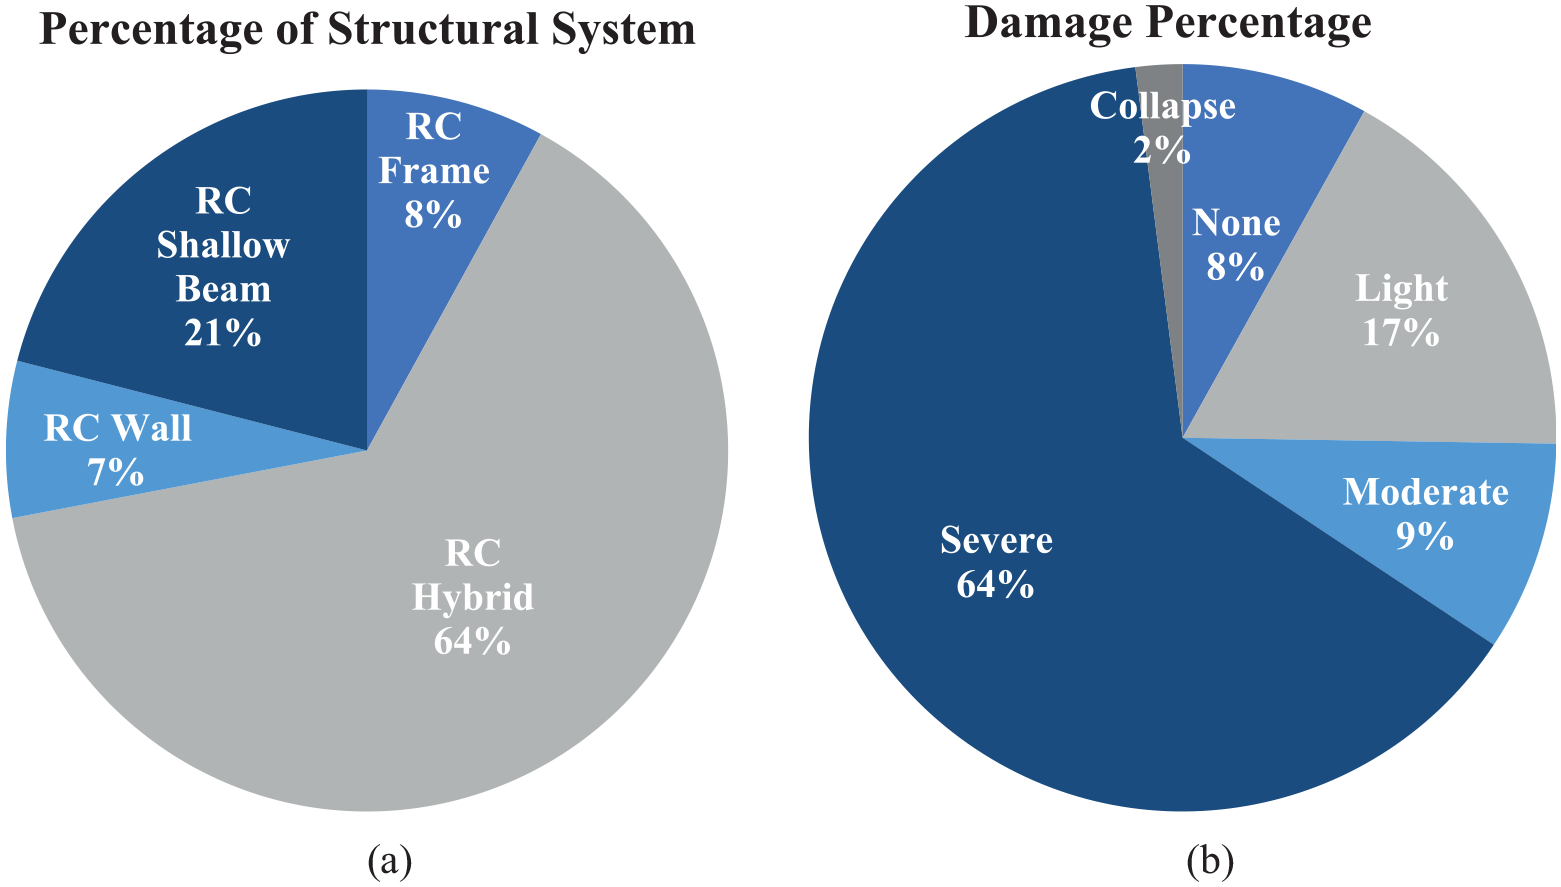
Percentage of surveyed buildings according to structural system and damage state.
Typical deficiencies and damage types for structural systems
RC frame and RC hybrid system
RC frame and RC hybrid systems emerge as the prevailing structural options for residential buildings in Türkiye. These systems typically feature unreinforced brick infill walls, along with either RC or masonry walls encasing the elevator shafts. Approximately, 70% of the observed buildings were RC frames and RC hybrid systems. The most common deficiencies encountered in these systems include irregular column alignments and beam grids (Figure 3). Irregular floor plans, where columns do not align in straight lines, often occur due to architectural or practical concerns. This leads to interrupted beam lines and beams framing into other beams instead of a vertical structural member. Figure 4 illustrates that indirect beam-to-beam support may lead to significant shear damage on the beam when the connection is positioned too closely to the vertical element, resulting in a short beam effect on the section of the beam between the support and the vertical element. These structural grid irregularities reduce the overall stiffness of the structures, rendering them more vulnerable to earthquake damage (Gemici Yormaz, 2019).
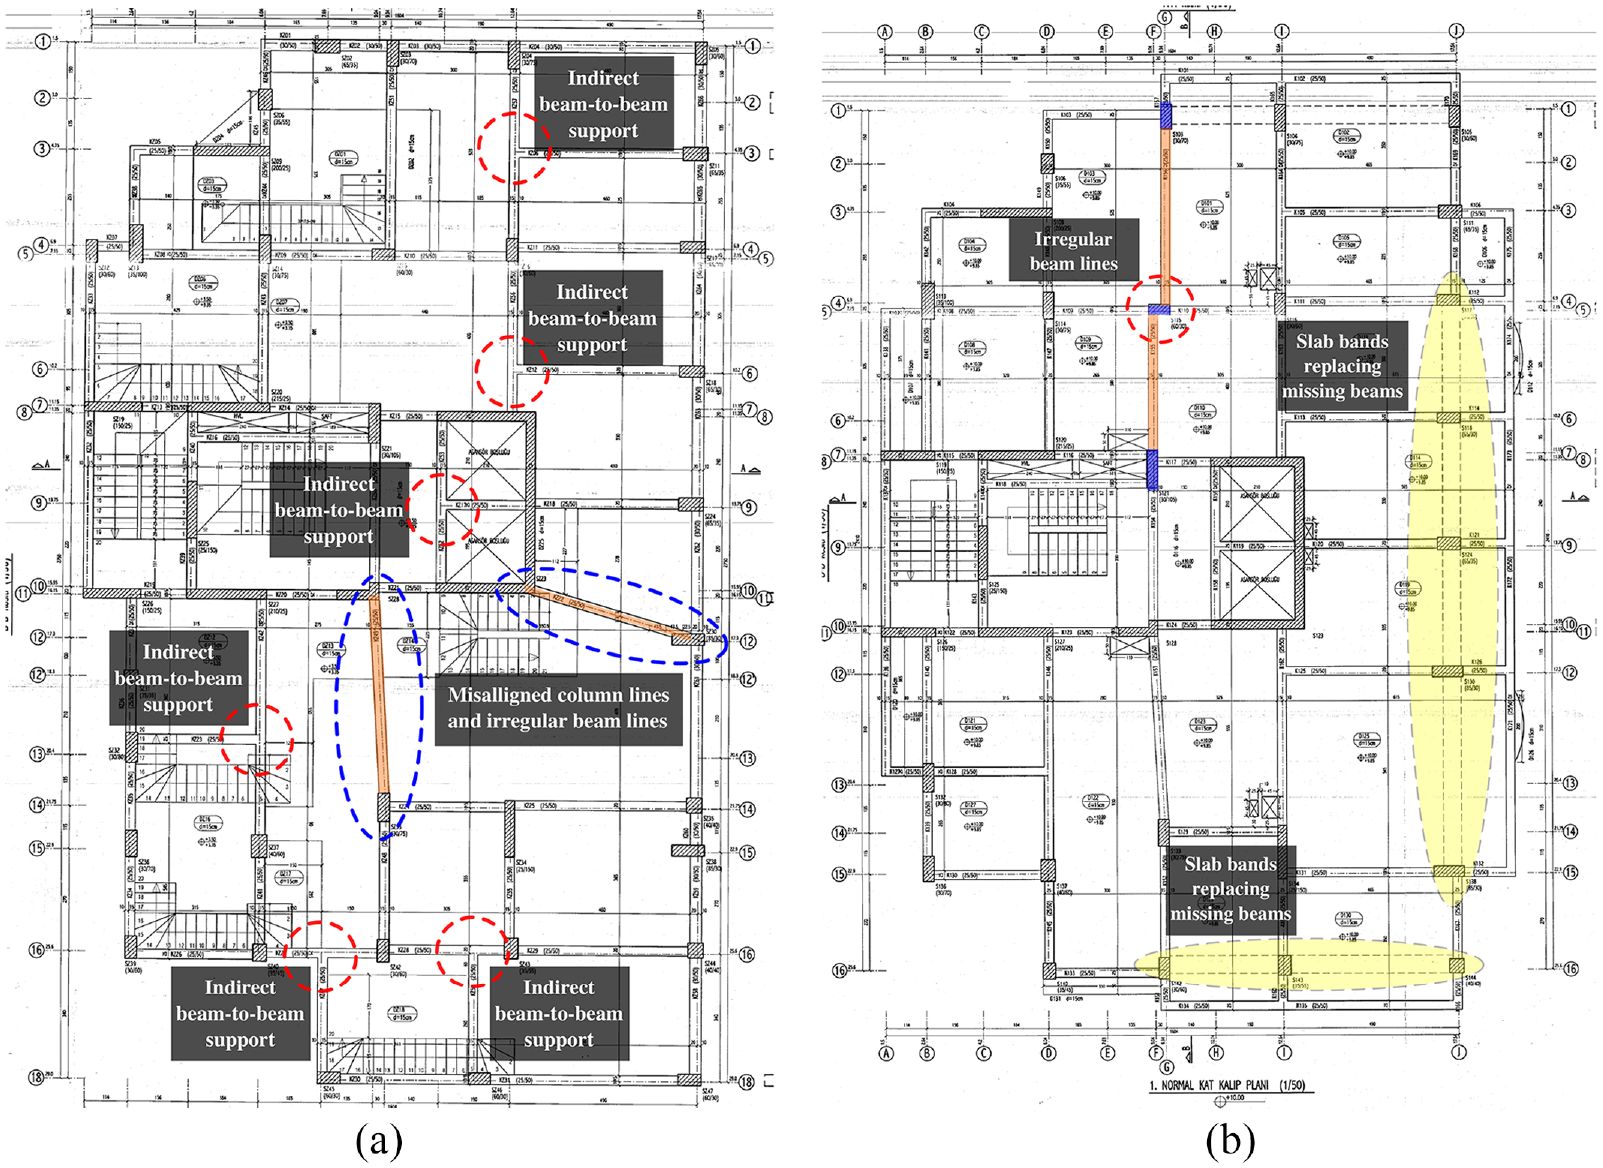
Floor plans of one of the surveyed buildings in Kahramanmaraş: (a) ground floor; and (b) first floor.
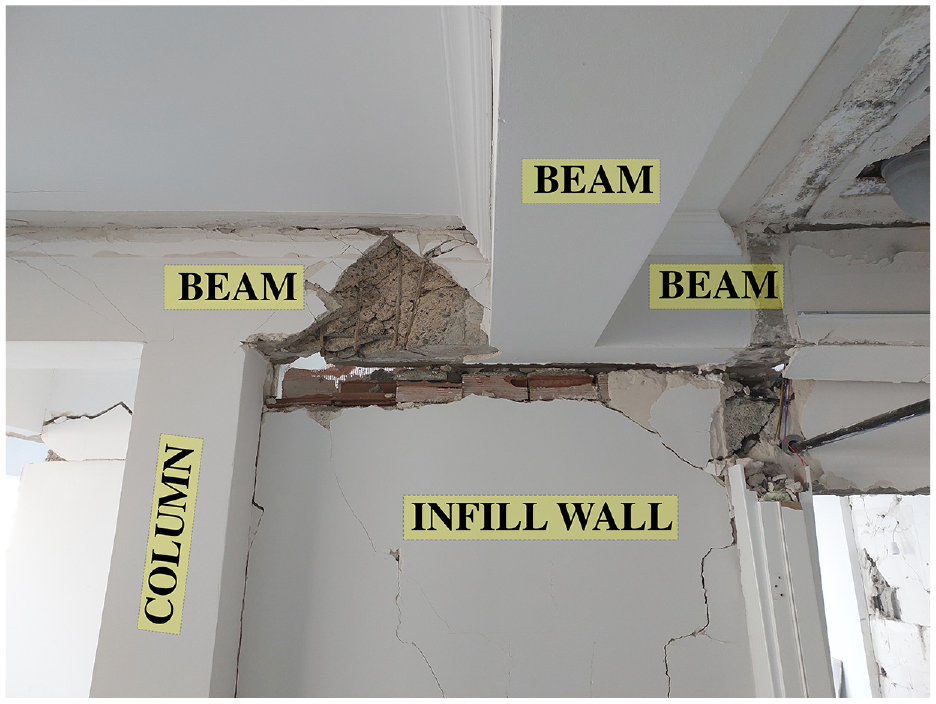
Example of an indirect beam-to-beam support (beam framing into another beam).
Another frequently observed practice involves introducing an offset between the longitudinal axes of connecting beams and columns. Along building perimeters, these offsets are introduced to align the exterior faces of beams and columns. Furthermore, beams are typically attached to the edges of columns in the column’s weaker direction, as shown in Figure 5. In both cases, the axes of columns and beams are forced to be misaligned resulting in torsional moments and substantial damage to both the column and the beam connected in the column’s stronger direction. Figure 5c and d illustrates heavy shear that ruptured the edge of the column, while the rest of the column face remains unaffected, implying that the only resisting part of the vertical elements is usually where they meet the beams. Employing more square-shaped cross-sections for columns would prevent such behavior under extreme loading.
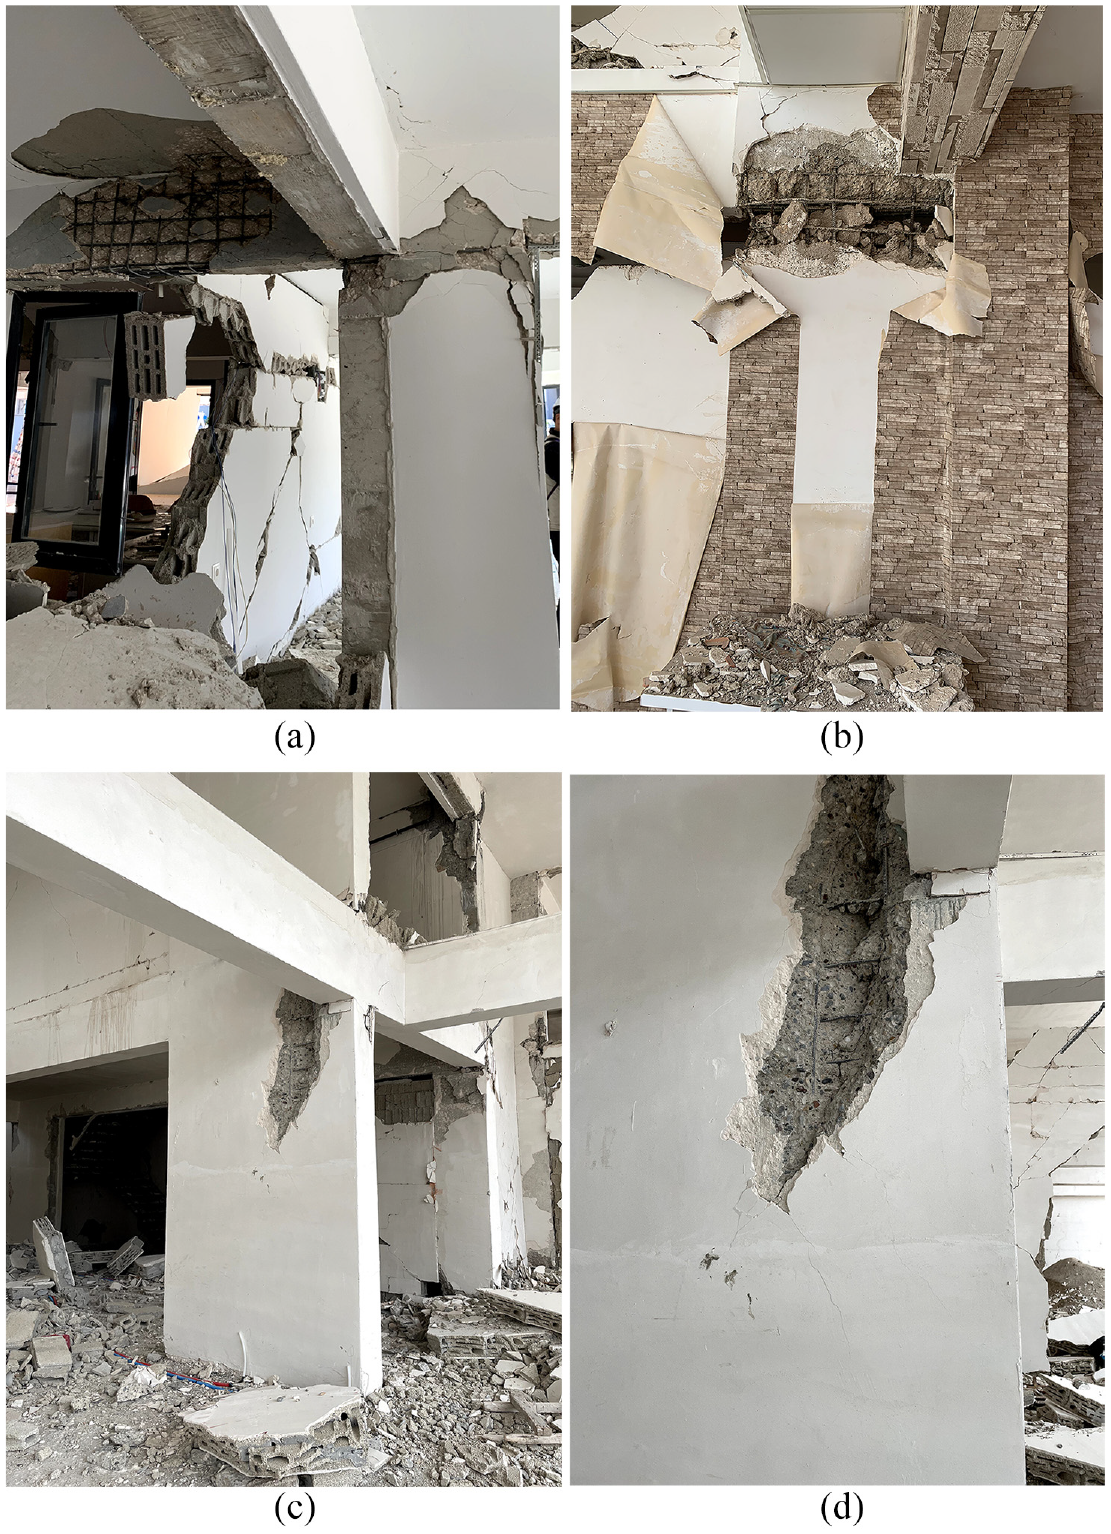
Damage caused by beams connecting column’s edges in the weak direction. (a) damage on intersecting beam; (b) heavy damage on the column; (c) heavy shear rupture on the column; and (d) zoomed-in view of the shear rupture shown in Figure 5c.
In many urban residential buildings, ground-level spaces are allocated for commercial use, a common practice that influences architectural design. As a result, the ground floor is typically higher than the upper floors, occasionally reaching up to 6 m. These raised ground floors often include mezzanines, contributing to the formation of a soft story. In addition, the floor plan typically widens above the ground floor, creating heavy overhangs (Figure 6). Moreover, there is a shift in the position of perimeter beams. This shift in the perimeter frame leads to having slab bands instead of conventional beams, as given in Figure 3b. Figure 7 illustrates structural damage associated with these frame discontinuities. As illustrated by the red arrow markers, the beam continuity is disrupted around the perimeter of buildings with overhangs. This disruption causes a decrease in the lateral stiffness of the frame, resulting in heavy damage.
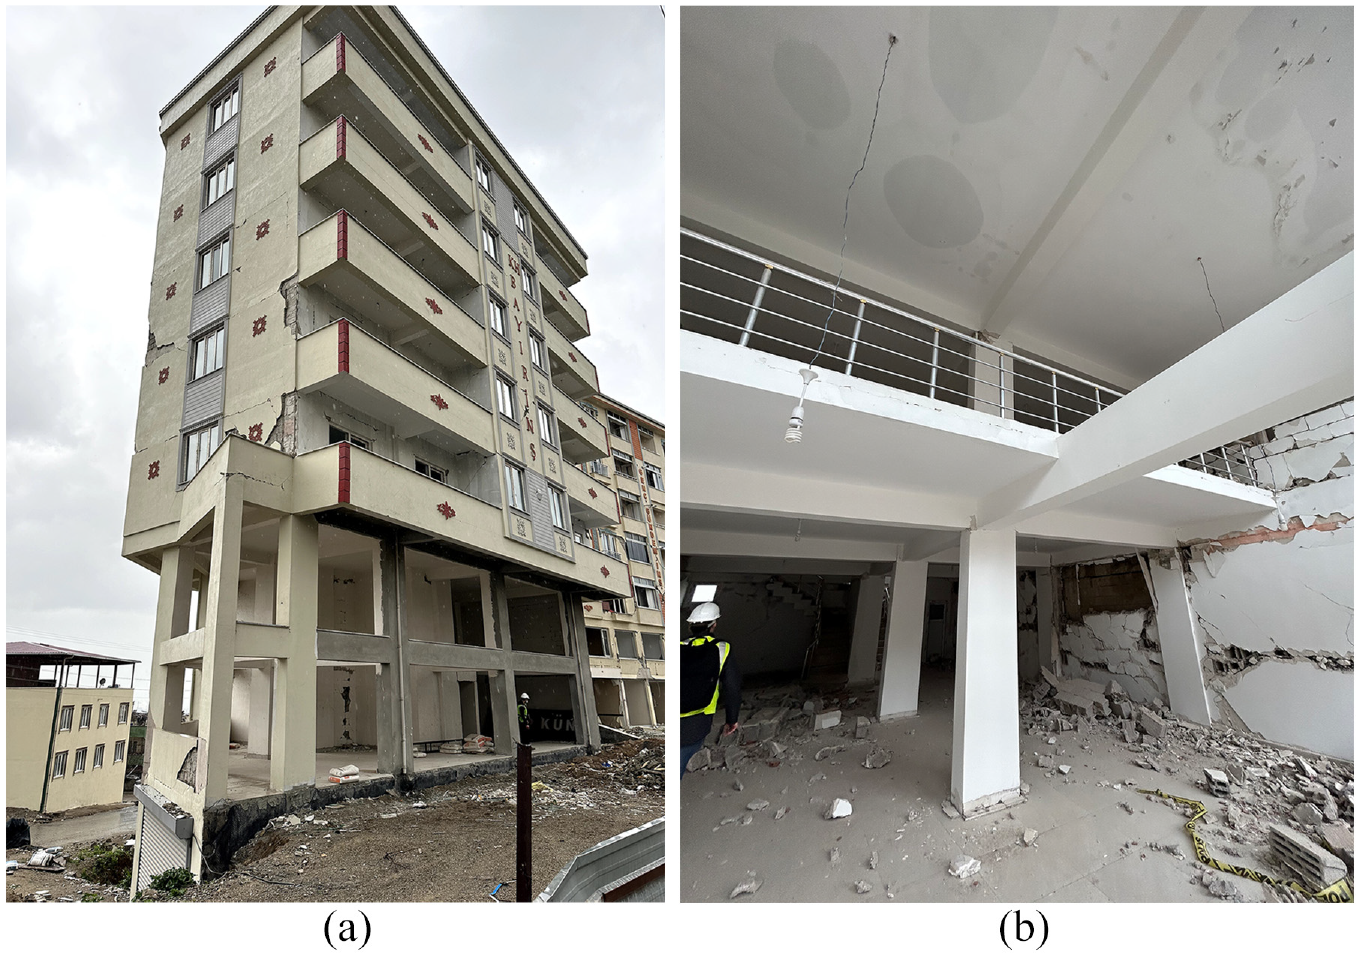
(a) Building with a ground floor used as a commercial store; and (b) mezzanine from one of the surveyed buildings.
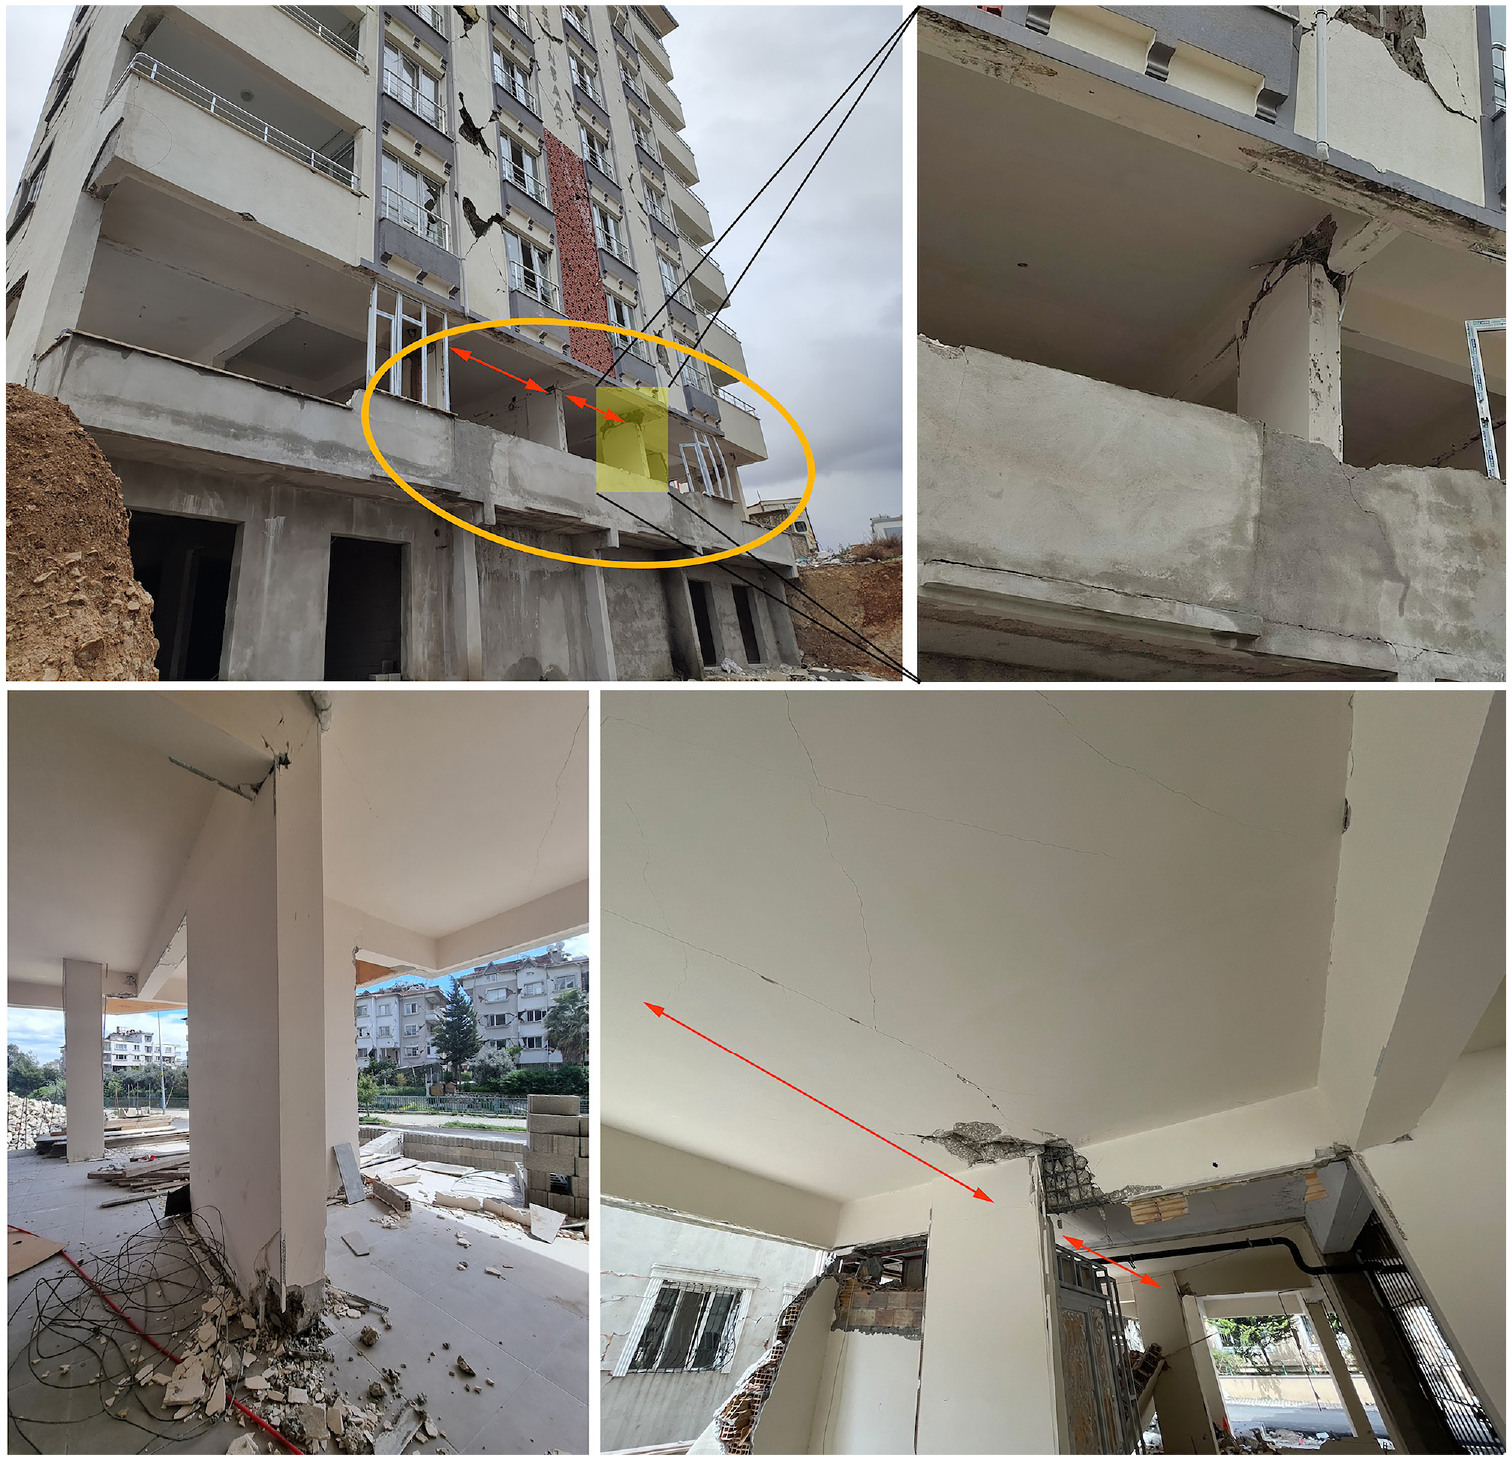
Damaged structural elements due to frame discontinuity.
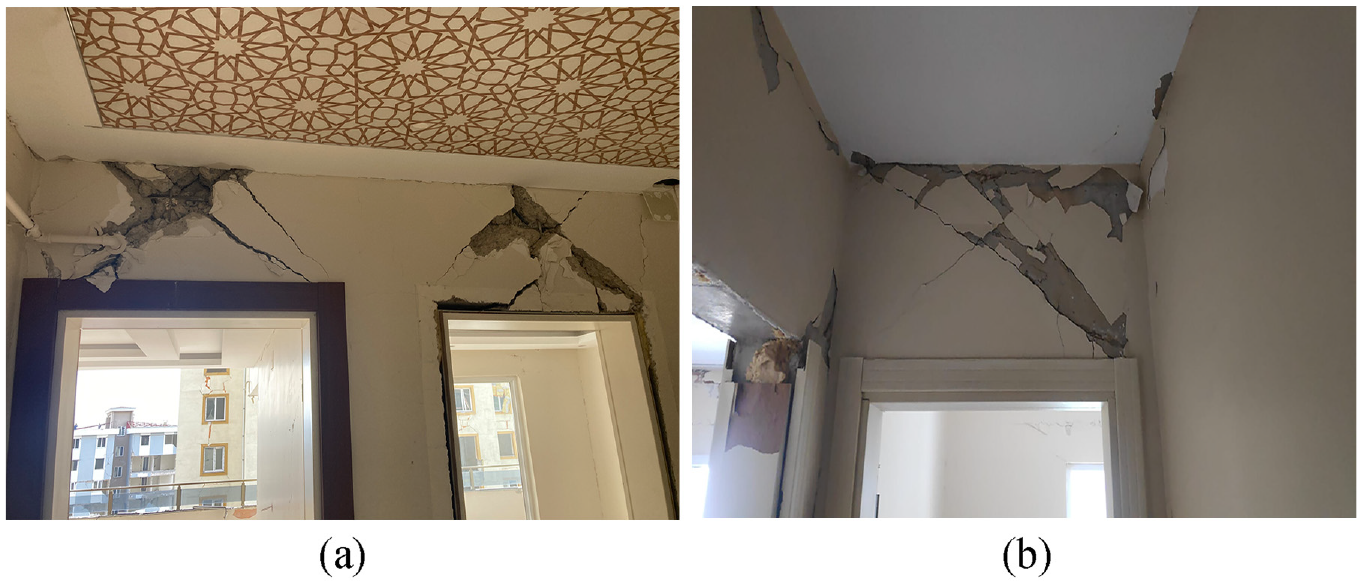
In addition to the structural damage observed in frame structures, non-structural elements such as infill walls and staircases were found to be heavily damaged. Damage to infill walls was widespread in most of the surveyed buildings, occurring at varying rates. In Turkish construction practices, infills typically consist of single wythe walls made from materials such as hollow clay, autoclaved aerated concrete, or pumice concrete blocks. These walls are generally weaker than the surrounding frame (Shing and Mehrabi, 2002). Consequently, various “weak infill-strong frame” failure modes, such as horizontal sliding, corner crushing, and diagonal cracking, were predominantly observed. In a limited number of cases, horizontal sliding and corner crushing failure modes were accompanied by column flexural hinging or column shear failure. In regions where the seismic intensity was significantly high, infill walls experienced severe damage and failed under combined in-plane and out-of-plane loading. It was frequently observed that exterior wall panels built on the overhangs toppled out-of-plane since they did not have columns at the sides to support their out-of-plane stability. It was also observed that the extent and the type of damage were independent of the infill material. Photos of several infill damages are given in Supplemental Material 1.
RC wall construction
Seven percent (17 out of 242) of the investigated buildings were classified as RC wall construction. Among them, 5 buildings were undamaged or showed minor signs of non-structural damage, 3 buildings were rated as lightly damaged, and 9 were severely damaged. When examining the structural wall layouts of these buildings to understand the causes of the damage, it was observed that the ratio of the amount of walls on the ground floor to the total floor area above the base, referred to as the “wall index,” serves as a useful indicator of robustness. This ratio was calculated for both perpendicular plan directions separately.
It was noted that the buildings with a low wall index in both directions experienced severe damage. In cases where the wall index was significantly high in one plan direction but quite low in the transverse direction, damage was evident. In cases where the wall indices in both directions were high, damage was prevented, except for one instance where highly asymmetrical wall placement caused eccentricity and resulted in severe damage. Wall indices and DS of the surveyed RC wall buildings are given in Supplemental Material 2.
Figure 8 shows a severely damaged RC wall building in Kahramanmaraş. This building is one of the apartments in a complex where all buildings suffered severe damage, and one collapsed. Examination of the floor plans revealed that they had only a single RC wall (shown with red rectangle) in the long direction, while all other walls were in the short direction (shown with blue rectangles).
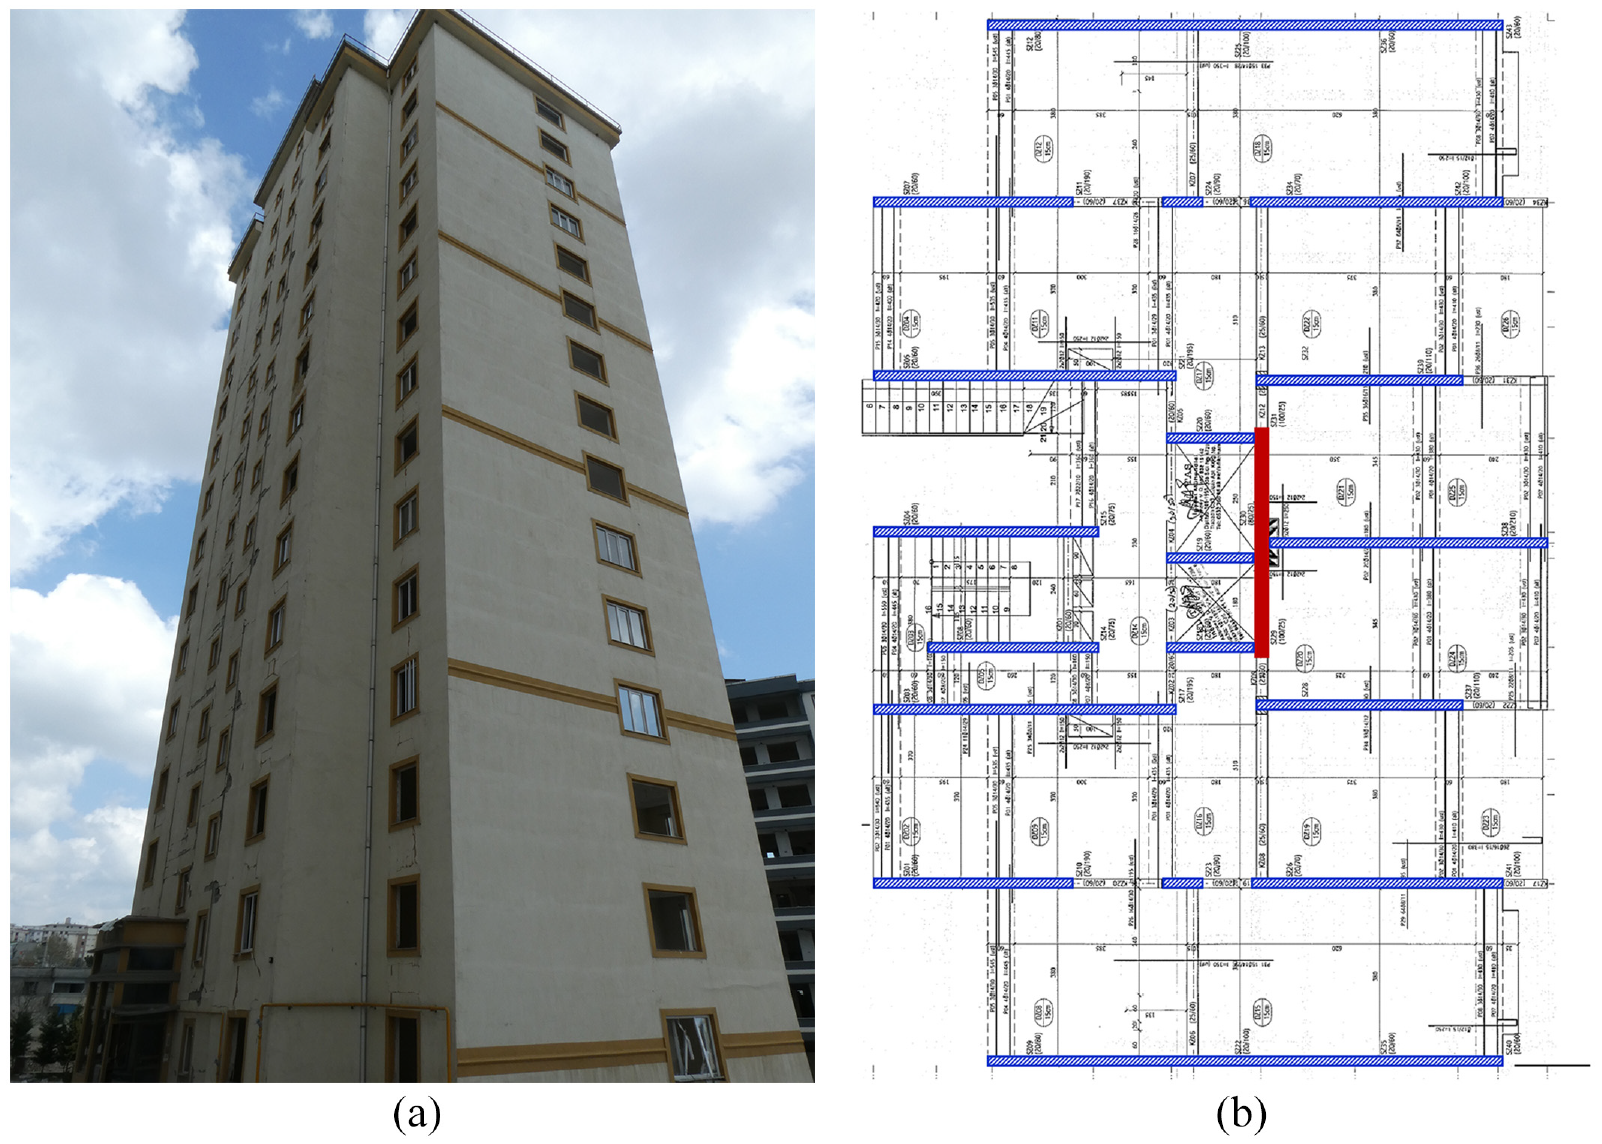
Severely damaged RC wall construction in Kahramanmaraş: (a) photo of the building; and (b) plan of the building with a highlighted RC wall layout.
Figure 9 presents two RC wall buildings located in different complexes along with their respective floor plans. Both buildings experienced comparable seismic demands during the earthquakes. These buildings were commissioned by the Mass Housing Development Administration of Türkiye and constructed using reusable tunnel formwork, featuring identical floor plans despite their differing number of stories. Consequently, both buildings possessed the same amount of shear walls in their ground floors but exhibited different wall indices. The taller buildings had lower wall indices compared to the shorter ones, resulting in severe damage in the former and no damage in the latter. Similarly, it was observed that another eight-story RC wall building, which showed only minor signs of non-structural damage, had sufficient wall indices in both directions.
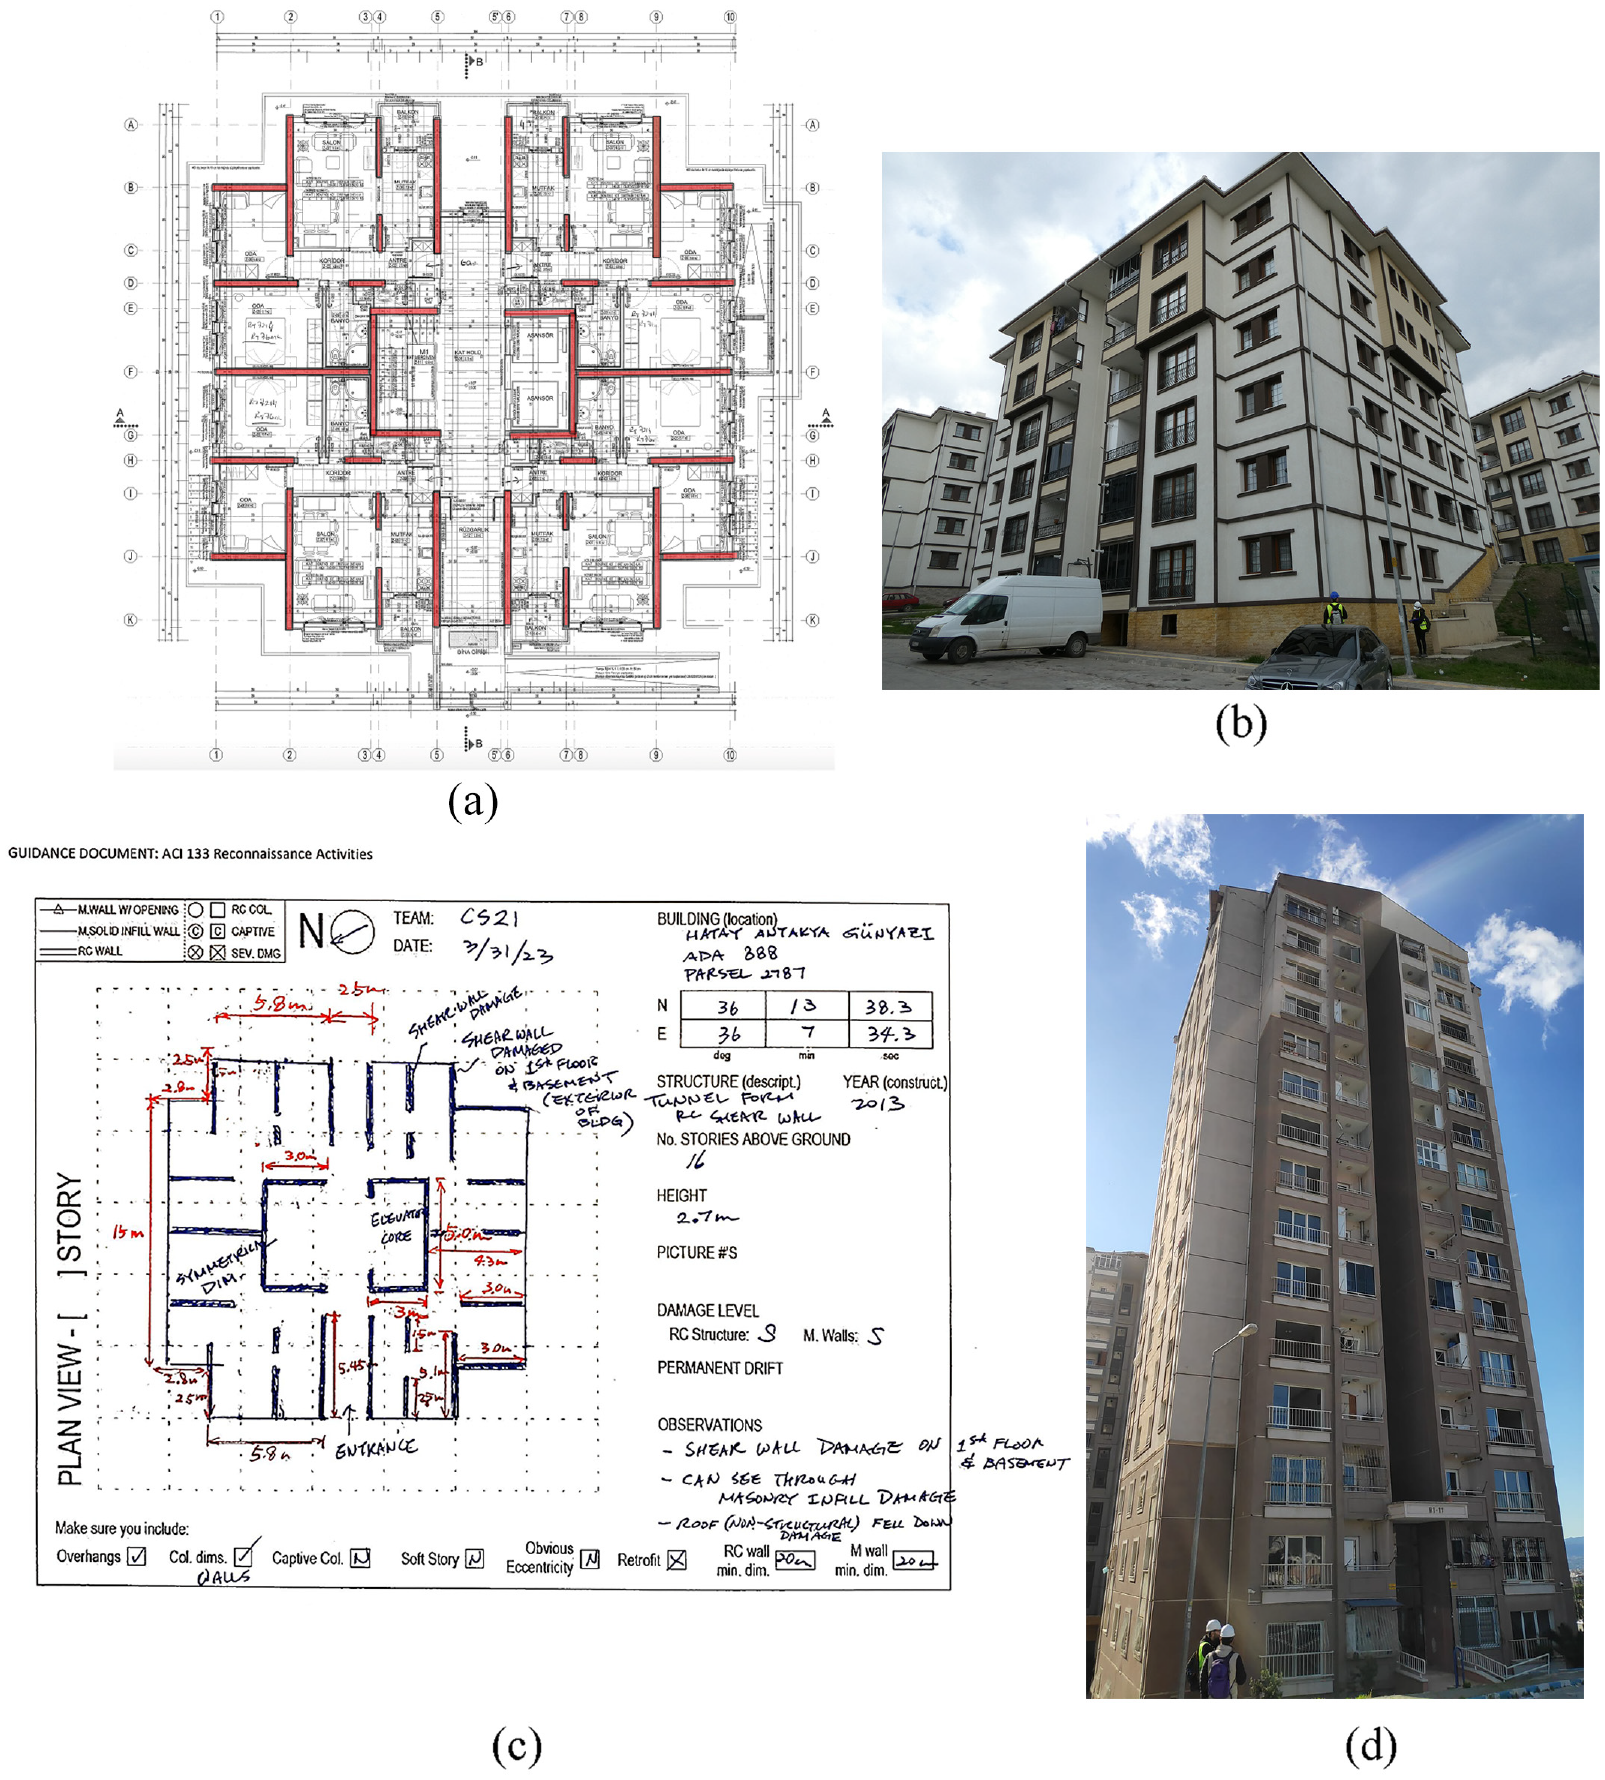
Different RC wall buildings with the same floor plan from Kahramanmaraş and Hatay, respectively: (a) floor plan; and (b) photo of the 6-story building with no structural damage; (c) floor plan; and (d) photo of the 16-story building with severe damage.
The most common structural damage to RC wall structures observed to be shear failures of short/coupling beams. Figure 10a and b shows damaged coupling beams of RC wall buildings. The main reason of shear failures in short/coupling beams originates from the lack of diagonal reinforcement to address the shear demands. More specifically, practitioner engineers in the region benefit from CAD software which is expected to help them during the analysis and design process. These software rely on the checks defined in the Building Earthquake Regulation of Türkiye-2018 (Ministry of Interior of the Republic of Türkiye, 2018) to guide the engineer on whether the beam needs to be considered as a short/coupling beam or not. One of the most commonly used CAD software in the region does not allow users to manually design diagonal reinforcement if the beam is not considered a short/coupling beam leading to a lack of sufficient reinforcement.
The primary damage to RC walls was observed to be lap splice failures. The inspected buildings exhibited heavily damaged shear walls due to the failure of the lap splice regions at wall bases. It is worth noting that the actual forces in longitudinal bars in RC wall could exceed the design forces so that the lap splices in the boundary regions may be forced to resist these forces. Therefore, these lap splices are susceptible to sudden failure, and even if they do not immediately fail, they introduce abrupt bending and areas of elevated strain concentration at their extremities. The Building Earthquake Regulation of Türkiye-2018 (Ministry of Interior of the Republic of Türkiye, 2018) explicitly prohibits the utilization of lap splices in the longitudinal reinforcement of columns near the ends of members where yielding is anticipated due to increased flexural moments. However, the Building Earthquake Regulation of Türkiye-2018 does not specify any requirement for the longitudinal reinforcements within the boundary regions of shear walls. ACI (2019) 318-19 restricts the placement of lap splices in the critical regions of the RC walls, where yielding of the rebars is expected due to lateral displacements. During the inspections, most shear walls were observed to have experienced failures in the lap splices at their base (Figure 11). These shear walls were also subjected to higher lateral loads during the earthquakes, causing severe damage to the members at the ground level of the structures. Figure 12 shows buckling and rebar ruptures to the longitudinal reinforcements of structural walls at the ground level.
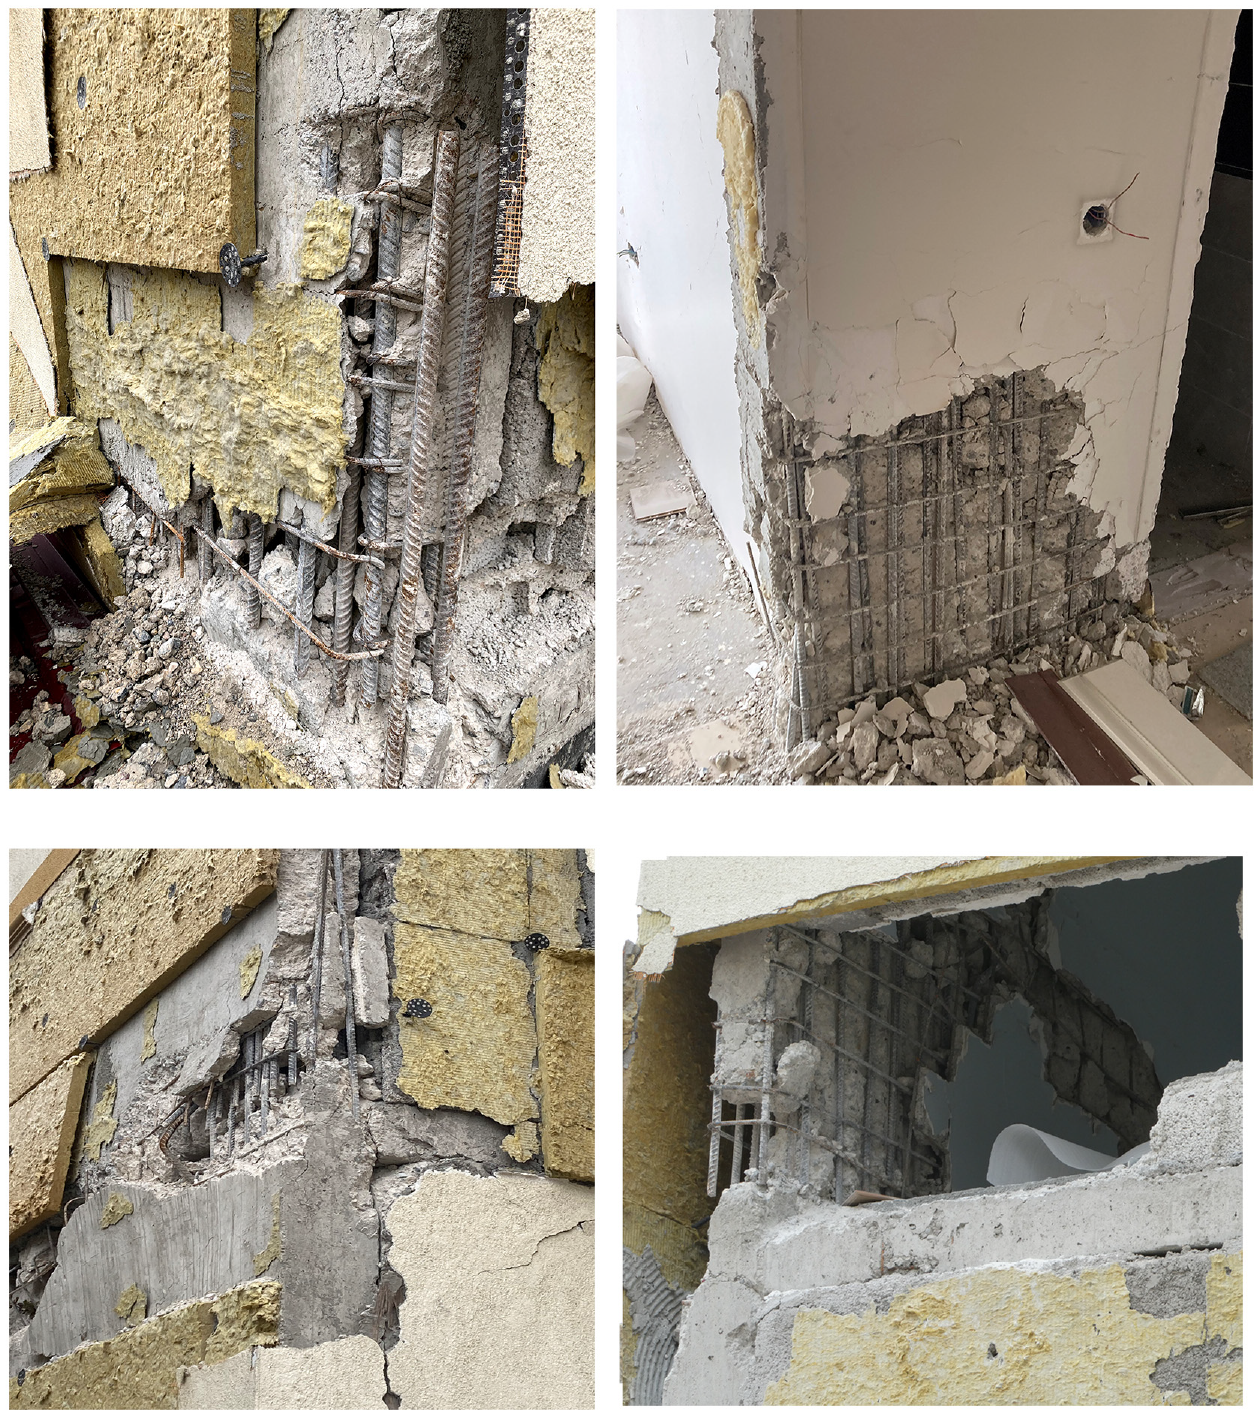
Lap splice damage in RC shear walls.
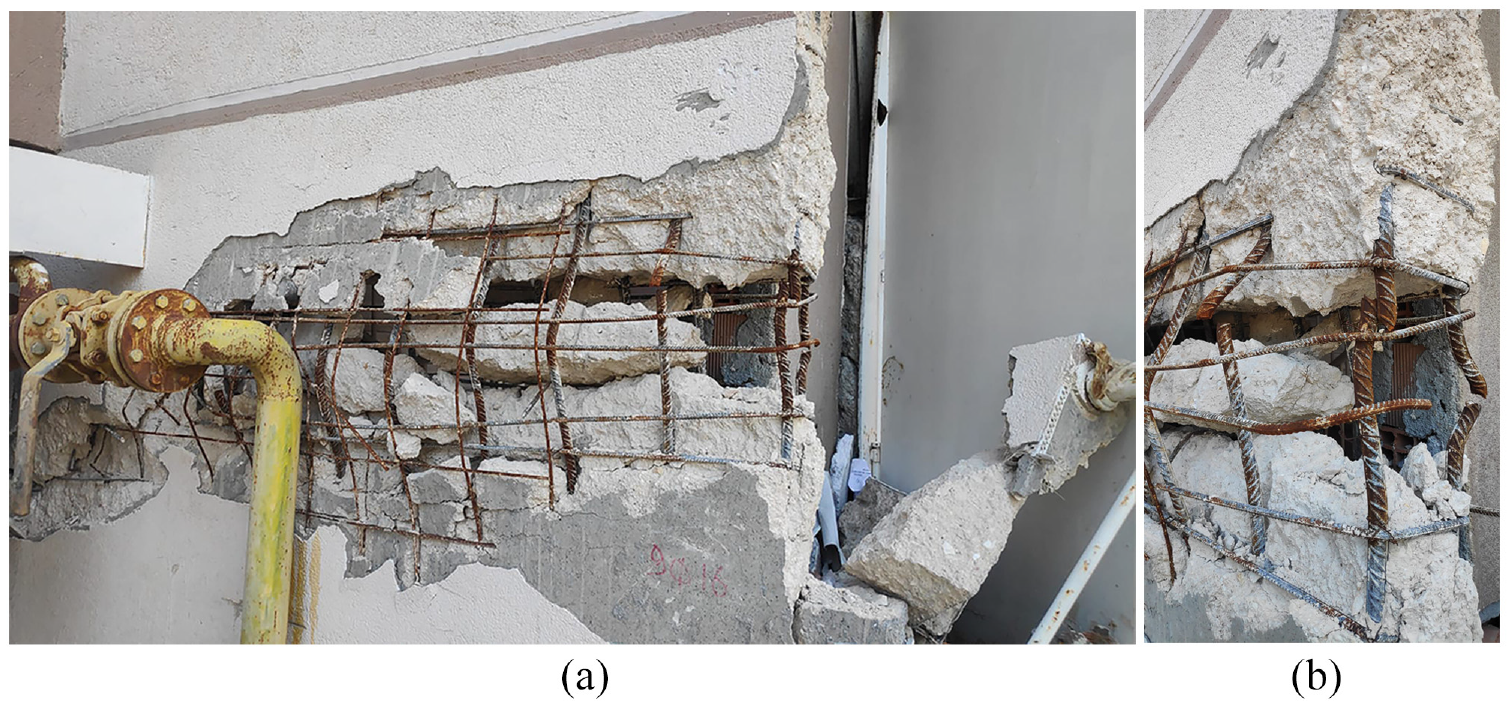
Damage to structural walls: (a) Buckling of rebars. (b) Rupture of rebars.
The survey emphasized that moment frames, with or without shear walls, faced substantial drift demands leading to significant structural and/or non-structural damage. In contrast, RC wall construction with sufficient amount of shear walls in both floor plan directions relative to their height outperformed with only light damage, enabling residents to return shortly after the earthquakes.
Fragility analysis
The limited number of surveyed buildings, particularly in the case of RC wall construction, poses challenges in drawing comprehensive conclusions regarding the behavior of different structural systems. To address this limitation and provide broader insights, numerical simulations were conducted through fragility analyses of different types of RC structural systems observed in the earthquake-affected region. Based on the field observations following the seismic events, equivalent single degree of freedom (SDOF) systems were employed to represent specific structural system types, utilizing modeling approaches well documented in the literature. The vulnerabilities of these models were evaluated through nonlinear time history analyses (NLTHAs) that utilize the recorded ground motions during the 2023 Kahramanmaraş earthquakes.
Selected ground motion records
Records from the 2023 Kahramanmaraş earthquakes were used to enable a plausible comparison between simulated and observed damage data. The acceleration time histories for the NLTHAs were acquired from the Turkish Accelerometric Database and Analysis System (AFAD, 2023), covering a broad range of intensities. The majority of the records were from the Mw 7.8 Pazarcık earthquake, except for station 4612 in Göksun, Kahramanmaraş, for which the record from the Mw 7.5 Elbistan earthquake was used due to its higher intensity compared to the Mw 7.8 event. A total of 60 records, comprising two horizontal components for each station, were included in the analysis. Figure 1 provides the locations and code numbers of the employed stations along with corresponding peak ground velocities.
PGV was selected as the primary intensity measure for this study, known to be a reliable predictor of the damage potential of ground motions for typical RC structures (Akkar and Özen, 2005; Lepage, 1997; Sozen, 2003; Sucuoğlu and Erberik, 1998). The inelastic displacements are substantially more correlated with PGV than PGA, according to Akkar et al. (2005). This choice aligns with recent research examining the 2023 Kahramanmaraş earthquakes, where PGV demonstrated the strongest correlation with observed damage in the same surveyed locations as in this study (Köroğlu et al., 2024).
The considered seismic events highlighted the necessity of considering behavior at PGV values exceeding the typically preferred upper limit of 100 cm/s in fragility curve studies. The majority of the records from this earthquake exhibited PGV values surpassing the threshold, emphasizing the necessity of accounting for higher PGV values. A key distinction of this study from others in the literature is the absence of a PGV limitation in the selected ground motions. The employed set of ground motion records included PGVs of up to 186.8 m/s, allowing for a comprehensive exploration of seismic behavior across a wide range of intensities.
Generation of the structural models
In seismic fragility analysis of large building stocks, employing idealized equivalent SDOF systems that represent global structural features is generally preferred for computational efficiency. In this study, the surveyed buildings were categorized into predefined building classes based on their structural system and observed structural properties during the survey. A categorization scheme derived for the seismic risk assessment studies in Gaziantep and Erzincan provinces of Türkiye (Arslan Kelam et al., 2022; Karimzadeh et al., 2018) was adopted, considering the strong resemblance of the surveyed building stock to that in these regions. Within this classification scheme, the letter “R” signifies RC construction, while the letters “F,”“H,” and “W” denote the structural system types—moment frame, hybrid (frame-wall), and RC wall buildings, respectively. The design compliance level is indicated by “A,”“B,” or “C,” representing high, moderate, and low adherence to seismic design regulations and construction principles, respectively. In addition, the designation of “1” and “2” denotes the “low-rise” (one to three stories) and “mid-to-high-rise” (four to eight stories) buildings, respectively. For instance, “RF2B” represents mid-to-high-rise RC moment-frame buildings exhibiting moderate code and construction practice compliance. Structures with good visual material quality and no significant structural deficiencies (such as soft stories or irregularities in the horizontal and vertical directions) are considered to be in compliance with “high-level” earthquake design standards. In the event of a significant earthquake, these kinds of buildings should offer sufficient safety. On the other hand, structures that follow to “low-level” earthquake code compliance appear to have poor construction quality, structural flaws, and are expected to function poorly in the case of a significant earthquake. Certain structures only partially or moderately comply with earthquake design guidelines, and their projected performance lies between these two limiting instances.
Based on the structural systems investigated in this study, three distinct subclasses for RC structures were established for the fragility analyses: RF2B (four- to eight-story RC frames with moderate code compliance), RH2B (four- to eight-story RC hybrid systems with moderate code compliance), and RW2A (four- to eight-story RC wall systems with high code compliance). Due to factors such as construction years, structural vulnerabilities, and observable construction quality, buildings classified as RC frame and RC hybrid systems are generally considered to be of “moderate” compliance with seismic design regulations and construction practices. In contrast, structures categorized as RC wall buildings were relatively recently constructed and typically exhibit fewer irregularities due to the nature of the construction process, leading to their classification as “high” compliance with seismic regulations. It should be noted that only the RC wall buildings with adequate amount of shear walls were considered in this part of the study.
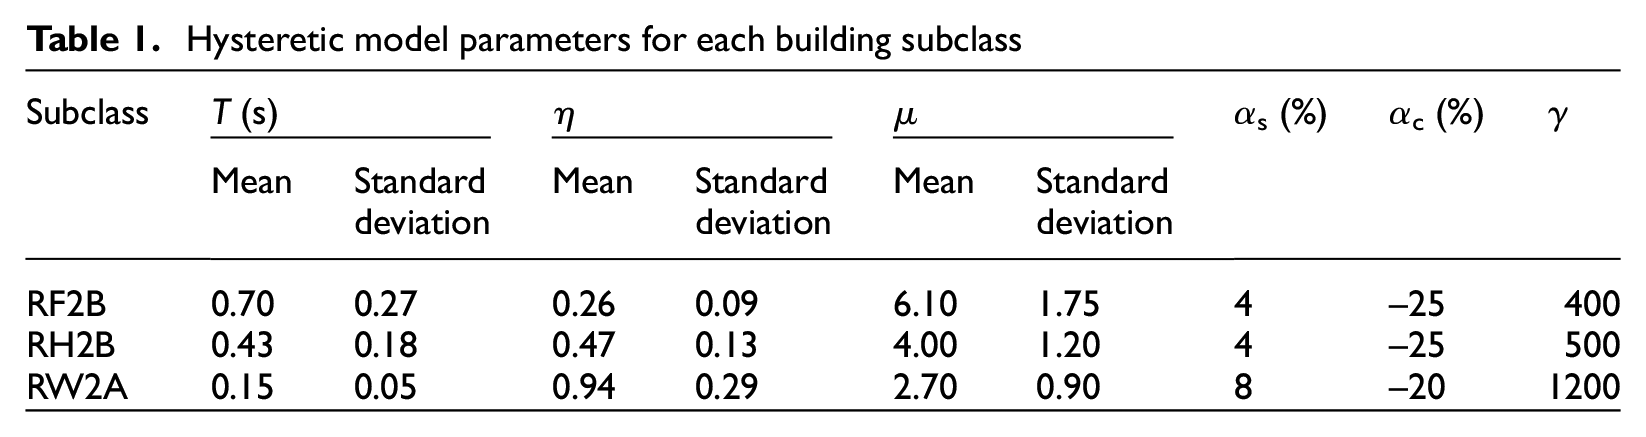
The equivalent SDOF systems in this study were characterized by three key parameters: period (T), ultimate strength ratio (η), and deformation ductility ratio (μ). These parameters are considered as random variables in this study. Statistical characteristics for these parameters, including mean and standard deviation, were sourced from Karimzadeh et al. (2018) and Arslan Kelam et al. (2022) for each building class. Furthermore, the study employed a multi-parameter hysteretic model, known as the “Modified Ibarra-Medina-Krawinkler Deterioration Model,” to capture the strength and stiffness deteriorations during cyclic motion (Ibarra et al., 2005). The hysteretic parameters used in this study were also adopted from Karimzadeh et al. (2018) and Arslan Kelam et al. (2022). Table 1 provides a list of the equivalent SDOF system and corresponding hysteretic model parameters for each building subclass.
Hysteretic model parameters for each building subclass
The study utilized the Latin hypercube sampling (LHS) method, a segmentation-based technique for handling multiple variables (McKay et al., 1979), to derive lognormal distributions for the designated random variables. In the last 20 years, the LHS method has been widely used in structural earthquake engineering research due to its computational efficiency over the Monte Carlo approach. This approach can achieve the desired level of accuracy with a limited number of samples (Erberik, 2008; Erberik and Elnashai, 2004). Accordingly, 20 samples were generated for each random variable (i.e. T, η, and μ) using the LHS strategy. Consequently, a total of 3600 NLTHAs were performed on models derived from 20 samples for three different building subclasses, utilizing 60 preselected strong ground motion records. The NLTHAs were performed using the II-DAP software (Elkady and Lignos, 2019), which incorporates the previously described hysteretic model.
Derivation of the fragility curves
The probability of exceeding a damage limit for a specific PGV level is commonly referred to as the probability of exceedance (PE). This can be expressed symbolically in Equation 1.

Here,
Limit states taken from Karimzadeh et al.’s (2018) study in terms of drift ratio
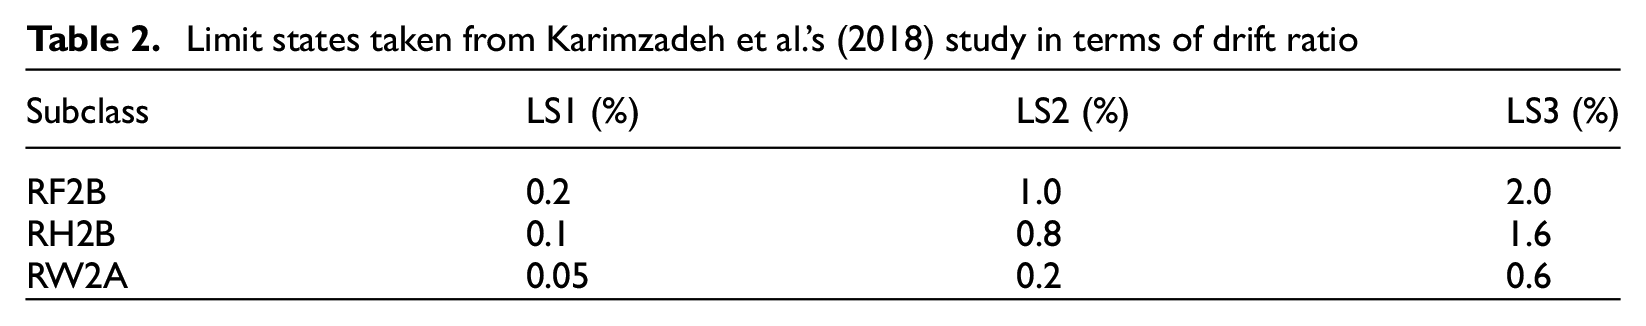
Exceedance probabilities were calculated for all PGV levels and plotted as a function of PGV for each building subclass. Then, the data points were fitted with the cumulative distribution function of the lognormal distribution to generate smooth fragility curves. Figure 13 displays the fragility curves for the various building subclasses.
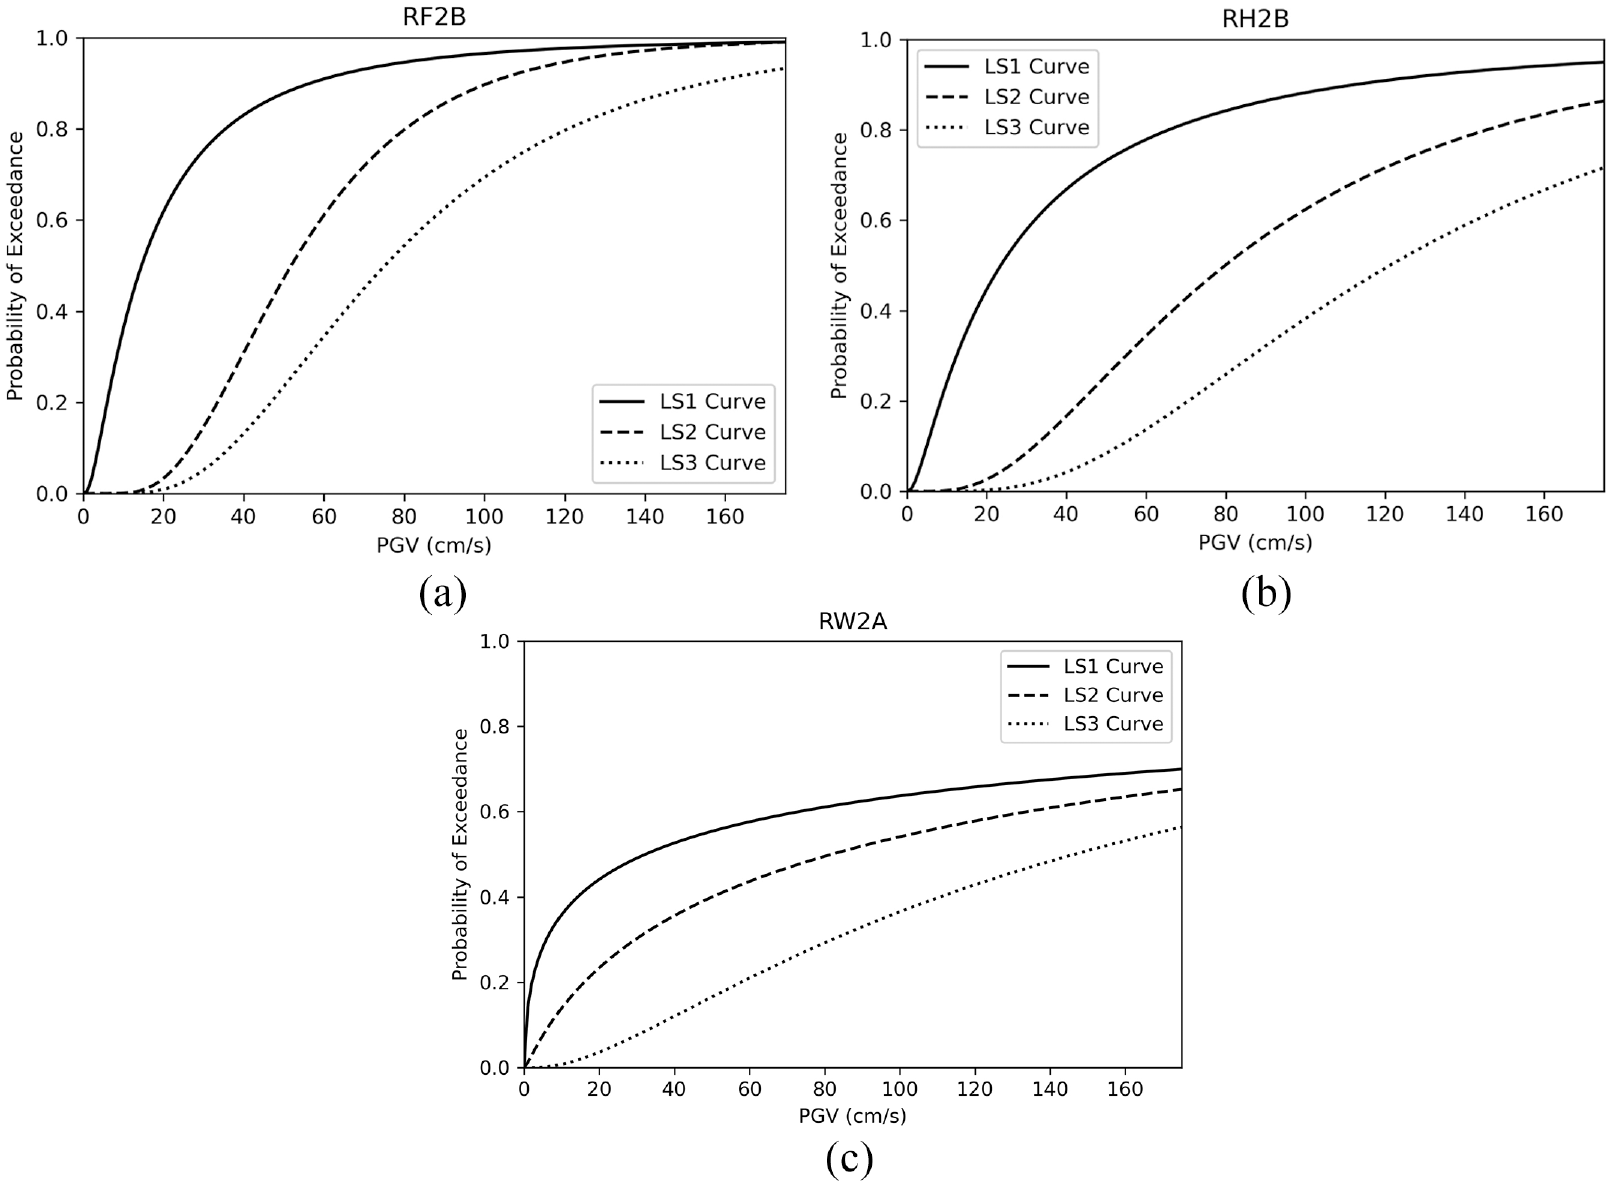
Computed fragility curves for each subclass: (a) RF2B; (b) RH2B; and (c) RW2A.
As given in Figure 13, moment-frame buildings demonstrated the least favorable performance, with the PE for the life safety limit state (LS2) reaching saturation beyond approximately 80 cm/s PGV. Hybrid systems were anticipated to exhibit relatively better performance, as expected. The RC wall buildings were projected to perform remarkably well, with the PE not surpassing 60% and 50% for the life safety (LS2) and collapse prevention (LS3) limit states, respectively, even under high PGV levels. These findings align with the observed behavior of each structural system type in the field.
Determination of the regional damage distributions
The approach outlined in Askan and Yücemen’s (2010) study was employed to determine the mean damage ratios (DRs) for the regions. This method facilitated the production of damage probability matrices (DPMs) for each location and structure class. These matrices were derived from fragility curves, which are continuous functions, and represented as discrete DRs corresponding to specific PGV values or obtained directly from field measurements as empirical and discrete rates. An illustrative example of a DPM is presented in Table 3. This matrix enables the translation of earthquake ground motion into terms such as PGA, PGV, or Modified Mercalli Intensity (MMI) scale.
Example damage probability matrix
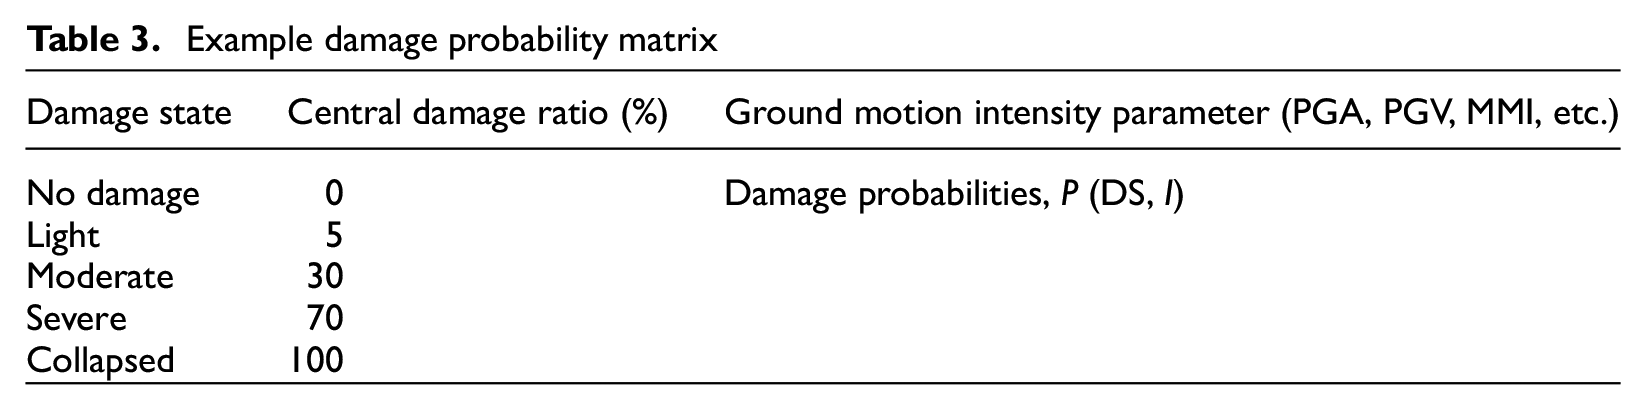
Engineers and researchers have identified several damage levels, expressed as DS in these matrices. The DR, ranging from 0% to 100%, represents the repair costs relative to reconstruction costs and serves as a mathematical representation of damage scenarios. To simplify the assessment of damage occurrences into distinct categories, central damage ratios have been established. Presenting the structural state under a specific earthquake intensity level with a single damage rate is crucial when comparing the condition of structures on a regional scale, as conducted in this study. Hence, the mean damage rate (MDR) is defined in Equation 2.
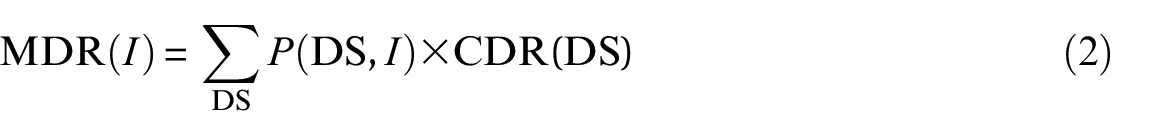
In this equation, MDR(I) signifies the mean DR corresponding to the earthquake intensity or ground motion parameter I. Damage probabilities were obtained from the fragility curves, representing the value corresponding to the PGV value of the respective earthquake in each population center. This value was obtained from the records of the closest ground motion station to the location under consideration. Here, the stations within a maximum of 2.5 km radius were only considered (see Supplemental Material 3). In this manner, the difference between the local soil conditions where the surveyed buildings are located and the exact location of the strong ground motion stations would be minimized as much as possible. As the fragility curves in this study are expressed in terms of PGV, Equation 2 was utilized to calculate the mean DR for each building class type in each settlement center. Each settlement center yielded a single MDR value for the earthquake, with the MDR values for different building types combined in proportion to the distribution percentages of those various building types in the region. Table 4 illustrates the distribution percentages of each structural system type, along with a comparison between the estimated and observed damage for each location. The table also lists the ground motion recording stations used for each particular location. Using intensity measure (IM) values from time histories already used for fragility curve derivation in MDR estimates can lead to statistical bias. To avoid this, NLTHAs in fragility curve derivations did not employ the strong ground motion records taken as a reference in MDR calculations for each settlement.
Percentages of each structural system type and estimated versus observed damage at each location
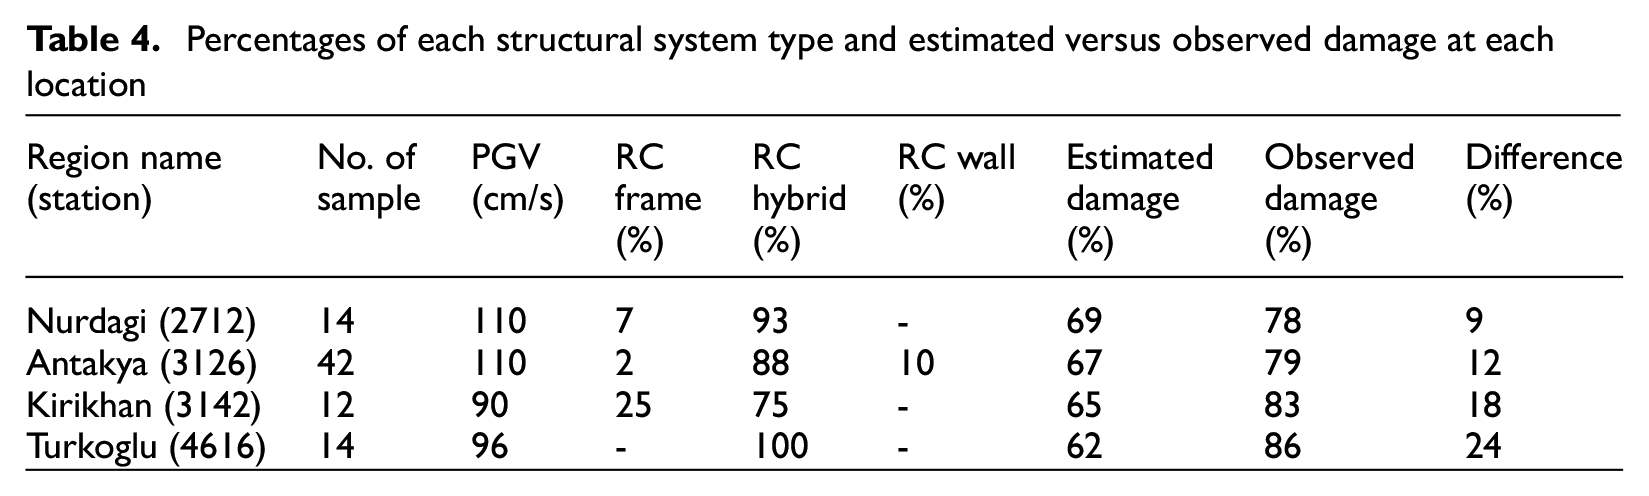
As can be seen from Table 4, the estimated and observed DRs are in close agreement for most locations. Considering the limited number of surveyed buildings in each location, some variations are acceptable to a certain extent. Nevertheless, the results demonstrate the effectiveness of the fragility analyses conducted using the equivalent SDOF systems in accurately representing the general seismic response of various structural systems. The observations derived from the survey are robustly supported by the fragility analyses conducted in this study, providing a solid foundation for generalization. The fragility analyses, utilizing a range of ground motions and structural models, reinforce the findings obtained from field observations. This comprehensive approach ensures that the conclusions drawn from the survey data are reliable and applicable to a broader context beyond the specific surveyed locations.
Discussions
Field observations and the findings of this study revealed that moment-resisting frame systems faced significant drift demands during the 2023 Kahramanmaraş earthquake sequence. Even when shear walls were present, these systems struggled to withstand these demands, leading to both severe structural and non-structural damage in many instances. While one might attribute this to common deficiencies, it is worth noting that the performance objective outlined by recent seismic design regulations for residential buildings guarantees only life safety under the design-level earthquake. Considering the high levels of intensity in these events, even properly designed and constructed moment frames would experience substantial structural damage. This implication underscores the insufficiency of the “life safety” performance objective, calling for a shift in performance objectives toward immediate occupation that can also provide functional recovery after an earthquake.
Another critical factor contributing to the evacuation and reoccupation of buildings was the extensive damage in non-structural elements such as infill walls. Brick infill walls within the frames are commonly used in residential buildings in Türkiye. These elements are inherently brittle and prone to failure at very low drift levels (e.g. 0.5%–1.0%). Infill walls in several buildings with low to moderate structural damage were observed to have collapsed, rendering repairs either impractical or unfeasible. Moreover, occupants frequently regard structures with infill damage as unsafe, despite the structural damage being minimal and refuse to reoccupy (Sucuoglu, 2013). This observation, combined with the previous one, emphasizes the importance of controlling the drift demand in buildings to mitigate potential losses of lives and property. RC wall buildings emerge as the most promising and effective structural system type for this task in Türkiye. As demonstrated by Sozen (1989) and applied in Chilean practice, an adequate amount of shear walls in both plan directions of buildings effectively controls drift and the damage caused by it. This amount is typically prescribed as the ratio of the total cross-sectional area of shear walls in one horizontal direction to the total floor area above the base (wall index; Hassan and Sozen, 1997). Supporting this statement, RC wall buildings with sufficient wall indices in both directions were observed to withstand the 2023 Kahramanmaraş earthquakes without any significant structural or non-structural damage.
Conclusions
This study evaluates the seismic performance of prevalent structural systems in Türkiye during the 2023 Kahramanmaraş earthquakes, primarily relying on a comprehensive field survey conducted during a reconnaissance mission involving the authors. The findings are further supported by fragility analyses utilizing equivalent SDOF systems that are generated based on the characteristics observed in the surveyed buildings.
The survey covered 242 RC residential buildings across a broad region. Among the commonly encountered structural systems, the most widespread were RC moment-resisting frames (RC frame) or frame-wall systems with varying quantities of RC walls (RC hybrid). A less frequently observed structural system type in the field was RC wall construction.
RC frame buildings, whether with or without RC walls, exhibited a range of common deficiencies, including irregular column alignments, beams framing into other beams, offsets between beam and column axes, frame discontinuities, elevated ground floors, and heavy overhangs. The combination of these deficiencies with high drift demands yielded extensive damage to these building types.
Considering the seismic intensities experienced, even appropriately designed and constructed moment frames would sustain significant structural and non-structural damage, as they are generally designed for life safety. Even in the cases where no considerable structural damage is evident, the extensive damage to non-structural elements, such as brick infill walls, results in millions of people facing accommodation problems if the region’s building stock is mainly compromised by mid-rise or high-rise RC structures. Hence, a reevaluation of performance objectives to prioritize immediate occupation becomes crucial to preclude post-earthquake problems and facilitate functional recovery.
Regarding RC wall construction, the observed performance exhibited a two-fold outcome. While some RC wall buildings were observed to sustain severe damage, others performed remarkably well, with no non-structural damage evident. Examining the structural plans of the surveyed RC wall buildings reveals that those with sufficient wall indices (the ratio of the total cross-sectional area of shear walls in one building direction to the total floor area above the base) in both directions showed exceptional performance. Conversely, those with very low wall indices in one or both directions sustained severe damage.
Two primary damage patterns were prevalent in RC wall buildings: damage to short/coupling beams and damage to RC walls. Short/coupling beam damage was often attributed to the absence of diagonal reinforcement, which could be linked to the limitations of CAD software commonly used by engineers in the region, as well as a lack of rigor in engineering practices. The most common cause of RC wall damage was found to be the provision of lap splices for longitudinal reinforcement at the base of the building.
In addition to the conclusions drawn from the field observations, the fragility analyses further supported the findings. Specifically, the results of the analyses revealed that RC frame and RC hybrid systems were inadequate in ensuring life safety under the seismic intensities experienced during the 2023 Kahramanmaraş earthquakes. Conversely, properly designed RC wall buildings are expected to perform remarkably well. This alignment between the field observations and the outcomes of the fragility analyses underscores the robustness of the study’s findings and highlights the effectiveness of RC wall construction in controlling drift demands and mitigating potential loss of life and property.
Supplemental Material
sj-pdf-1-eqs-10.1177_87552930241287541 – Supplemental material for Seismic performance assessment of structural systems in the aftermath of the 2023 Kahramanmaraş earthquakes
Supplemental material, sj-pdf-1-eqs-10.1177_87552930241287541 for Seismic performance assessment of structural systems in the aftermath of the 2023 Kahramanmaraş earthquakes by Egemen Sonmez, Meltem Eryilmaz Yildirim, Mehmet Firat Aydin and Fahri Baran Koroglu in Earthquake Spectra
Footnotes
Declaration of conflicting interests
The author(s) declared no potential conflicts of interest with respect to the research, authorship, and/or publication of this article.
Funding
The author(s) disclosed receipt of the following financial support for the research, authorship, and/or publication of this article: This research was funded by American Concrete Institute, with additional support from American Society of Civil Engineers, and the US National Institute for Standards and Technology. The help of all other participating institutions and individuals is also gratefully acknowledged.
Data availability statement
All data and model parameters used during the study appear in the submitted article. However, researchers who need more information for research purposes can contact the corresponding author.
Ground motion data are available at: https://tadas.afad.gov.tr/event-detail/17966 & ![]()
Supplemental material
Supplemental material for this article is available online.
References
Supplementary Material
Please find the following supplemental material available below.
For Open Access articles published under a Creative Commons License, all supplemental material carries the same license as the article it is associated with.
For non-Open Access articles published, all supplemental material carries a non-exclusive license, and permission requests for re-use of supplemental material or any part of supplemental material shall be sent directly to the copyright owner as specified in the copyright notice associated with the article.