
Abstract
The 2023 Türkiye earthquake sequence includes the 6 February M7.81 mainshock followed approximately 9 h later by an M7.74 event, and many smaller aftershocks including M6.81 and M6.37 events on 6 and 20 February, respectively. These events occurred in a region near the plate boundary of the East Anatolian Fault, in the proximity of which numerous ground motion recording stations had been installed north of the Türkiye–Syria border. As a result, the events were well recorded both near the fault and at rupture distances up to 582 km. We describe the available recordings and component-specific data processing performed with the aim of optimizing usable bandwidth. The resulting database includes 337, 365, 284, and 229 usable three-component recordings from the M7.81, M7.74, M6.81, and M6.37 events, respectively. We also present source, path, and site metadata that were compiled according to uniform protocols. Comparisons to a global ground motion model (GMM) for active tectonic regions and a local, Türkiye-specific model demonstrate the existence of complex path effects that result in relatively poor fits between the GMMs and observed data at large distances (generally R JB > 200 km). Under-predictions at some stations may be influenced by directivity and/or basin effects that affect the ground motions but that are not accounted for directly in the GMMs. We present analysis of spatial variability of several intensity measures. The residual maps produced from these analyses demonstrate that the global GMM overpredicts on the Anatolian block and underpredicts on the Arabian block, which is suggestive of distinct crustal attenuation features.
Introduction and project motivation
The 2023 Türkiye earthquake sequence occurred in a region known to have active faults and that was extensively instrumented north of the Türkiye–Syria border. Multiple large events were well recorded both near the fault and at distances up to 582 km. We describe available recordings as of the present date (June 2024); describe manual, component-specific data processing that was performed to optimize usable bandwidth; present metadata compiled using uniform protocols; compare data to a global ground motion model (GMM) for active tectonic regions and a local, Türkiye-specific model; and analyze spatial variability of several ground motion intensity measures (peak ground acceleration—PGA, peak ground velocity—PGV, 5%-damped pseudo-spectral acceleration—PSA—for 0.1, 0.3, 0.6, 1.0, 3.0, 6.0, and 10.0 s oscillator periods, Arias intensity—I A , and cumulative absolute velocity—CAV), which are useful for ground motion estimation at sites without recordings.
Several previous ground motion compilations have been presented since the 6 February 2023 mainshock (Baltzopoulos et al., 2023; Garini and Gazeta, 2023; Gülerce et al., 2023; Sandıkkaya et al. 2024), and the work presented in this article updates the work presented in Chapter 3 (Buckreis et al., 2023b) of the Earthquake Engineering Research Institute (EERI)- Geotechnical Extreme Events Reconnaissance (GEER) Association report on this event (Cetin et al., 2023). This work is different from other previous efforts for several reasons, including the use of later-released data from the Disaster and Emergency Management Authority (AFAD) network that corrects errors from earlier releases, the application of Next-Generation Attenuation (NGA) protocols for data processing and metadata compilation, and the presentation of data for four events that were of primary interest to reconnaissance teams (6 February M7.81, 6 February M6.81, 6 February M7.74, and 20 February M6.37 events). The data presented here were compiled for use by reconnaissance teams (Cetin et al., 2023), researchers engaged in NGA projects, and other interested researchers. The data are publicly available at https://doi.org/10.17603/ds2-t115-bk16 (Buckreis et al., 2023a).
Ground motion data and metadata
Ground motion data for the February 2023 Türkiye earthquake sequence was recorded by seismic networks operating mainly in Türkiye and Cyprus. The networks operating in Syria and Lebanon report having recordings from these events (Salah Sadek, personal communication), but the data have not been released to date. The AFAD in Türkiye operates the Turkish National Strong Motion Network (TNSMN) and the Turkish National Seismic Network (TNSN). The TNSMN is a strong motion network, consisting mainly of accelerometers, while the TNSN sensors are mainly broadband seismometers. TNSMN and TNSN station locations are typically distinct, with only a few collocated stations. These networks produced the majority of recordings from the earthquake sequence, including all of the near-fault records shown in Figure 1. The principal additional network is the Kandilli Observatory and Earthquake Research Institute, which operate stations mainly in northern parts of Türkiye.
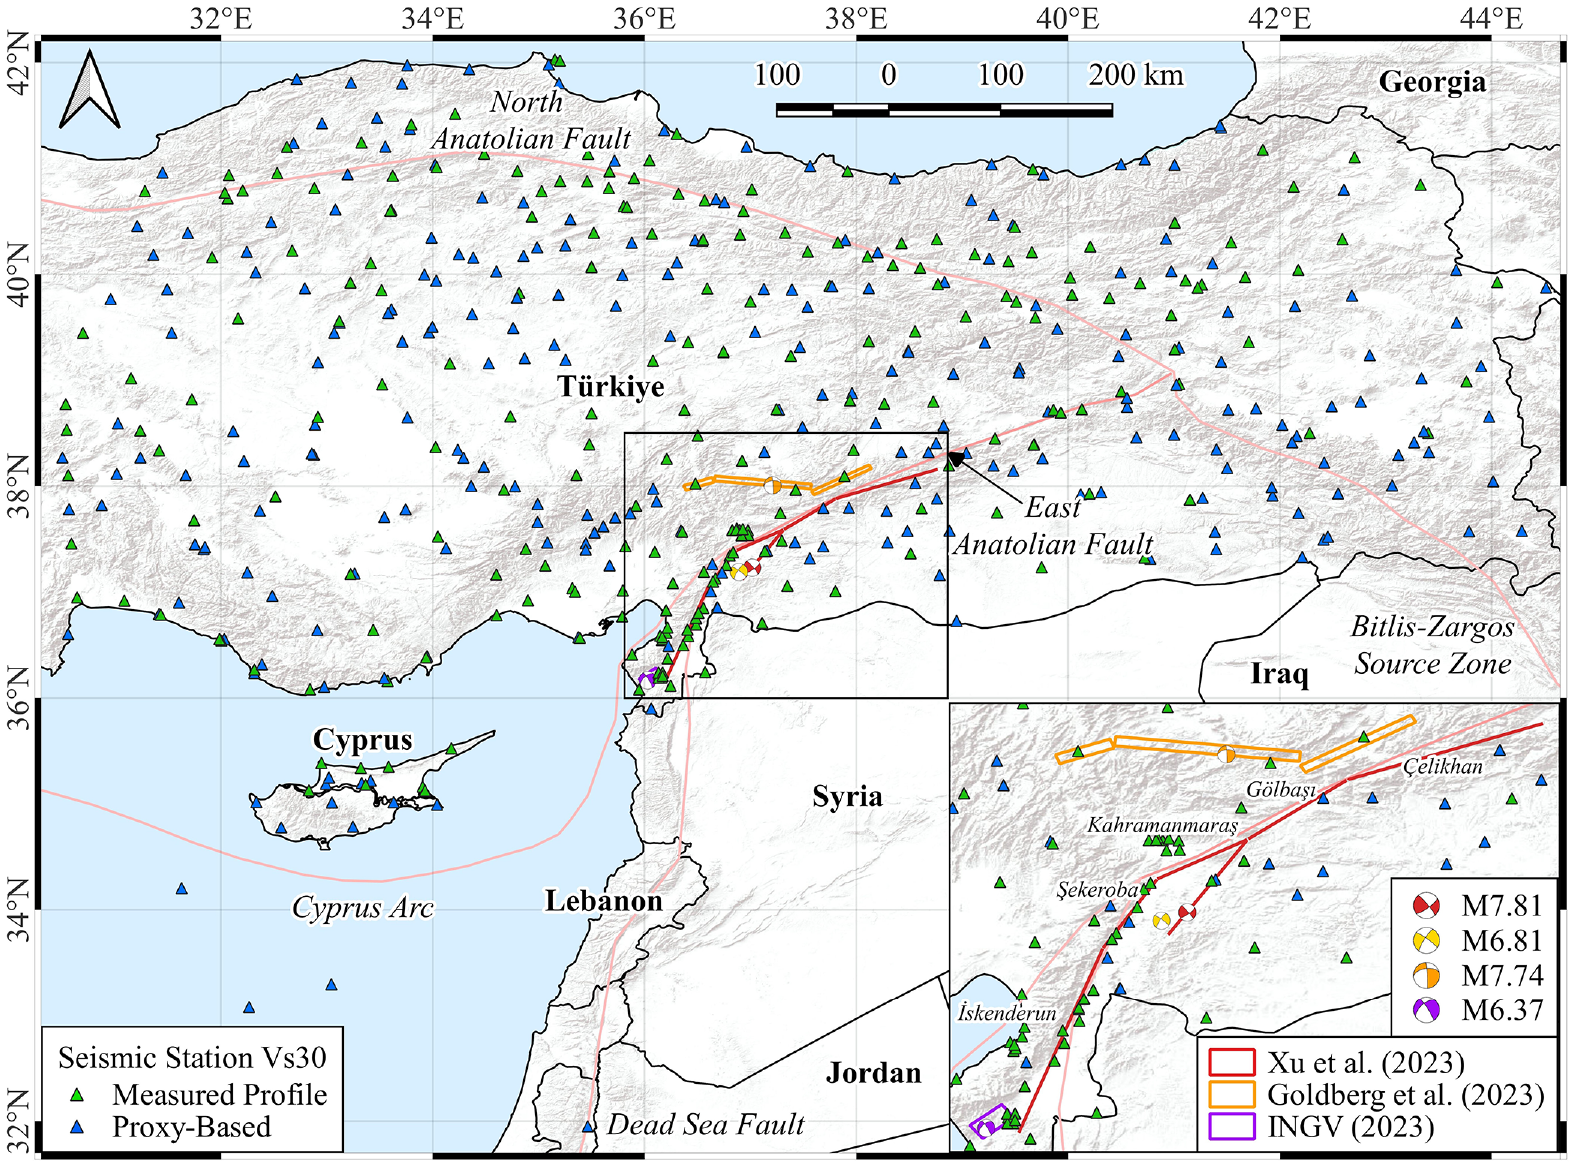
Map of Türkiye depicting locations and focal mechanisms of M7.81, M6.81, M7.74, and M6.37 earthquakes, and seismic stations that recorded usable ground motion data. Surface projections of finite-fault representations for the M7.81, M7.74, and M6.37 earthquakes are represented by red, orange, and purple polygons, respectively. Sites with V S30 assigned from measured V S profiles or from proxy-based models are shown by green and blue triangles, respectively.
Ground motion data
Raw (unprocessed) waveforms for each event were obtained from the Earthquake Data Center System of Türkiye (TDVMS; https://tdvms.afad.gov.tr/) and the Incorporated Research Institutions for Seismology (IRIS; Trabant et al., 2012). Data were initially screened to remove duplicate records. The main content of the current data set was downloaded in late March 2023, with a few records added in February 2024; these downloads replaced records accessed in February 2023 that had been partially processed and had baseline correction problems. An initial visual inspection was performed to identify and remove records with non-usable data, which include noise-dominated, unclear event signal, early termination, late trigger, instrument malfunction, and spike records.
Many of the recordings from the M7.81 event exhibited early termination, likely a result of power failure during the strong shaking. Ground shaking exceeded the upper amplitude limit of most seismometers (instrument code “H”) during the M7.81 and M7.74 events, so recordings for these events are mostly from accelerometers (instrument code “N”). Unfortunately, there were no usable recordings near Gölbaşı, Şekeroba, and Çelikhan, and few near İskenderun and Kahramanmaraş for the M7.81 and M7.74 events. Station TK 3112 in İskenderun is located in an area with observed liquefaction; however, it did not produce usable recordings for the M7.81 and M7.74 events. Few usable records were obtained in the source regions for the M6.81 and M6.37 aftershocks (near Türkoğlu and Antakya, respectively). At the time of writing, a total of 337, 365, 284, and 229 usable three-component records at stations as far as 571, 582, 497, and 492 km were identified for the M7.81, M7.74, M6.81, and M6.37 events, respectively.
Near-fault rupture waveforms for the M7.81 event sometimes included multiple wave packets. We did not attempt to separate these waveforms and chose to use the entire ground motion time-series during processing and intensity measure computations.
Signal processing
Each of the three-component records was processed individually according to standard protocols developed for NGA projects (e.g. Goulet et al., 2021). The procedure consists of applying a baseline correction and high-pass (and sometimes low-pass) Butterworth filters in the frequency domain. Corner frequencies are selected by visual inspection of the Fourier amplitude spectra (FAS), signal-to-noise ratio (SNR), and reasonableness (lack of wobble) of displacement time-series. The lowest high-pass corner frequency that satisfies a minimum SNR threshold and produces a displacement time-series without wobble is selected.
This procedure removes any static displacement that might otherwise be present in near-field records, which is the case for records within approximately 40–70 km of the M7.81 and M7.74 events. Processing that includes preservation of the fling is not presented in this article. When using standard processing that does not allow for permanent displacement with records for which such displacements are present, unique challenges arise in the selection of high-pass corner frequencies,
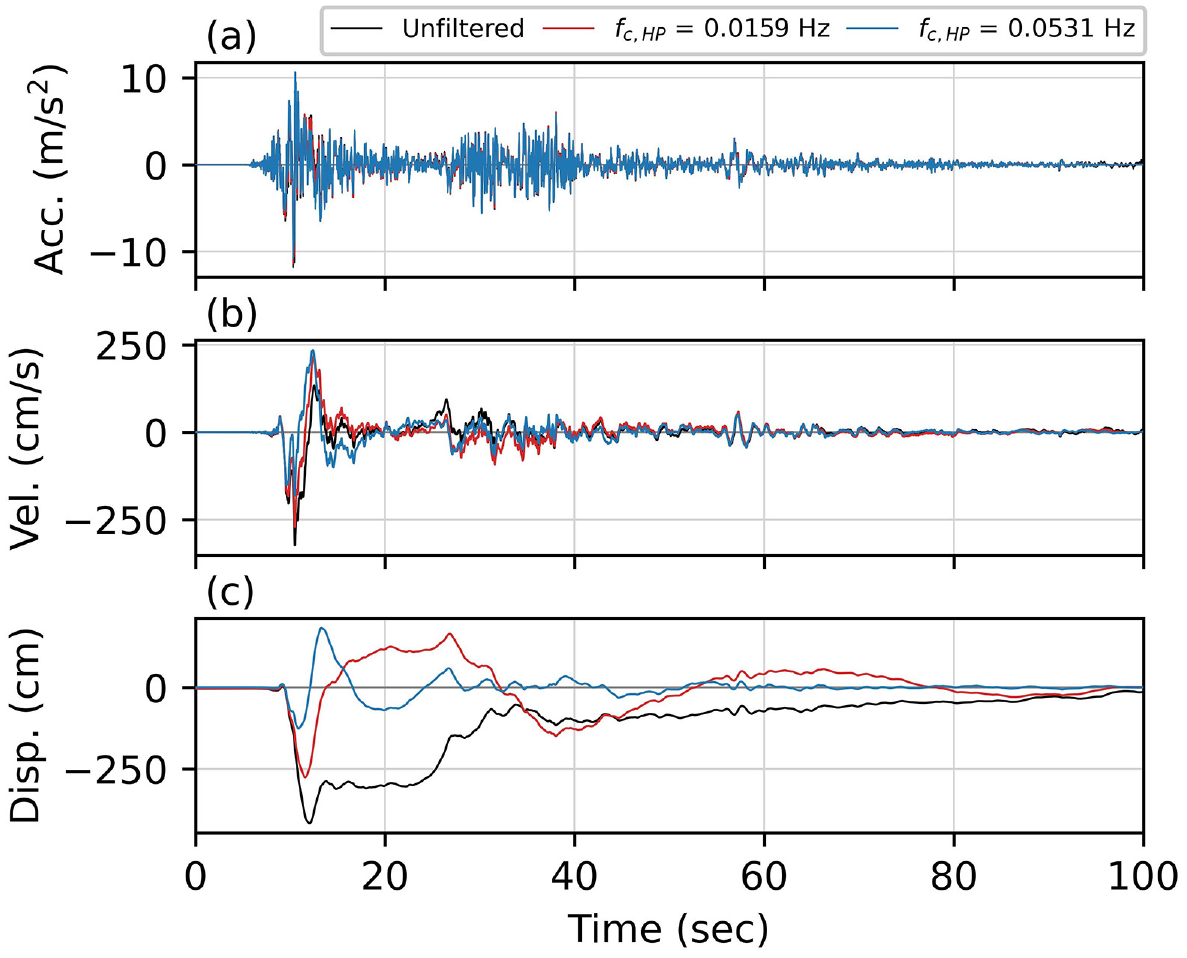
Example time-series plots illustrating sensitivity to the high-pass corner frequency selected for the north component of station TK 4615 from the M7.81 mainshock: (a) acceleration, (b) velocity, and (c) displacement.
In each plot, time-series are shown for the unfiltered record, and the record subjected to a relatively modest high-pass filter (
As illustrated in Figure 2, there are different objectives that guide the selection of
The longest usable period of the ground motion is defined as T ≤ 1/(1.25 fc,HP), where fc,HP is the greater of the two horizontal high-pass corner frequencies selected during signal processing for combined horizontal components (e.g. RotD50 as defined in Boore, 2010). Figure 3 presents the number of usable combined horizontal components as a function of oscillator period for the four considered events. The M6.37 and M6.81 events have a more rapid rate of decay of usable records with period for T > 5 s than the M7.81 and M7.74 events, which results from the reduced long-period energy from these smaller magnitude events. The reduced long-period energy increased the likelihood that records will be noise-dominated at these long periods.
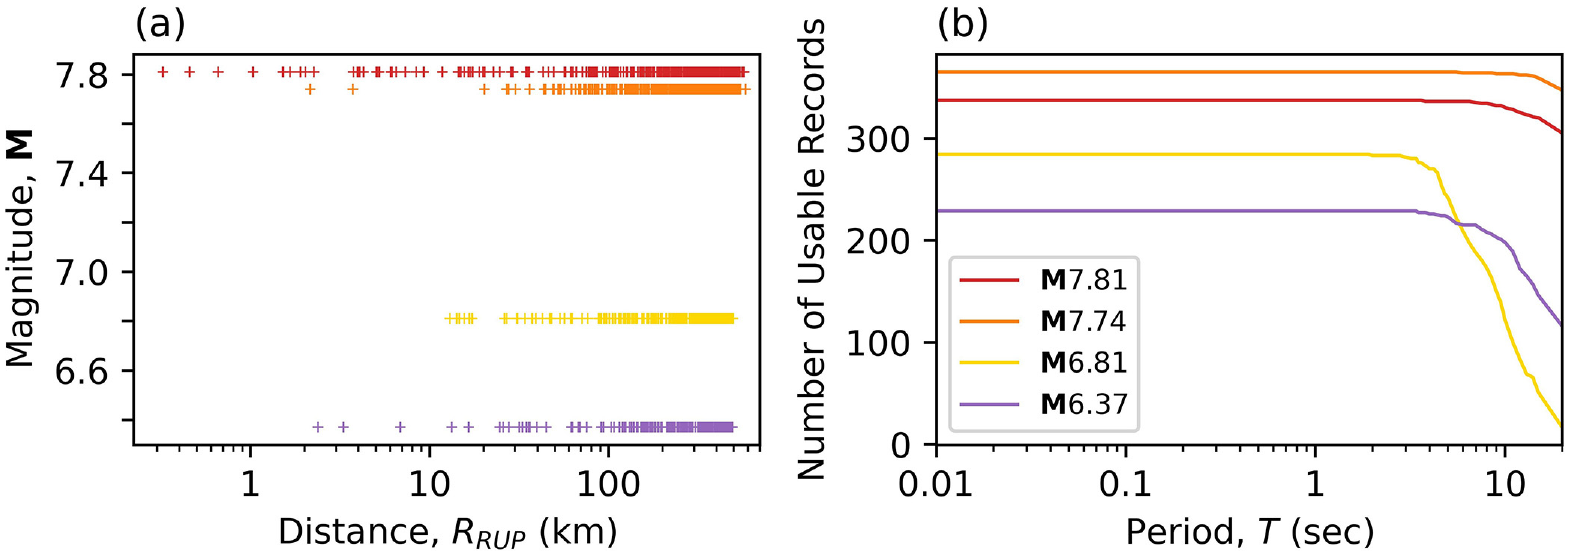
(a) Distribution of records with usable data with respect to magnitude and rupture distance; (b) number of usable records versus period for each event. Longest usable period defined as T ≤ 1/(1.25 fc,HP), where fc,HP is the greater of the two horizontal high-pass corner frequencies.
The rate of decay for the M6.81 event also reflects challenges in selecting appropriate values for fc,HP, because most records contained no pre-event noise due to the occurrence of an M5.7 aftershock 82 s prior to the M6.81. The relative spatial and temporal proximity of this smaller aftershock meant that many sites were still experiencing shaking when the waveforms from the M6.81 event arrived. During processing for this event, we assume the noise to be stationary and utilize noise windows prior to the M7.81 event (~10 min before the M6.81 event) to compute SNR, as described in Buckreis et al. (2023b). The displacement wobble check for recordings of this event was especially challenging due to the residual shaking from the M5.7 event; therefore, fc,HP selections for this event erred on the side of conservatism.
Source and path metadata
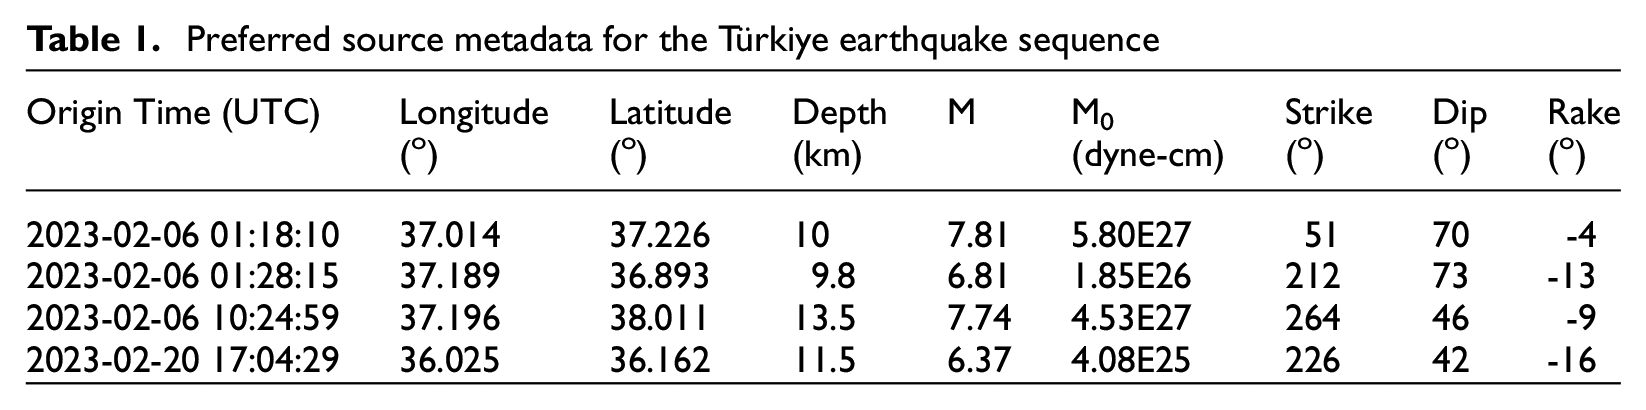
Source metadata are assigned using NGA protocols (e.g. Goulet et al., 2021). The Global Centroid Moment Tensor (CMT) project (Ekström et al., 2012) origin times, seismic moments, and nodal plane solutions are preferred because they are derived using global recordings that average out radiation pattern variability and provide between-region consistency. However, CMT hypocenter locations correspond to the center of the earthquake moment distribution in time and space, which may not align well with the location of the initial slip. Therefore, preferred hypocenter locations are adopted from the USGS National Earthquake Information Center (NEIC). Table 1 summarizes the compiled moment tensor metadata for each event. The strike, dip, and rake angle provided in Table 1 are based on the solution plane that best aligns with the known orientation strike of the East Anatolian Fault.
Preferred source metadata for the Türkiye earthquake sequence
Multiple finite-fault models (FFMs) for the M7.81, M7.74, and M6.37 events are available. We follow NGA criteria from Contreras et al. (2022) to evaluate alternate FFMs for each event, which led to the selection of the FFMs described by Xu et al. (2023) for the M7.81 event, Goldberg et al. (2023) for the M7.74 event, and the National Institute of Geophysics and Volcanology of Italy (INGV; 2023) for the M6.37 event. The FFMs for the two large events were selected because they were developed with consideration of different types of data (e.g. global teleseismic waveforms, local seismic data, and permanent crustal displacements), and produce rupture locations compatible with observed surface rupture (Kozaci et al., 2023). The Xu et al. (2023) model was applied without trimming, whereas the Goldberg et al. (2023) and INGV (2023) models were trimmed following standard NGA procedures. Simulations are used to develop a rupture surface for the M6.81 event, as outlined in Chiou and Youngs (2008) and Contreras et al. (2022). Table 2 summarizes the rupture surface representations for each event.
Summary of rupture surface representations for each event
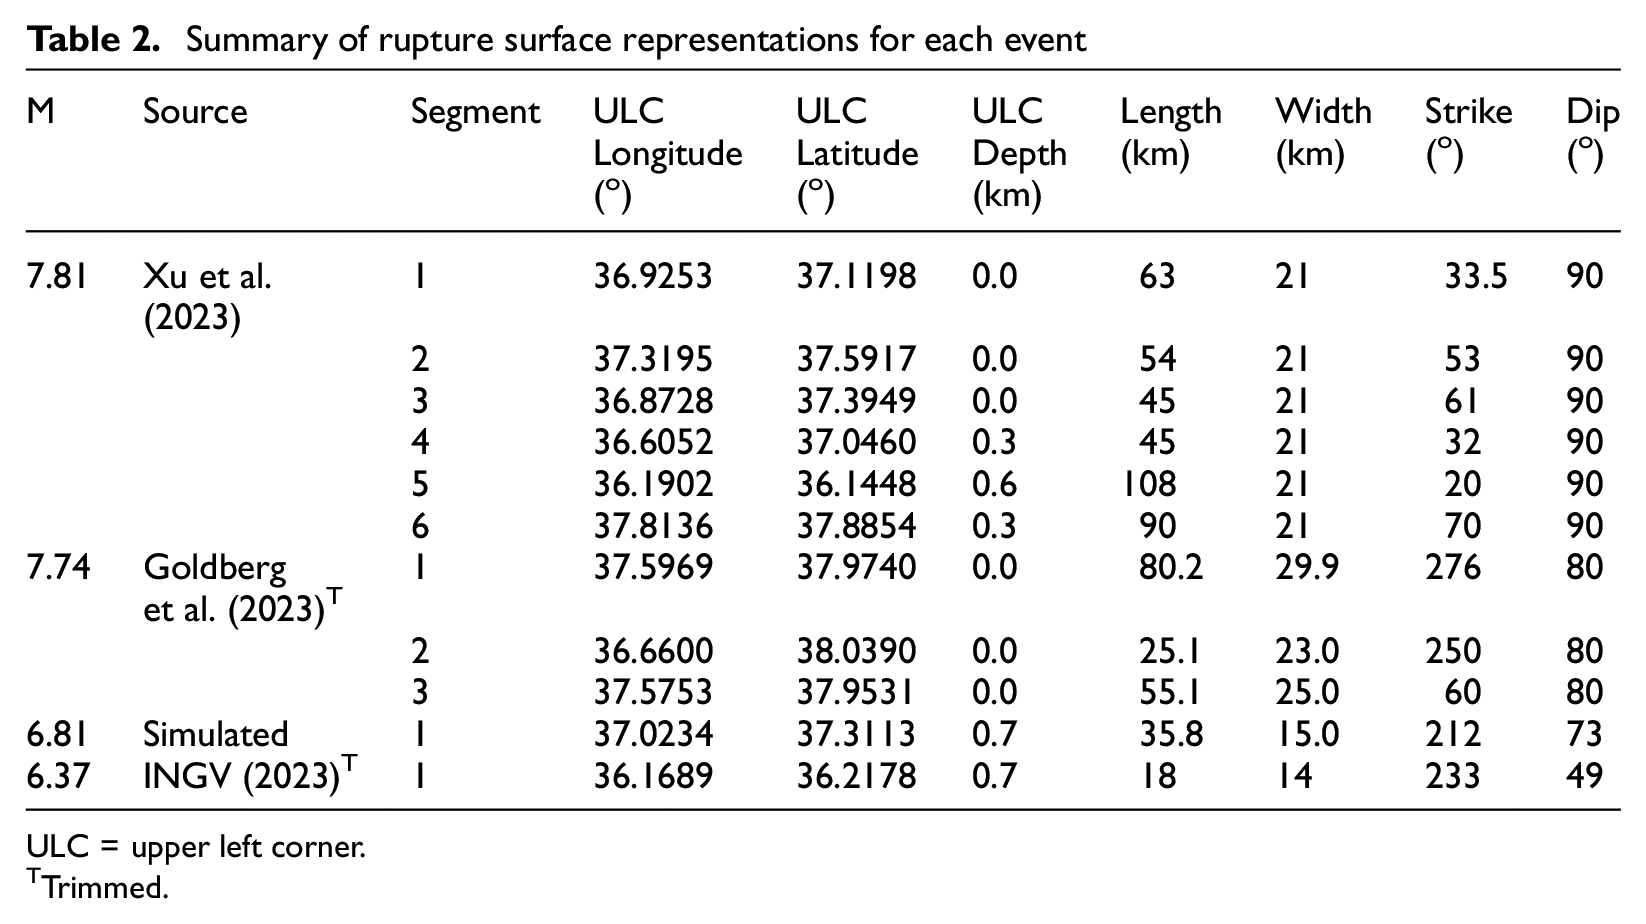
ULC = upper left corner.
Trimmed.
Source-to-site distances were evaluated using the finite rupture surfaces from Table 2 using the P4CF routine (Chiou, 2021). The P4CF routine was adapted for use with the geometrically complicated ruptures for the M7.81 and M7.74 events by computing distances for each segment separately and then selecting the minimum such distance. Recorded distance metrics include the closest distance from the site to any point on the rupture surface (R RUP ), closest distance from the site to any point on the surface projection of the rupture surface (R JB ), distance measured perpendicular to the fault strike from the surface projection of the top edge of the rupture surface (R x ), distance measured parallel to the fault strike from the midpoint of the surface projection of the rupture surface (R y ), the average distance to the fault plane (Chiou et al. 2000; Ohno et al. 1993) (R avg ), the epicentral distance (R epi ), and the hypocentral distance (R hyp ).
Site metadata
Values of time-averaged shear wave velocity in the upper 30 m of the site (V S30 ) were compiled for each distinct site. The AFAD website reports V S30 values computed from V S profiles measured using geophysical techniques (MASW and ReMi) for 229 of the stations, as shown in Figure 1. V S30 values at 24 of those stations (TK 0125; TK 0201; TK 0603; TK 1201; TK 2401; TK 2518; TK 3113; TK 3116; TK 3133; TK 3143; TK 3144; TK 3301; TK 3801; TK 4614; TK 4628; TK 5001; TK 5201; TK 5505; TK 5508; TK 5801; TK 5804; TK 6004; TK 6302 and TK 6901) were updated relative to those on the AFAD website. These updates were motivated by some errors (specifically, inconsistencies with the 1D layered earth models at some stations). The corrections of these errors adjusted the V S profiles and the V S30 values.
Proxy-based V S30 models were used to assign V S30 values at locations without a measured V S profile. For stations in Türkiye, two proxy relationships were used: (1) the Zhou (2023) proxy model based on topographic slope and (2) the Sahin et al. (2024) geology- and topography-based proxy models. In the case of the Zhou (2023) model, estimates are adjusted using kriging interpolation of V S30 values from measured V S profiles. The proxy relationship applied for each site is recorded in the station-site metadata file provided by Buckreis et al. (2023b). Outside of Türkiye, V S30 values are assigned using the topographic slope-based proxy model proposed by Wald and Allen (2007).
Analysis of ground motion data
Comparisons of data to global and local GMMs
We compare recorded data to the following GMMs for shallow crustal earthquakes in tectonically active regions: (1) a global model—Boore et al. (2014; hereafter BSSA14) and (2) a Türkiye-specific model by Kale et al. (2015; hereafter KAAH15). The BSSA14 model can be applied with or without regional adjustments of the rate of anelastic attenuation, which is relatively low in this GMM for Türkiye and China (slower attenuation) and relatively high for Italy and Japan (faster attenuation). Without a regional adjustment, the model is considered applicable in other active crustal regions for which validation was performed, which are California, New Zealand, and Taiwan.
The GMMs provide predictions of ground shaking intensity given M, rupture mechanism/style-of-faulting (strike-slip for all events considered), R JB , and V S30 . BSSA14 has a model component that adjusts ground motions for the effects of V S iso-surface depths (i.e. z1.0); however, given that this site parameter is unavailable for the vast majority of sites, we choose not to apply any basin adjustments during this analysis (i.e. the differential depth δz1.0 = 0).
Figure 4 shows the distance-dependence of RotD50 PGA, PGV, and PSA (1.0 s) for the M7.81, M7.74, M6.81, and M6.37 events. Recorded data are subdivided into three site groups: (1) rock (V S30 ≥ 760 m/s), (2) stiff soil (360 ≤ V S30 < 760 m/s), and (3) soft soil (V S30 < 360 m/s). The median predictions shown for each of the GMMs are for a V S30 = 360 m/s site condition. All GMMs fit the observed PGA data reasonably well out to distances of about 200 km. For PGV and PSA (1.0 s), the global and Italian regionalized versions of BSSA14 are nearly identical and fit the data better than the Türkiye-specific model (KAAH15) up to distances of approximately 100 km. At larger distances, the regional components of BSSA14 significantly affect predictions, with Italian and Türkiye versions attenuating faster and slower, respectively. At these larger distances, the global and Italian models fit the data better than the Türkiye model, which overpredicts. The KAAH15 GMM significantly underpredicts PGV in the near-field. Although the model includes an anelastic attenuation term in its functional form, the amount of anelastic attenuation is small, causing it to over-predict PGV and PSA (1.0 s) at far distances (100–200 km).
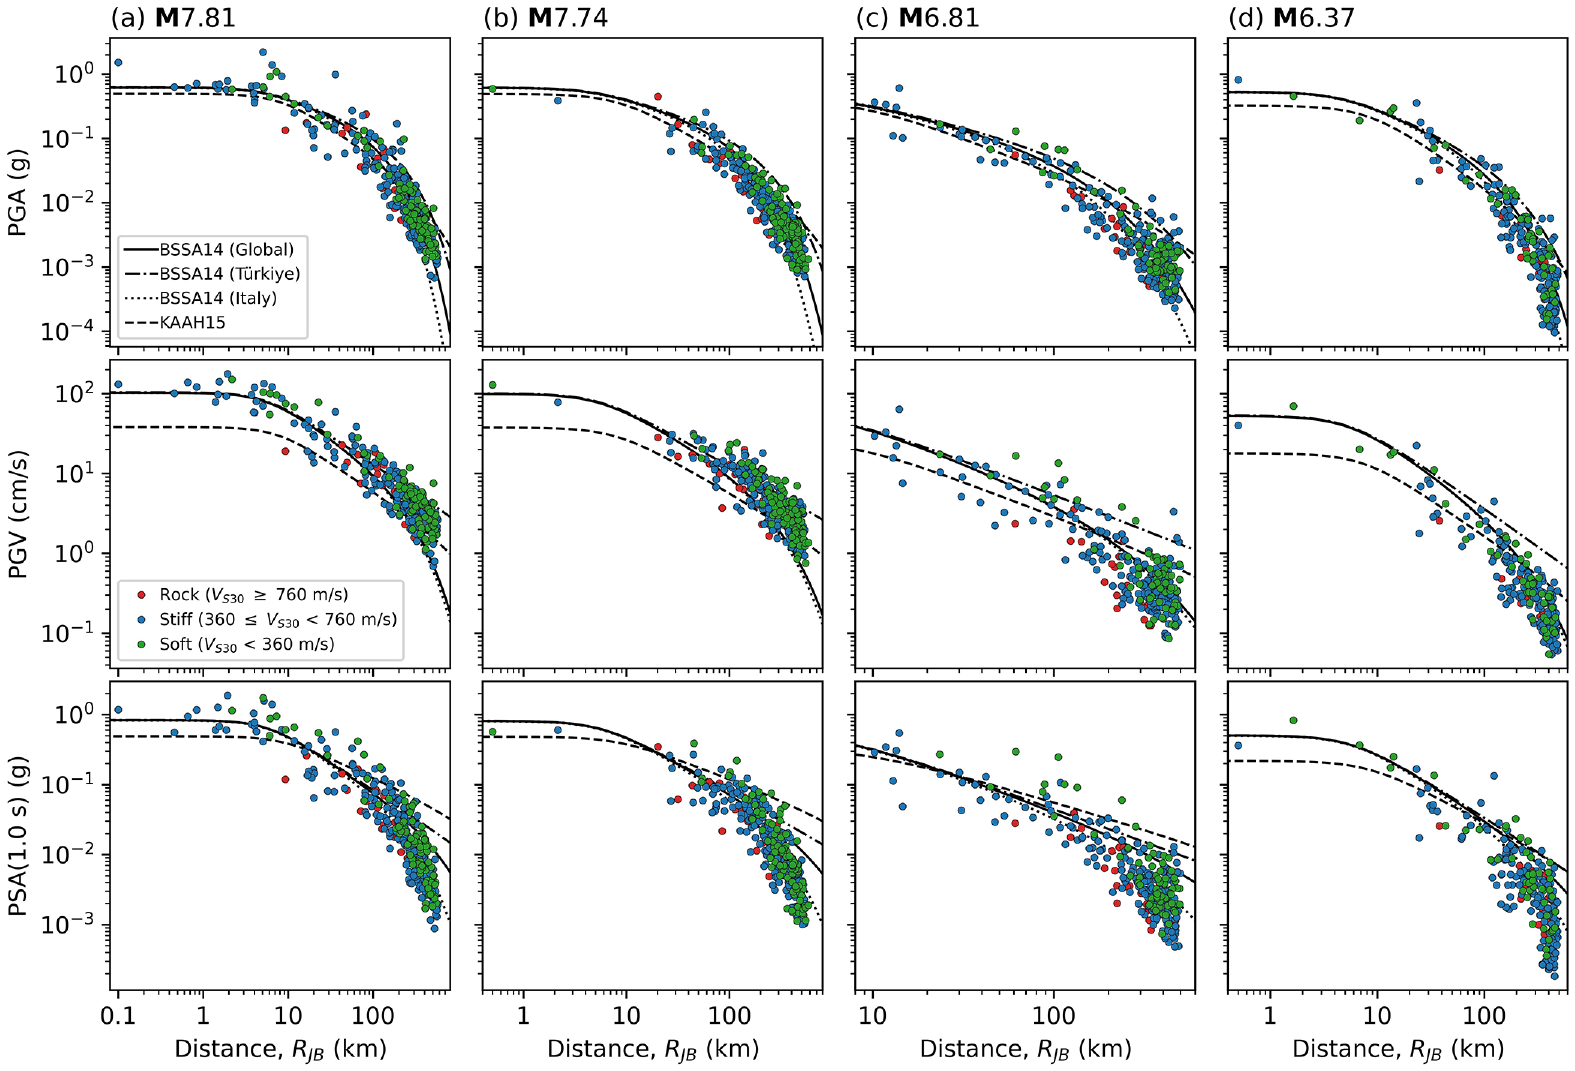
Observations versus distance colored by site condition (rock, stiff soil, or soft soil) for (a) M7.81, (b) M7.74, (c) M6.81, and (d) M6.37 events. Predictions shown for global BSSA14, regional BSSA14, and KAAH15 GMMs for a V S30 of 360 m/s.
The poor predictions of the BSSA14 model with the Türkiye regional adjustment may initially be surprising. However, the Turkish data considered in the development of that model were mainly from the northern part of Türkiye, near the North Anatolian Fault. This region corresponds to the Eurasian and Anatolian plates, whereas the present data are in the south of Türkiye near the interface of the Anatolian and Arabian plates (Figure 1). The results suggest that different crustal properties are encountered in the two parts of Türkiye, which is analyzed further in the “Spatial analysis” section of the article. For subsequent analyses, we use the global version of the BSS14 model, which predicts average rates of attenuation.
To better evaluate GMM performance relative to the data, we compute total residuals (R ij ), considering the appropriate path and site conditions as follows:

where Y
ij
is the value of the observed ground motion intensity measure (e.g. PGA) for event i from station j, and
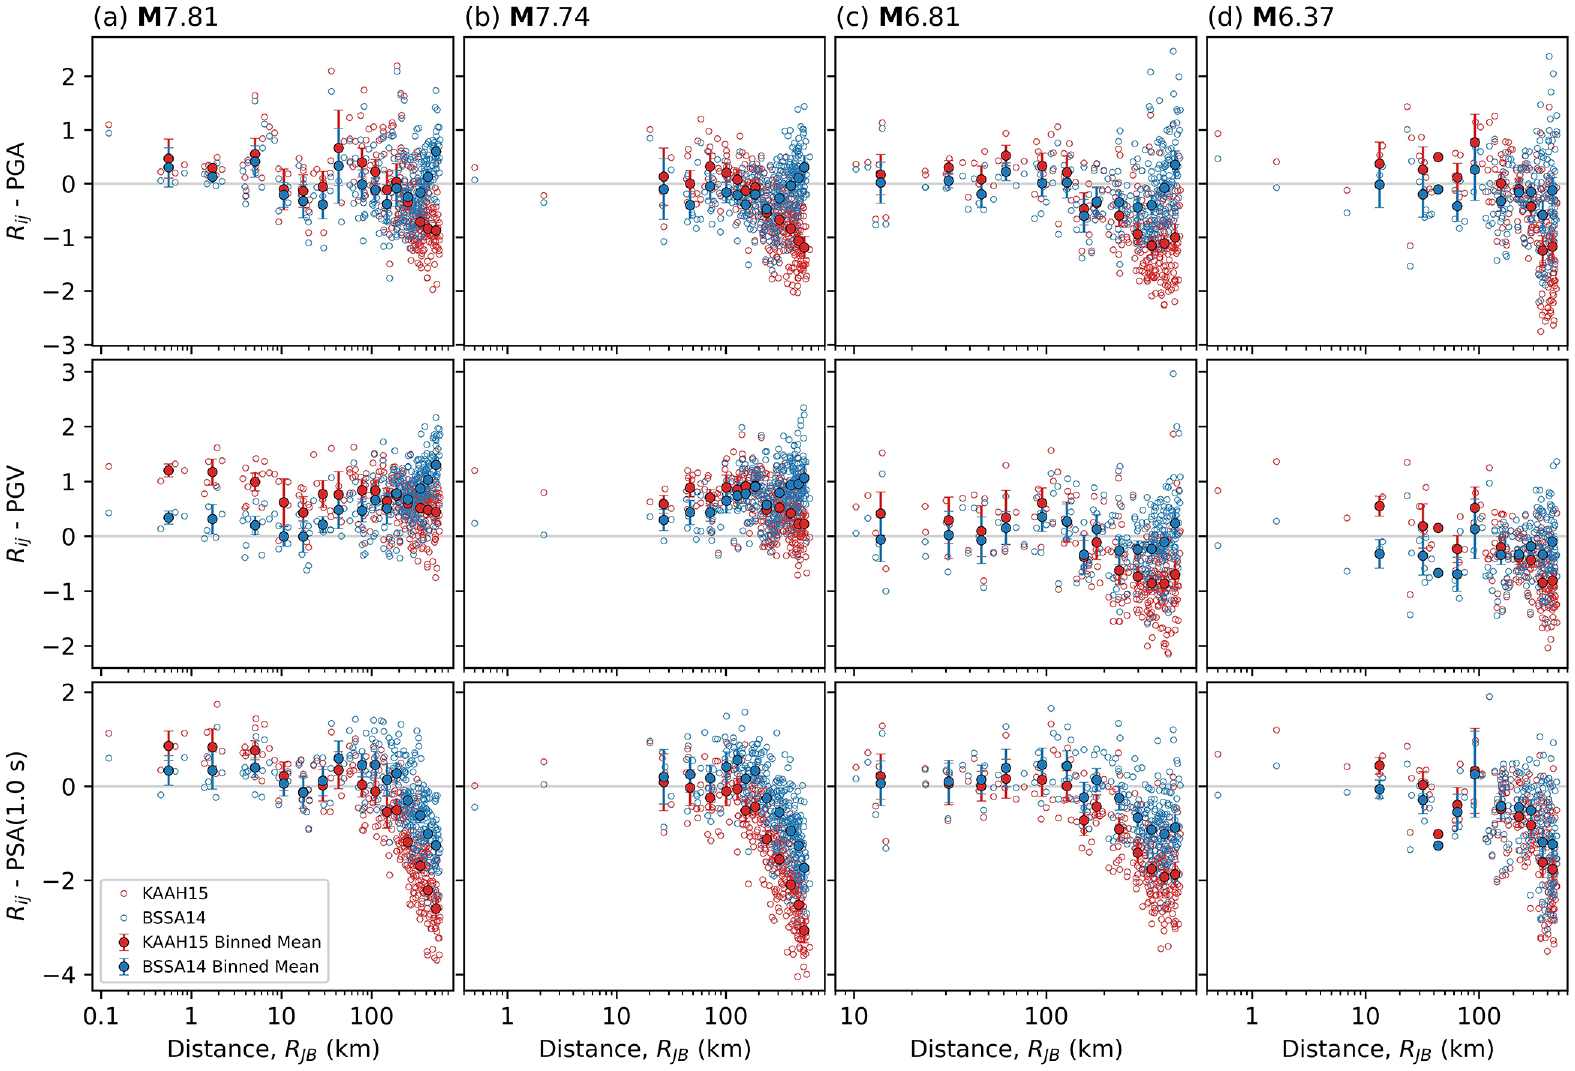
Total residuals (R ij ) versus distance for (a) M7.81, (b) M7.74, (c) M6.81, and (d) M6.37 events. Residuals computed for PGA, PGV, and PSA (1.0 s) for the global BSSA14 and KAAH15 GMMs.
The residuals shown in Figure 5 reflect the combined impact of potential differences between the data and GMMs related to source, path, and site effects. Residual amplitudes at short distances are generally indicative of source effects, whereas the general trend of R ij against R JB reflects path effects. Site effects cannot be easily interpreted from plots of R ij versus R JB . The trends observed in Figure 5 support the initial observations drawn from Figure 4, namely the existence of complex path effects that result in relatively poor fits between the GMMs and data at large distances, generally R JB > 200 km (e.g. downward- or upward-trending residuals with distance suggesting higher or lower rates of attenuation, respectively). In general, BSSA14 performs the best at distances less than approximately 200 km, beyond which uncaptured path effects are apparent. KAAH15 performs comparably, except for a tendency to under-predict PGV over a wide distance range, and the other intensity measures at short-to-moderate distances.
Event terms (
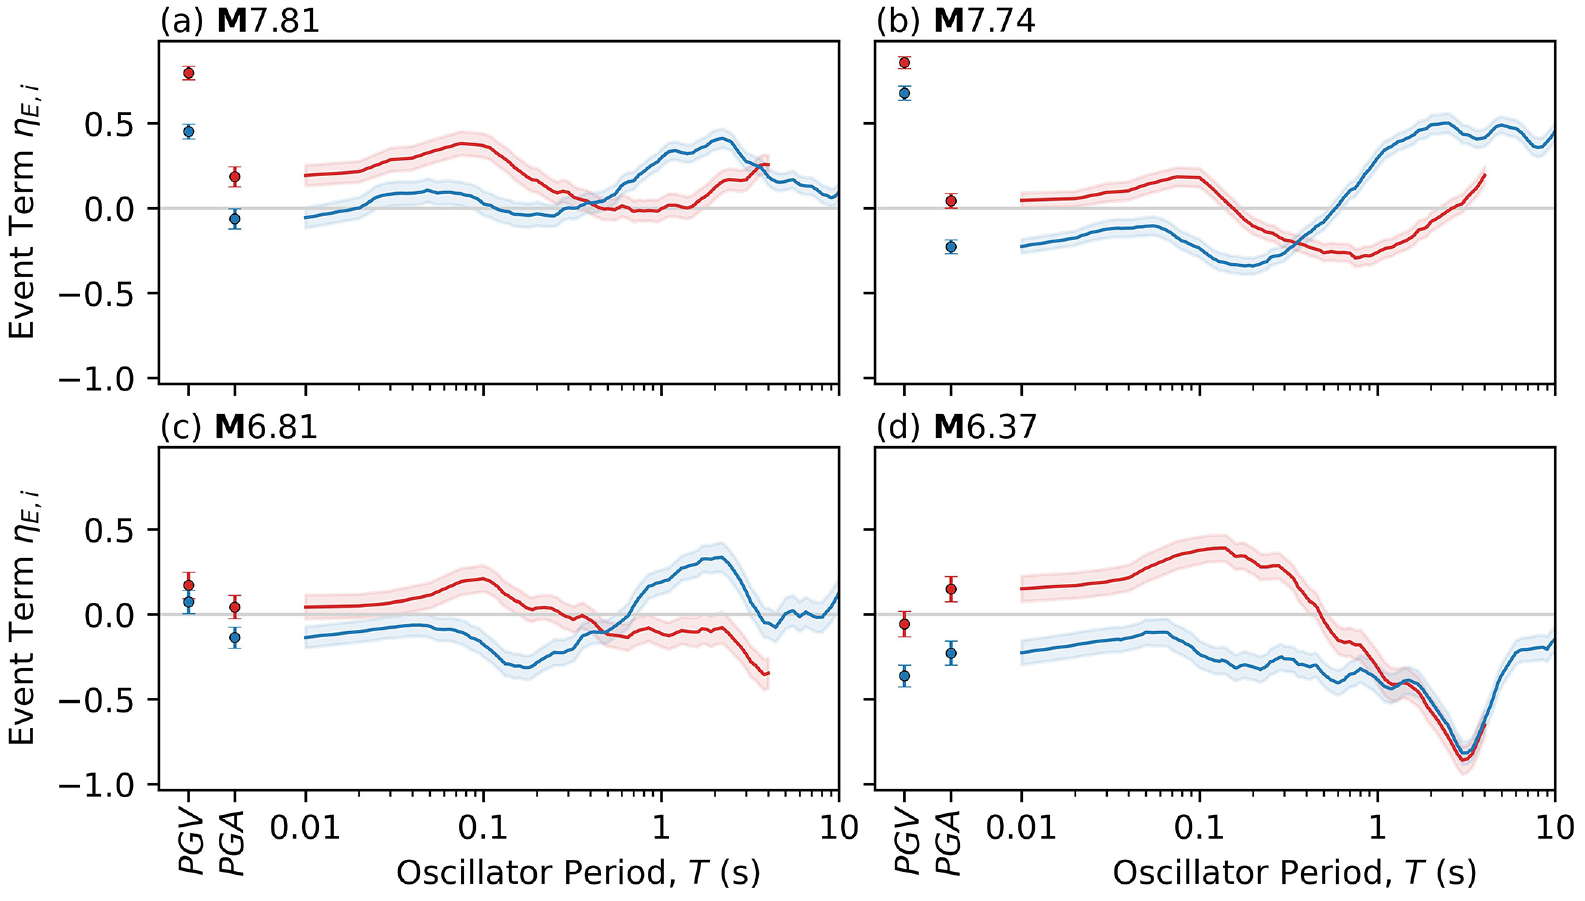
Event terms (
Spatial analysis
Correlation models are developed to characterize the spatial pattern of within-event residuals (

The

The

where:


and
Bayesian inference is used to estimate the model coefficients
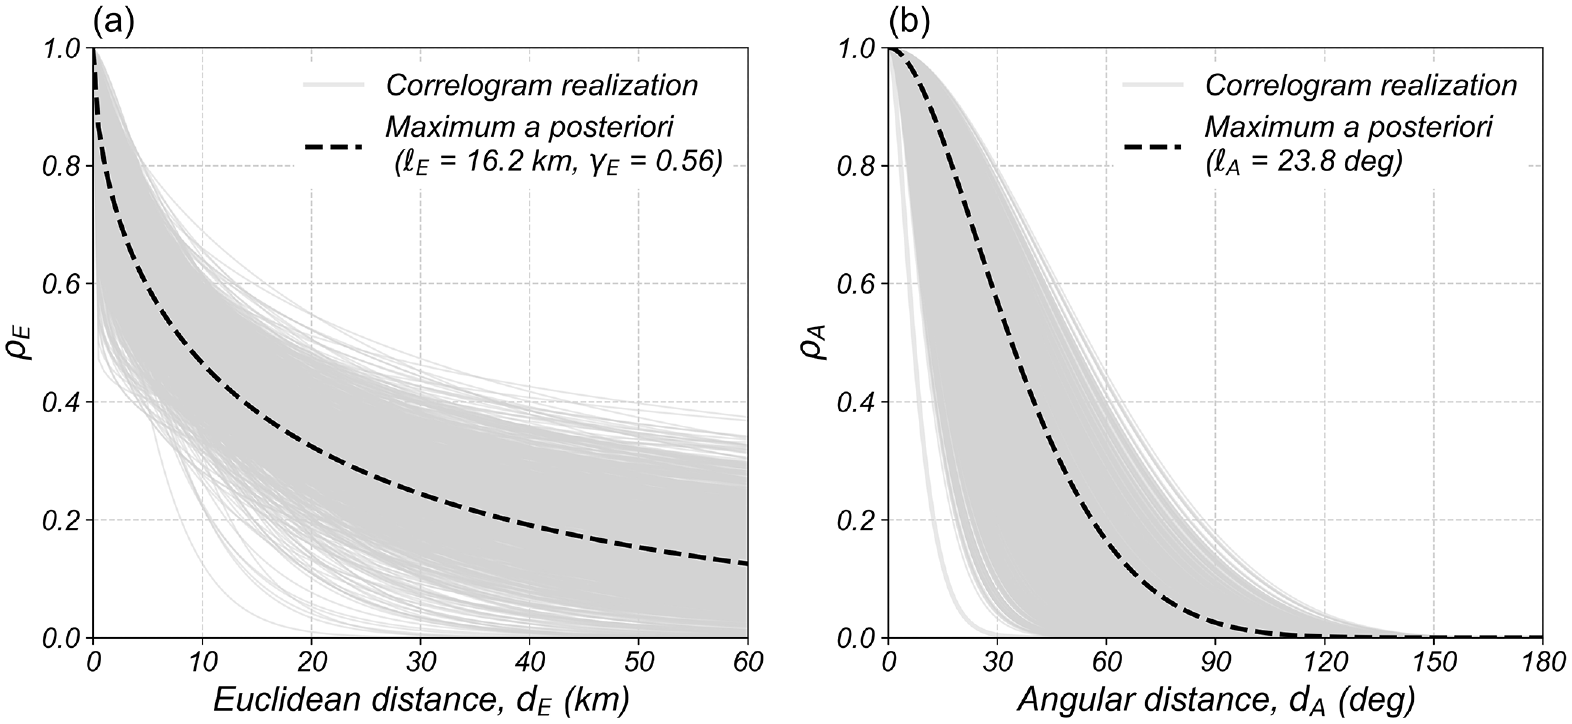
Bayesian correlation models for peak ground acceleration (PGA) within-event residuals from the M7.81 mainshock. (a) Correlation models dependent on the Euclidean distance (
The correlation models are applied with ordinary Kriging to estimate the mean δW
ij
at unsampled locations (
Figures 8 and 9 present the derived
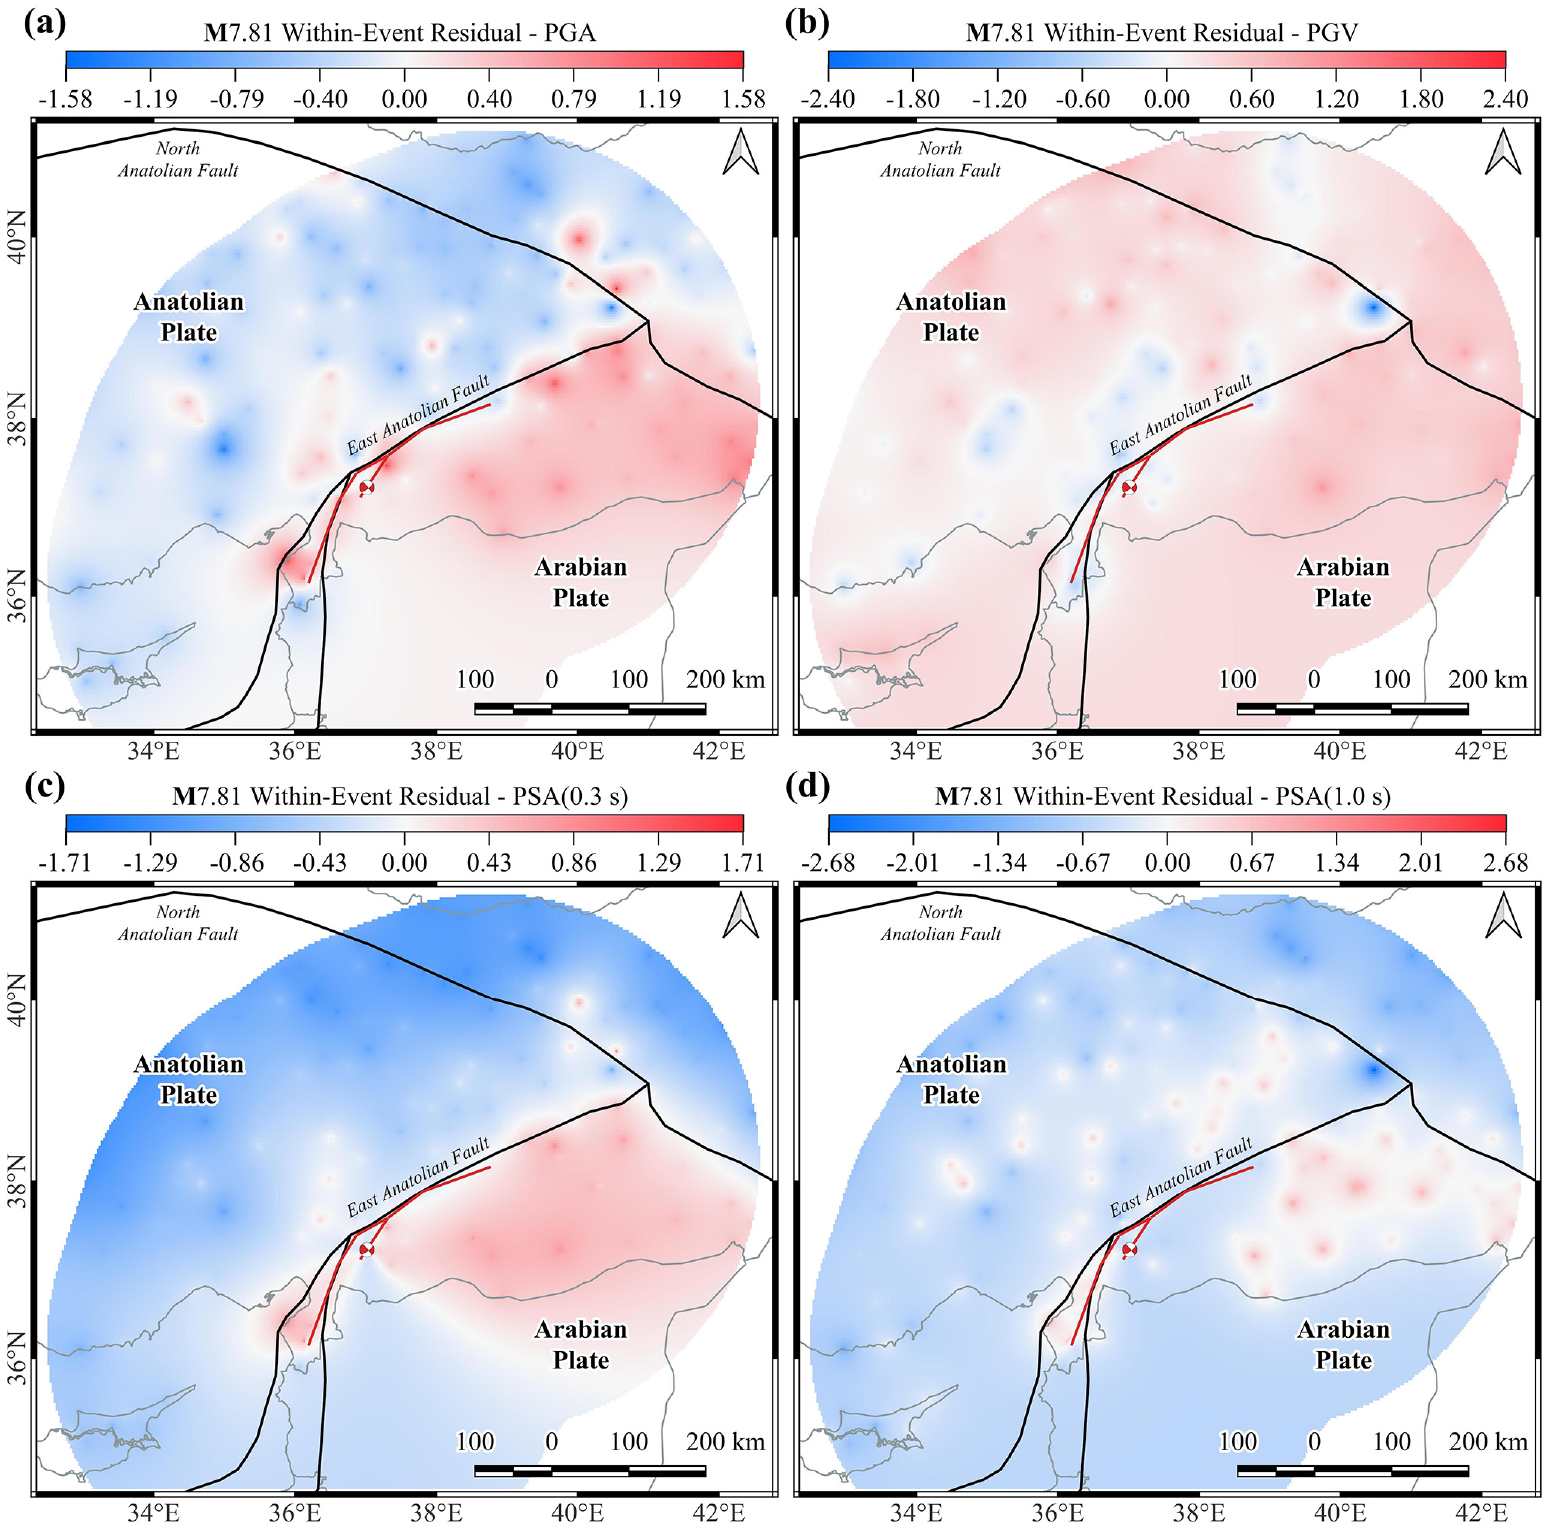
Mean within-event residual for (a) PGA, (b) PGV, (c) PSA (0.3 s), and (d) PSA (1.0 s) from the M7.81 mainshock developed using the maximum a posteriori correlation models. Blue and red shading indicate areas of weaker- and stronger-than-average ground motions, respectively. Non-shaded areas are beyond the usable distance range of the BSSA14 GMM.
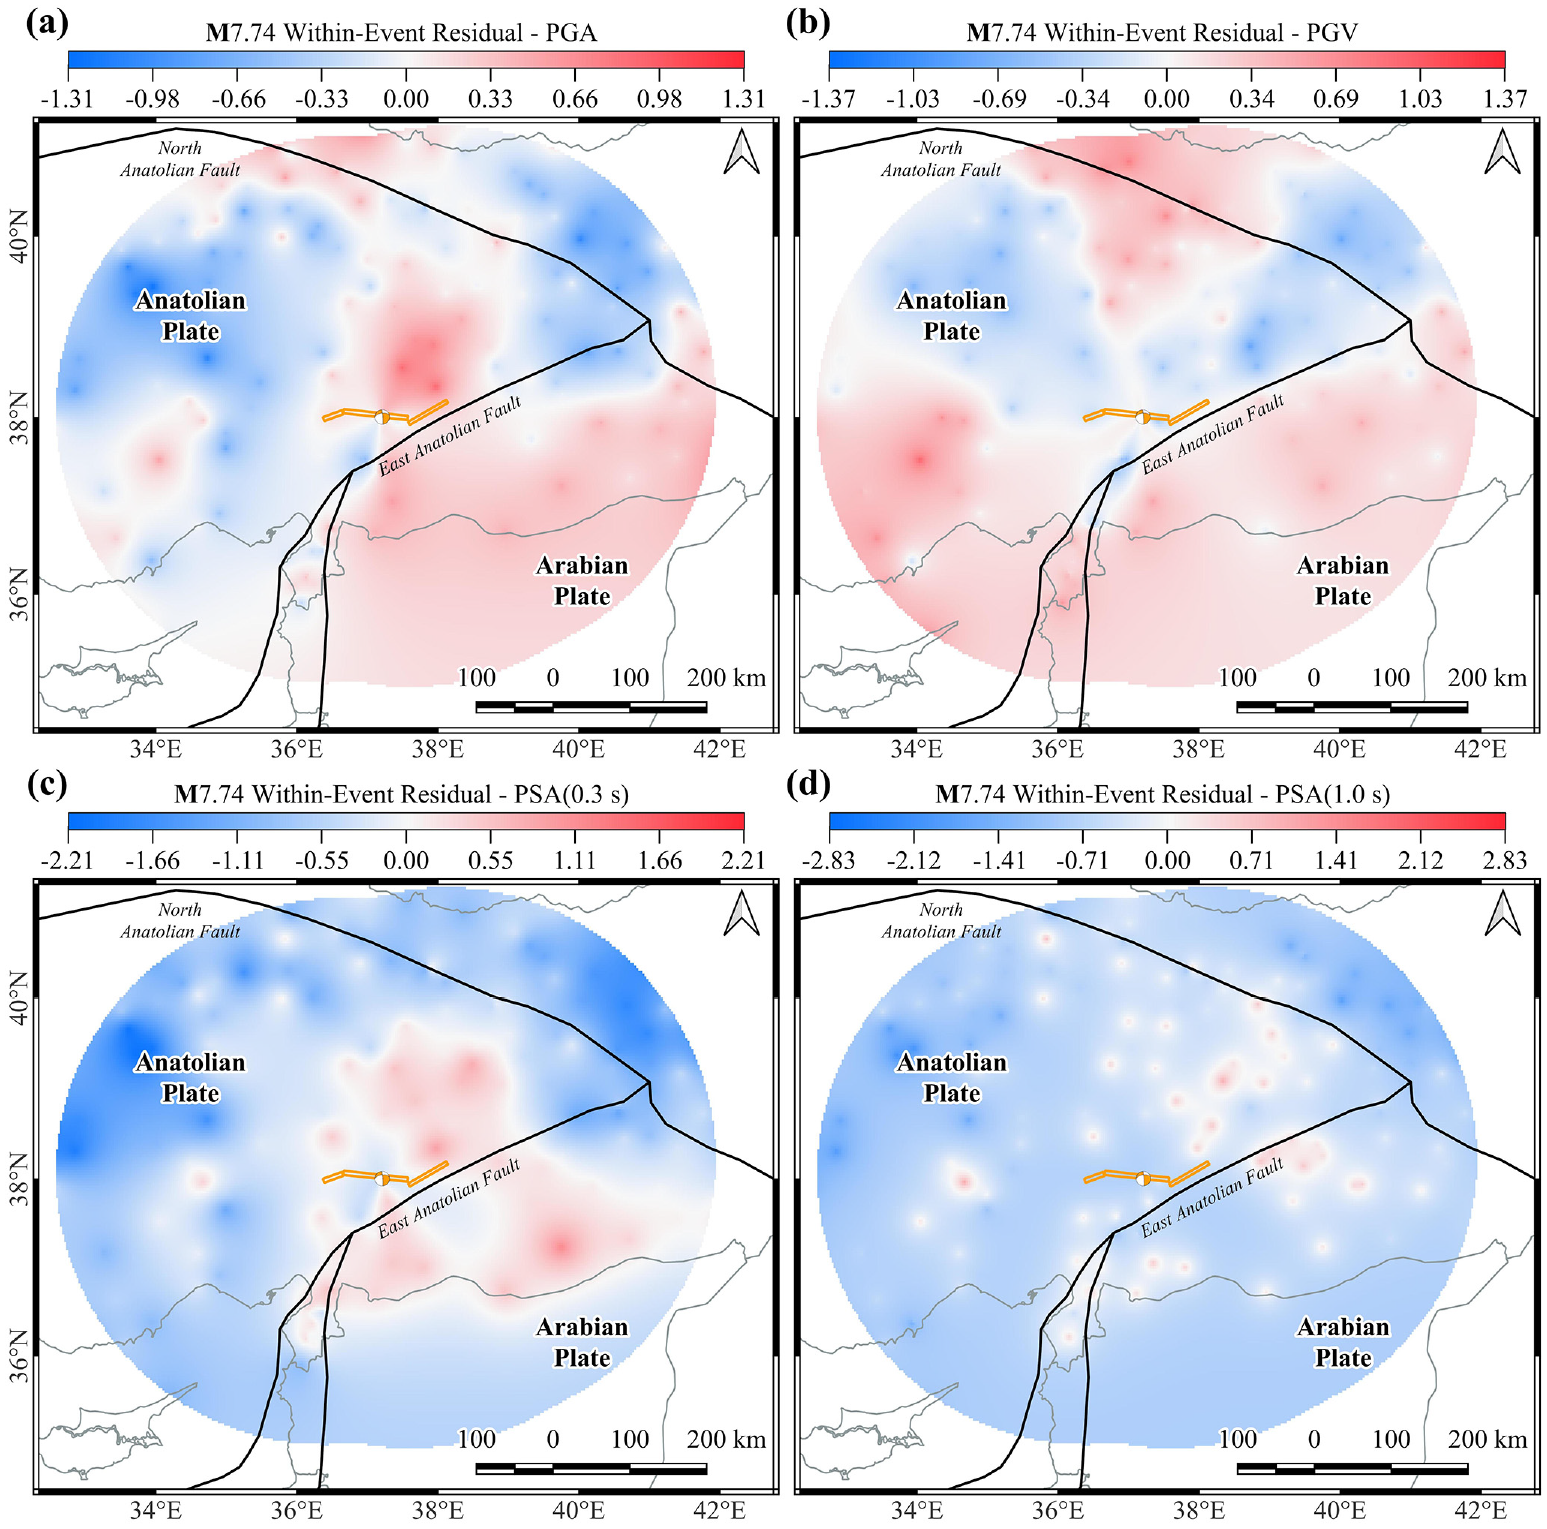
Mean within-event residual for (a) PGA, (b) PGV, (c) PSA (0.3 s), and (d) PSA (1.0 s) from the M7.74 event developed using the maximum a posteriori correlation models. Blue and red shading indicate areas of weaker- and stronger-than-average ground motions, respectively. Non-shaded areas are beyond the usable distance range of the BSSA14 GMM.
Ground motion estimation procedure
Mean ground motion estimates (

where the computation of
Summary and conclusions
This article presents the ground motion data and spatial correlation models for four events of the February 2023 Türkiye earthquake sequence. The processed ground motion data and metadata are accessible at Buckreis et al. (2023b), and correlation models are available at Pretell et al. (2024b). This data will be influential for future GMM development efforts and used as validation data for ground motion simulations, among other applications. Comparisons of ground motion data to global and local GMMs suggest the existence of event-specific effects and complex path effects in the region, uncaptured by the existing models. Spatial analysis of the within-event residuals suggests that the complex attenuation features are likely related to differences in crustal properties between the Anatolian and Arabian plates.
Supplemental Material
sj-pdf-1-eqs-10.1177_87552930241259024 – Supplemental material for Engineering attributes of ground motions from February 2023 Türkiye earthquake sequence
Supplemental material, sj-pdf-1-eqs-10.1177_87552930241259024 for Engineering attributes of ground motions from February 2023 Türkiye earthquake sequence by Tristan E Buckreis, Renmin Pretell, M Abdullah Sandikkaya, Özkan Kale, Aysegul Askan, Scott J Brandenberg and Jonathan P Stewart in Earthquake Spectra
Footnotes
Acknowledgements
The authors thank Baran Güryuva, Abdullah Içen, Oğuz Okçu, Abdullah Altindal, and Mehmet Fırat Aydin for their assistance in curating the ground motion data and metadata. The authors thank Emel Seyhan and one anonymous reviewer for their input on this article.
Declaration of conflicting interests
The author(s) declared no potential conflicts of interest with respect to the research, authorship, and/or publication of this article.
Funding
The author(s) disclosed receipt of the following financial support for the research, authorship, and/or publication of this article: Funding for this study included support from the California Department of Transportation, award 65A0780 (NGA-West3). This work was initiated in support of the GEER Association response to the event sequence; GEER is supported in part by the National Science Foundation through the Engineering for Civil Infrastructure Program under Grant No. CMMI-1826118. The authors gratefully acknowledge this support. The views and conclusions in this paper are those of the authors and do not reflect the official policies of the State of California or the National Science Foundation.
Supplemental material
Supplemental material for this article is available online.
References
Supplementary Material
Please find the following supplemental material available below.
For Open Access articles published under a Creative Commons License, all supplemental material carries the same license as the article it is associated with.
For non-Open Access articles published, all supplemental material carries a non-exclusive license, and permission requests for re-use of supplemental material or any part of supplemental material shall be sent directly to the copyright owner as specified in the copyright notice associated with the article.