
Abstract
Model development in the Next Generation Attenuation-East (NGA-East) project included two components developed concurrently and independently: (1) earthquake ground-motion models (GMMs) that predict the median and aleatory variability of various intensity measures conditioned on magnitude and distance, derived for a reference hard-rock site condition with an average shear-wave velocity in the upper 30 m (VS30) = 3000 m/s; and (2) a site amplification model that modifies intensity measures for softer site conditions. We investigate whether these models, when used in tandem, are compatible with ground-motion recordings in central and eastern North America (CENA) using an expanded version of the NGA-East database that includes new events from November 2011 (end date of NGA-East data curation) to April 2022. Following this expansion, the data set has 187 events, 2096 sites, and 16,272 three-component recordings, although the magnitude range remains limited (∼4 to 5.8). We compute residuals using 17 NGA-East GMMs and three data selection criteria that reflect within-CENA regional variations in ground-motion attributes. Mixed-effects regression of the residuals reveals a persistent pattern in which ground motions are overpredicted at short periods (0.01–0.6 s, including peak ground acceleration (PGA)) and underpredicted at longer periods. These misfits are regionally variable, with the Texas–Oklahoma–Kansas region having larger absolute misfits than other parts of CENA. Two factors potentially influencing these misfits are (1) differences in the site amplification models used to adjust the data to the reference condition during NGA-East GMM development relative to CENA amplification models applied since the 2018 National Seismic Hazard Model (NSHM), and (2) potential bias in simulation-based factors used to adjust ground motions from the hard-rock reference condition to a VS30 = 760 m/s condition. We provide adjustment factors and their epistemic uncertainties and discuss implications for applications.
Introduction
In the 2018 and 2023 U.S. Geological Survey (USGS) National Seismic Hazard Model (NSHM; Petersen et al., 2020, 2023), ground-motion intensity measures for central and eastern North America (CENA) were evaluated using ground-motion models (GMMs) and site amplification models developed as a part of the Next Generation Attenuation-East (NGA-East) project (Goulet et al., 2021a; Youngs et al., 2021). These GMMs and site amplification models were developed by different teams of investigators and under different organizational frameworks. In the case of GMMs, 17 models and a weighted median (referred to as “central branch” below) were recommended by Goulet et al. (2021a) with the aim of capturing epistemic uncertainties related to the overall ground-motion space, including magnitude scaling, distance scaling, and other attributes. These recommended GMMs do not include individually developed “seed” GMMs by independent modelers (Pacific Earthquake Engineering Research Center (PEER), 2015; hereafter PEER, 2015), although some of those seed models are considered in the NSHM (Moschetti et al., 2024; Rezaeian et al., 2021), as those GMMs were argued to represent physical features that were not present in the 17 NGA-East models. The GMMs apply for a hard-rock reference site condition defined as having average shear-wave velocity in the upper 30 m (VS30) = 3000 m/s and site decay parameter (κ0) = 0.006 s (Hashash et al., 2014), which is often used as the reference site condition for applications in which site-specific site response is applied. The model development was conducted as a Senior Seismic Hazard Analysis Committee (SSHAC) Level 3 project (Budnitz et al., 1997; U.S. Nuclear Regulatory Commission, 2012), which is a formal process involving extensive review and documentation.
Because of the hard-rock reference site condition, development of the seed GMMs required adjustments to recorded ground motions in the NGA-East database (Goulet et al., 2021b), all of which were from softer-than-reference sites (average shear-wave velocities in the upper 30 m, VS30∼150–2000 m/s). The adjustments occurred relatively early in the project (PEER, 2015), with each seed GMM developer team using their preferred site adjustment models (and initial site VS30 values from Goulet et al., 2014 that were later updated by Parker et al., 2017). The adjusted ground motions were used in GMM development as a constraint on scaling relations (with distance and magnitude), but also to set constant terms in the models that control the overall model amplitudes. Subsequently, the NGA-East Technical Integrators for GMM development applied four main amplification models to adjust data for residual analyses. The purpose of those analyses was to screen GMMs and to thereby limit misfit in the recommended GMMs (Goulet et al., 2018). The amplification factors applied in those data adjustments, as with some of the seed models, employed models for active tectonic regions (e.g. Seyhan and Stewart, 2014). It was later demonstrated by Hassani and Atkinson (2017), Parker et al. (2019), Zalachoris and Rathje (2019), and Boore (2020) that CENA has weaker VS30 scaling (i.e. smaller absolute value slopes), which means that VS30 has less predictive power in CENA than in active regions.
The site amplification models used in the 2018 and 2023 NSHMs for CENA were later developed by an expert panel based on a synthesis of available research (Hashash et al., 2020; Stewart et al., 2020). This synthesis drew heavily upon research products from the NGA-East Geotechnical Working Group (GWG) (Harmon et al., 2019a, 2019b; Parker et al., 2019). The GWG site amplification model development was reviewed extensively but this occurred outside of the NGA-East SSHAC process. The GWG site amplification (FS) models are intended to represent amplification relative to VS30 = 3000 m/s and κ0 = 0.006 s. The reference condition was not defined relative to the NGA-East hard-rock GMMs; hence, if the GMMs are not centered with respect to the assumed reference condition, there is a potential for bias to propagate through the GWG site amplification model when used with the NGA-East models to predict ground motions at other VS30 values. Because the aim of the GWG was to derive amplification relative to the reference condition, the issue of potential bias was not addressed.
The site amplification model has linear (Flin) and nonlinear (Fnl) components:

The linear component of the model has two components:

in which FV describes the amplification relative to a VS30 = 760 m/s reference condition and F760 describes the amplification for 760 m/s sites relative to 3000 m/s sites. F760 carries significant parametric uncertainty in κ0 due to the lack of empirical data at the reference site condition (e.g. Atkinson, 2012; Boore and Campbell, 2017) and the assumption that κ0 reflects only material damping (Al Atik et al., 2022). Two terms are used in Equation 2 because they were derived using different procedures. FV is empirically constrained from NGA-East data (Parker et al., 2019), while F760 is derived from ground-response simulations (Boore and Campbell, 2017; Frankel et al., 1996; Harmon et al., 2019a, 2019b; Silva et al., 2015). This two-tier approach was required because it was not possible to empirically derive site amplification relative to 3000 m/s conditions due to the lack of ground-motion recordings at this reference condition.
Because the site adjustments applied during GMM development used a modeling approach different from how the NGA-East GMMs are now applied, this study was undertaken to assess whether the combined use of NGA-East GMMs and site amplification models is compatible with ground-motion data from CENA. We summarize an expanded (relative to NGA-East; Goulet et al., 2021b) CENA data set that is presented in greater detail by Ramos-Sepúlveda et al. (2023a). We then use residual analyses to assess model performance with respect to independent variables (magnitude, distance, and VS30) and overall mean model misfits. The residual analyses consider different NGA-East GMMs (i.e. the 17 models presented by Goulet et al., 2021a) and alternative data selection criteria in consideration of observed regional features. Although the database has grown appreciably, the moment magnitude (
CENA ground-motion database
The database used in this research is an expanded version of the NGA-East ground-motion database (Goulet et al., 2021b). The NGA-East portion of the database consists of ground-motion intensity measures and metadata (event locations, magnitude, distance, VS30) provided in the electronic supplements to Goulet et al. (2021b). The NGA-East data were merged into a relational database developed for ground-motion studies (see Data Resources and Ramos-Sepúlveda et al., 2023a for details) and expanded to include events in CENA since November 2011 (date of the latest event in NGA-East). Additional ground motions in the Texas–Oklahoma–Kansas (TOK) region were also considered in a parallel, collaborative component of this project (Li et al., 2023; Zalachoris et al., 2020), but as of this writing those additional data have not been added to the relational database.
The database expansion considered all events with
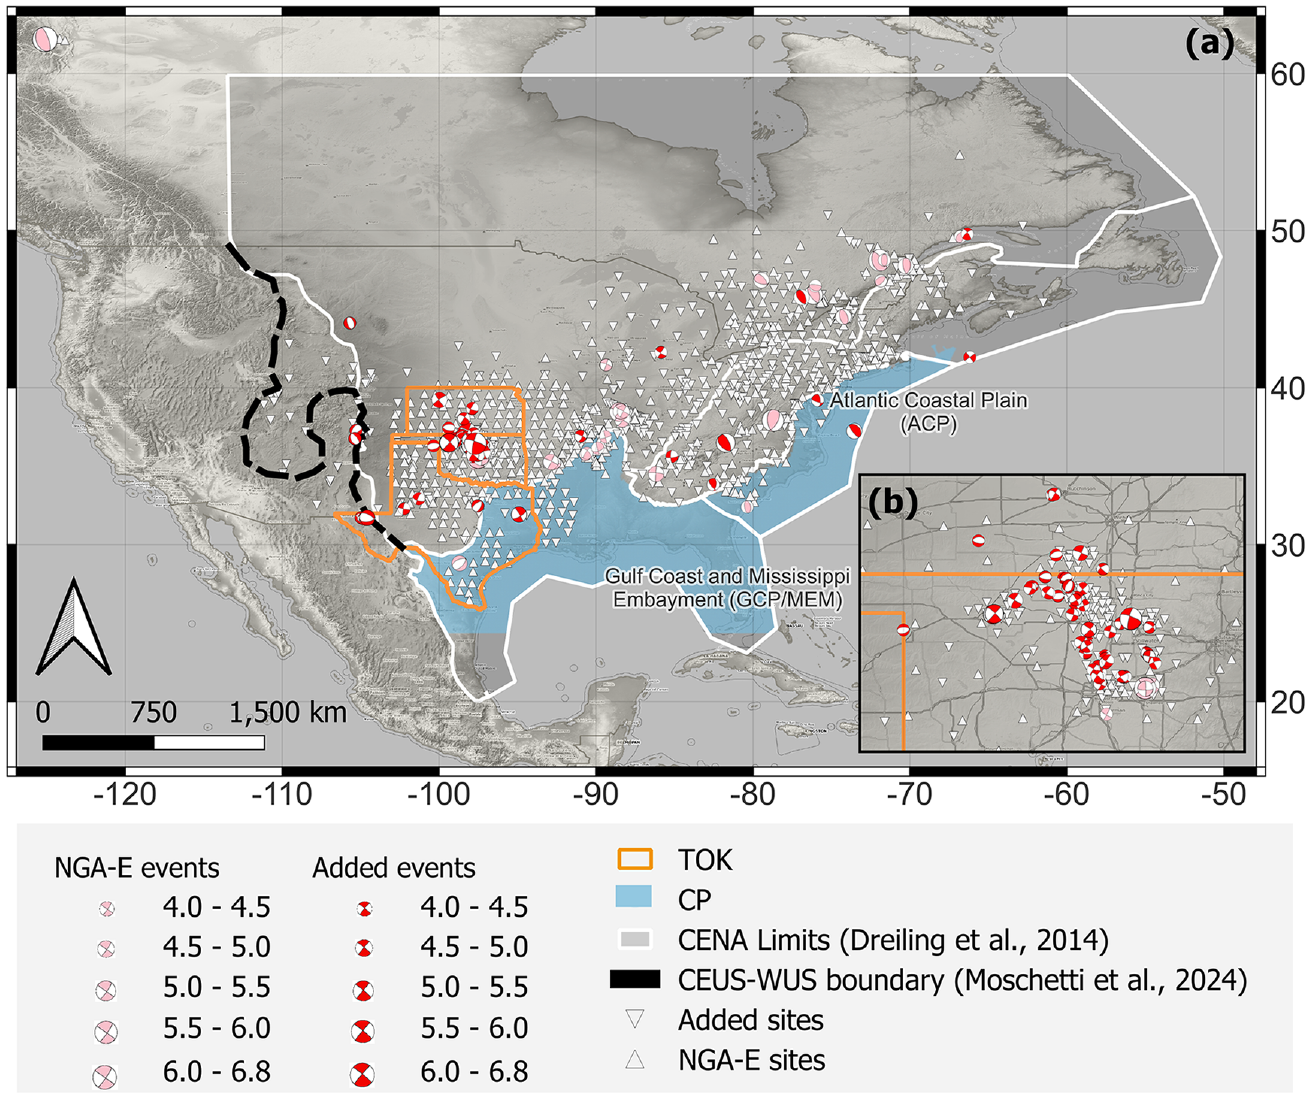
(a) Locations of CENA earthquakes and ground-motion recording stations considered in the present study (Ramos-Sepúlveda et al., 2023a). Boundaries of Texas–Oklahoma–Kansas (TOK) and coastal plain (CP) regions (the CP boundary is defined using a minimum sediment depth, from Boyd et al., 2023, of 100 m). (b) Detailed view of Oklahoma where a high event density occurred.
The recent events typically have a greater density of recordings relative to the NGA-East events, which is a consequence of the growth of seismic instrumentation in CENA. The more recently installed instruments, including at prior locations of Temporary Array (TA) stations, have broader usable frequency ranges. Ground-motion intensity measures (peak ground acceleration, PGA; peak ground velocity, PGV; and spectral acceleration, Sa from 0.01 to 10 s) from these events and information on their component-specific usable frequency ranges were uploaded to the relational database. For each of these intensity measures, as-recorded components are provided along with median-, minimum-, and maximum-component horizontal motions (RotD50, RotD00, and RotD100, respectively; Boore, 2010).
Metadata describing the seismic sources, path, and site conditions were assembled. General information such as the name and location of the instrument, hypocenter location, and event origin date and time can be obtained from gmprocess’ output. Newly added events include moment magnitudes from moment tensor solutions (Dziewonski et al., 1981; Ekström et al., 2012; Guy et al., 2015) for 76 out of the 100 events, and estimates with the uncertainty of converted magnitudes (i.e. from events that did not have moment tensor solutions) were provided for the remaining 24 events (U.S. Nuclear Regulatory Commission, 2012; NUREG-2117). Procedures described in Contreras et al. (2022) were used to generate approximate rupture dimensions based on magnitude, event type, hypocenter, and orientation of one or two nodal planes. Contreras et al. (2022) modified a fault surface simulation routine previously presented by Chiou and Youngs (2008). The modifications incorporate a magnitude-area scaling relationship for stable continental regions (Leonard, 2014). Site parameters were derived from shear-wave velocity (VS) profiles where available and otherwise from the Li et al. (2022) geology-slope proxy for TOK sites and the Parker et al. (2017) geology-slope proxy for other CENA sites.
Figure 2 shows data distribution (stacked histograms) as functions of rupture distance (Rrup), VS30, and
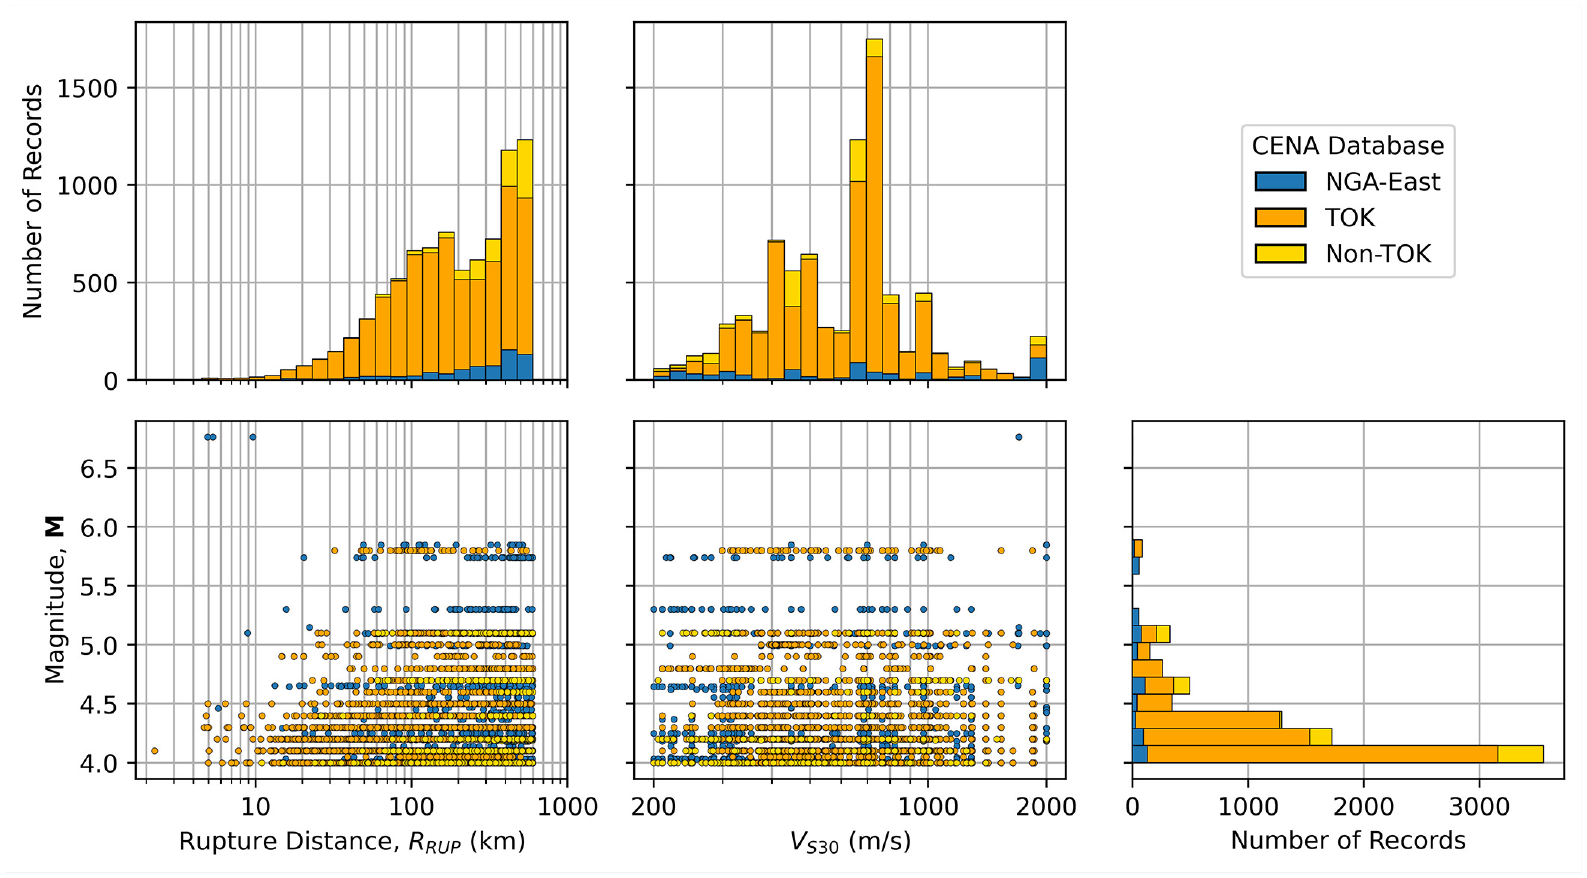
Distributions of CENA data set with respect to rupture distance, VS30, and magnitude, showing differences between NGA-East and added data.
Figure 3 shows the numbers of available recordings and events before and after the expansion of the NGA-East database as a function of oscillator period. There are more records at all periods, but the increase is particularly pronounced at short periods because many ground-motion networks now have instrument sample rates that are adequate to capture these short-period responses, which had not been the case previously (Goulet et al., 2021b).
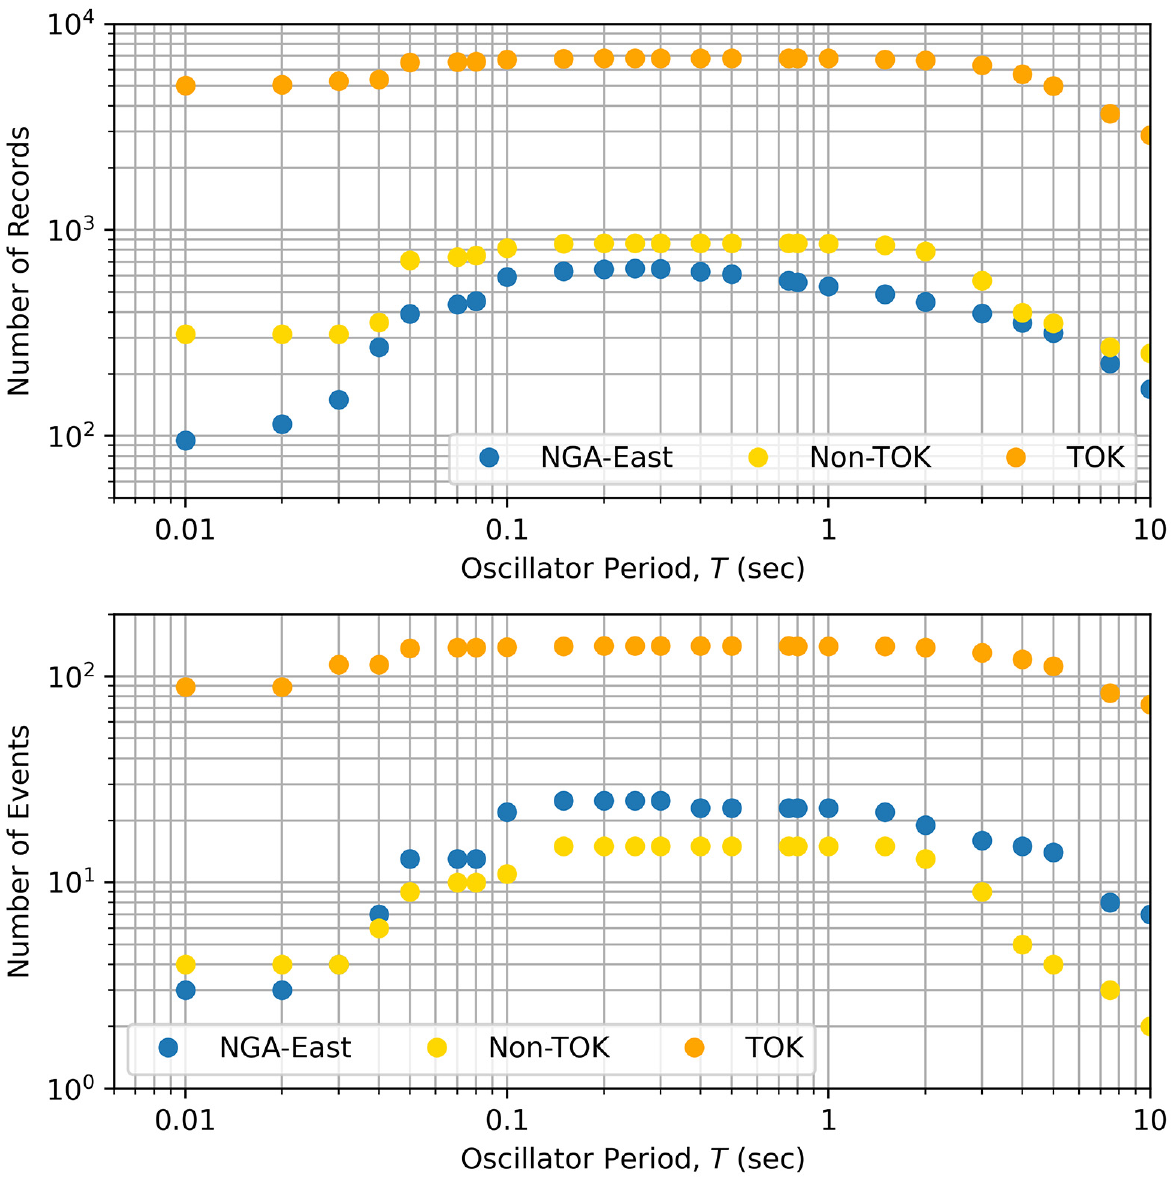
Numbers of available RotD50 spectral accelerations and events as a function of oscillator period. The NGA-East numbers are for
Data analysis
Residuals calculations
GMM performance is assessed through residual analyses. We define the residual as the difference between an observation (natural-log intensity measure from a recording) and a GMM estimate of the mean ground motion:

where Yij is the observed intensity measure for event i and station j, μ
ln,k
(

where ck is the overall mean misfit for GMM k, ηE,i is the event term for event i, and
Residual analyses were performed using the NGA-East central branch GMM and the CENA data set (as described in the previous section) with minimal screening in which
Regional variations of magnitude and distance scaling
As shown in Figure 1, the CENA database includes a large number of events (146) in the TOK region and a small number in the CP region (8), with the balance being 33 events outside of those regions. The NGA-East project screened out potentially induced events (PIE) (Goulet et al., 2021a), which largely originated in the TOK region. This is consistent with other research suggesting that TOK may have distinct ground-motion magnitude- and distance-scaling characteristics (e.g. Moschetti et al., 2019; Zalachoris and Rathje, 2019). Regarding the CP region, the NGA-East GMM development team found that the Gulf Coast portion of CP had higher rates of anelastic attenuation (Goulet et al., 2021a; also later observed by Pezeshk et al., 2021), while the Atlantic Coastal Plain did not. Goulet et al. (2021a) provided adjustment factors for the Gulf Coast to account for this effect. Our CP region groups together both Atlantic and Gulf regions (Figure 1), for which we anticipate potentially distinct path characteristics and differences in site response relative to the rest of CENA due to the presence of relatively deep sediments (Boyd et al., 2023; Chapman and Guo, 2021; Guo and Chapman, 2019; Pratt and Schleicher, 2021; Schleicher and Pratt, 2021).
In consideration of these factors, we examined magnitude- and distance-scaling effects beginning with only the non-TOK/non-CP region to maximize consistency with data selection criterion used during NGA-East GMM development, and then we examine differences for CP and TOK. While events in these regions are strictly incompatible with the originally applied criteria, they are nonetheless important to consider in this study because the combined NGA-East GMM and site factors are applied across CENA in the NSHM.
We performed residuals analysis followed by mixed-effects partitioning of the non-TOK/non-CP data set (33 events, 1169 recordings) for the central branch GMM. Figure 4 shows the resulting trends of event terms (
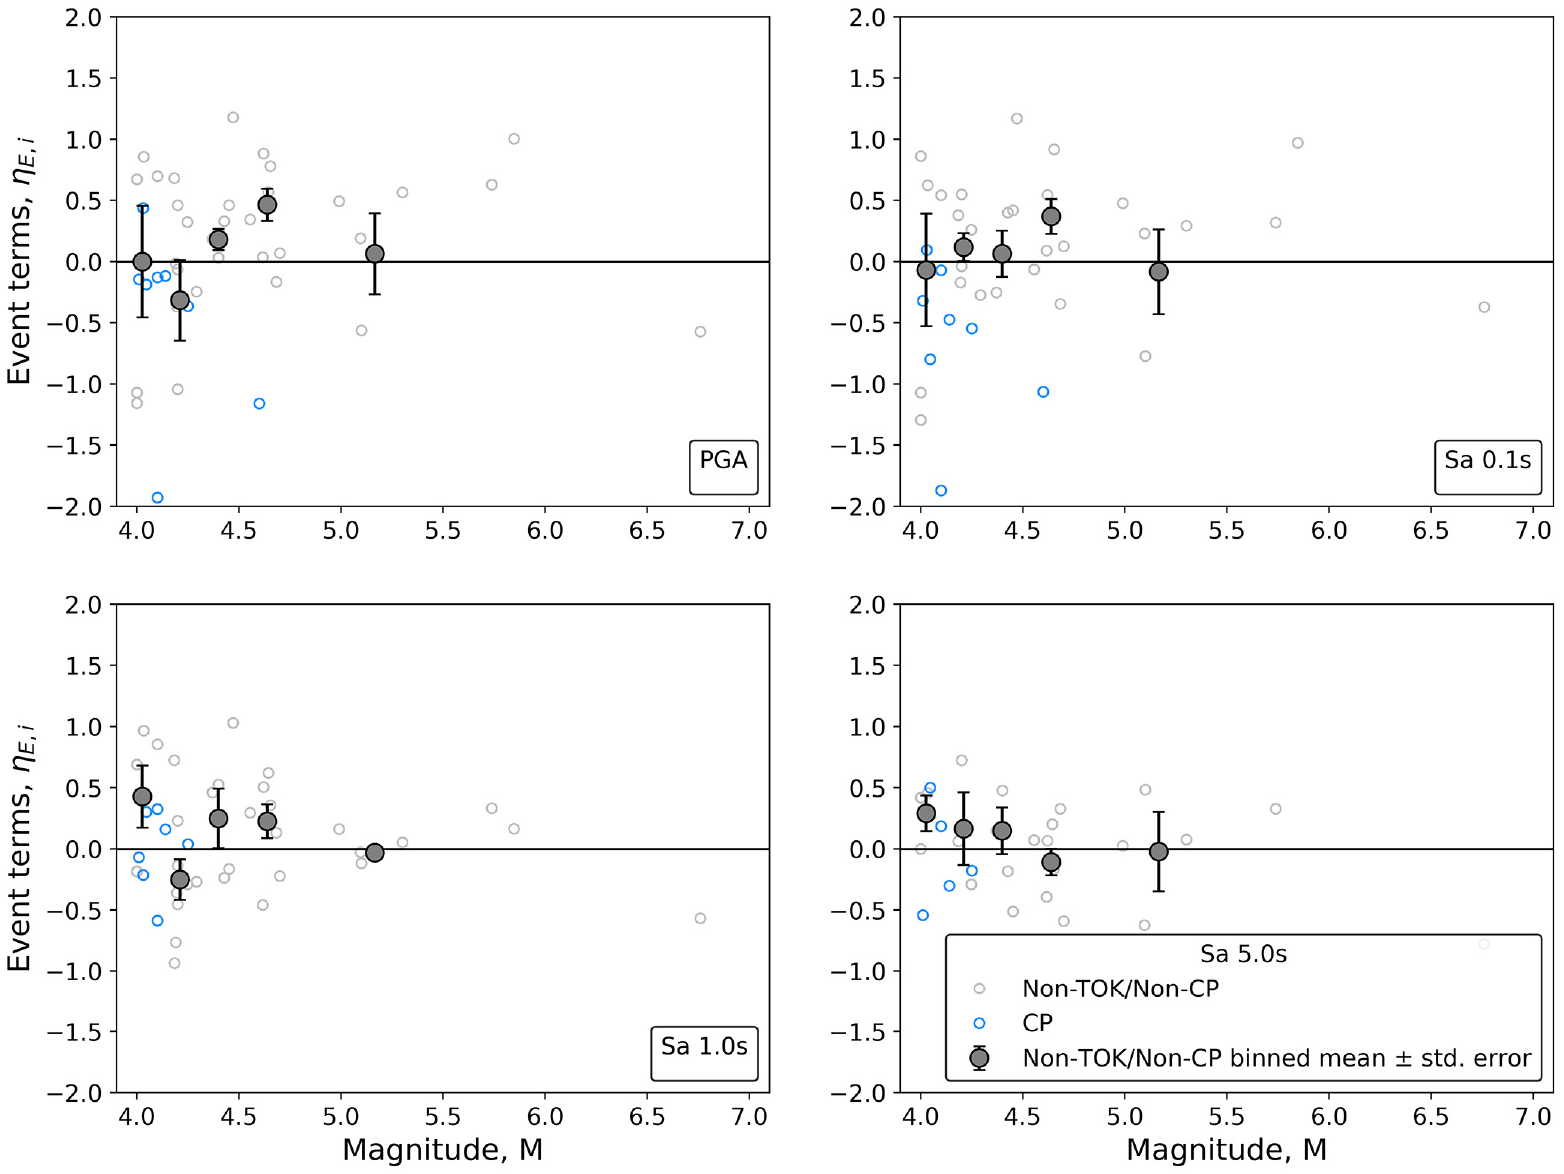
Trends of event terms with magnitude for non-TOK/non-CP and CP regions. Binned means are for non-TOK/non-CP data and vertical bars through binned means indicate ± one standard error of the mean. No binned means are shown for the CP region due to the limited number of events.
Figure 5 shows the trend of
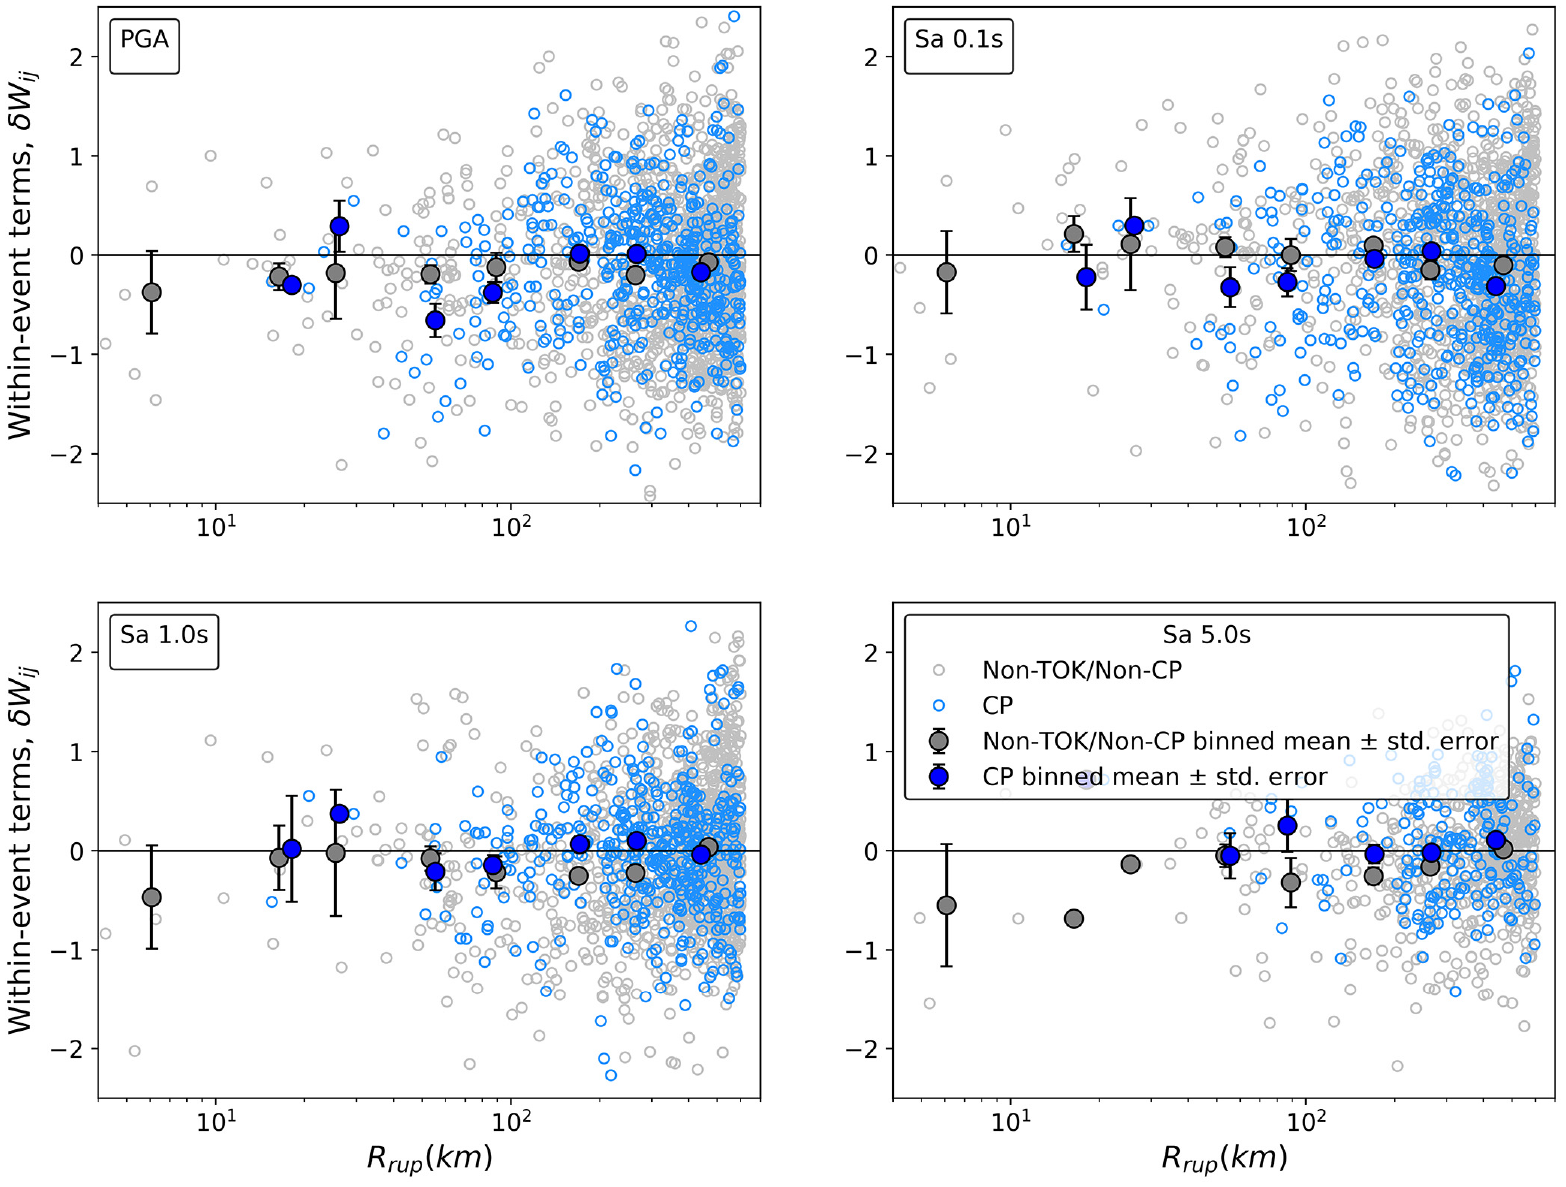
Trends of within-event residuals with distance (Rrup) for non-TOK/non-CP and CP regions. Vertical bars through binned means indicate ±one standard error of the mean.
We next examine regional variations between TOK (Figure 1) and the remaining CENA data (including CP) by computing residuals for the full data set and then distinguishing the resulting outcomes by region. Figure 6 shows the resulting trends of event terms with magnitude. For TOK, the binned means of event terms are near zero for
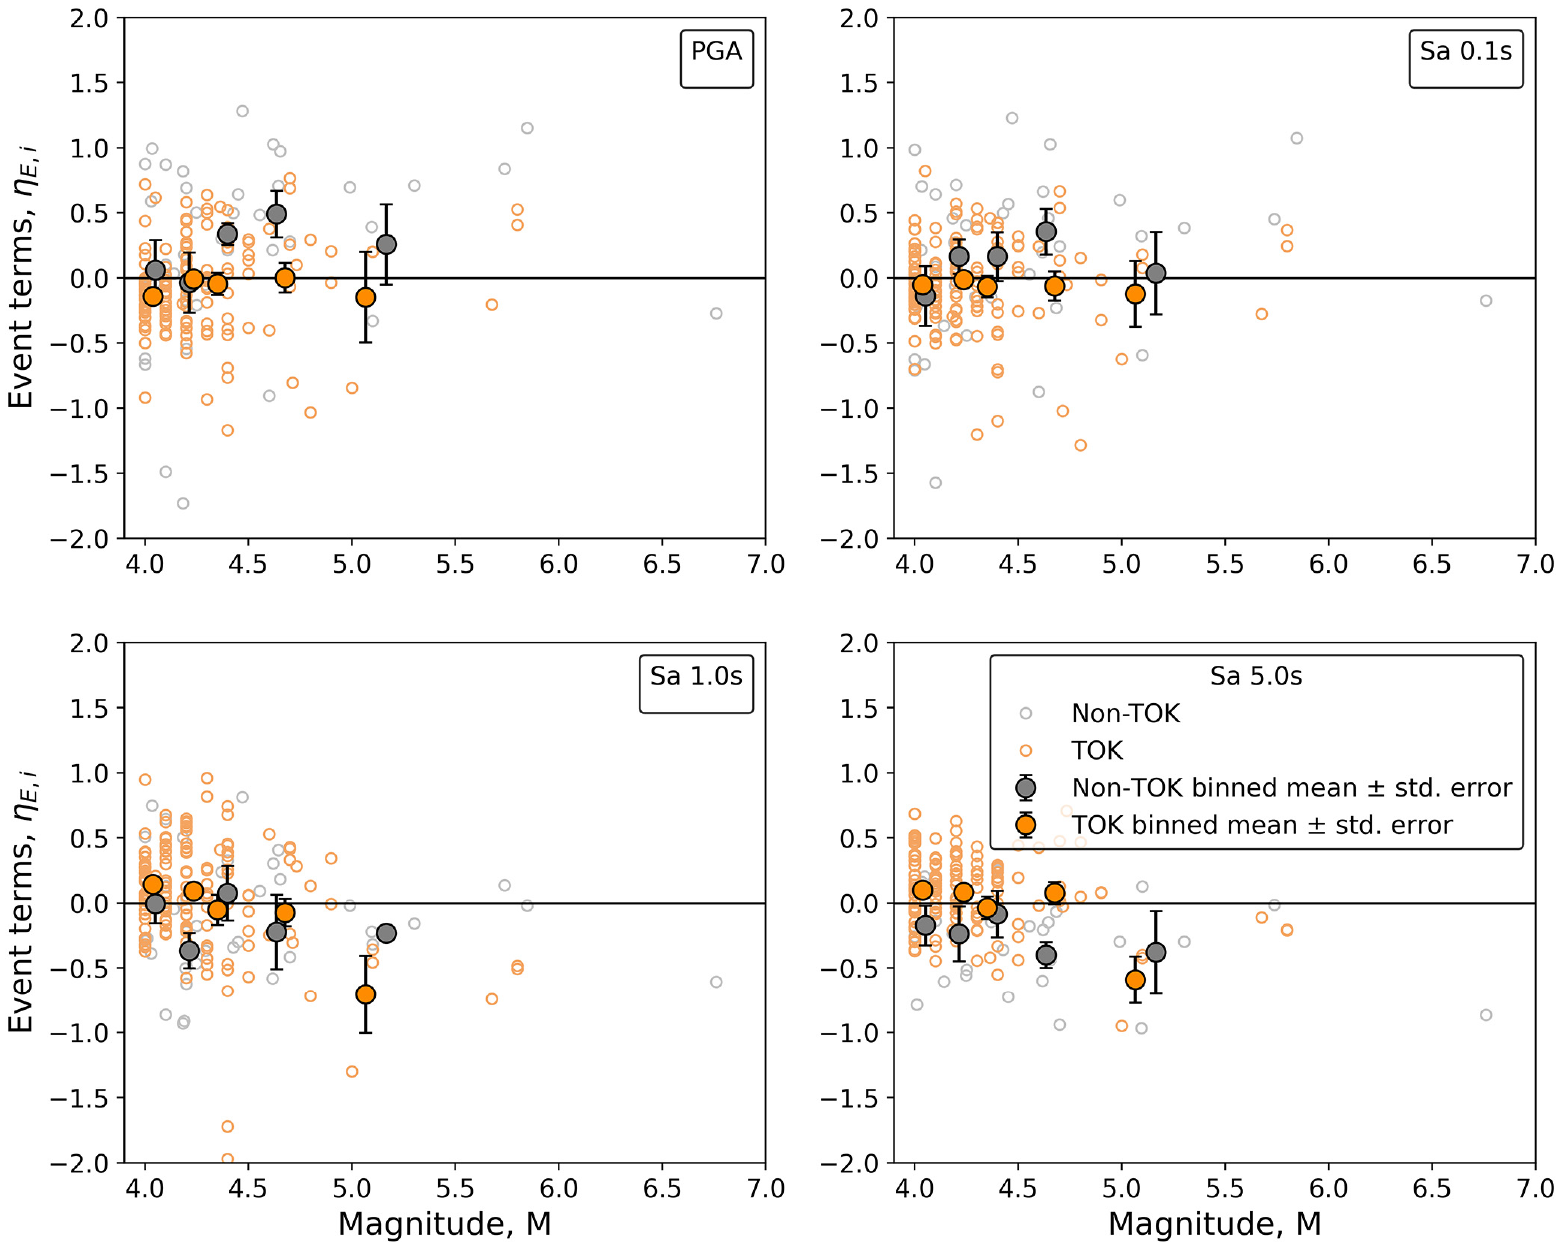
Magnitude-dependence of event terms for TOK and non-TOK regions. Vertical bars through binned means indicate ±one standard error of the mean.
Figure 7 shows the trend of
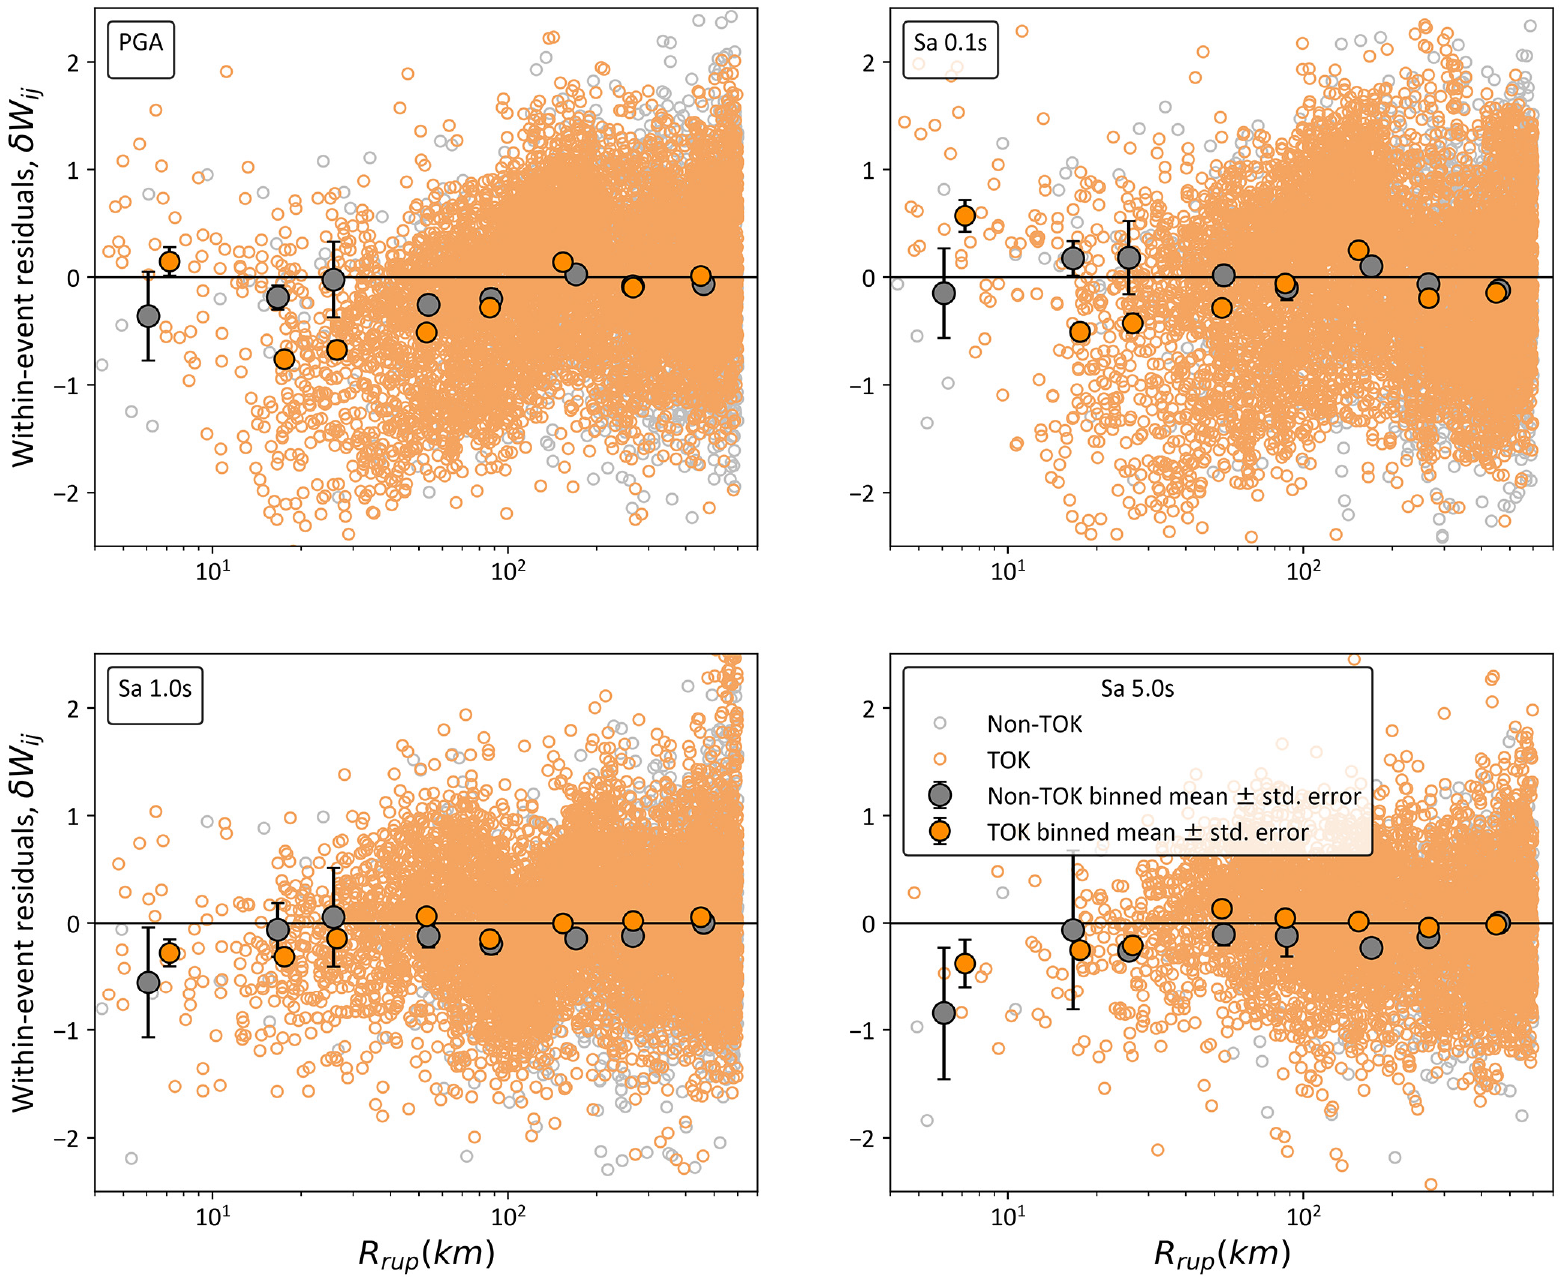
Distance-dependence of within-event residuals for full data set. Vertical bars through binned means indicate ±one standard error of the mean.
In this article, we do not attempt to model the scaling trends and mean model misfits for the TOK region, which is the subject of a parallel effort that has recommended a modified GMM for that region (chapter 5 of Centella et al., 2023).
Validation of VS30-scaling model
To evaluate the performance of the VS30-dependent site amplification model (Flin in Equation 1), we partition the

The site terms represent the approximate misfits of the model used in the original residuals calculation (Equation 1) for sites in the full data set, after model misfits and event-terms have been subtracted. Figure 8 shows the trend of site terms with VS30. The results in Figure 8 show no appreciable trend, except for sites with VS30 > 1000 m/s, where downward trends are evident for some periods. The trends are similar for TOK sites as shown in chapter 5 of Centella et al. (2023). These results indicate that the VS30-scaling component of the site amplification model is consistent with the data to a maximum VS30 of 1000 m/s.
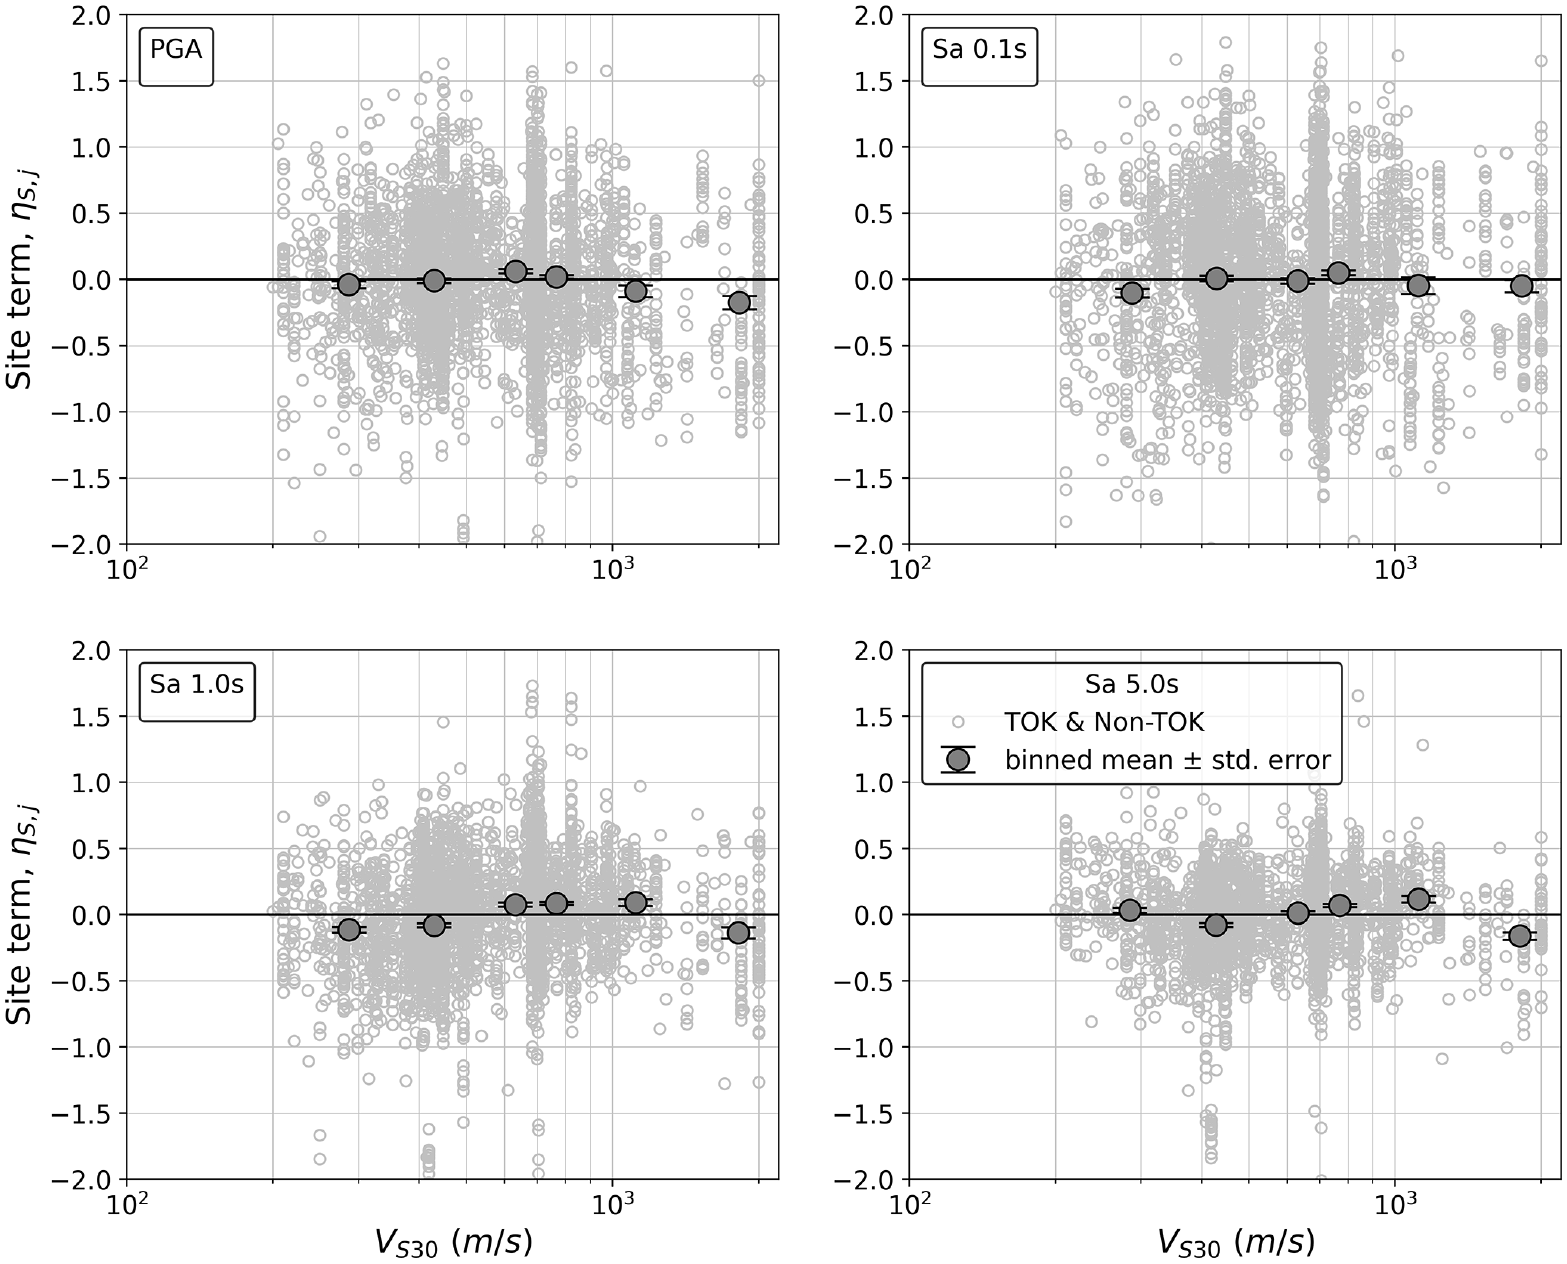
Site terms trends with VS30 for full data set. Vertical bars through binned means indicate ±one standard error of the mean.
Analysis of mean misfits
The data analysis in the prior subsections suggests that the TOK region has distinct features that affect distance attenuation and overall ground-motion levels. Moreover, as shown in Figure 1, TOK has a substantial event concentration (events per area) compared to the rest of CENA, which to some extent produces results that largely reflect TOK attributes. Although less compelling, CP sites also have some different ground-motion features, mainly in relation to large-distance anelastic attenuation.
Accordingly, we developed different subsets of the CENA data for analysis of mean misfits:
Non-TOK / Non-CP: Events and sites within TOK and the CP are excluded.
Non-TOK: All non-TOK events are considered, including CP. No TOK events are considered.
Partial TOK: All non-TOK events are considered. Within TOK, nine events from the 146 are selected (randomly) so that the event density (number of events per area) is consistent with other parts of CENA.
Mixed-effects analyses (Equation 4) were repeated for each of these subsets of data using the central branch NGA-East GMM. This produces three sets of misfits (ck); as shown in Figure 9, the mean of these sets ±1 standard deviation are shown. For reference purposes, the ck term for the complete CENA data set is also shown. The results show a consistent trend of negative misfits at short periods (i.e. models are overpredicting these components of ground motion) and positive misfits at long periods (models are underpredicting). There are modest differences between the three data subsets, with partial TOK producing the largest misfits in terms of absolute value, non-TOK/non-CP the smallest, and non-TOK being an intermediate case. Nonetheless, all of the data subsets show less misfit than the complete CENA data set, indicating that the concentration of data from TOK is contributing the large misfits at short and long periods.
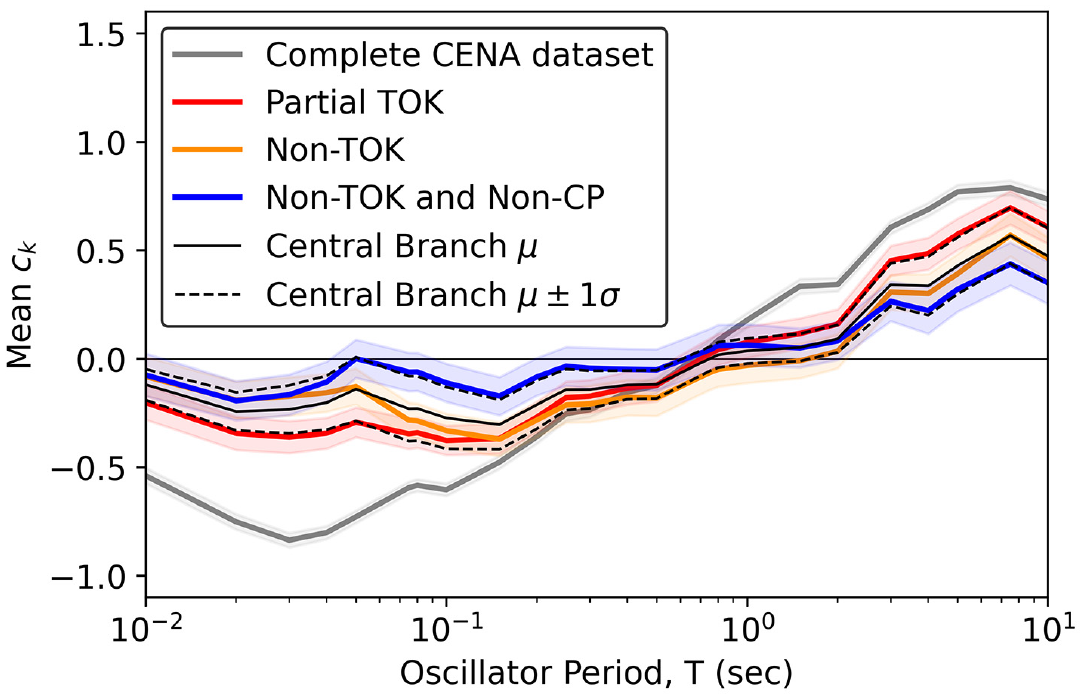
Period dependence of misfit term ck for NGA-East central branch GMM for alternate data sets. The shaded regions enclose ±one standard error.
Figure 10 shows ck for the non-TOK data set using all 17 NGA-East GMMs, along with the population weighted mean and mean ± one weighted standard deviation. The weights applied in these calculations were taken from Goulet et al. (2021a) for the 17 GMMs and were equal for the three data selection criteria. We did not evaluate potential data misfits in relation to magnitude and distance scaling for each of these 17 GMMs as was done for the central branch. It is possible that individual GMMs with large misfits in Figure 10 are influenced by scaling problems. Comparing Figures 9 and 10, it is clear that the uncertainty introduced by alternate GMMs substantially exceeds that from alternative data selection protocols. Although not shown here for brevity, the misfits found when only the NGA-East data are considered are similar to that shown for the non-TOK version of the expanded data set in Figure 9. Moreover, Boore (2020) observed qualitatively similar misfit trends to those reported here, using the NGA-East data set and the Boore (2018) GMM.
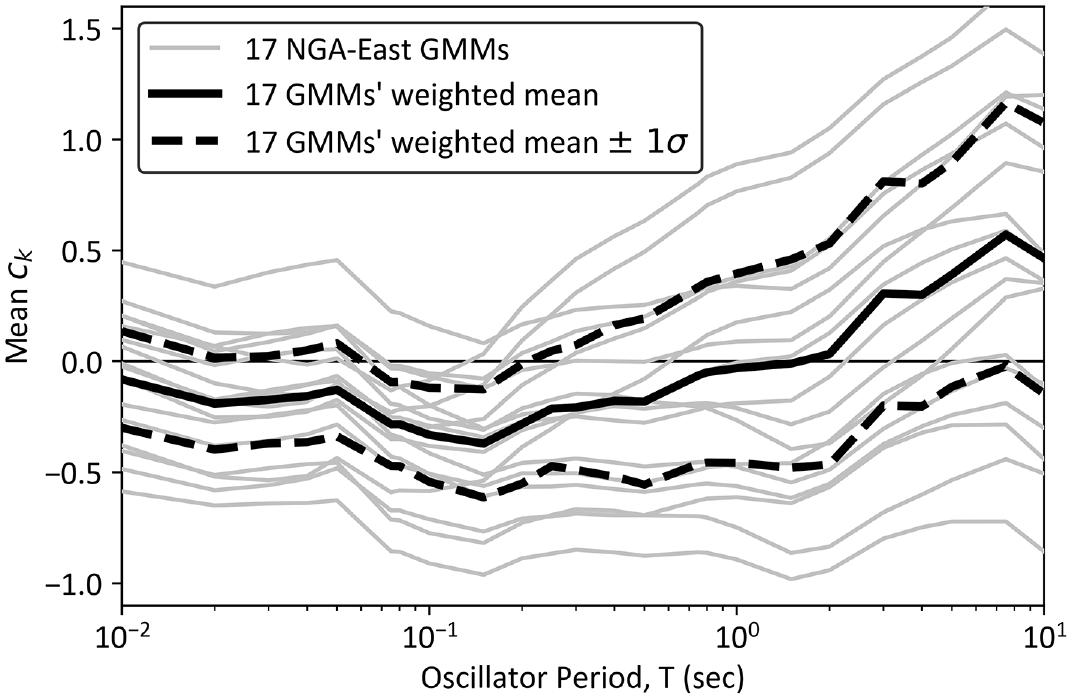
Period dependence of misfit term ck for 17 NGA-East GMMs for Non-TOK data and weighted mean misfit.
Model adjustment factors
We consider the 17 alternative NGA-East GMMs (weighted as given by Goulet et al., 2021a) and three data selection criteria (as given in Analysis of Mean Misfits) to compute 51 misfit terms. Various weighting combinations were considered for data selection, including equal weighting and weighting that gives preference to the non-TOK/non-CP data set. Ultimately, the recommended weights were 0.2 for the non-TOK set, 0.2 for the partial TOK set, and 0.6 for the non-TOK/non-CP set. All sites are considered in the development of the model adjustment factors presented in this section, and modifications for stiff sites with VS30 > 1000 m/s are presented subsequently.
Figure 11a shows the resulting weighted mean of the 51 misfit terms (overall µ) ± one weighted standard deviation (
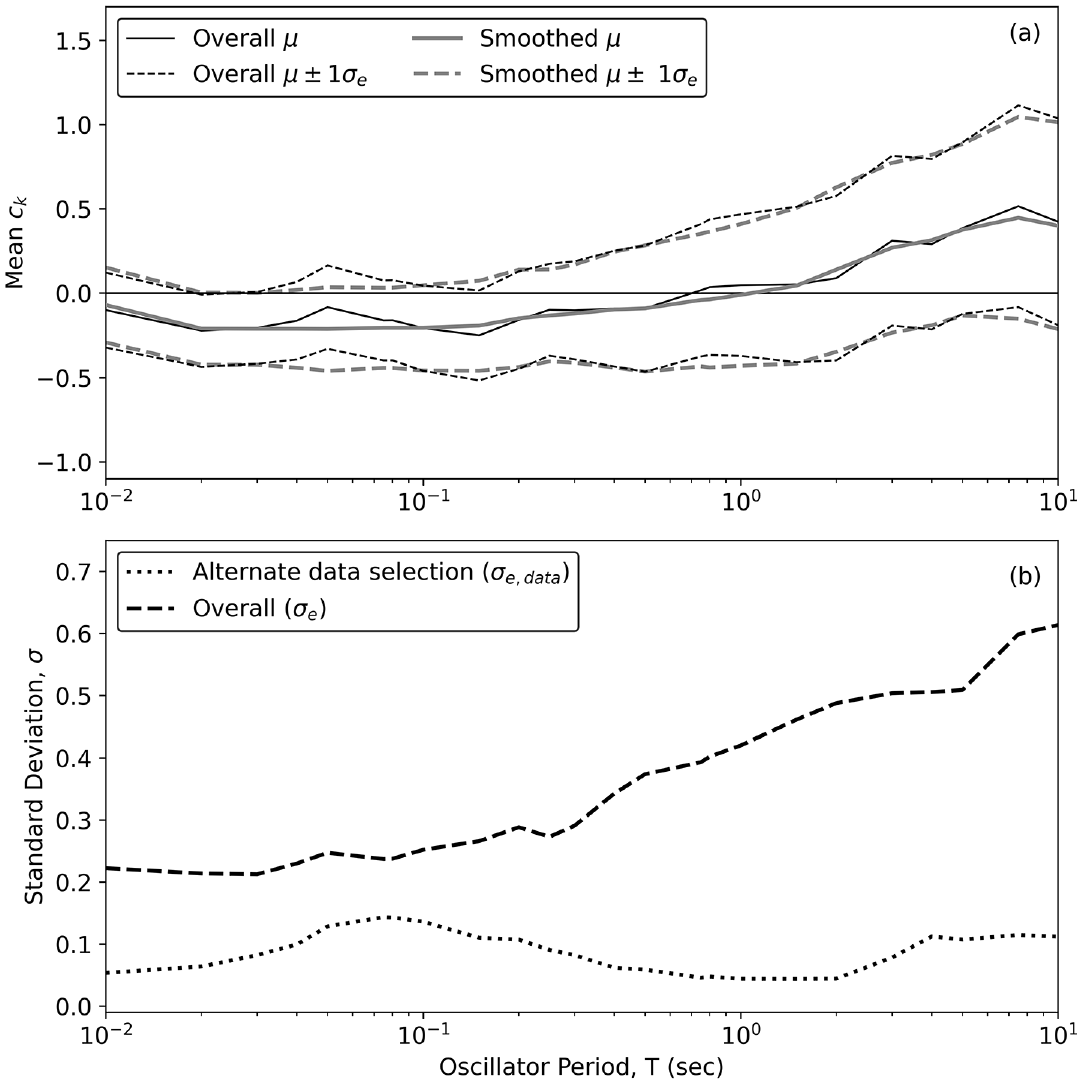
(a) Period dependence of model adjustment factor ck and its uncertainty, as derived from 51 misfit terms and (b) overall standard deviations for all 51 misfit terms (three data sets, 17 alternative NGA-East GMMs) and standard deviations solely related to alternate data set selections.
For forward analysis in which the 17 NGA-East GMMs are considered in the logic tree, which is the preferred approach, there is no need to consider the between-GMM uncertainty in the logic tree (to do so would double-count this uncertainty). In this case, the applicable epistemic uncertainty is that labeled as “alternate data selection” in Figure 11b (
Recommended natural-log model adjustment factors (smoothed weighted mean of ck values), epistemic uncertainties (expressed in the form of a natural-log standard deviation), and scaling coefficients for modifying model adjustment factors for high VS30 sites (Equation 6)
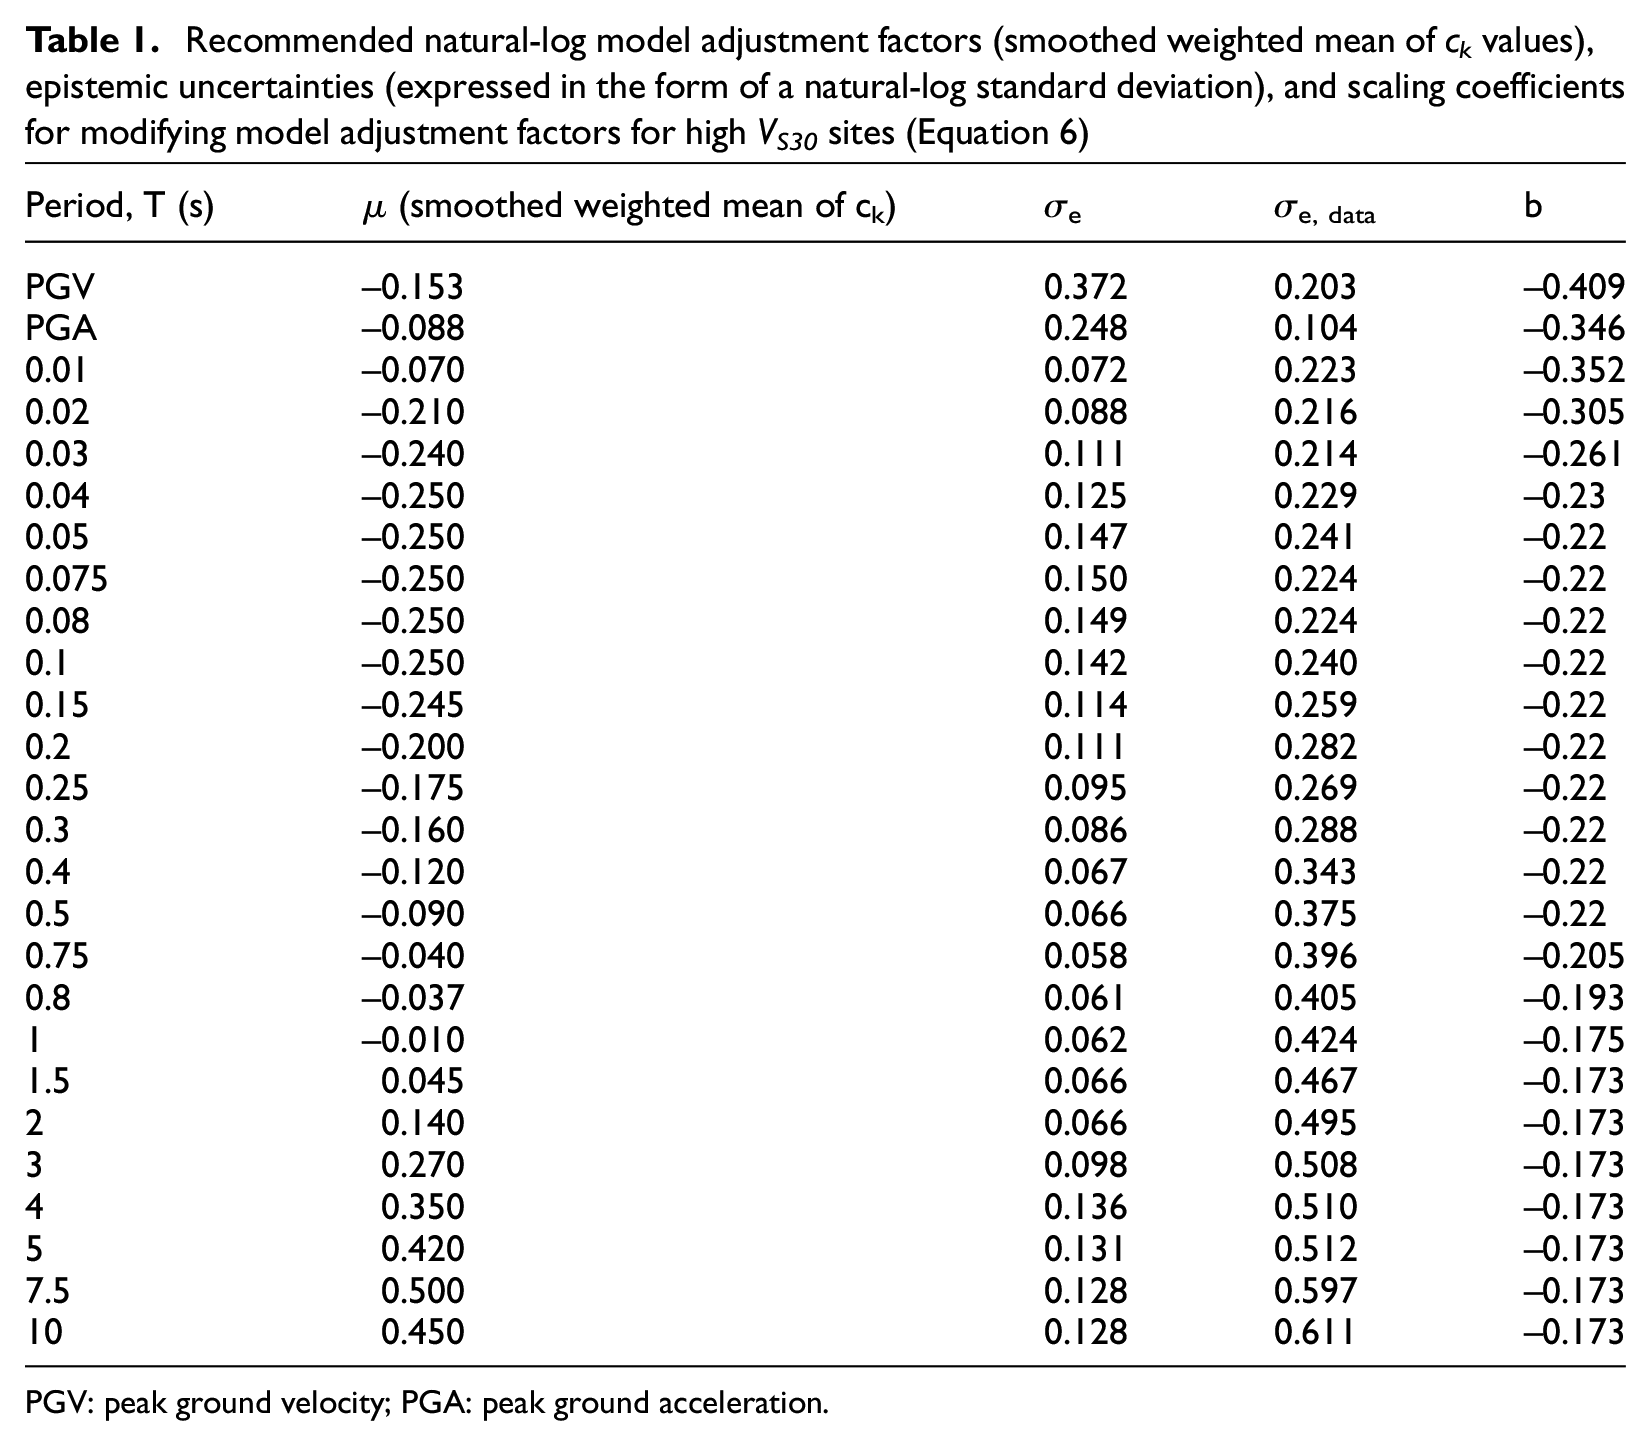
PGV: peak ground velocity; PGA: peak ground acceleration.
To apply the model adjustment factors in forward ground-motion analyses, the factors are simply added to the natural-log mean ground motions as computed from the combined models (hard-rock GMM and site response). Further recommendations on model application are provided in Conclusions.
Stiff site modifications
The site term plots in Figure 8 indicate a downward trend for stiff sites with VS30 > 1000 m/s, whereas the mean of site terms is nearly zero with no trend for softer sites. To address this, we fit the VS30 trend of the site terms as follows:
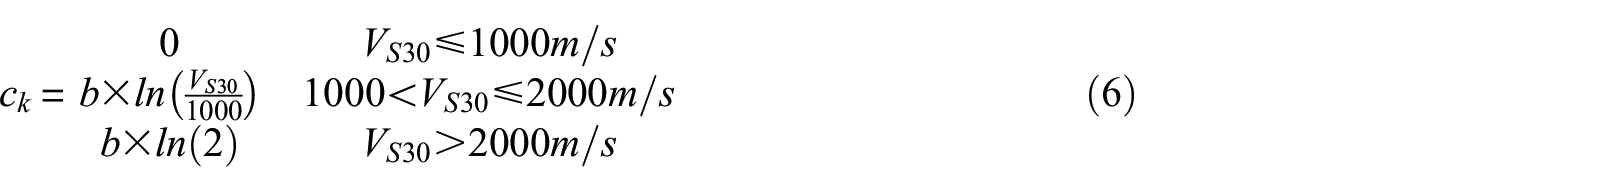
where VS30 is in m/s units and b is a coefficient that represents the slope of the site terms between 1000 and 2000 m/s, with the constraint of zero ordinate at 1000 m/s. Figure 12 shows the resulting values of b and the smoothed version recommended for application. Table 1 provides the smoothed values. The effect of the modification is to reduce, but not eliminate, the recommended model adjustments for stiff sites.
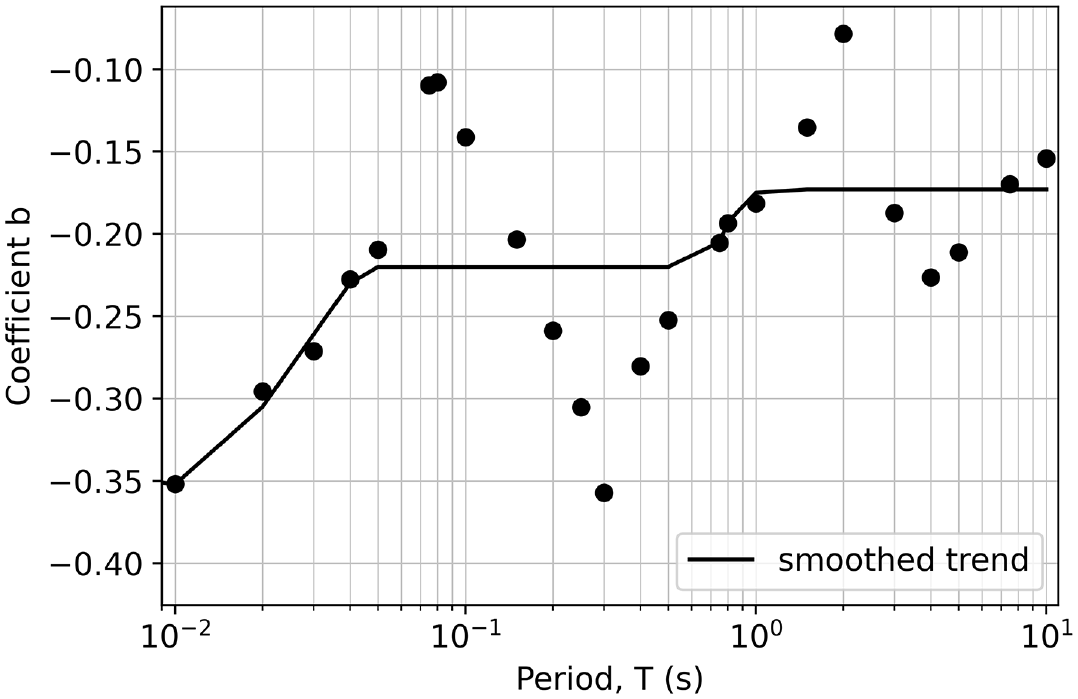
Slope of site terms with VS30 between 1000 and 2000 m/s as a function of period.
Causes of misfits
The GMM used for residuals analysis in the previous section has three components: a hard-rock GMM (i.e.
Differences in NGA-West and NGA-East site amplification models
In this subsection, we investigate the degree to which differences between the site amplification models employed during NGA-East GMM development under the SSHAC process, relative to those now used in forward application, may explain some of the observed misfits. The application of site factors in the development of NGA-East GMMs occurred in two phases: (1) development of seed models (PEER, 2015), where in some cases data were adjusted to the 3000 m/s reference condition for model calibration; and (2) integration of seed models within the process of developing the final recommended GMMs (Goulet et al., 2018). As summarized by Parker et al. (2019) (their Table 1), the 10 NGA-East seed models were developed using a variety of approaches, including simulations to directly estimate ground motions for the reference site condition, ground response simulations to compute site responses for different site conditions (which in turn were used for data adjustments), and two-step data adjustments as reflected by Equation 2, in which the FV term is based on a western US ergodic site amplification model (Seyhan and Stewart, 2014; hereafter SS14) and F760 is based on CENA-specific simulations. Further information on the model development procedures are given in PEER (2015) and are summarized by Parker et al. (2019) and section 4.4 of Centella et al. (2023).
For the present comparison, we focus on the second (integration) phase of this process, which used SS14 to adjust CENA ground motions to a site condition of VS30 = 760 m/s, followed by adjustments from the 760 m/s condition to the reference (3000 m/s) condition using F760. Four F760 models derived from one-dimensional ground-response simulations for CENA profiles were considered (Atkinson, 2012; Boore, 2015 (two models); and Graizer, 2015). As noted by Goulet et al. (2018), these four F760 models are similar, particularly in the 1–10 Hz frequency range.
To investigate the potential impact of the different site amplification models, we consider differences between SS14 combined with Atkinson (2012) for site corrections applied during model development and the Stewart et al. (2020) CENA site response model used in forward applications (e.g. Moschetti et al., 2024; Petersen et al., 2020, 2023). The assumption made during NGA-East GMM development can be viewed as taking the natural-log mean motion for a given VS30 (

where

where

To understand the linkage between the difference in Equation 9 with the residuals in Equation 3, it is useful to recognize that (1) the central tendency of the residuals, by definition, is

where the overbars represent means across the data population.
By substituting

Accordingly, a potentially reasonable hypothesis is that the mean misfits evaluated from residuals in this study may be influenced by the differences between the site amplification models.
Figure 13a and b show mean values of site amplification for the non-TOK data set as derived from the two models (TOK is not included for this analysis due to the relatively strong biases in that region); the FV and F760 values shown were obtained by exercising the models for each site and then averaging across sites. Considering first FV, the amplification applied during model development (SS14) is stronger at all periods, but the differences are most pronounced at long period (about 0.15 natural log units). This difference should cause positive misfits (Equation 11), as observed.
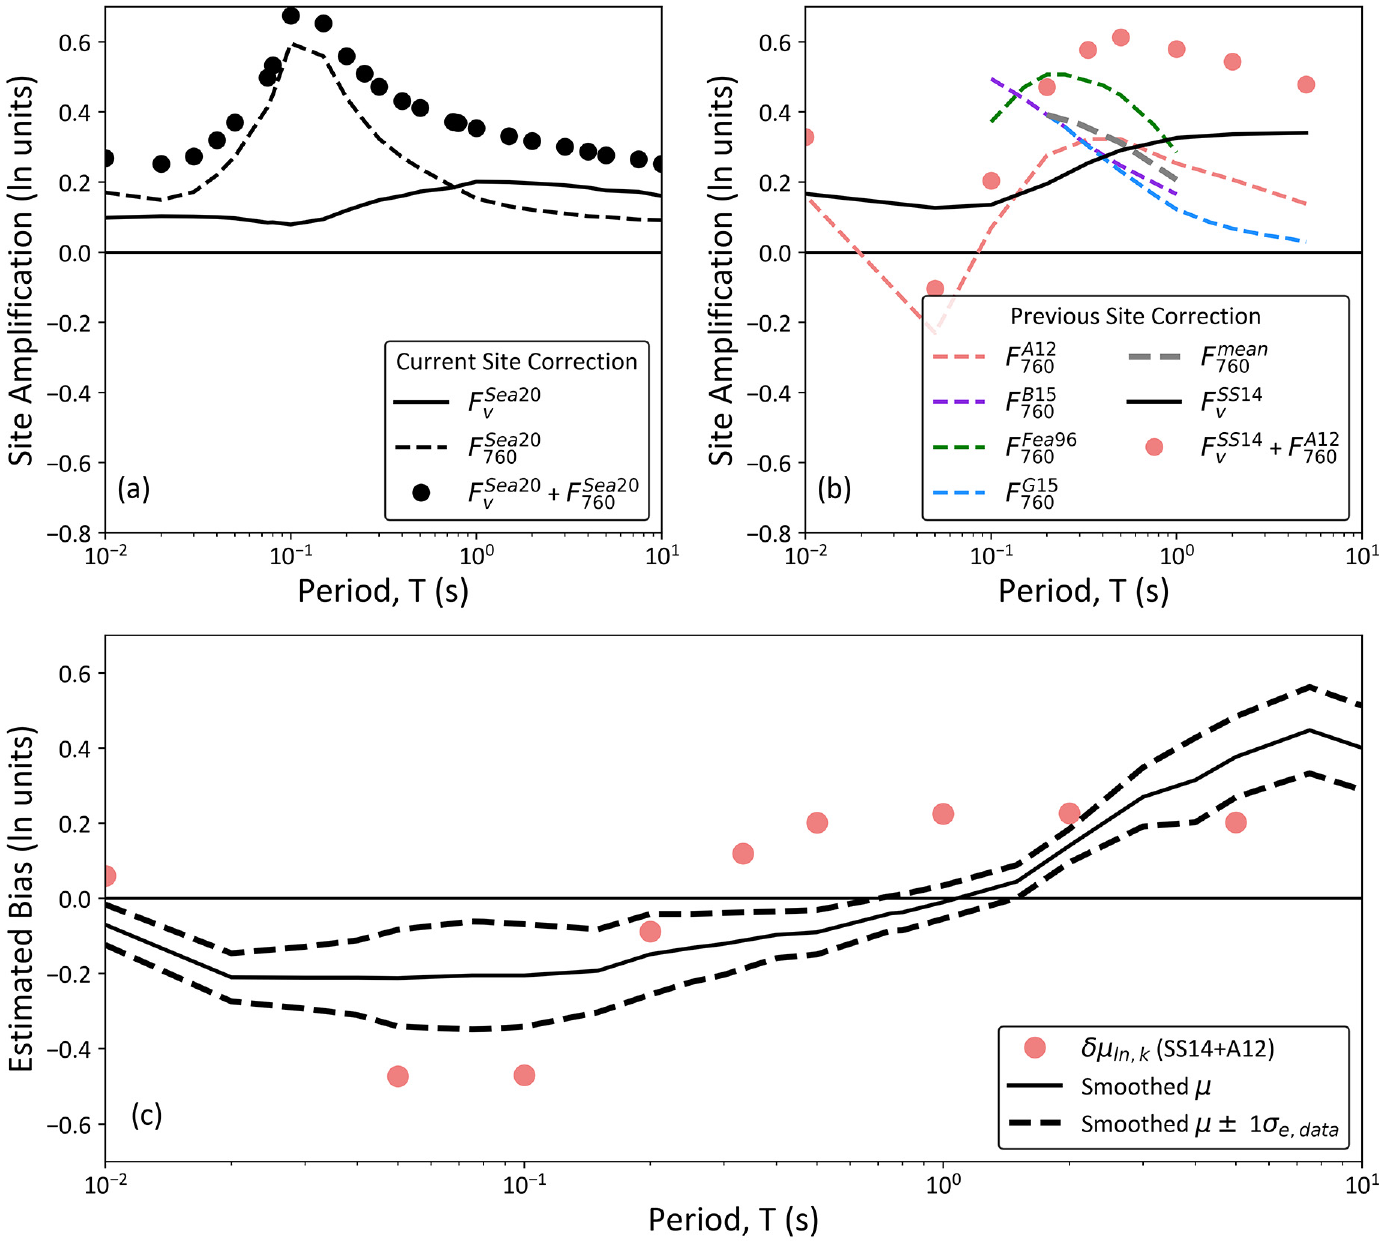
(a) Mean site amplification from FV and F760 components of the Stewart et al. (2020) model across all CENA sites in the non-TOK data set; (b) Mean site amplification from the FV (SS14) and F760 (A12, B15, Fea96, G15) models across all CENA sites in the non-TOK data set; and (c) comparison of site response differences (Equations 9 and 11) to the recommended model adjustment factors. A12 = Atkinson, 2012; B15 and Fea96 from Boore, 2015; G15 = Graizer, 2015; SS14 = Seyhan and Stewart (2014).
Multiple models for
The differences in the Sea20 and Atkinson (2012)F760 models in Figure 13a and b are small for T > 0.4 s, but at short periods the Atkinson (2012) factors are much lower (about 0.4 natural log units between periods of 0.05 and 0.1 s). These short-period differences are caused by distinctly different shapes of the Sea20 and Atkinson (2012)F760 models at short periods, likely indicating different implied κ0 values. The relatively low F760 factors from Atkinson (also observed for Boore, 2015) produce negative misfits, as observed.
Figure 13c compares the differenced site corrections (Equation 9) to the model adjustment factors from Figure 11±
Modifications to F760 for CENA
Since the publication of the Sea20 F760 factors, additional simulations of site response for sites with VS30 = 760 m/s have been performed by Ilhan et al. (2024) and chapter 7 of Centella et al. (2023). That work considered additional VS profiles, additional material damping formulations, and explicit consideration of the range of κ0 captured in the profiles. Most of the profiles apply for an impedance condition, as defined by Sea20. Figure 14 shows how F760 factors derived from that work compare to those in Sea20, separated according to whether the profiles represent impedance or gradient conditions. For impedance conditions, the newer results are larger at long periods and smaller at short periods (T < ∼0.015–0.03 s) than the mean factors in Sea20. For gradient conditions, the newer results are generally larger at short periods (T < 0.25 s) and lower at long periods. Since the impedance condition is more typical for firm-ground sites (VS30 = 760 m/s), the differences between impedance models are more important. If a new F760 model were to be developed that reflected these differences for impedance conditions, it would likely reduce the misfits at both long and short periods.
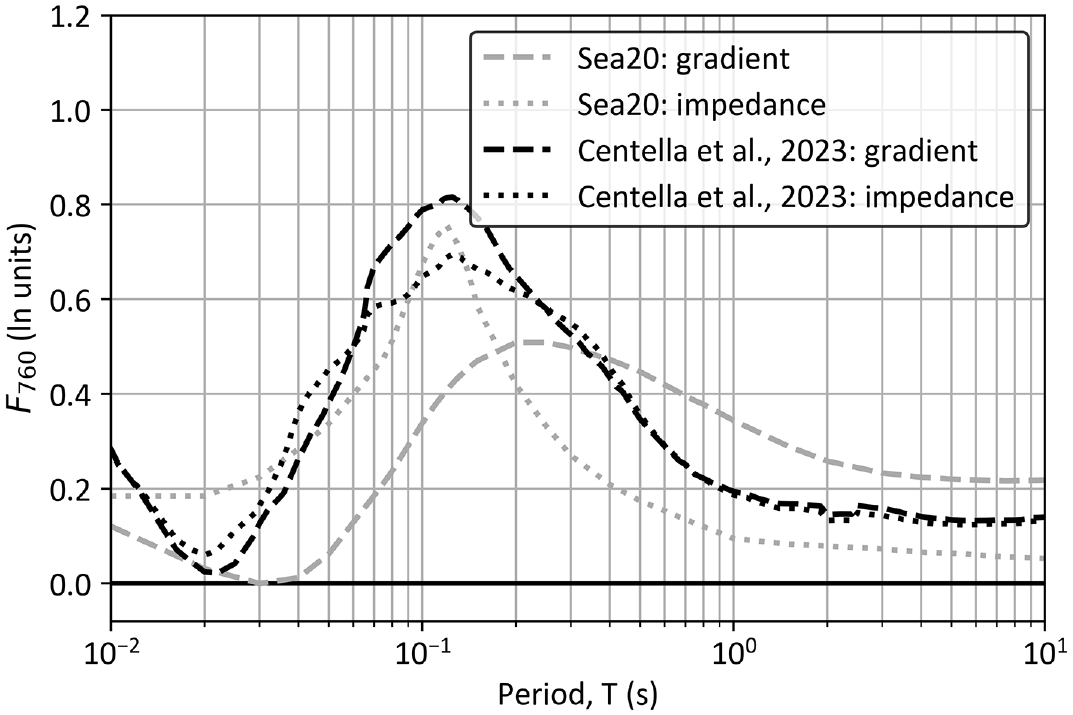
Average F760 values for CENA sites as derived from a weighted combination of the impedance and gradient models as given by Sea20 compared to F760 derived from recent simulations reported in Centella et al. (2023).
The F760 reduction for impedance conditions at short periods is qualitatively consistent with Ktenidou and Abrahamson (2016), who anticipated the potential for overprediction of short-period site response, which they attributed to the NGA-East hard-rock κ0 = 0.006 s being too small. However, the amount of short-period misfits is smaller than anticipated by Ktenidou and Abrahamson (2016).
Misfit attribution
The differences between site amplifications used in NGA-East GMM development relative to those used in application produce ground-motion changes that are generally consistent with the period-dependent pattern of the proposed model adjustments (Figure 13c). While it is difficult to know how much of the overall misfit can be attributed to this effect, it directly impacts multiple seed models and influenced the model integration process that led to the 17 NGA-East GMMs.
As noted previously, we do not anticipate
Conclusions
The USGS NSHM uses hard-rock reference site GMMs from the NGA-East project (Goulet et al., 2021a) and site amplification models recommended by an expert panel (Hashash et al., 2020; Stewart et al., 2020) to estimate ground motions in CENA. Due to asynchronicity in the development of these models, they are not fully compatible with each other. The adjustment factors presented herein allow for compatibility in the joint application of these models. These factors, in effect, adjust the constant terms in the GMMs; the scaling relations (i.e. changes in ground motions with source, path, and site parameters) are unaffected.
Using an expanded CENA data set (relative to that used in the NGA-East project), we examined residuals of the recommended GMMs. While expanded, the range of magnitudes in the database remains limited (
We anticipate that the misfits, which form the basis for proposed model adjustment factors, are associated with both the hard-rock GMMs and the
For PSHA in which all 17 NGA-East GMMs are used (such as in the 2018 and 2023 NSHM), the smoothed model adjustment factors should be used with the epistemic uncertainty given in Table 1 as σe,data. This is the preferred approach because the epistemic uncertainties contained within the 17 GMMs are preserved.
For PSHA in which only the central branch GMM is used, the smoothed model adjustment factors should be used with the uncertainty given in Table 1 as σe.
For applications where nonlinear site response is expected (i.e. the Fnl term in Equation 1 is non-zero), the PGA term that drives the nonlinearity should be modified by the PGA adjustment factor.
For applications in which only the hard-rock GMMs are to be applied, contributions to the bias from the site factors (FS) should be removed, which we anticipate to be solely related to
Footnotes
Acknowledgements
We thank Tristan Buckreis and Victor Contreras for their assistance in assembling the data into a database. We appreciate the helpful feedback on this work from many individuals, including Oliver Boyd, Yousef Bozorgnia, Martin Chapman, Chris Cramer, and Christine Goulet as well as current or former Geotechnical Working Group (GWG) student members Okan Ilhan, Meibai Li, and Dylan Centella Raef. We thank the reviewers of this paper (Sanaz Rezaeian, Behzad Hassani, Norman Abrahamson, Annemarie Baltay and one anonymous reviewer), whose comments helped us improve the technical content of the paper and the clarity of presentation. Finally, we thank the members of a Tiger team appointed by U.S. Geological Survey (Appendix F of Petersen et al., 2023) to review this model; that process resulted in modification of the weight factors applied to different data sets and introduction of the stiff site modification (![]() ). Any use of trade, firm, or product names is for descriptive purposes only and does not imply endorsement by the US Government.
). Any use of trade, firm, or product names is for descriptive purposes only and does not imply endorsement by the US Government.
Declaration of conflicting interests
The author(s) declared no potential conflicts of interest with respect to the research, authorship, and/or publication of this article.
Funding
The author(s) disclosed receipt of the following financial support for the research, authorship, and/or publication of this article: Support for this research project was provided by U.S. Geological Survey External Research Program under contract number G21AP10370. This support is appreciated.
Data resources
Raw ground-motion recordings were retrieved from International Federation of Digital Seismograph Networks (FDSN) data centers of IRIS Data Services using gmprocess (Hearne et al., 2019). IRIS Data Services are funded through the Seismological Facilities for the Advancement of Geoscience (SAGE) Award of the National Science Foundation under Cooperative Support Agreement EAR-1851048. The time series and metadata used in this study are archived in a publicly web-serviced ground-motion relational database (Buckreis et al., 2023). The ground-motion database uses MySQL (by Oracle Corporation, http://www.mysql.com/) as the management system, and an application programming interface (API) was written to facilitate queries using URLs (https://uclageo.com/gm_database/api/index.php, last visited 23 May 2023). Ground-motion records from NGA-East and newly added records are stored in the database under the “collection_id”=3 and “user_id”=2, respectively. The specific data resources applied in this project are provided as source, site, and ground-motion flatfile tables by ![]() .
.