
Abstract
Data from 15 earthquakes that occurred in 12 different countries are presented showing that, without better drift control, structures built with building codes allowing large seismic drifts are likely to keep leaving a wide wake of damage ranging from cracked partitions to building overturning. Following the earthquake sequence affecting southeast Turkey in 2023, a team led by Committee 133 of the American Concrete Institute surveyed nearly 250 reinforced concrete buildings in the area extending from Antakya to Malatya. Buildings ranging from 2 to 16 stories were surveyed to assess their damage and evaluate the robustness of their structures in relation to overall stiffness, as measured by the relative cross-sectional areas of structural walls and columns. The majority of the buildings were estimated to have been built in the past 10 years. Yet, the structures surveyed were observed to have amounts of structural walls and columns comparable with amounts reported after the Erzincan (1992), Duzce (1999), and Bingol (2003) Earthquakes in Turkey. These amounts are, on average, much smaller than the wall and column amounts used in Chile and Japan. Because of that lack of robustness and given the intensities of the motions reported from Antakya to Malatya (with 10 stations with peak ground velocity (PGV) of 100 cm/s or more), it is concluded that structures in this region experienced large drifts. Excessive drift (1) exposed a myriad of construction and detailing problems leading to severe structural damage and collapse, (2) induced overturning caused by p-delta for some buildings, and (3) caused widespread damage to brittle masonry partitions. The main lesson is simple: ductility is necessary but not sufficient. It is urgent that seismic drift limits are tightened in high-seismicity regions worldwide.
Background
In 1923, the Great Kanto Earthquake caused widespread devastation in Tokyo. Nevertheless, buildings designed by T. Naito performed well (Shiga et al., 1968). Damage caused by the 1933 Long Beach Earthquake prompted G. Howe (1936), an American architect, to study the work of Naito and to try to communicate his ideas to American engineers. Naito was emphatic in recommending the use of structural walls to make buildings stiff. Nevertheless, the American profession focused on the then-recently-discovered acceleration spectrum and did not follow that advice. The first codes for seismic design published in California in the 1950s clearly favored moment-resisting frames over structural walls. The rest of the world, except Chile and Japan, followed that example. The first seismic code for Turkey was published in 1940 (T.C. Bayındırlık Bakanlıgı, 1940) adopting the Italian code of the time. The San Fernando Earthquake of 1971 showed that, without detailing to produce ductility (i.e. deformability), the moment-resisting frame was inadequate (Fintel, 1991). Most countries have since emphasized detailing for ductility instead of imposing more stringent drift limits despite Naito’s and later M. Sozen’s advice. As early as 1980, Sozen (1980) demonstrated—through controlled experiments and analysis—that the focus of earthquake-resistant design should be on drift instead of acceleration and force. Field work by Hassan and Sozen (1997) demonstrated the critical relevance of structural robustness in absence of good detailing. A century after Kanto, we are still paying the consequences of the lack of emphasis on building stiffness in design. Competent detailing can help avoid collapse, but (1) it is difficult to achieve in the absence of strict quality control, and (2) it does not help control drift. Excessive drift, in turn, causes (1) widespread damage to partitions, facades, finishes, and other nonstructural building components, (2) instability, and/or (3) failures in elements built without the mentioned quality control or with untested details.
Drift is driven by initial period and ground-motion intensity. It is impossible to control the latter, and, therefore, the only way to control drift is through period. In cast-in-place reinforced concrete (RC) buildings without dampers and isolation devices, the simplest way to control period is through controlling stiffness. Increases in mass associated with increases in stiffness are seldom critical. The corresponding increases in cost are not drastic either, especially if structural walls are used (García et al., 1996). Some authors advocate increasing longitudinal reinforcement ratios to increase stiffness. It is not clear that increases in reinforcement always lead to reductions in drift (Pujol et al., 2022; Shah, 2021).
Introduction
In a mission led by Committee 133 of the American Concrete Institute (ACI, 2023) nearly 250 buildings were surveyed by engineers and researchers from a wide consortium of entities (Table 1) to try to explore whether general trends could be observed between the frequency of damage and overall structural properties. The survey followed the methods and ideas proposed by Hassan and Sozen (1997). The response of a building to an earthquake is the intersection of effects from a large number of factors including type and extent of the rupture, site properties, distance to the fault line, structural configuration, reinforcement detailing, material properties, workmanship, quality control, and so on. Nevertheless, in that complex phenomenon, overall trends between key structural properties and building performance are plausible. This study focuses on testing whether structural robustness, expressed in terms of relative cross-sectional areas of structural walls, columns, and—in general—overall stiffness, may have correlated with performance of building structures shaken by the Earthquakes of February 2023 in Turkey. The focus of the investigation was on cast-in-place RC multistory buildings that were neither directly above the fault rupture, nor affected by liquefaction or foundation failures. Neither of these factors caused widespread damage in the cities visited, as far as the surveyors could see.
Participating institutions.
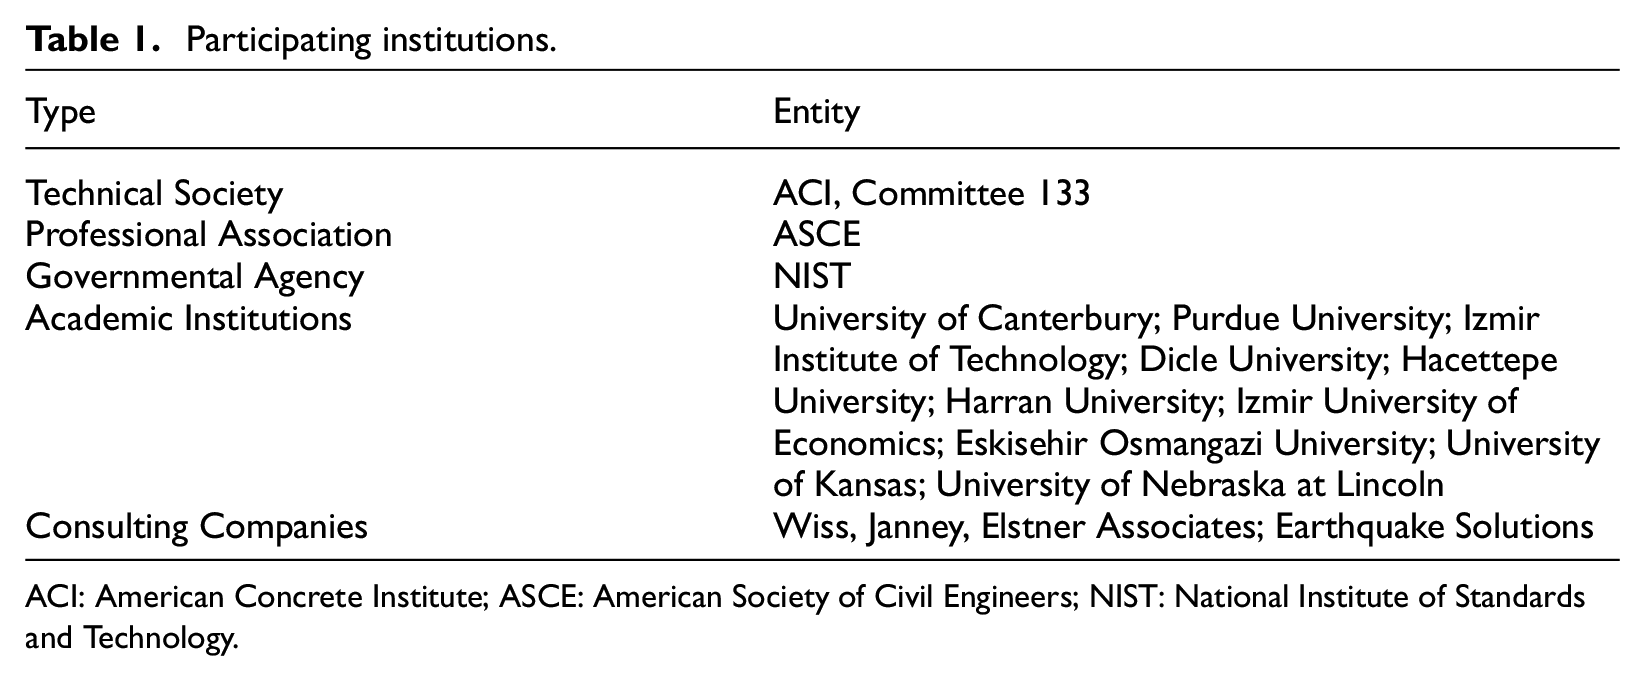
ACI: American Concrete Institute; ASCE: American Society of Civil Engineers; NIST: National Institute of Standards and Technology.
The earthquakes
Two main earthquakes affected southern Turkey and northwestern Syria on 6 February 2023: one quake with
Figure 1 illustrates the locations of surveyed cities (blue symbols) and the intensities of the motions registered by instruments in or near them (red symbols). Intensity is represented in this figure in terms of displacement spectra obtained for linear single-degree-of-freedom systems (SDOFs) with a damping ratio of 5%. Black and gray straight lines represent the design basis earthquake (DBE) and the maximum considered earthquake (MCE) specified with the current Turkish design standards for each location. They are plotted against linear spectra obtained from acceleration records reported by the Turkish Disaster and Emergency Management Authority (AFAD-Afet ve Acil Durum Yonetimi Baskanlıgı) (2023). In most cases, the DBE motion was exceeded, and near Antakya, even the MCE motion defined as the 2475-year return period event was exceeded for periods exceeding
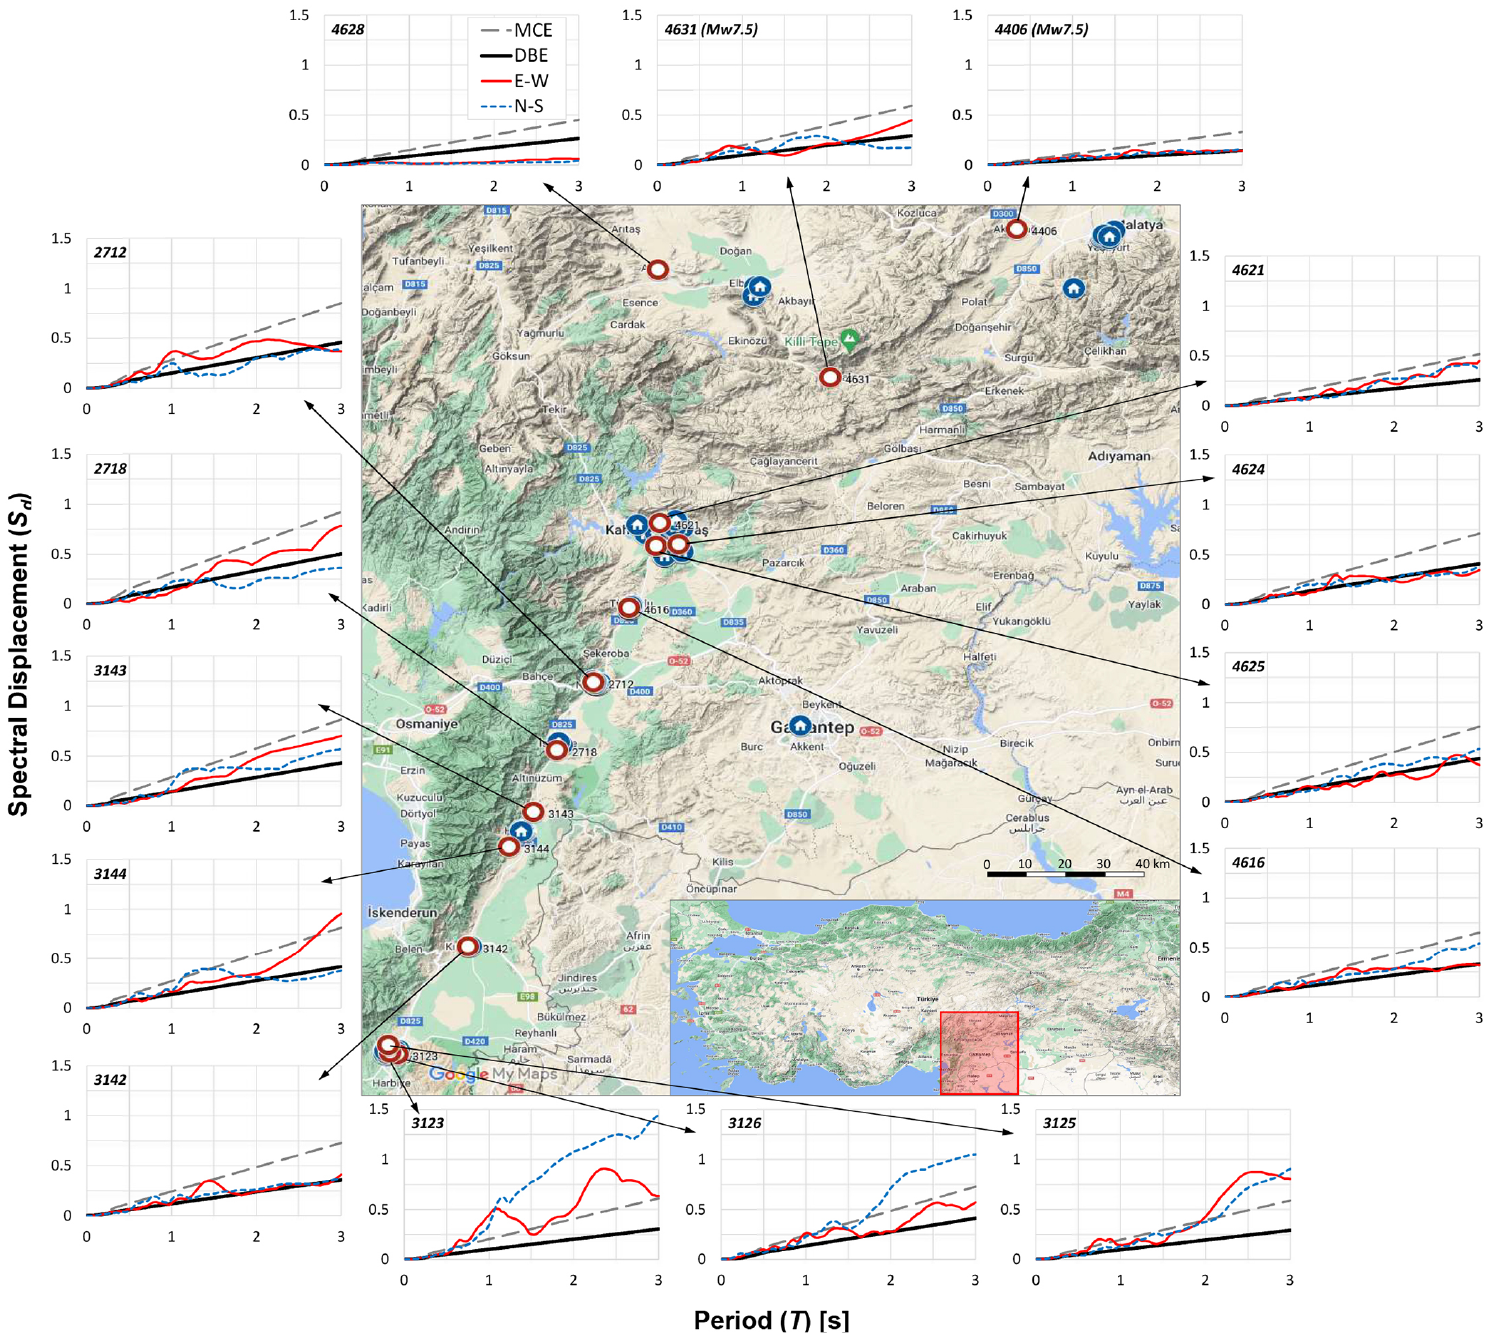
Affected area and the displacement demands of the recorded ground motions (red lines are for the “east-west (E-W)” direction, and the blue lines are for the “north-south (N-S)” direction) in comparison with current Turkish seismic regulation spectra.
The average slope of the most intense displacement spectrum in Figure 1 (corresponding to the N-S direction in Antakya, station 3123) was nearly
Survey method and definitions
A total of 322 reinforced concrete buildings in the cities of Antakya, Islahiye, Hassa, Kirikhan, Nurdagi, Turkoglu, Gaziantep, Kahramanmaras, Malatya, and Elbistan were surveyed between 25 March and 6 April 2023. Complete sets of the parameters described here were obtained for 242 of those 322. Survey teams consisted of three to four members each including researchers, engineers, architects, and engineering students. In total, approximately 40 people participated in the survey. At least one person in each team had previous experience in classifying earthquake damage. Surveying each building lasted roughly 1 to 3 hours. Each team, on average, surveyed 3–5 buildings per day. No clear signs of liquefaction or foundation problems were observed in the buildings surveyed.
Surveyed buildings were selected based on accessibility, size, age, and complexity. No effort was made to select buildings on the basis of their damage level, although buildings that were judged to be unsafe to enter were not surveyed. Most surveyed buildings had been constructed after 2000. Some effort was invested to survey taller buildings and buildings with more structural walls. The following information was collected for each building: Height; age; number of stories; location of the building; the presence of captive columns, soft stories, or irregularities; cross-sectional dimensions of columns and orientations, structural, and nonstructural walls; approximate floor plan dimensions; the presence of regular beams deeper than slabs (vs shallow-beam floor systems called “asmolen” frames); photographs; and damage classification.
Structural damage was classified as
None
Light (hairline cracks in RC walls, beams, or columns)
Moderate (cover spalling or wider cracks in RC walls, beams, or columns)
Severe (bar buckling, disintegration of the concrete core, or bond-splitting failure in RC walls or columns)
Critical (widespread severe damage affecting a number of columns and/or structural walls to the point that the building was deemed to be likely to collapse in an aftershock)
Collapse (loss of elevation of one or several floors).
Nonstructural damage was classified as
None
Light (hairline cracks or light flaking of plaster)
Moderate (cracks in partition walls and joints or flaking of large pieces of plaster)
Severe (wide and through cracks in partition walls and joints)
Collapse (complete or partial collapse of partition walls).
The collected data are public, maintained by ACI Committee 133, and available here:
https://www.dropbox.com/sh/6cmdgdn82n9ufxr/AACt-1rberSKM4fFFaDeL3_5a?dl = 0
For each building, data were collected at the “critical floor level” defined as the level deemed by surveyors in the field to produce the lowest values for the following calculated parameters:
Column Index =
Wall Index =
Column Density =
Wall Density =
Largely, the critical floor level was considered to be the ground level. In buildings with podiums (i.e. lower stories with larger floor plans), survey teams decided in the field whether the first level above the podium could be deemed more relevant than the ground level. In all cases, the area above the critical level refers to areas of elevated slabs above said level, including balconies and overhangs. This definition is an attempt to produce a value proportional to “seismic mass.” In buildings with penthouses, the area of the penthouse was estimated (from elevation, satellite, or drone views), and a fraction of the typical floor area was added to the total floor area above the critical level. Other cases needing judgment calls from the survey teams to define total floor area included buildings with partial height basements, founded on slopes, or with light wooden or metal roofs. The survey method could be and has been applied elsewhere, but it is targeted to low- and mid-rise RC building structures and has not been tried nor adapted for other types of structures.
Observations
Structural systems
RC frames with beams deeper than slabs
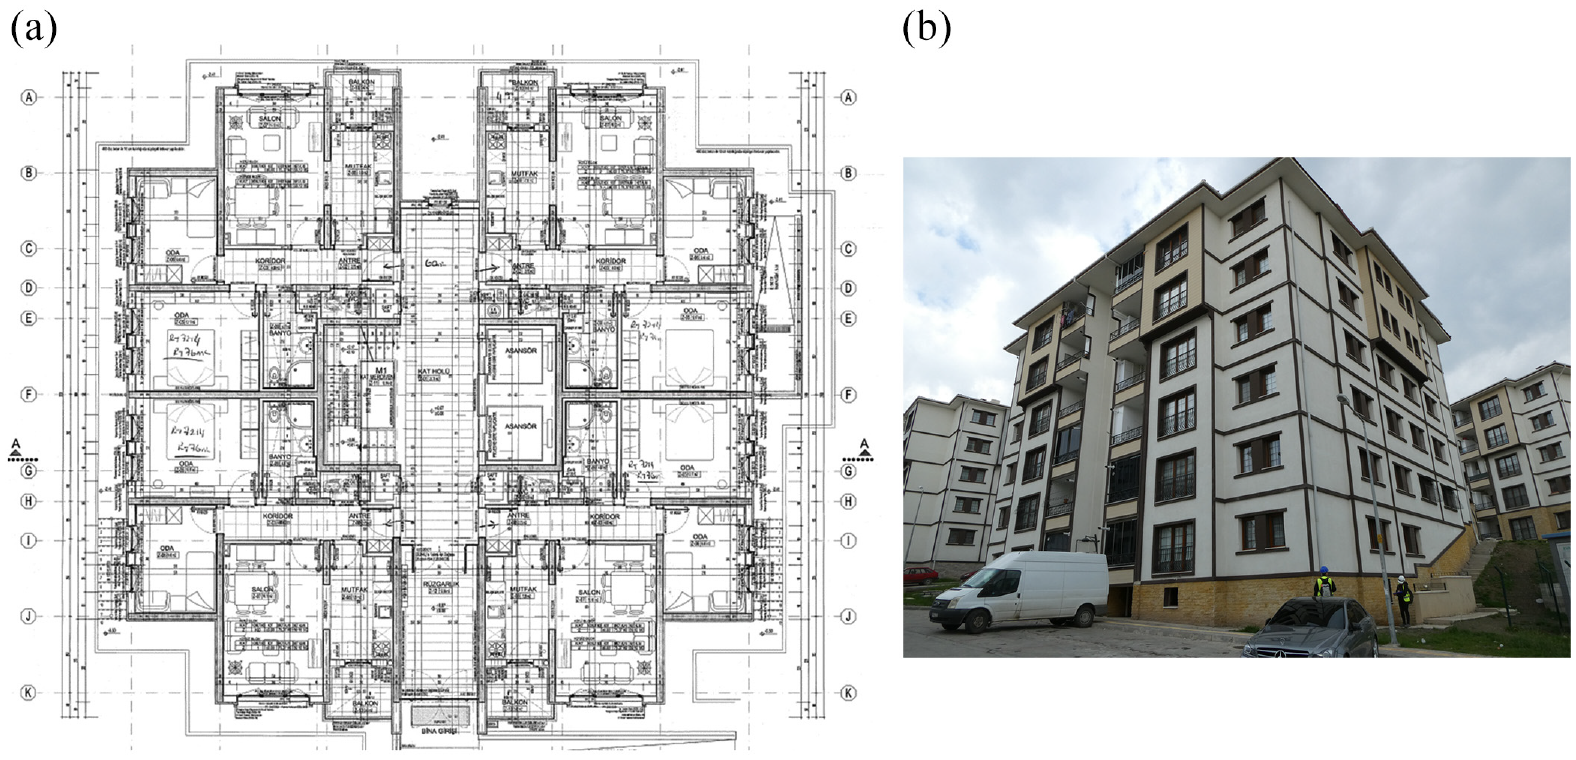
Most surveyed structures had RC frames with RC or masonry infill walls located around an elevator shaft. Where beams deeper than the slabs were observed, they were typically framed into columns. But frames tended to have highly irregular column lines across floor plans (Figure 2) with columns not always aligned along straight gridlines and, in some instances, with beams framing into other beams instead of columns. Some buildings also had upper columns or walls which did not reach the foundation but were supported instead by transfer beams. The longitudinal axes of beams were often offset from the longitudinal axes of supporting columns. Along perimeters, these offsets were introduced to align exterior beam and column faces. Gemici (2019) showed that the described irregularities can cause increases in the initial period of up to 50%.
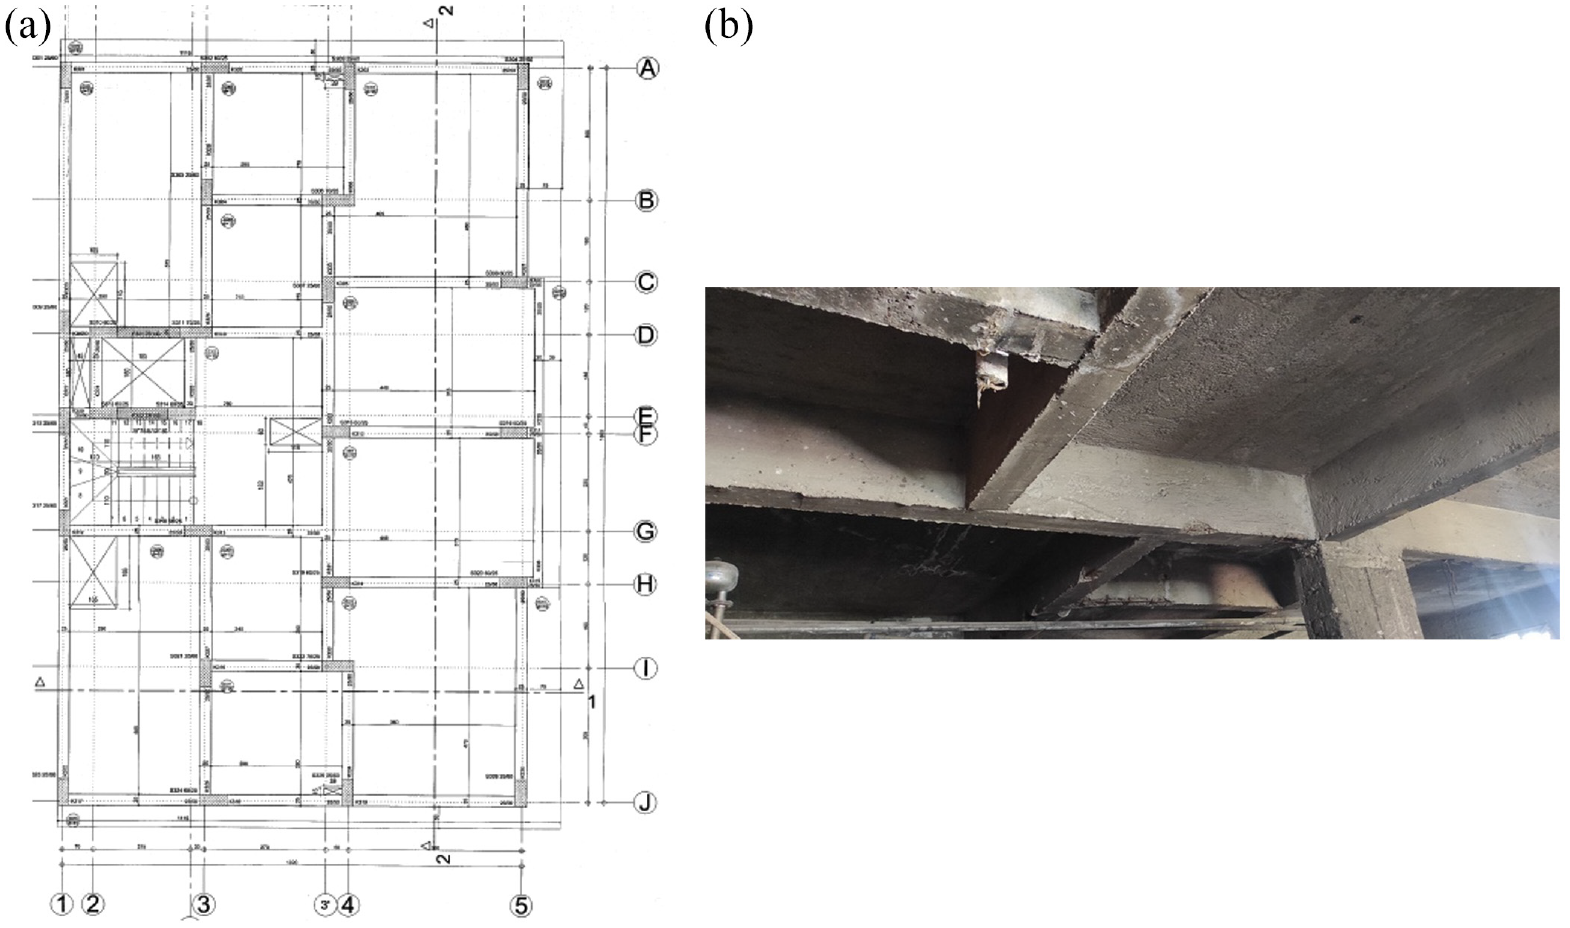
Irregular framing examples: (a) floor plan and (b) floor soffit.
RC frames with shallow beams
In nearly 25% of the structures surveyed, the flooring system consisted of “shallow beams” and one-way joists. Typical dimensions of shallow-beam frames that are often called ribbed slabs in the United States (called “asmolen” or “disli doseme” systems in Turkey) are shown in Figure 3 together with a photograph of such a frame during demolition (building located in Nurdagi, Gaziantep). In these frames, beam depths did not exceed the depths of the joists (typically 30–35 cm) in the interest of producing a flat ceiling. Joists were formed during casting by using rows of hollow concrete masonry units (CMU) that remained in place and became part of the floors.
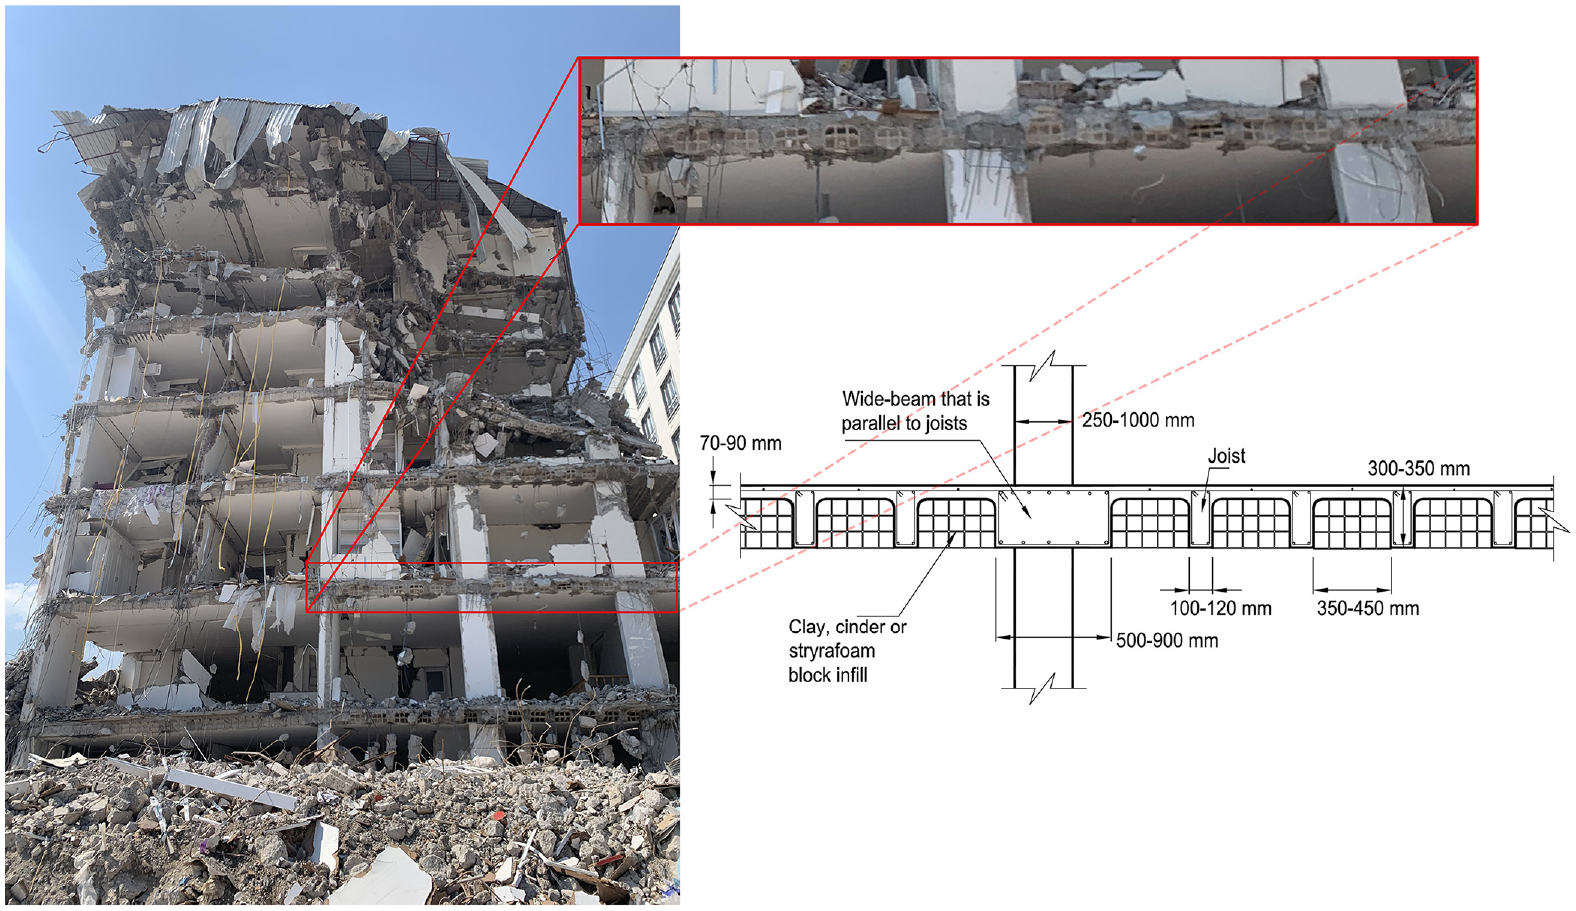
Partially demolished reinforced concrete frame with shallow beams and typical dimensions of one-way joist-slab shallow-beam frames in Turkey.
Observations are organized in Figure 4 to show the distribution of damage classifications for surveyed buildings with regular and shallow-beam frames. Evidently, the frequency of severe damage was higher among buildings with shallow beams (88% compared with 59% for frames with regular beams—deeper than slabs). These observations are consistent with the findings of Dönmez (2015), who showed that frames with shallow beams have lower stiffness and higher seismic drift demands.
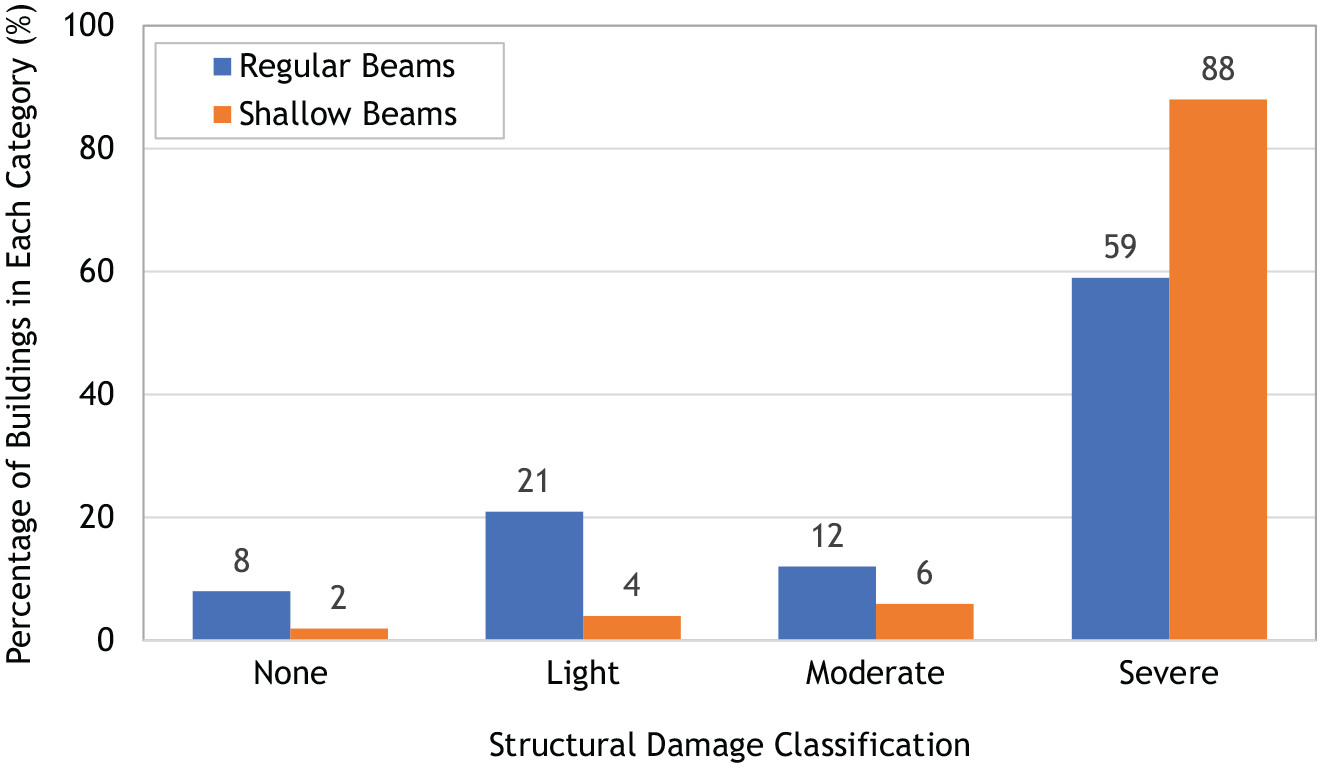
Damage frequency observed in reinforced concrete frames with regular beams and shallow beams (critical and collapsed structures are included within the bin labeled “severe”).
Wall construction
A limited number of buildings were observed to have been built with a method known as “tunnel-form construction” (illustrated here: https://youtu.be/_j-FRe8Ay9s). These structures tend to have abundant structural RC walls (occupying 2% to 6% of a typical floor plan). They were observed to be configured in one of two ways: (1) including similar amounts of wall in each principal floor plan direction, or (2) with most walls oriented in a single floor plan direction. The latter cases were observed to have more signs of structural distress, whereas buildings with well-distributed walls in both orthogonal plan directions commonly performed well, exhibiting only light damage (Figure 5).
Wall structures with similar amounts of wall in each principal floor plan direction: (a) typical floor plan and (b) example of wall building built by Housing Development Administration of Turkey (TOKI-Toplu Konut Idaresi Baskanlıgı) at Dulkadiroglu, Kahramanmaras.
Structural configuration issues
The following problems related to the configuration of the surveyed structures were observed. The numbers on the figures in Supplementary Material 1 correspond to the items listed below:
Lack of structural walls (Supplementary Material 1);
Irregular column lines (Figure 2);
Differences in lateral stiffness in the two principal floor plan directions;
Insufficient separation between buildings leading to pounding;
Beam axes offset from column axes (Supplementary Material 1);
Beams framing into other beams instead of columns (Supplementary Material 1);
Short beams (not detailed to resist high shear forces) (Supplementary Material 1);
Columns discontinuous in elevation (i.e. columns supported by transfer girders);
Soft stories caused by dense masonry infill concentrated in upper floors and open-plan ground stories (Supplementary Material 1);
Lack of beams (deeper than slabs) (Supplementary Material 1); and
Heavy overhangs (Supplementary Material 1).
Quantitative evidence collected in Turkey shows that the most salient issues that affected RC buildings in the southeast region of Turkey extending from Antakya to Malatya were inadequate structural stiffness and deficient reinforcement detailing. It was apparent in the field that buildings with flexible lateral force-resisting systems performed worse than robust buildings with structural walls in both principal plan directions. In general, the surveyed buildings were found to have low amounts of walls and columns as reflected by the indices given in Table 2.
Column and wall indices for the surveyed buildings.
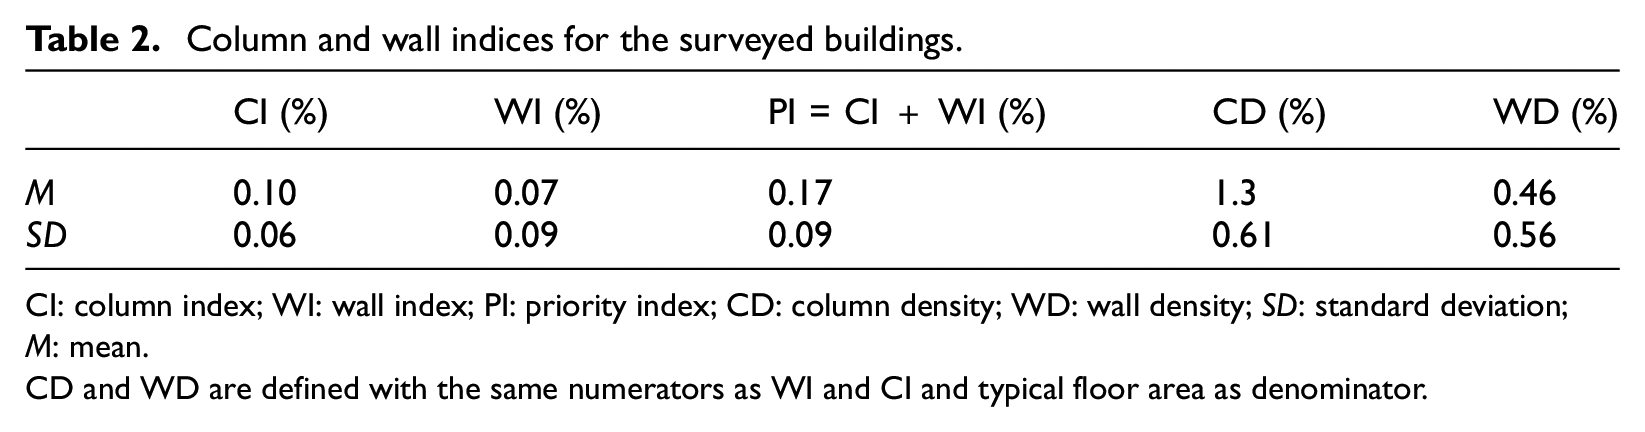
CI: column index; WI: wall index; PI: priority index; CD: column density; WD: wall density; SD: standard deviation; M: mean.
CD and WD are defined with the same numerators as WI and CI and typical floor area as denominator.
For context, consider that Hassan and Sozen (1997) recommended a minimum value of CI+WI of 0.25% (to prioritize retrofit efforts). Consider also that buildings in Chile have been reported to have much higher wall areas, with WI on the order of 0.3% for 10-story buildings (Figure 3.10 of the work by Riddell et al., 1987). Other comparisons with indices from other regions are provided in the “Comparisons with Previous Observations” section.
Detailing issues
Problematic reinforcing bar details were repeatedly observed by the reconnaissance teams. Several are described below and classified based on whether the details comply with ACI 318-19 (2019) (or similar building codes). No attempt is made to attribute responsibility for the presence of details that did not comply with building regulation requirements. Photographs of the following detailing issues that do not comply with building regulation requirements are provided online with Supplementary Material 2. The numbers on the figures in Supplementary Material 2 correspond to the items below.
Concrete cover or longitudinal bar spacings smaller than required: This defect was observed in elements affected by cover spalling. Both spalling and small cover can affect the bond between the longitudinal bars and concrete, especially along lap splices.
Lack of 135°hooks (90°hook–ties): 90° tie hooks were often observed where longitudinal bar buckling and damage to the core concrete had occurred.
Widely spaced transverse reinforcement around small-diameter longitudinal bars: Hoops or ties spaced at 15 cm or wider spacings were frequently observed. With longitudinal bars having diameters
Widely spaced transverse reinforcement at cold joints: Longitudinal bar buckling was observed at the bases of columns with acceptable confinement elsewhere because the space between the topmost foundation hoop and the bottommost column hoop was excessively large. Care during construction is necessary to ensure proper hoop spacing across cold joints.
Lap splices at column bases: Longitudinal bars were often lap spliced at the bases of columns, which ACI 318-19 (2019) prohibits in seismic design categories (SDC) D, E, and F. Aside from being prone to abrupt failure, lap splices at column ends concentrate strains at member ends where buckled and fractured bars were often observed.
Lap splices at wall bases: Since 2019, ACI 318 prohibits lap splices in wall boundary-element longitudinal reinforcement near sections where yielding is expected. Lap splices are prone to abrupt failure, but even when they do not, lap splices cause sharp curvature and strain concentrations at their ends. Photographs 6a and 6b in Supplementary Material 2 show (1) a 2.7-m-long wall with lap splices starting 0.7 m above the top of the foundation; wall damage concentrated within a narrow band near the wall base, and (2) a 2.2-m-long wall with longitudinal bar lap splices beginning just above the foundation; a prominent horizontal crack with bar buckling and severe concrete damage occurred at the top of the splices.
Lack of confinement for column and wall longitudinal bars inside foundation: Several examples were observed of buckled column and wall longitudinal bars below the top of the foundation or in grade beams. This occurred near foundation edges where the bars were not confined. This is a life-safety issue because the buckled bars can cause columns to move laterally and no longer bear on the foundation (Supplementary Material 2, Photograph 7b). This detail is prohibited in ACI 318-19 Section 18.13.2.4 for longitudinal bars of columns and boundary elements of special structural walls in SDC D, E, or F. ACI 318 and other standards should apply the requirement to confine bars within foundations to intermediate moment frame columns.
Lack of crossties in columns and structural walls: buckled longitudinal bars and severely damaged concrete were observed in columns and walls without through-thickness crossties. Long hoop legs or horizontal web bars did not provide adequate confinement for these load-bearing RC members.
Offset-bent longitudinal bars (so-called “Dog-Leg” detail) at the base of columns/walls: Column and wall longitudinal bar buckling and fracture were frequently observed at the top of a foundation where an offset-bent detail was used (where a longitudinal bar extending from the foundation is bent toward the center of the section and then bent again to orient the tail parallel to the longitudinal bars for splicing). Although offset-bent longitudinal bars are permitted, the observed slope of the inclined portion typically did not comply with ACI 318-19 (2019) requirements.
Nonstructural element penetrations through structural elements (beams, columns, walls, and slabs): Penetrations through structural elements are permitted if detailed appropriately. Ad hoc penetrations, like that shown in Supplementary Material 2, Photograph 10, did not satisfy building standard requirements and were often associated with concrete cracking and spalling.
Masonry infill walls not isolated from the structure or mechanically anchored to the surrounding structure: Brittle infill walls made with hollow clay tile, cinder blocks, and aerated autoclaved concrete blocks (called “gazbeton” in Turkey) and butted directly against the structure were observed to fail even in buildings without perceptible structural damage. Numerous buildings without structural damage but widespread damage to brittle partitions were evacuated and reportedly scheduled for demolition.
Photographs of the following detailing issues that appear to comply with ACI 318-19 (2019) building code requirements are provided in Supplementary Material 3. The numbers on the figures in Supplementary Material 3 correspond to the items below. Observed detailing issues that comply with ACI 318-19 (2019) requirements:
Unconfined beam bars in beam-column joints: Supplementary Material 3 shows joints with unconfined outermost beam longitudinal bars outside the column core. A vertical splitting plane caused cover spalling, leaving the exposed beam bars unrestrained and unbonded. For special moment-resisting frames, ACI 318-19 (2019) requires beam longitudinal reinforcement outside the column core to be confined, but this requirement does not apply to frames not designated as part of the seismic-force-resisting system.
Bar termination locations in beams: Wide cracks and spalling were often observed where bottom beam longitudinal bars were terminated. The problem appeared to be most prevalent in shorter beams, beams with bars terminating within approximately two member depths from the column face, and in beams with light transverse reinforcement. ACI 318-19 (2019) does not appear to address potential problems related to the termination of bottom beam reinforcement close to column faces in frames resisting earthquake demands.
Damage to short beams between walls (not detailed as coupling beams): Heavy damage was observed in short beams linking structural walls. These beams did not have diagonal bars and appeared not to have been classified as part of the seismic-force-resisting system. Nevertheless, the extent of damage contributed to concerns among residents and, often, was reportedly a basis to justify demolition.
The perception of the surveying teams is that correcting the listed detailing issues would have reduced the observed damage and could have prevented several collapses. Nevertheless, correcting these details would not have reduced damage to nonstructural elements or prevented collapses attributable to excessive drift.
Issues with nonstructural elements
Severe damage to nonstructural elements was widespread, often making structures unusable and unsafe even when structural damage was light. Approximately 90% of surveyed buildings with masonry infill walls were classified as having either severely damaged or collapsed partitions and facades. There were very few instances of studded gypsum-board (drywall) partitions, and these partitions were observed to be (1) less prone to complete disintegration and collapse, and (2) less dangerous to building occupants. Use of studded gypsum board or other lightweight partitions that are restrained out-of-plane while allowing for in-plane displacement—relative to the structure—is strongly recommended. Where masonry infill walls are used, they should be separated from the frame but reinforced and restrained against out-of-plane movement. Examples of damage to reinforced concrete stairs, which was widespread, are provided online in Supplementary Material 4. Stairs are an essential means of egress, and the extent and prevalence of severely damaged stairs are a concern. Typical details were inadequate for accommodating large story drift demands.
Correlations between damage and intensity measures
Table 3 and Figure 6 show damage frequencies (% of inspected buildings observed to have damage) organized against several intensity measures:
Spectral displacement (
Spectral velocity (
Spectral acceleration (
Damage frequencies and intensity measures.
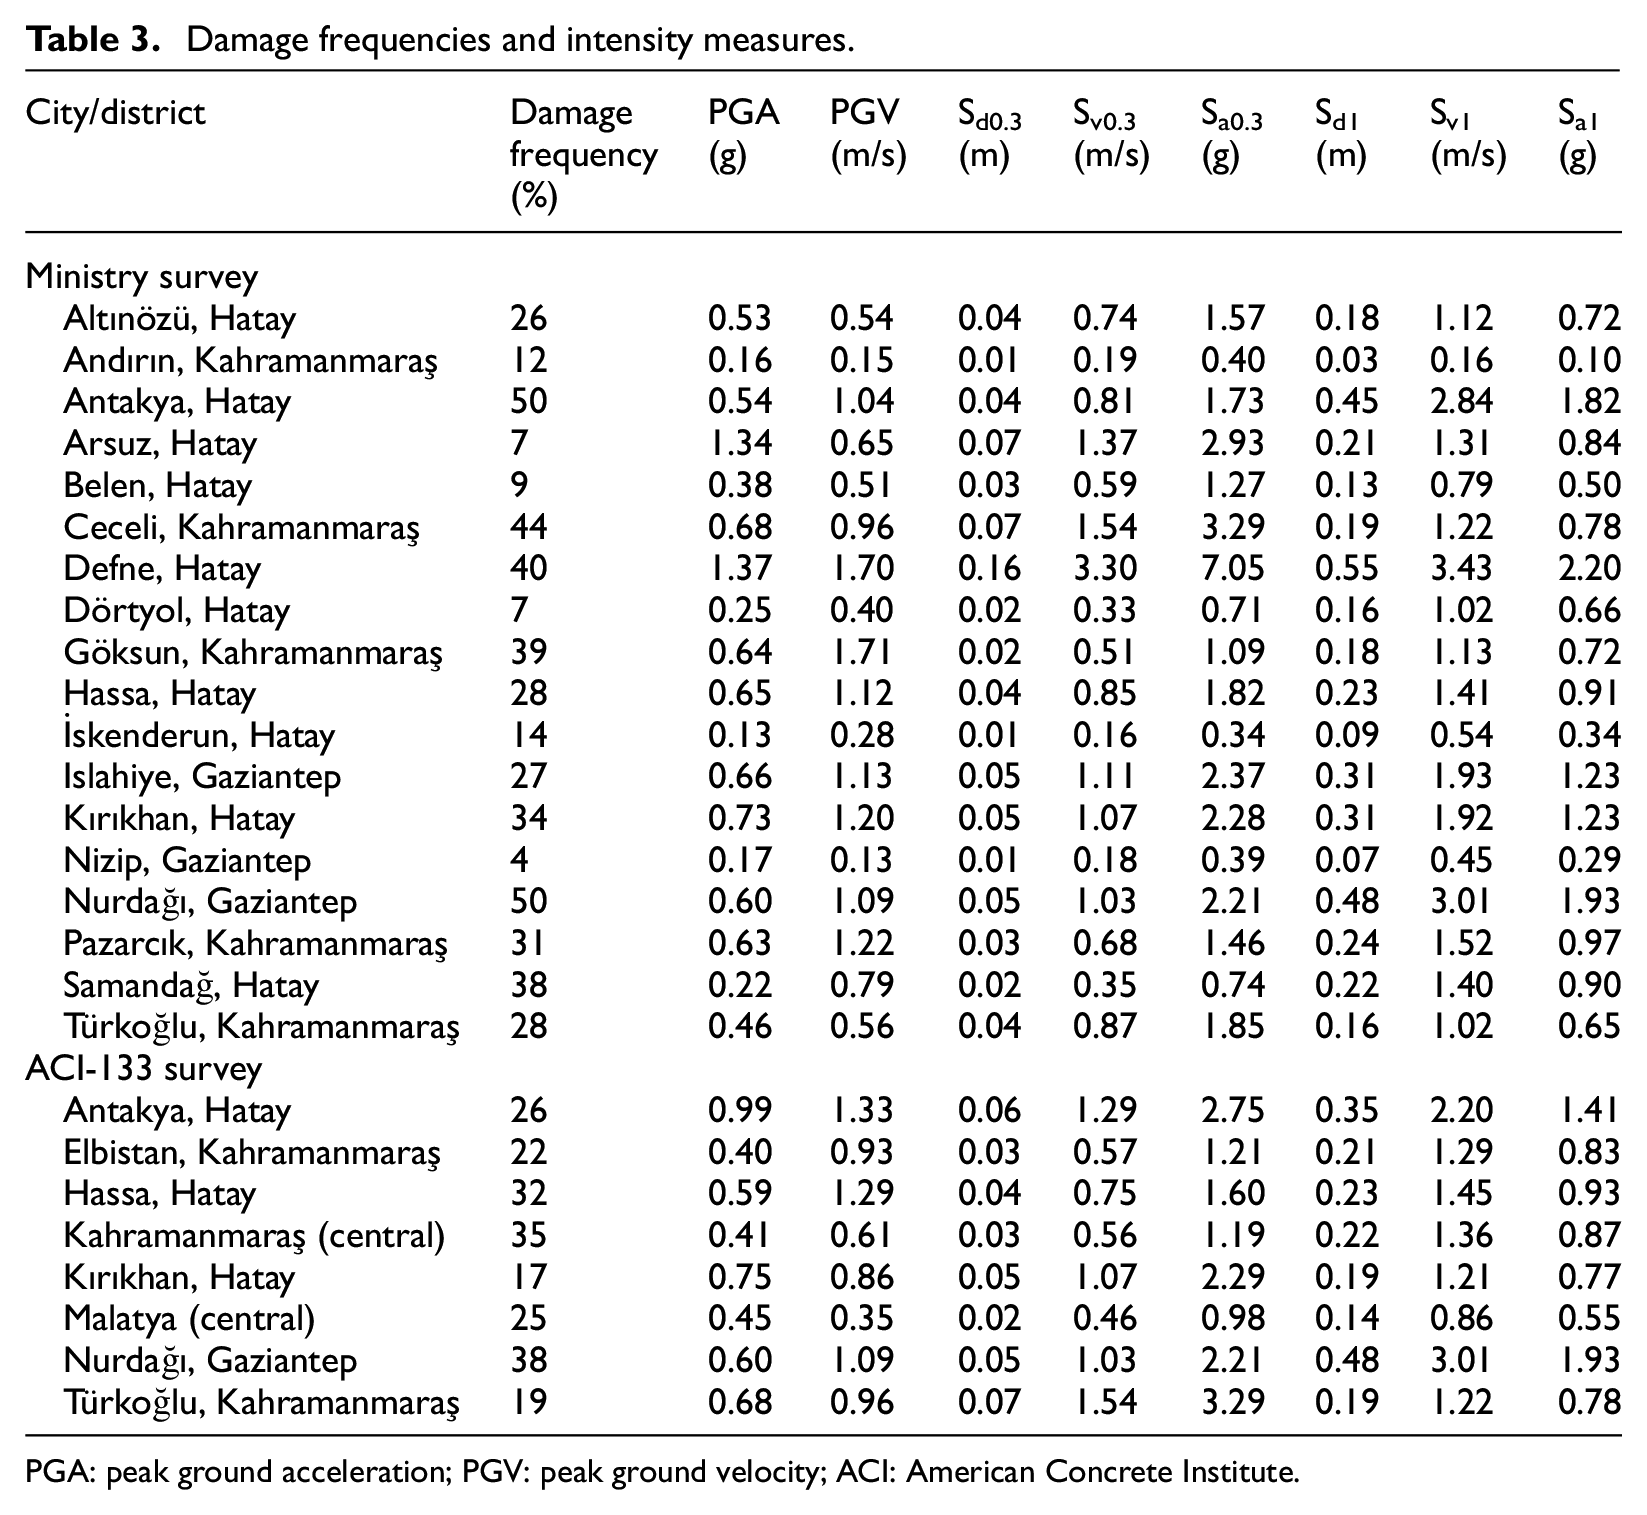
PGA: peak ground acceleration; PGV: peak ground velocity; ACI: American Concrete Institute.
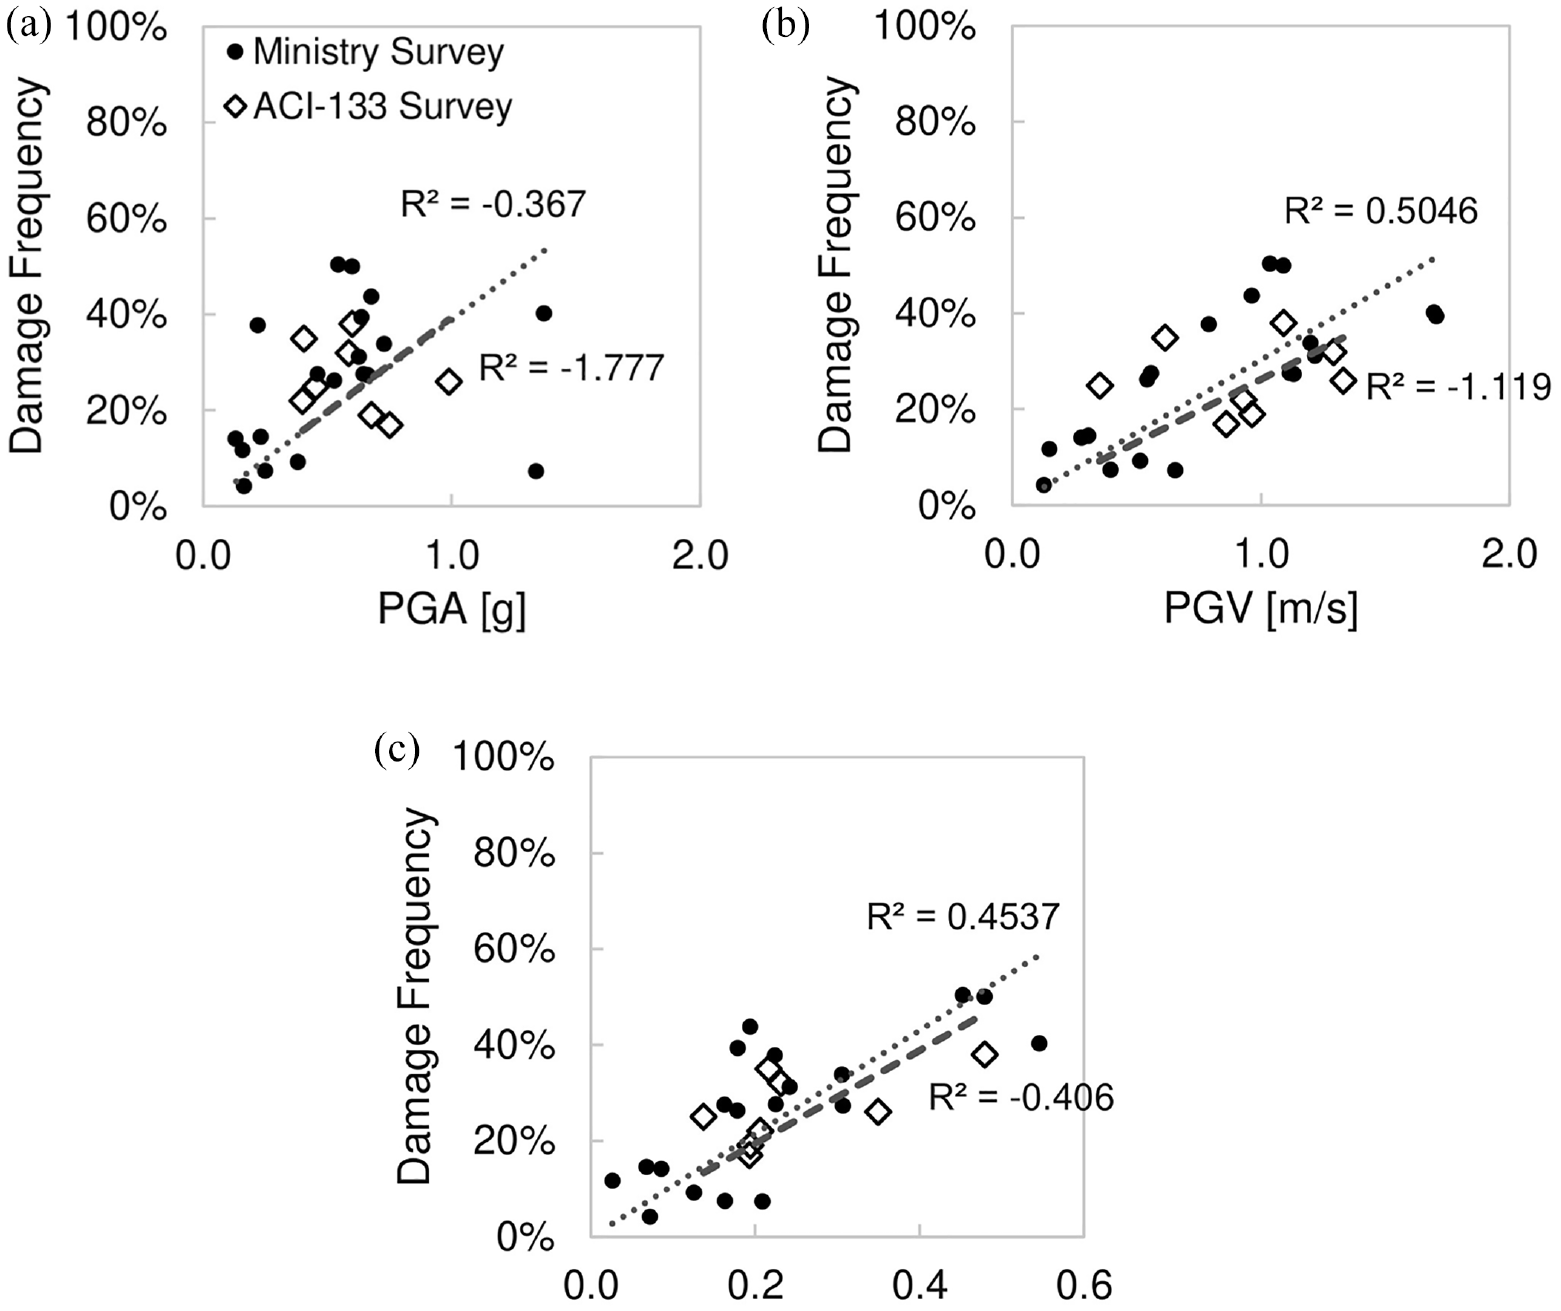
Correlations between damage intensities and intensity: (a) peak ground acceleration as the intensity measure, (b) peak ground velocity as the intensity measure, and (c) spectral displacement (
Estimates of these intensity measures were obtained using accelerations recorded at the ground-motion recording stations closest
The listed damage frequencies were obtained from two sources: reports from thorough surveys commissioned by the Turkish government, and the survey presented in this document, (herein referred to as the ACI-133 survey). In the latter case, damage frequencies in Table 3 and Figure 6 refer exclusively to buildings with critical damage or collapse as defined above. In the former case, the surveyors working for the government used a damage scale and criteria different from those described here. The frequencies reported for their survey refer to buildings classified as having “severe” damage or collapse.
The survey commissioned by the government covered a larger geographical area than the ACI-133 survey did. The data presented here for the government survey refer only to neighborhoods within 5 km from ground-motion recording stations. The ACI-133 survey did not cover entire cities or entire neighborhoods. Areas identified with the same city or district name (e.g. Antakya, Hatay) for both surveys do not always refer to the same geographical area, and, therefore, the reported mean intensity measures differ between the two surveys.
In general, spectral ordinates for T = 0.3 s did not produce better correlations with frequency of damage than spectral ordinates for T = 1 s. Spectral accelerations (Sa) and spectral velocities (Sv) for T = 1 s produced correlations comparable with the correlations seen for spectral displacement (Sd) at 1 s. PGV produced correlations better than those for PGA, and similar to those for Sd at 1 s. Given the mentioned differences in the surveys, a good match between the two sets of data on damage frequency was not expected. What matters more is whether both sets of data produce the best correlations with observed damage for the same intensity measure(s). They did, with PGV and Sd at 1 s producing better correlations for both surveys. PGV has the advantage of being simple. Recall that PGA often requires “corrections” or has to be expressed in terms of an “effective” value produced mostly by judgment. Here, no attempt was made to modify the values of PGA reported by AFAD (2023). PGV was obtained by integrating the published acceleration records. The records were baseline corrected and filtered (to remove frequencies outside 0.025–40 Hz range) by AFAD.
Correlations between damage and robustness measures
Figure 7 shows
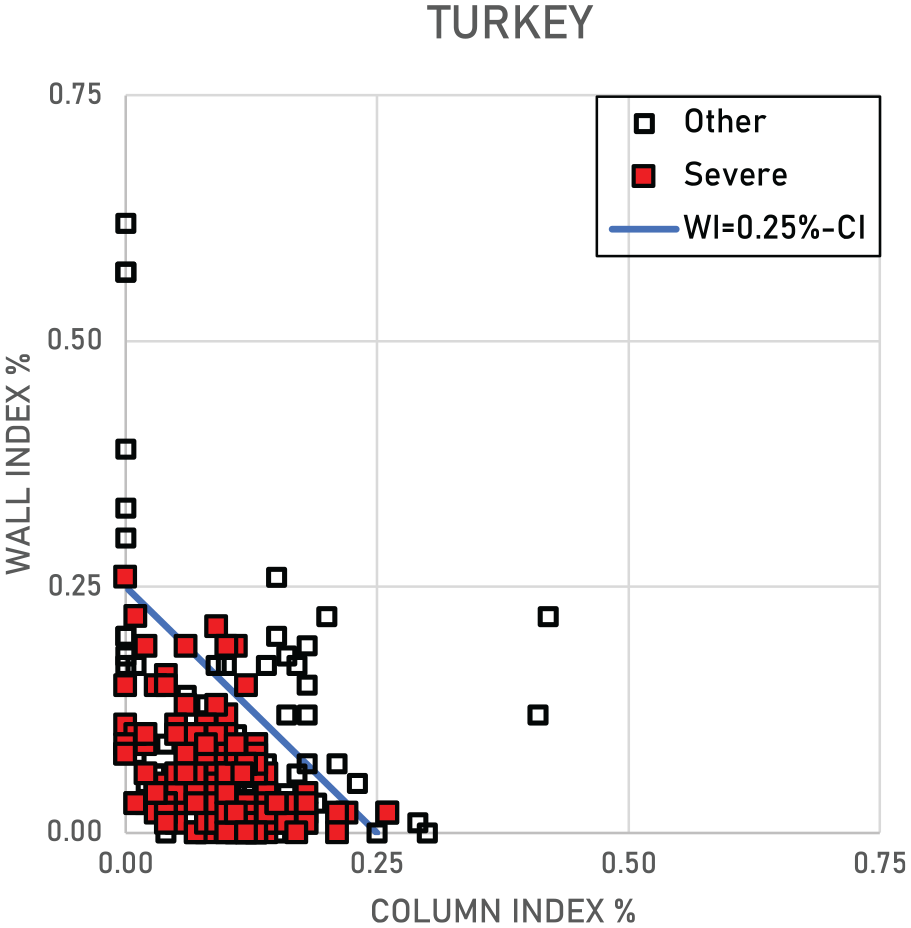
Column index versus wall index for buildings surveyed by ACI-133 in 2023.
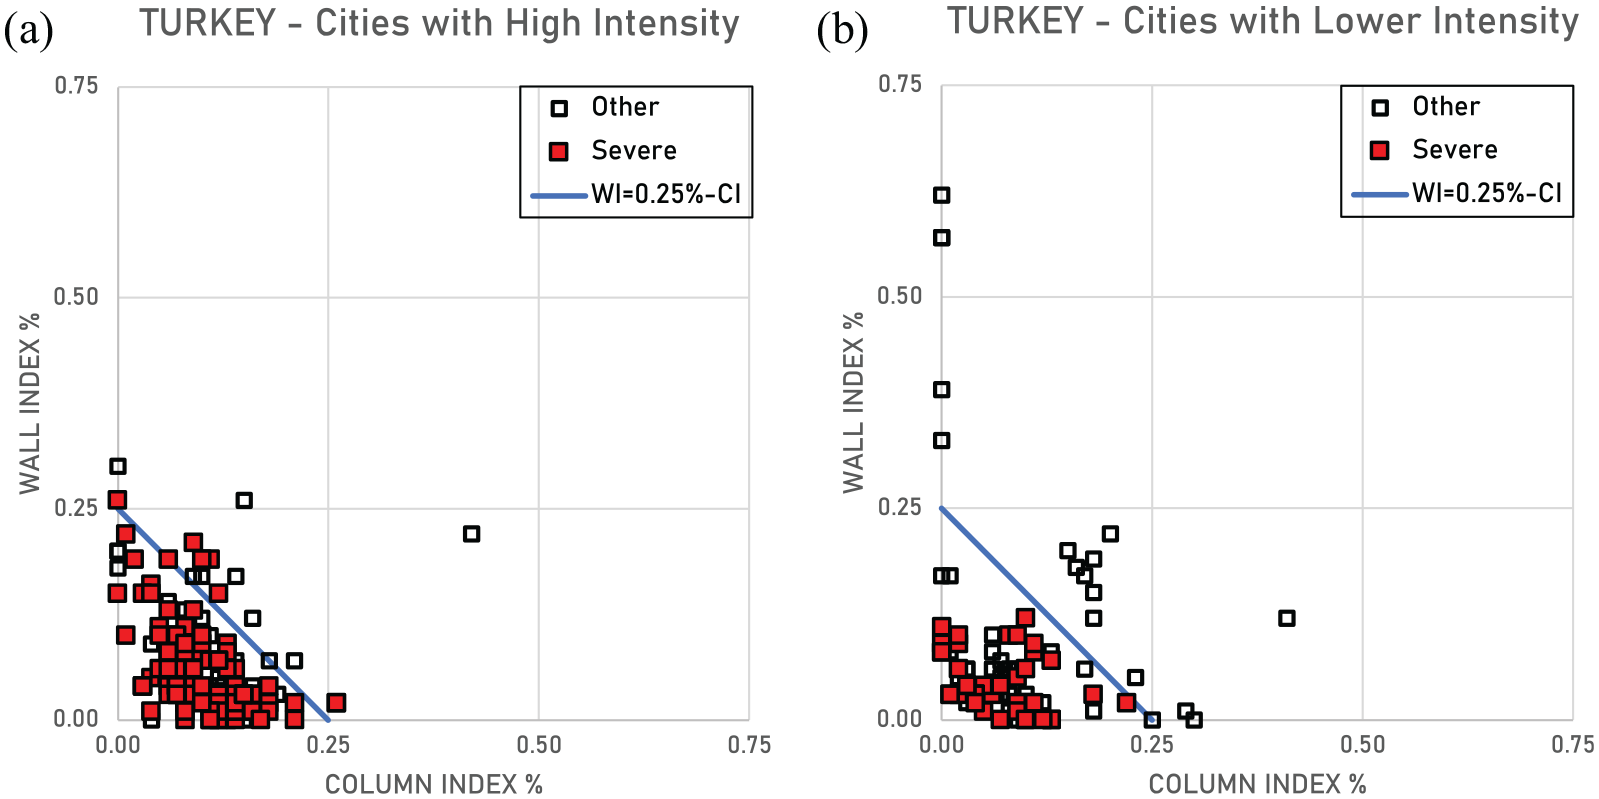
Data separated for cities subjected to (a) high and (b) low ground-motion intensities.
Figure 9 shows damage distribution versus priority index (
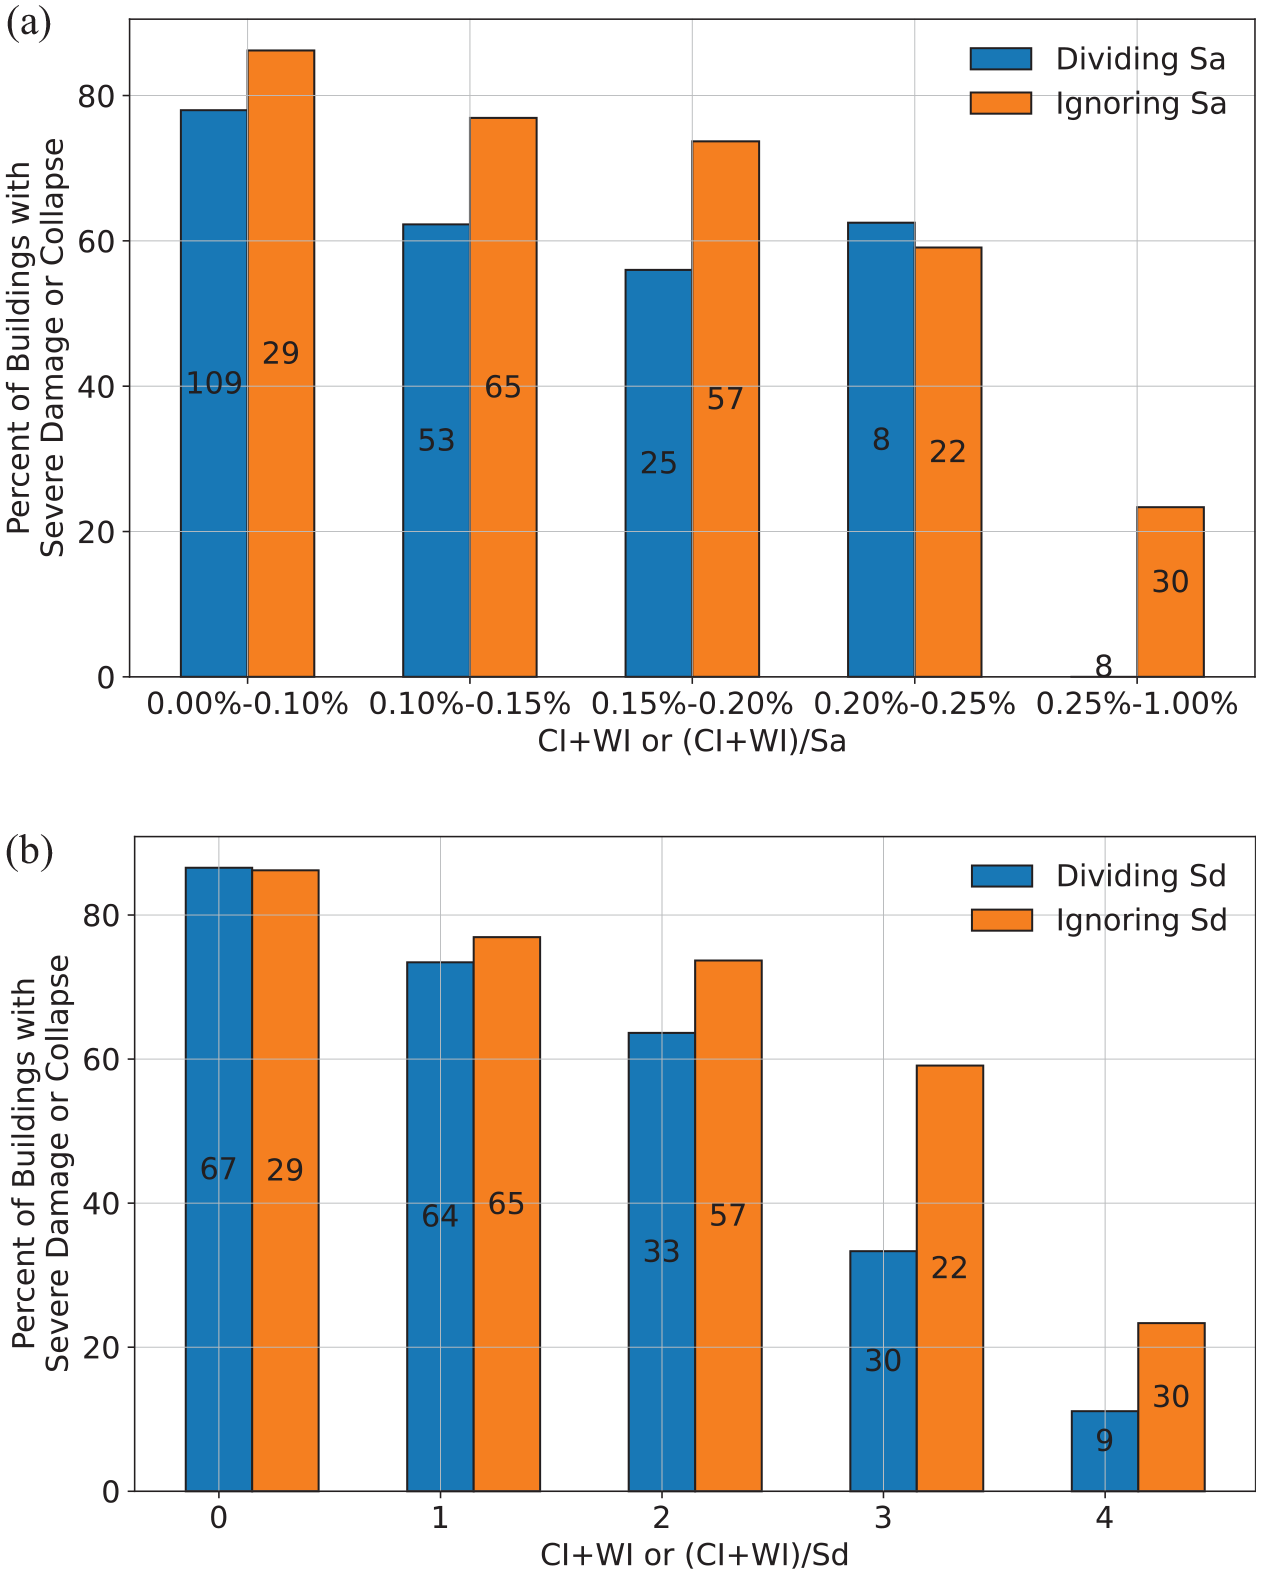
Damage distribution versus PI, PI/Sa, and PI/Sd: (a) damage distribution among surveyed buildings versus PI and PI/Sa, and (b) damage distribution among surveyed buildings versus PI and PI/Sd.
For (
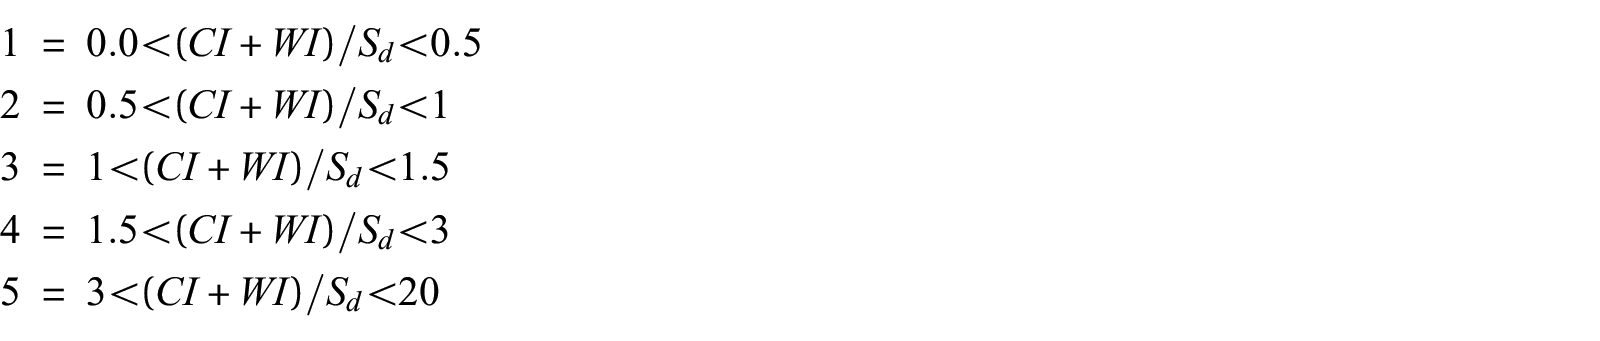
For (
The chart in Figure 9a shows that the correlation between damage frequency (among surveyed buildings) and the sum
Perhaps more interestingly, the points representing buildings with critical damage (as defined above) are quite close to the origin and the x-axis of the
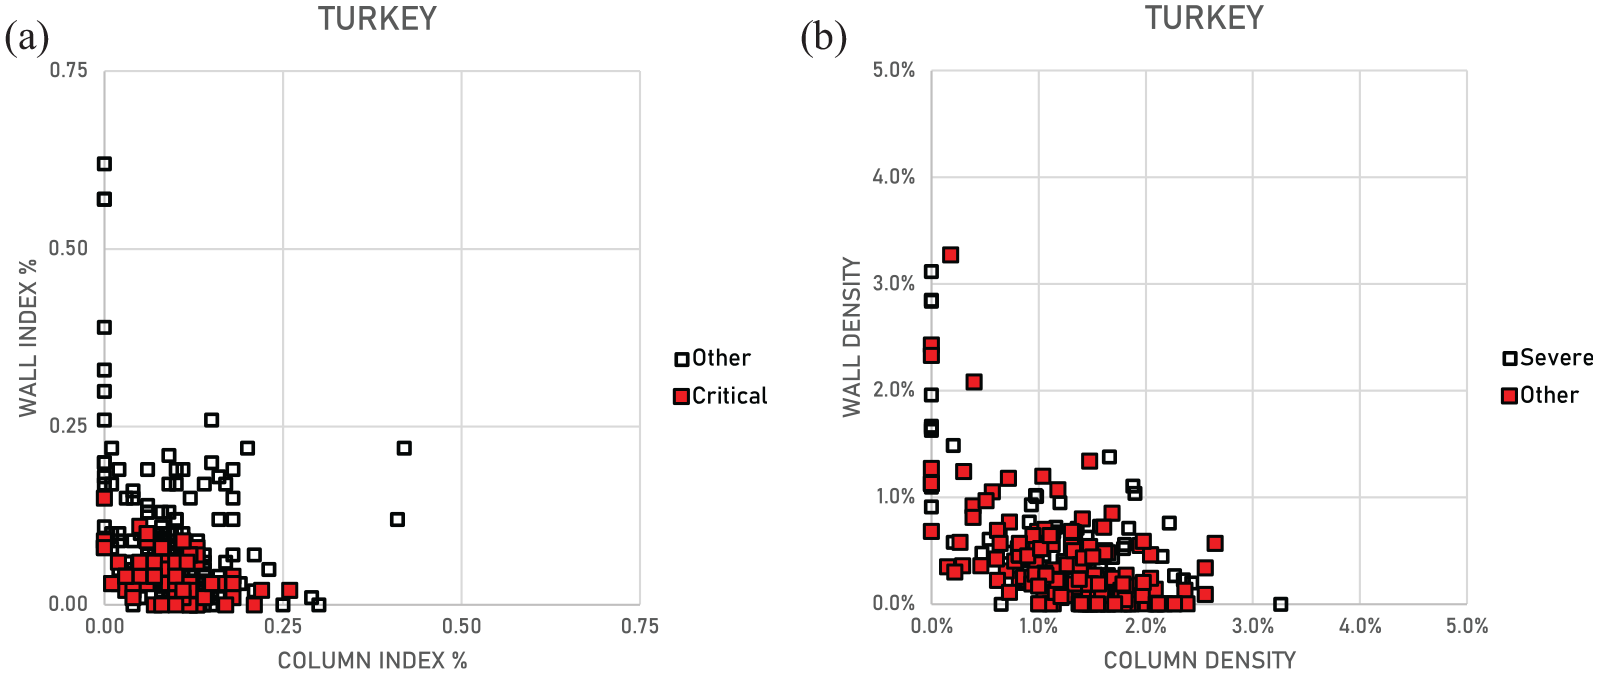
(a) Wall index versus column index for buildings with critical damage and (b) data organized as column density versus wall density.
Even though Hassan and Sozen’s original proposal was to use the CI and WI to prioritize retrofit resources, the observations described here, and the historical comparisons presented in the next section suggest that the indices could be used to craft design criteria to produce more robust structures less prone to damage. The data above suggest that a design threshold referring exclusively to WI would be effective within the ranges of parameters considered. ACI 314R-16 (2016) Guide to Simplified Design for Reinforced Concrete Buildings indirectly recommends
Comparisons with other observations
CI and WI from 1639 buildings surveyed after 15 earthquakes, including the 2023 Turkey Earthquakes, have been collated to look for general trends and to provide a frame of reference to judge what occurred in Turkey in 2023. Table 4 lists the mean values of the
Observations from other earthquakes.
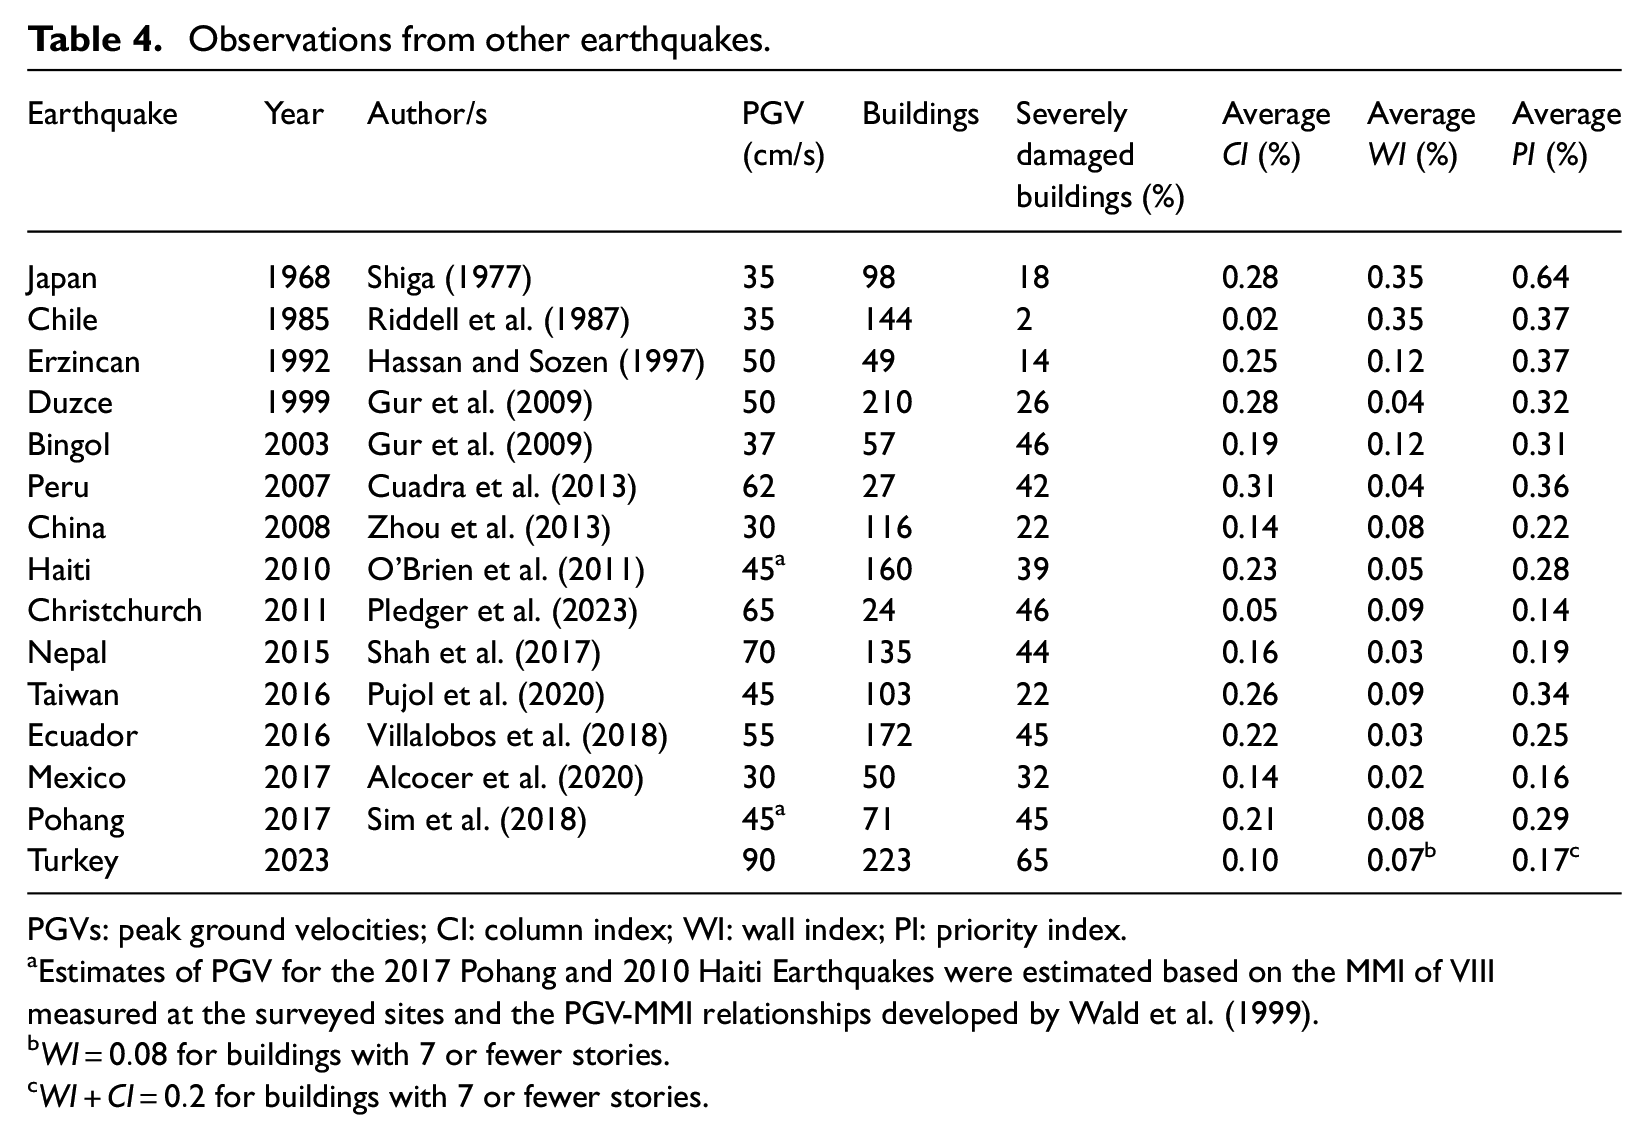
PGVs: peak ground velocities; CI: column index; WI: wall index; PI: priority index.
Estimates of PGV for the 2017 Pohang and 2010 Haiti Earthquakes were estimated based on the MMI of VIII measured at the surveyed sites and the PGV-MMI relationships developed by Wald et al. (1999).
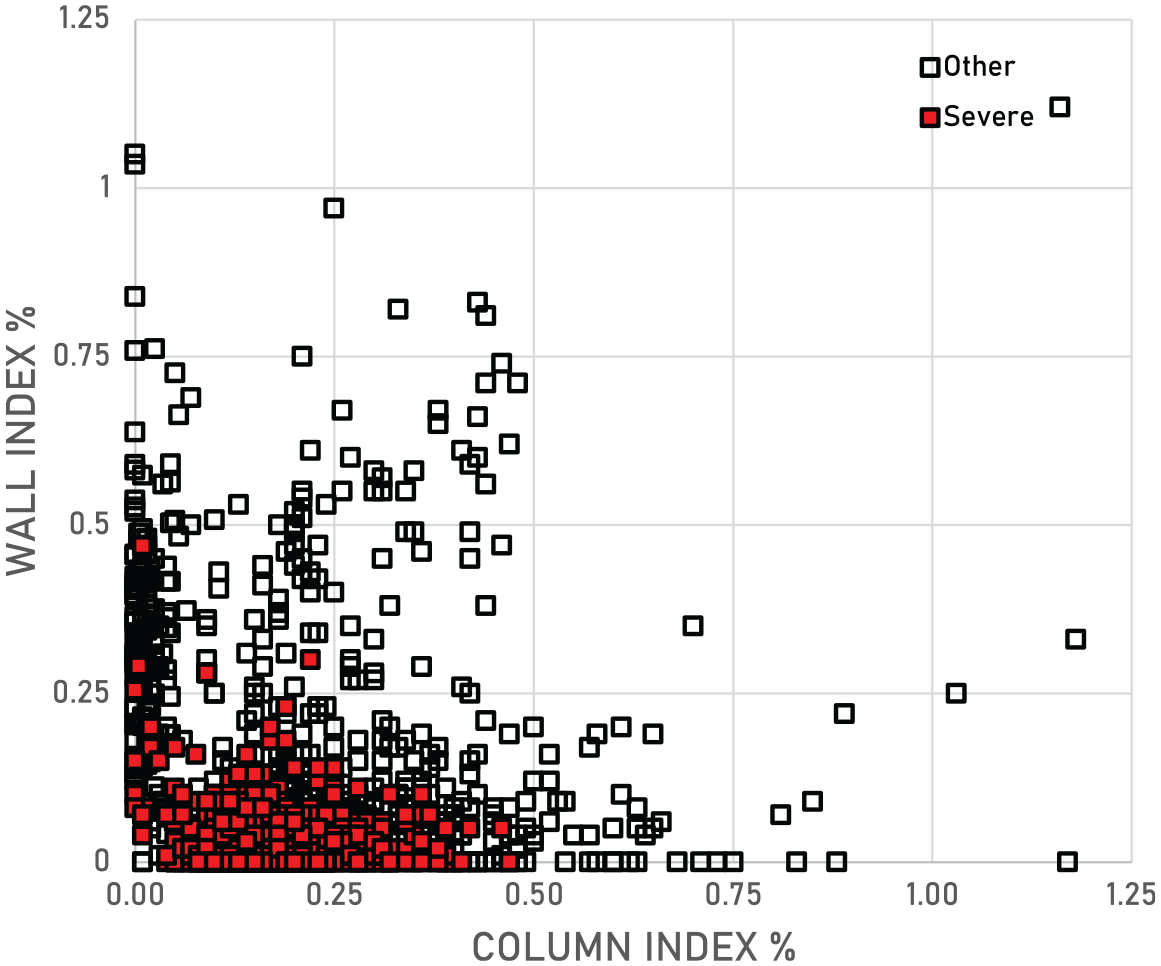
Column index versus wall index for 1639 buildings across 15 earthquakes.
Figure 12a and b illustrates the percentage of surveyed buildings classified as having severe damage versus
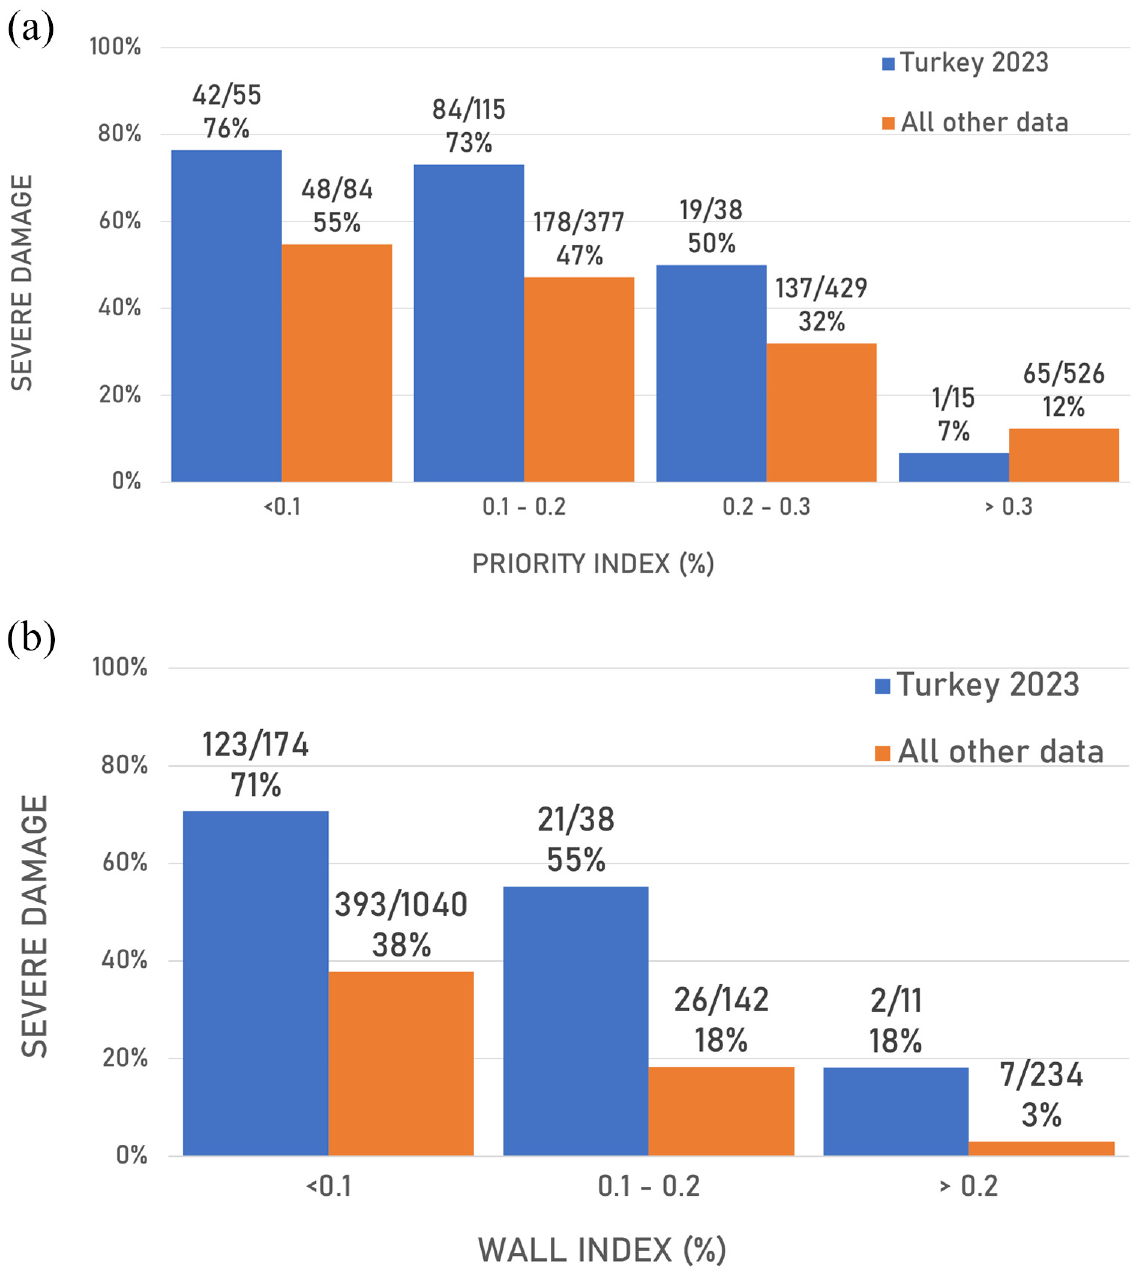
Percentage of surveyed buildings that were severely damaged versus (a) priority index and (b) wall index for the Turkey 2023 Earthquake and the combined data set.
Figure 12a and b make a direct comparison between buildings surveyed in Turkey in 2023 and other buildings surveyed. Both sets of data exhibit a reduction in severely damaged buildings as PI and WI increase. Nevertheless, the percentage of severely damaged buildings was noticeably higher in Turkey in 2023. This is likely due to the larger demands recorded in Turkey, with an average PGV
Figure 13a shows the percentage of surveyed buildings classified as having severe damage after each considered event (Table 4) versus the average
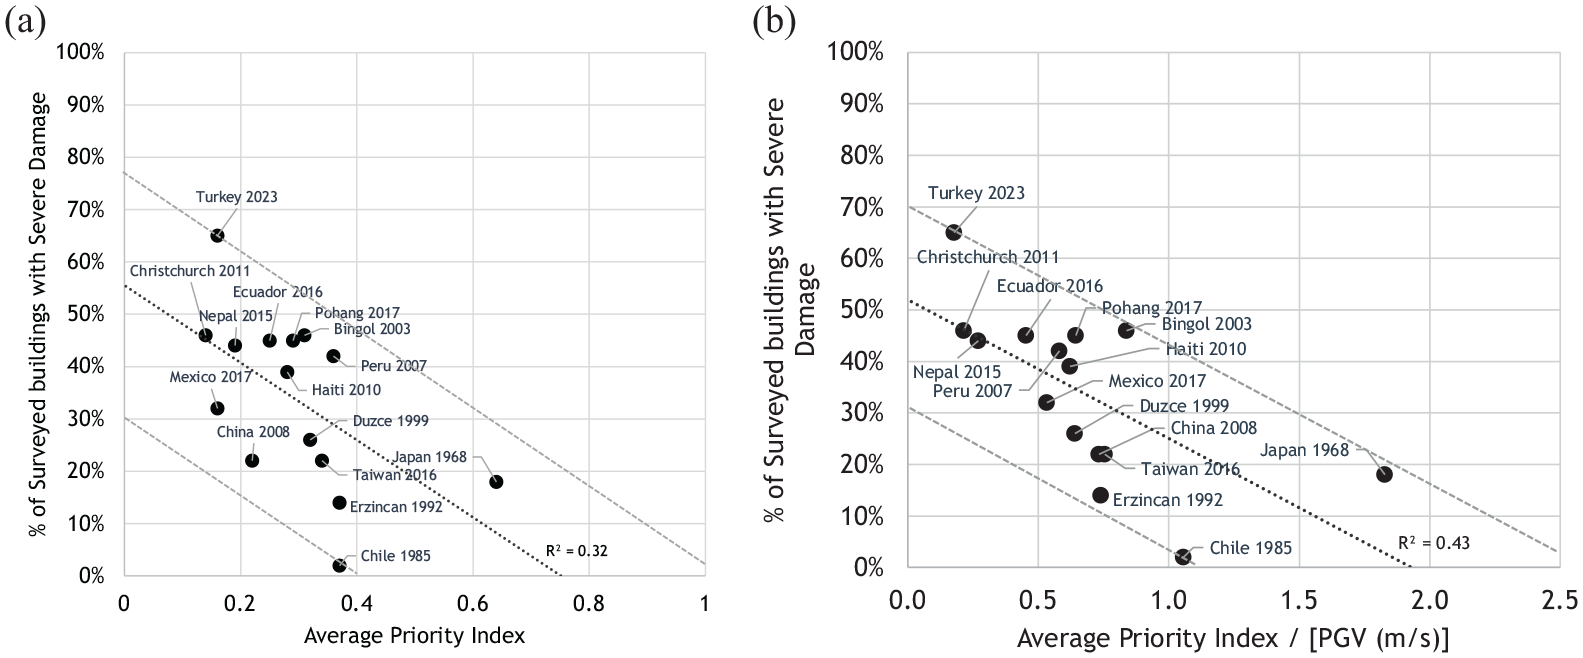
(a) Average priority index (%) and (b) average priority index (%) divided by peak ground velocity versus the percentage of severely damaged buildings for each earthquake event.
Figure 14 compares the values of
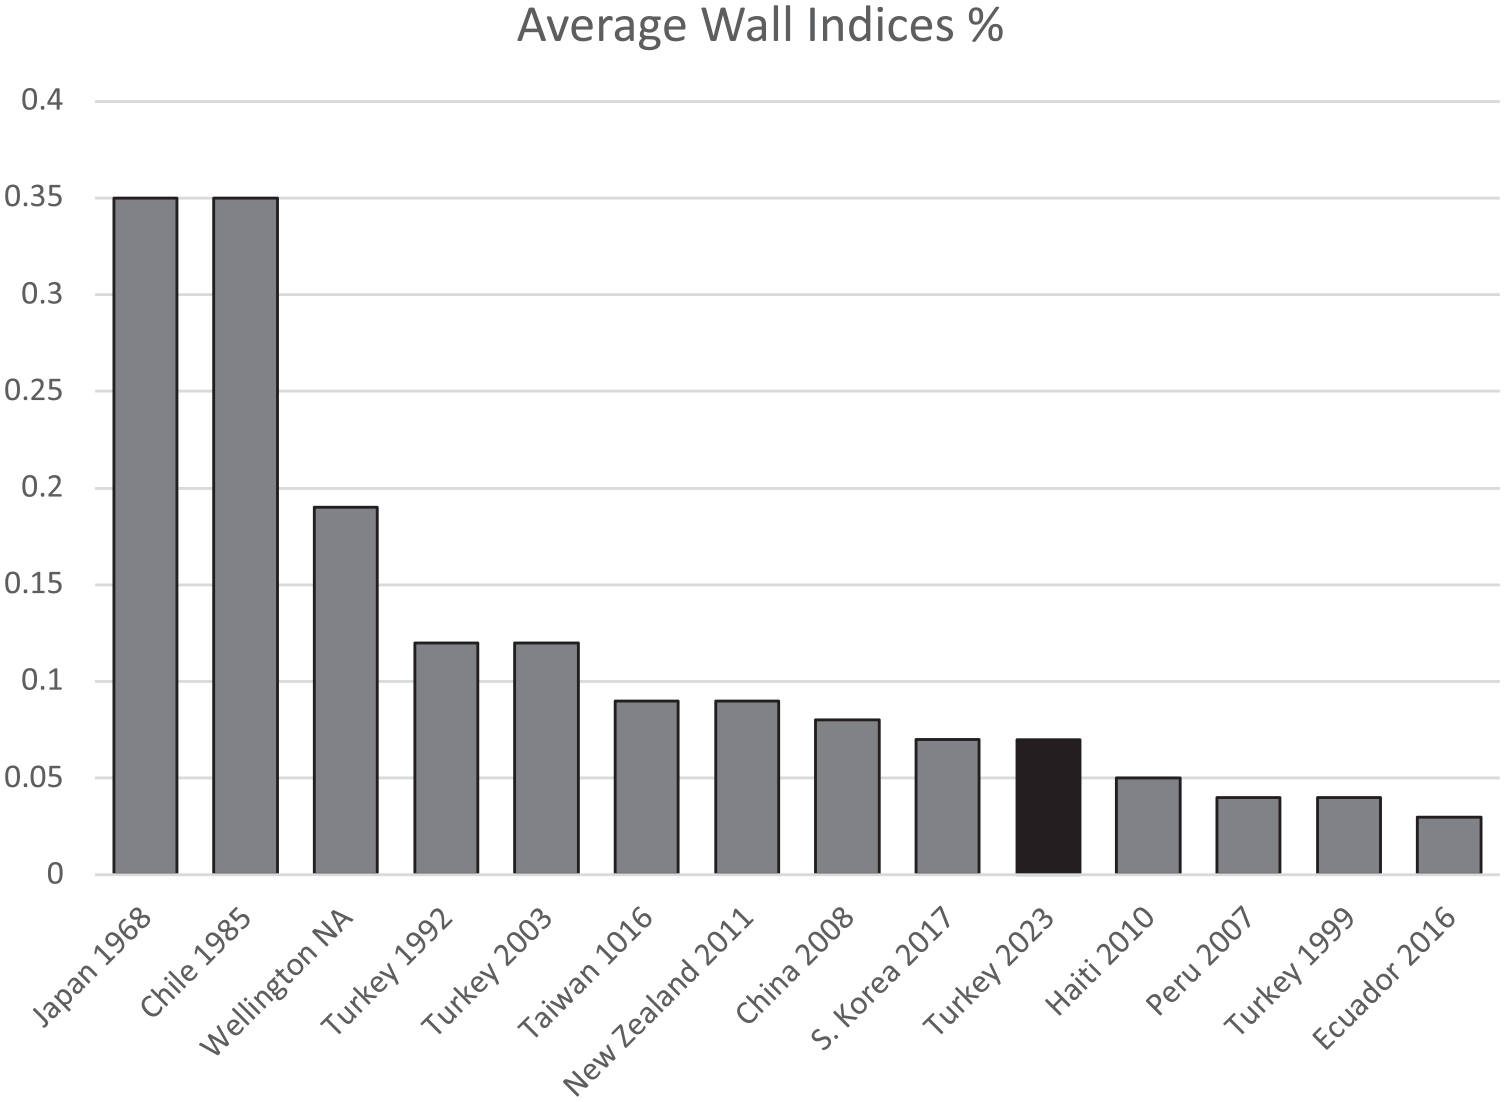
Comparison of average values of wall index from Turkey 2023, and with other events.
Drift control versus detailing
The two 13-story buildings in Figure 15 were in Antakya. They were reported to have been built by the same contractor following the same set of drawings. The detailing observed was one of the best in that (1) crossties were present, (2) tie spacing seemed uniform and acceptable, and (3) splices had enough confinement and cover to develop the strength of and reach fracture in longitudinal bars (Figure 15b). A permanent drift ratio of 6% was measured in the first story of the standing building. For an assumed value of
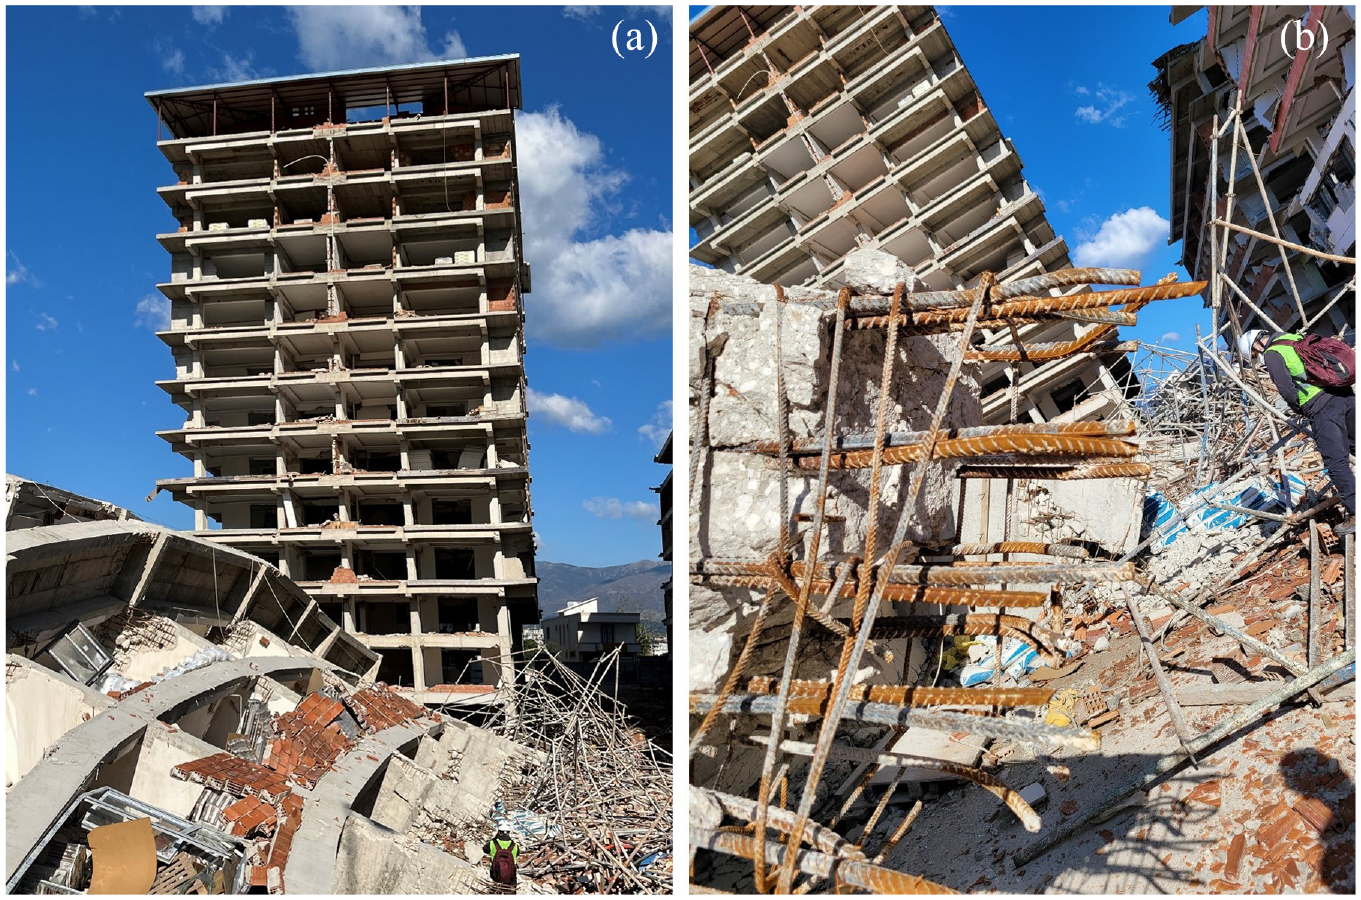
Building complex in Antakya: (a) building complex still standing with an approximate residual drift of 6% in the first story, and (b) identical structure that had collapsed (seen in the foreground of Figure15a)
These drift estimates are large enough to suspect overturning caused by second-order (p-delta) effects. The example illustrates the need to control drift to avoid collapse even if detailing is sufficient to produce a ductile response. The standing structure in Figure 15 had
This example and the previous section suggest strongly that to control damage, in Turkey and elsewhere, it is necessary to decrease drift demand through design limits leading to more robust structures. Detailing is necessary (to ensure stable hysteretic response) but not sufficient (to control damage).
Conclusion
The evidence collected supports the following conclusions:
Drift control must be the primary design objective in seismic regions, while maintaining ductility as a safeguard in the face of ground-motion uncertainty. Structures designed for earthquake resistance should possess both the necessary stiffness to limit drift and ensure functionality, as well as adequate drift capacity to prevent collapse during unforeseen events.
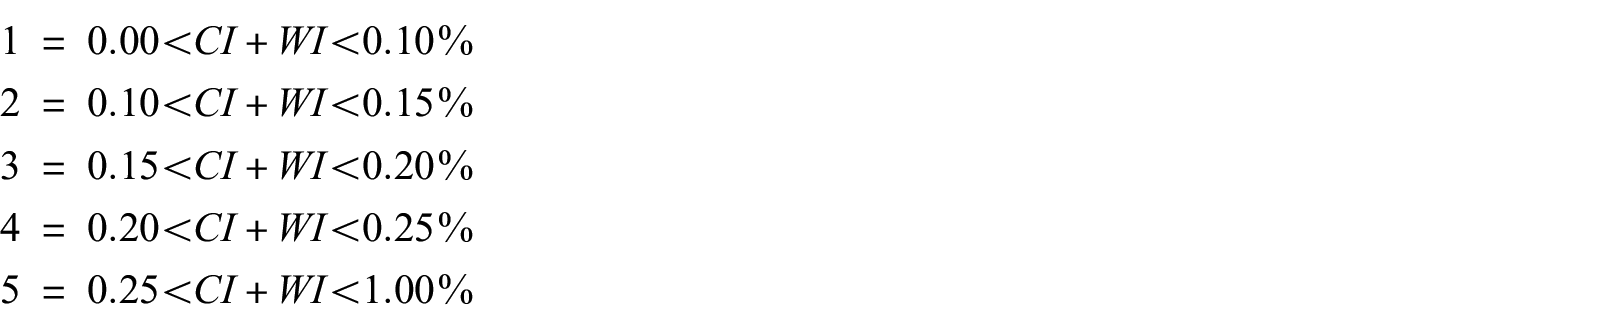
WI and CI (ratios of cross-sectional areas to total floor areas,
Approximately 96% of structures with critical damage (i.e. structures in a precarious state and judged to have been compromised to survive an aftershock) had WI < 0.1%.
Engineers and contractors in Turkey and other regions facing similar seismic risk should be compelled to produce buildings with
Hassan and Sozen’s initial proposal favored using the
Dividing
Regardless of building height, wall and column densities (ratios of sums of wall cross-sectional areas and column areas to typical floor plan) did not help organize the data from severely damaged buildings better than WI and CI (ratios of cross-sectional areas to total floor plan area).
PGV and Sd correlated better than other intensity measures with the percentage of damaged buildings.
Frame structures with shallow beams were observed to have been more vulnerable than comparable structures with regular beams (deeper than the supported floors).
Structural-wall buildings with walls uniformly distributed in both principal floor plan directions performed well.
There were numerous detailing problems revealed by the excessive drift that was induced by high intensities (associated with values of PGV of 100 cm=s or more) including:
lack of ties in plastic hinges;
lack of ties in beam-column joints;
lack of ties in column-grade-beam joints;
discontinuous bars in beams;
lack of stirrups in beams;
lack of crossties and hoops in walls; and
short and not-well-confined lap splices near critical sections of structural walls and columns.
To allow large drift and depend nearly exclusively on detailing (ductility) to control damage did not pay off. Had the detailing worked, the drift would have still been too large. There were observations of permanent drift ratios as high as 6%.
New, less brittle, or isolated partitions restrained out-of-plane are needed for buildings close to active faults.
Given the intensity of the ground motion, the damage observed in Turkey in 2023 is:
consistent with damage observed in Turkey before,
consistent with damage observed elsewhere, and
at least in part, the result of international design practices allowing the construction of buildings without the robustness necessary to control drift effectively.
Supplemental Material
sj-pdf-1-eqs-10.1177_87552930231211208 – Supplemental material for Quantitative evaluation of the damage to RC buildings caused by the 2023 southeast Turkey earthquake sequence
Supplemental material, sj-pdf-1-eqs-10.1177_87552930231211208 for Quantitative evaluation of the damage to RC buildings caused by the 2023 southeast Turkey earthquake sequence by Santiago Pujol, Idris Bedirhanoglu, Cemalettin Donmez, Jeffrey D Dowgala, Meltem Eryilmaz-Yildirim, Kari Klaboe, Fahri Baran Koroglu, Rémy D Lequesne, Baki Ozturk, Liam Pledger and Egemen Sonmez in Earthquake Spectra
Footnotes
Declaration of conflicting interests
The author(s) declared no potential conflicts of interest with respect to the research, authorship, and/or publication of this article.
Funding
The author(s) disclosed receipt of the following financial support for the research, authorship, and/or publication of this article: This research was funded by ACI, with additional support from American Society of Civil Engineers, and the US National Institute for Standards and Technology. The help of all other participating institutions and individuals is also gratefully acknowledged (M. Fırat Aydın, Bashar Abdo, Rebecca H. Collins, Fatih Canakci, Gurhan Comlekoglu, Mert Demir, Korhan Dalgic, Oscar Forero, Atakan Gokturk, Uveys Gozun, M. Fethi Gullu, Polat Gulkan, Ekin Gultepe, Amin Hariri, Ayhan Irfanoglu, Lissette Iturburu, Mehmet Enes Kaya, Mursel Kayıkcı, Edagul Kirpik, Kerim Kurt, Marko Marinkovic, Bora Ozkan, Mario Rodriguez, Julian Rincon, Cem Ali Sagır, Matthew Speicher, Bahaa Tayba, Koray Tureyen, Cennet Yesilyurt, and Reid Zimmerman for their help in data collection, Kahramanmaraş Dulkadiroğlu, and Türkoğlu Municipalities Urban Planning Departments, İbrahim Köroğlu from Kahramanmaraşİstiklal University Department of Construction for providing access to the structural drawings of some buildings investigated, and İzmir Institute of Technology for the administrative support in getting the necessary permits to access the earthquake-affected cities.
Supplemental material
Supplemental material for this article is available online.
References
Supplementary Material
Please find the following supplemental material available below.
For Open Access articles published under a Creative Commons License, all supplemental material carries the same license as the article it is associated with.
For non-Open Access articles published, all supplemental material carries a non-exclusive license, and permission requests for re-use of supplemental material or any part of supplemental material shall be sent directly to the copyright owner as specified in the copyright notice associated with the article.