
Abstract
Two significant earthquakes struck eastern Taiwan on consecutive days in mid-September of 2022. The first, the Guanshan earthquake, occurred on the night of September 17 (local time) with a local magnitude (ML) of 6.4, and the second, the Chihshang earthquake, occurred on the afternoon of September 18 with a mainshock of ML of 6.8. The strong motion of these two events resulted in a series of ground surface ruptures, 2 collapsed buildings, two collapsed bridges, and more than 100 partially damaged structures along the Chihshang and Yuli faults around the Longitudinal Valley in eastern Taiwan. The observed response spectra at the damage sites of the Chihshang earthquake were significantly larger than the design response spectra of the 1997 Taiwan building code. Near-fault velocity pulses with a maximum value of 132 cm/s were observed along the faults, destructively impacting the damaged structures. The details and causes of the structural damage are presented in this article according to the findings of the on-site reconnaissance and ground motion analysis. Finally, the behavior of selected structures that have a structural health monitoring system at the time of these two destructive earthquakes is also evaluated.
Keywords
Introduction
An earthquake sequence occurred in eastern Taiwan in mid-September of 2022, as shown in Figure 1. The first significant earthquake occurred at 21:41 local time (GMT+8) on September 17, 2022, and is known as the Guanshan earthquake. The Central Weather Administration (CWA), Taiwan has announced that its epicenter was located at 23.08° N, 121.16° E with a focal depth of 7.3 km. The magnitude was reported as ML 6.4 by the CWA and as Mw 6.5 by the United States Geological Survey (USGS). One day later on September 18, 2022, the largest earthquake of this sequence (magnitude of ML 6.8 as reported by the CWA and as Mw 6.9 by the USGS) occurred at 14:44 local time. The epicenter was at 23.14° N, 121.2° E in the Chihshang Township, and the focal depth was 7 km. The ML 6.8 mainshock is referred to as the Chihshang earthquake. The strong ground motion of the Chihshang earthquake sequence in combination with shallow sources induced a series of ground ruptures and caused one fatality, 171 injuries, 2 collapsed buildings and two collapsed bridges, and partially damaged hundreds of buildings and bridges across or along the faults around the near-source region of the Longitudinal Valley in eastern Taiwan (Figure 2). The seismic sources of the two earthquakes were both located on the west side of the southern part of the Longitudinal Valley in eastern Taiwan. Historically, there have been several disastrous earthquakes in the region, including the events of April 1, 2006 (ML 6.2) and November 25, 1951 (ML 7.3).
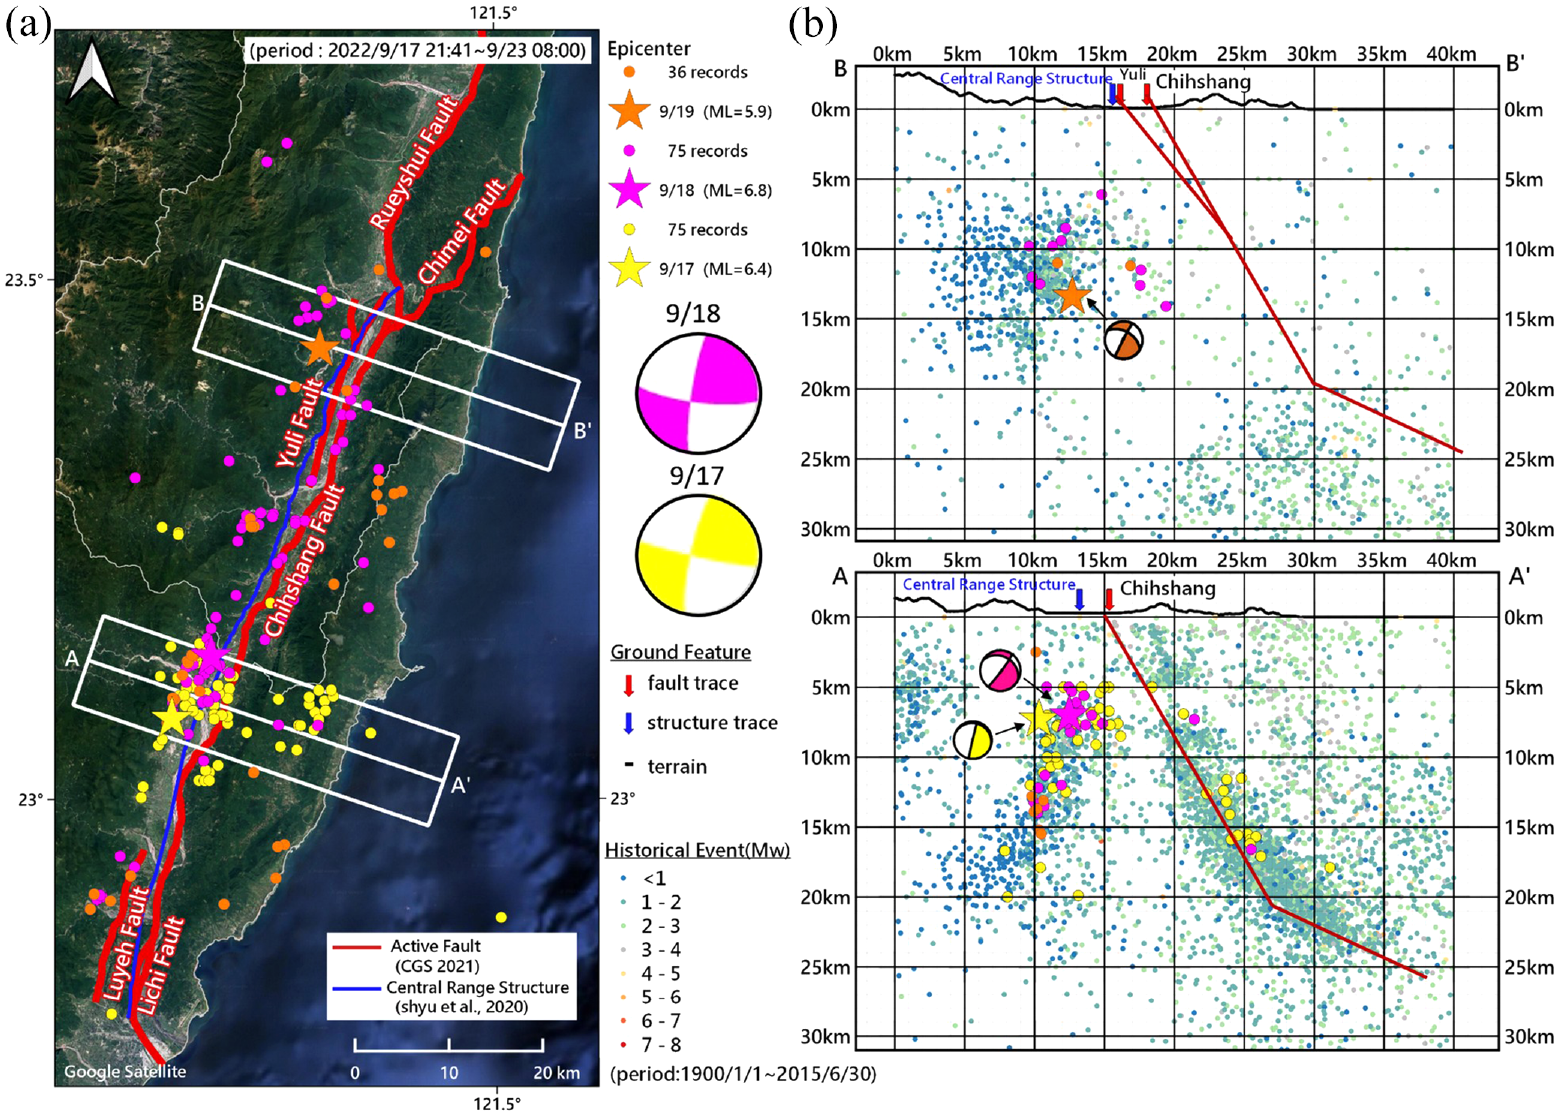
(a) Spatial and temporal distribution of the epicenter of the Chihshang earthquake sequence from September 17, 2022 to September 23, 2022. Blue and red lines indicate the Central Range structure and Longitudinal Valley fault, respectively. (b) Two vertical cross-sections of the earthquake sequence marked by solid color circles. The background seismicity from 1900 to 2015 is shown by colored dots for comparison.
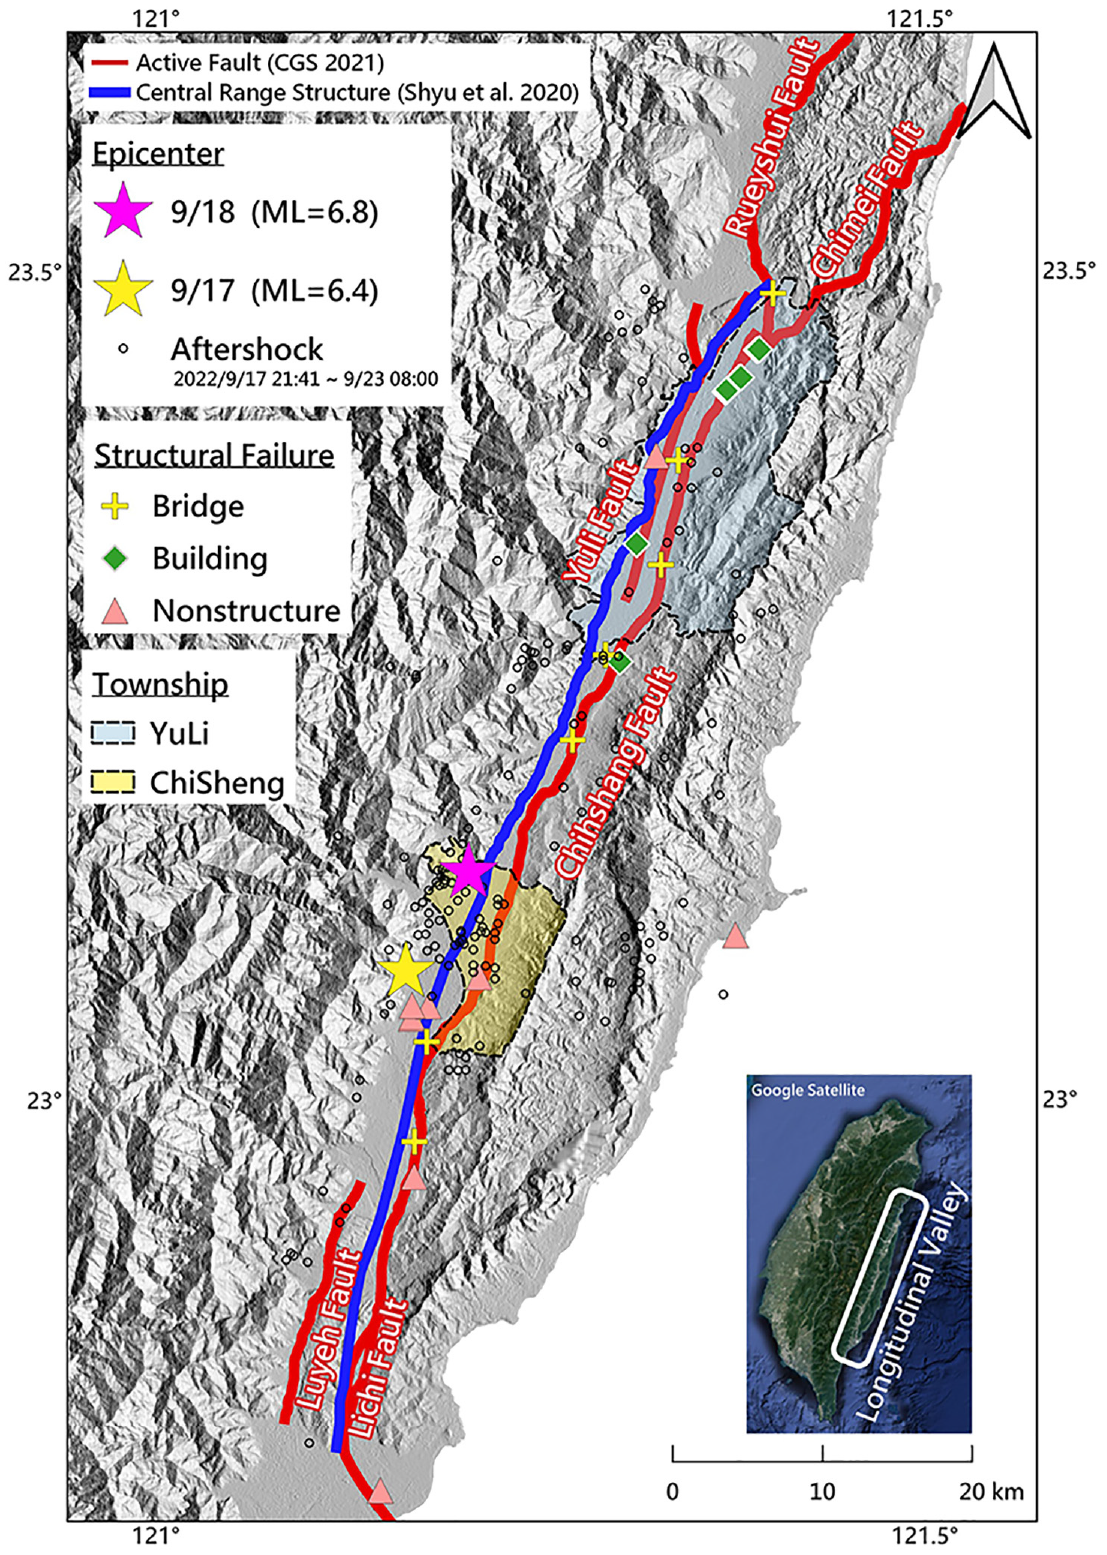
Map of the severe damage locations of these two earthquakes.
A large number of small shocks occurred between and after the two major events. Figure 1 shows the spatial and temporal distribution of the Chihshang earthquake sequence from September 17, 2022 to September 23, 2022. The largest aftershock (ML of 5.9) occurred on September 19 near the Yuli Township, located north of the Chihshang Township (Figure 1). The aftershocks seem to exhibit an apparent migration toward the northeast direction along the Longitudinal Valley fault system. The Longitudinal Valley in eastern Taiwan is a suture zone between the Eurasian Plate and the Philippine Sea Plate. The Longitudinal Valley Fault system is dominated by eastward-dipping strike-slip or thrust structures, including several active faults, such as the Chihshang fault, Yuli fault, Luyeh fault, Lichi fault, and Rueyshui fault (Lin et al., 2021). The Central Range structure, a westward-dipping fault on the west side of the Longitudinal Valley, has also been identified by surface geology and seismicity (Biq, 1965; Shyu et al., 2006, 2020).
Two vertical cross-sections of the earthquake sequences and the background seismicity from 1900 to 2015 of the regions indicated by the white box (approximately 10 km in width) are illustrated in Figure 1. The focal mechanisms of the two major earthquakes in the sequence were both resolved with slight differences according to the results of the CWA, USGS, and the Institute of Earth Sciences, Academia Sinica (IESAS) as being primarily strike-slip fault types (AutoBATS CMT, Jian et al., 2018). Specifically, the Guanshan earthquake was close to a pure strike-slip fault but the Chihshang earthquake showed strike-slip fault characteristics accompanied by a reverse component. Note that some aftershocks happened on an eastward-dipping fault plane in the east, suggesting that the Chihshang earthquake sequence may have triggered the Chihshang fault and the Yuli fault. Consequently, the damage sites and surface ruptures lie mostly along the two active faults (Figure 2).
After the earthquake events, the National Center for Research on Earthquake Engineering (NCREE) immediately analyzed the ground motion data, evaluated the potential losses, and organized reconnaissance teams. On the morning of September 19, three teams headed for eastern Taiwan to survey the damage to buildings, bridges, nonstructural systems, and geotechnical infrastructure, which mostly occurred along the Chihshang and Yuli faults (as identified by the representative symbols in Figure 2). This article reports the reconnaissance findings that were focused on the ground motion characteristics, the structural building and bridge damage, and geotechnical damage in detail. The performance of the building with structural monitoring system that had been installed on structures all over Taiwan and was operated by the NCREE during these two earthquakes is also discussed. Preliminary information on the earthquakes and resulting damage obtained from virtual sources is summarized elsewhere (Chou et al., 2022; EERI, 2022).
Strong-motion ShakeMap and characteristics
Strong-motion data
There are multiple types of seismic networks installed throughout Taiwan to monitor the ground motion around the island. The free-field acceleration records of four real-time strong-motion networks were collected to analyze the distributions and characteristics of the ground motions induced by the earthquake sequence. Two of the networks, the Central Weather Administration Seismographic Network (CWASN) and the Taiwan Strong Motion Instrumental Program (TSMIP), are both operated by the CWA (2012; Liu et al., 1999). They have been gradually developed and upgraded to currently have more than 600 real-time strong-motion stations. The acceleration records of the CWASN and TSMIP were both downloaded from the data service platform of the Taiwan Seismological and Geophysical Data Management System (https://gdmsn.cwa.gov.tw), which was established through a collaboration between the CWA and the IESAS. The other two networks are the Seismic Array of the NCREE in Taiwan (SANTA; http://santa.ncree.org) and the NCREE Earthquake Early Warning System (NCREE EEWS). The SANTA is a multipurpose seismograph network with 37 seismograph stations to support research on both seismology and earthquake engineering. Most of the SANTA stations consist of a strong-motion accelerometer and a broadband seismometer installed at the same site. There are strong-motion stations of the NCREE EEWS installed in approximately 100 schools that provide an on-site earthquake early warning service.
The free-field acceleration records of 588 and 586 strong-motion stations were collected and analyzed for the Guanshan and Chihshang earthquakes, respectively. Figure 3 shows the station locations of the four networks indicated by colored triangles. The dashed box in Figure 3a outlines the near-epicentral area in which the stations lie mostly along the Longitudinal Valley and the east coastline of Taiwan (Figure 3b). However, the records of certain stations near the epicenter of the Chihshang earthquake, including HWA041, HWA042, HWA053, and TTN032, are omitted because they experienced Internet malfunctioning during the earthquake shaking.
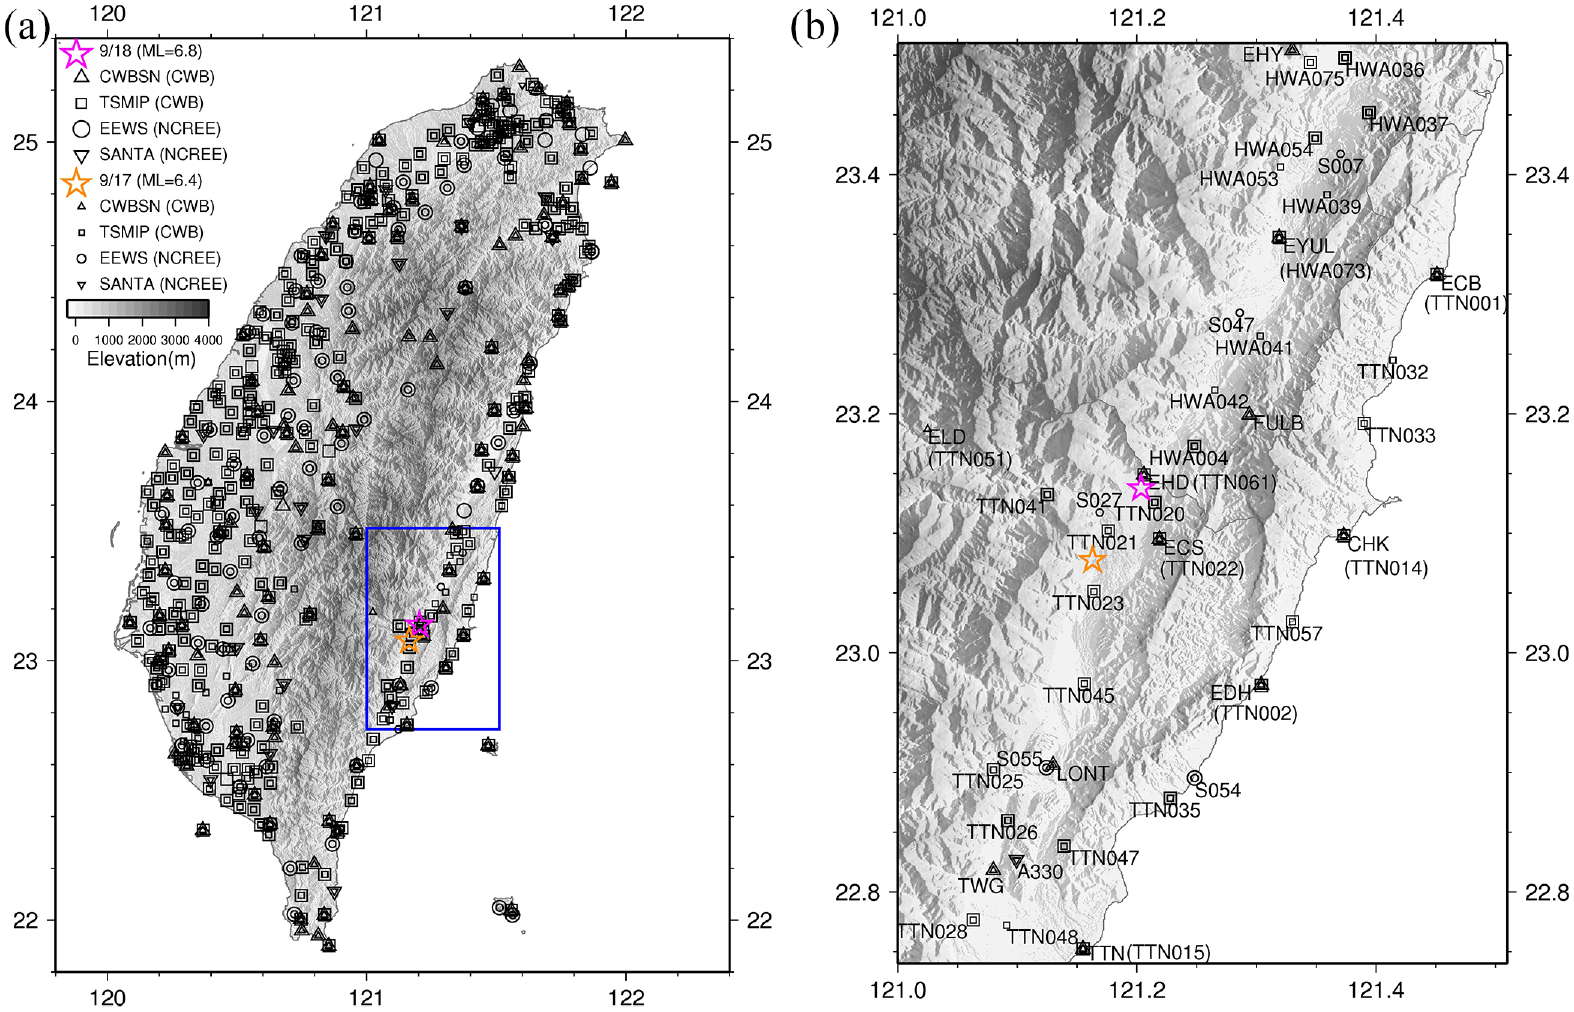
(a) Locations of all strong-motion stations of the four networks. (b) Locations of the stations near the epicenters.
ShakeMaps
ShakeMap presents the spatial distributions of the observed and estimated ground motion intensities of an earthquake. It provides essential and important information for emergency response execution to a disastrous earthquake event. A methodology (Chao et al., 2021) for developing ShakeMaps for these two earthquakes with high resolution and high accuracy from the real-time strong-motion data obtained from the four networks was developed based on a ground motion prediction equation (GMPE) for Taiwan (Chao et al., 2020), a spatial correlation model, and a map (500 × 500 m) of the average shear wave velocity of 30-m depth (Vs30). The estimated intensity measurement

where

where

where

where
For the case that the jth site is identical to a certain strong-motion instrument, the value of
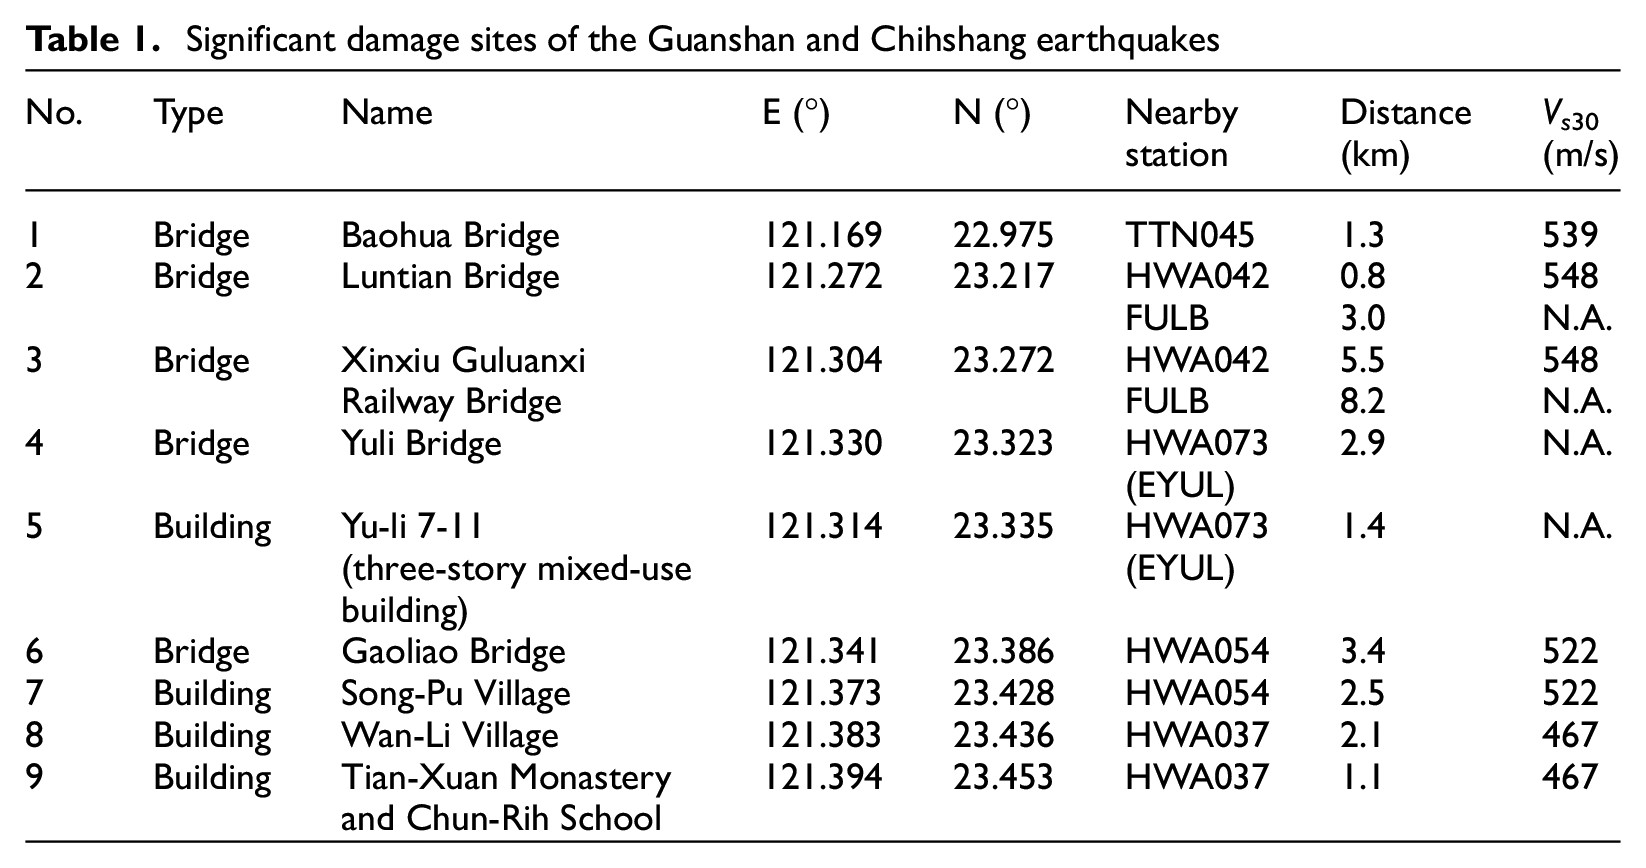
The methodology has been evaluated against several historical earthquakes and proven to derive ground motion intensities accurately. These estimated ground motion ShakeMaps are made quickly and accessible via the NCREE website (https://seaport.ncree.org/smap/) after an earthquake occurs in Taiwan. They include data on the PGA, PGV, and SA with periods from 0.01 to 5.00 s of the horizontal (RotD50), vertical, East-West (E-W), and North-South (N-S) components. Figures 4 and 5 show ShakeMaps of the Guanshan and Chihshang earthquakes featuring PGA and horizontal SAs with periods of 0.3 and 1.0 s. The gray solid circles with numbers indicate the nine sites that sustained severe structural damage, as listed in Table 1 with an order from south to north. The damaged buildings and bridges will be discussed in the following sections. The PGV maps of the Guanshan and Chihshang events are, respectively, shown in Figures 6a and 7a. The consistency of the ground motion spatial distributions between PGA and SA0.3 can be observed, as can the high PGV and SA1.0 concentrations along the fault traces. However, the ground motion intensities of the Guanshan earthquake were relatively high to the south of the epicenter, whereas those of the Chihshang earthquake were relatively high to the north of the epicenter. The ShakeMaps of the Guanshan earthquake show that its high PGA and PGV values in the south are related to the damage to the Baohua Bridge. The maximum observed PGA is 0.458 g in the E-W component at FULB station with an epicentral distance of 19 km, and the maximum observed PGV is 127 cm/s in the E-W component at TTN045 station with an epicentral distance of 11.8 km. The most severe damage, including collapsed buildings and bridges, occurred within an area with strong ground motion to the north of the epicenter of the Chihshang earthquake. The maximum observed PGA is 0.665 g in the N-S component at HWA037 station with an epicentral distance of 40 km, and the maximum observed PGV is 131 cm/s in the E-W component at HWA054 station with an epicentral distance of 35.7 km. The 2 collapsed buildings (No. 5 and No. 9 in Table 1 and Figures 4 to 7) were both located in areas with high PGA and PGV induced by the Chihshang earthquake. Moreover, most of the damaged sites are located in a region with high PGV and SA1.0 along the Chihshang and Yuli faults. Because the soil site conditions of the damaged sites are all unknown, the Vs30 of nearby TSMIP stations is listed in Table 1 as the reference (Kuo et al., 2012). Most of the TSMIP stations in eastern Taiwan belong to site class C according to the site classification scheme of National Earthquake Hazards Reduction Program (BSSC, 2001). The site amplification effects are not obvious because of the similar site conditions.
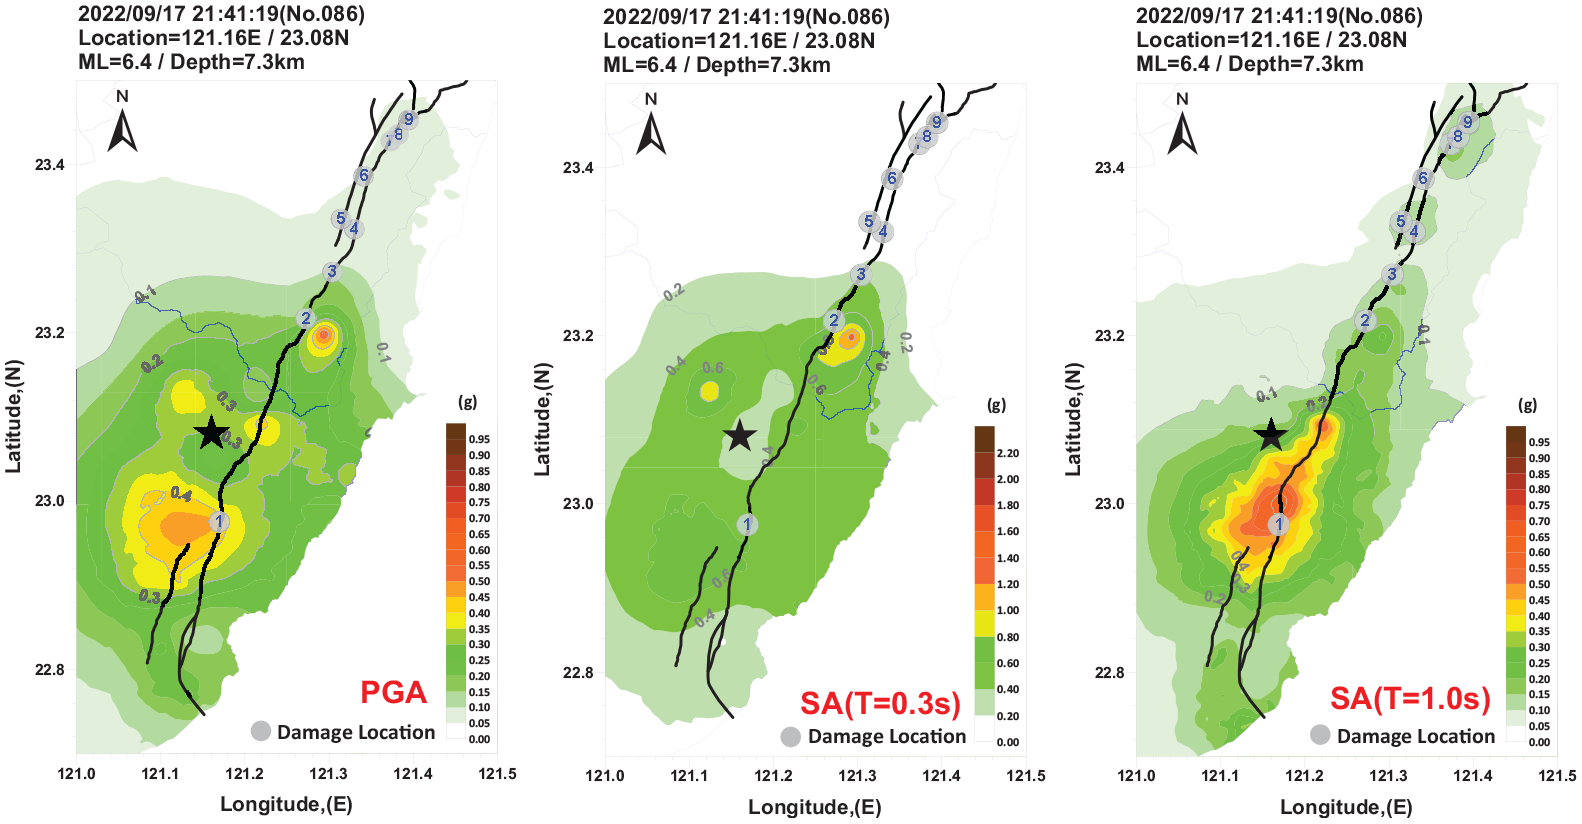
ShakeMaps of the Guanshan earthquake, including PGA and SAs with periods of 0.3 and 1.0 s. The gray dots with numbers are the locations of severe damage.
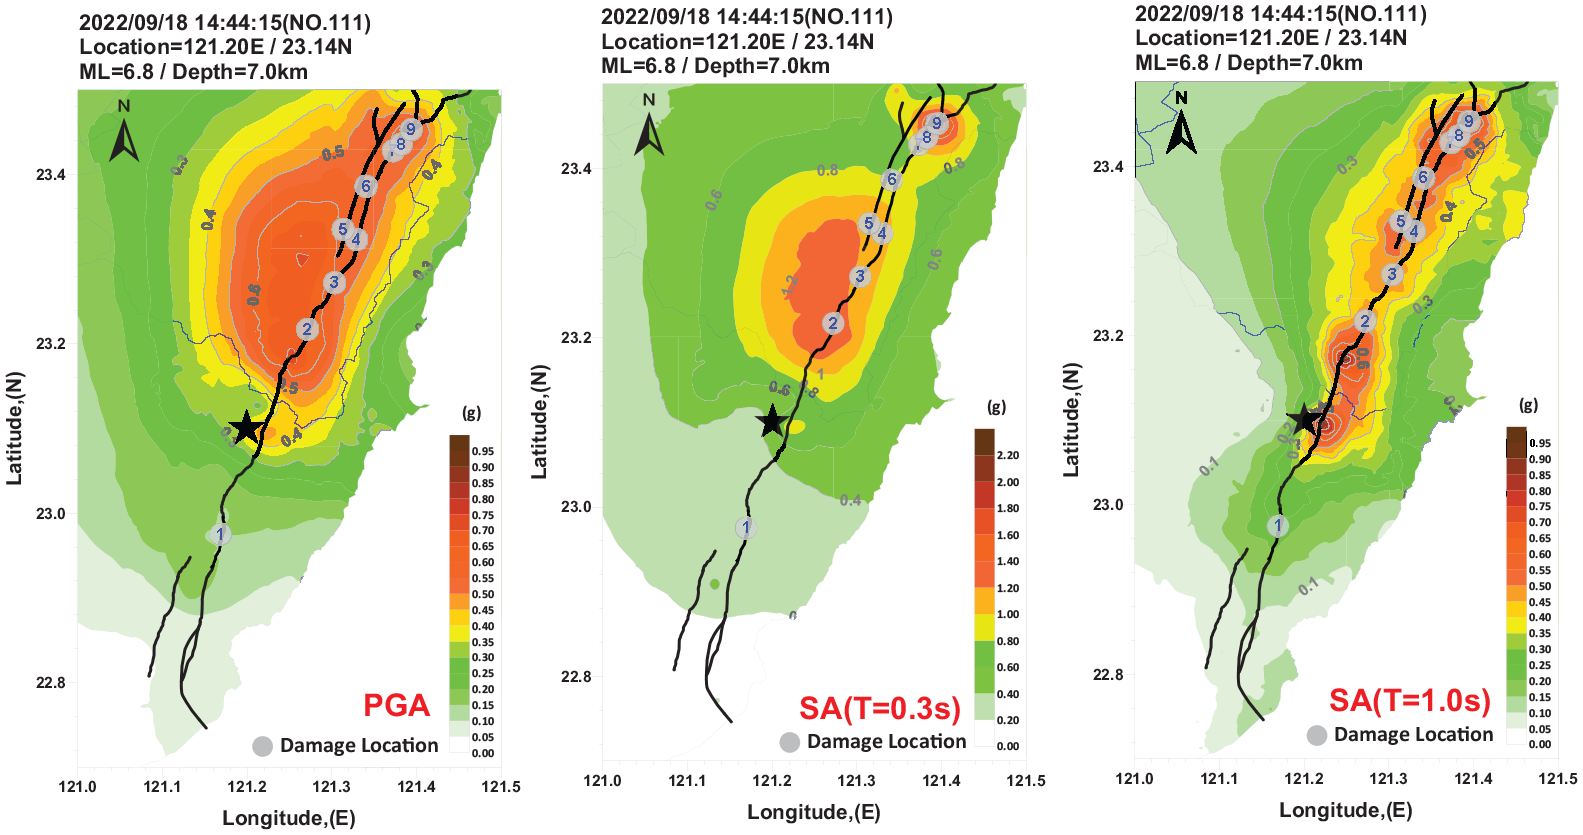
ShakeMaps of the Chihshang earthquake, including PGA and SAs with periods of 0.3 and 1.0 s. The gray dots with numbers are the locations of severe damage.
Significant damage sites of the Guanshan and Chihshang earthquakes
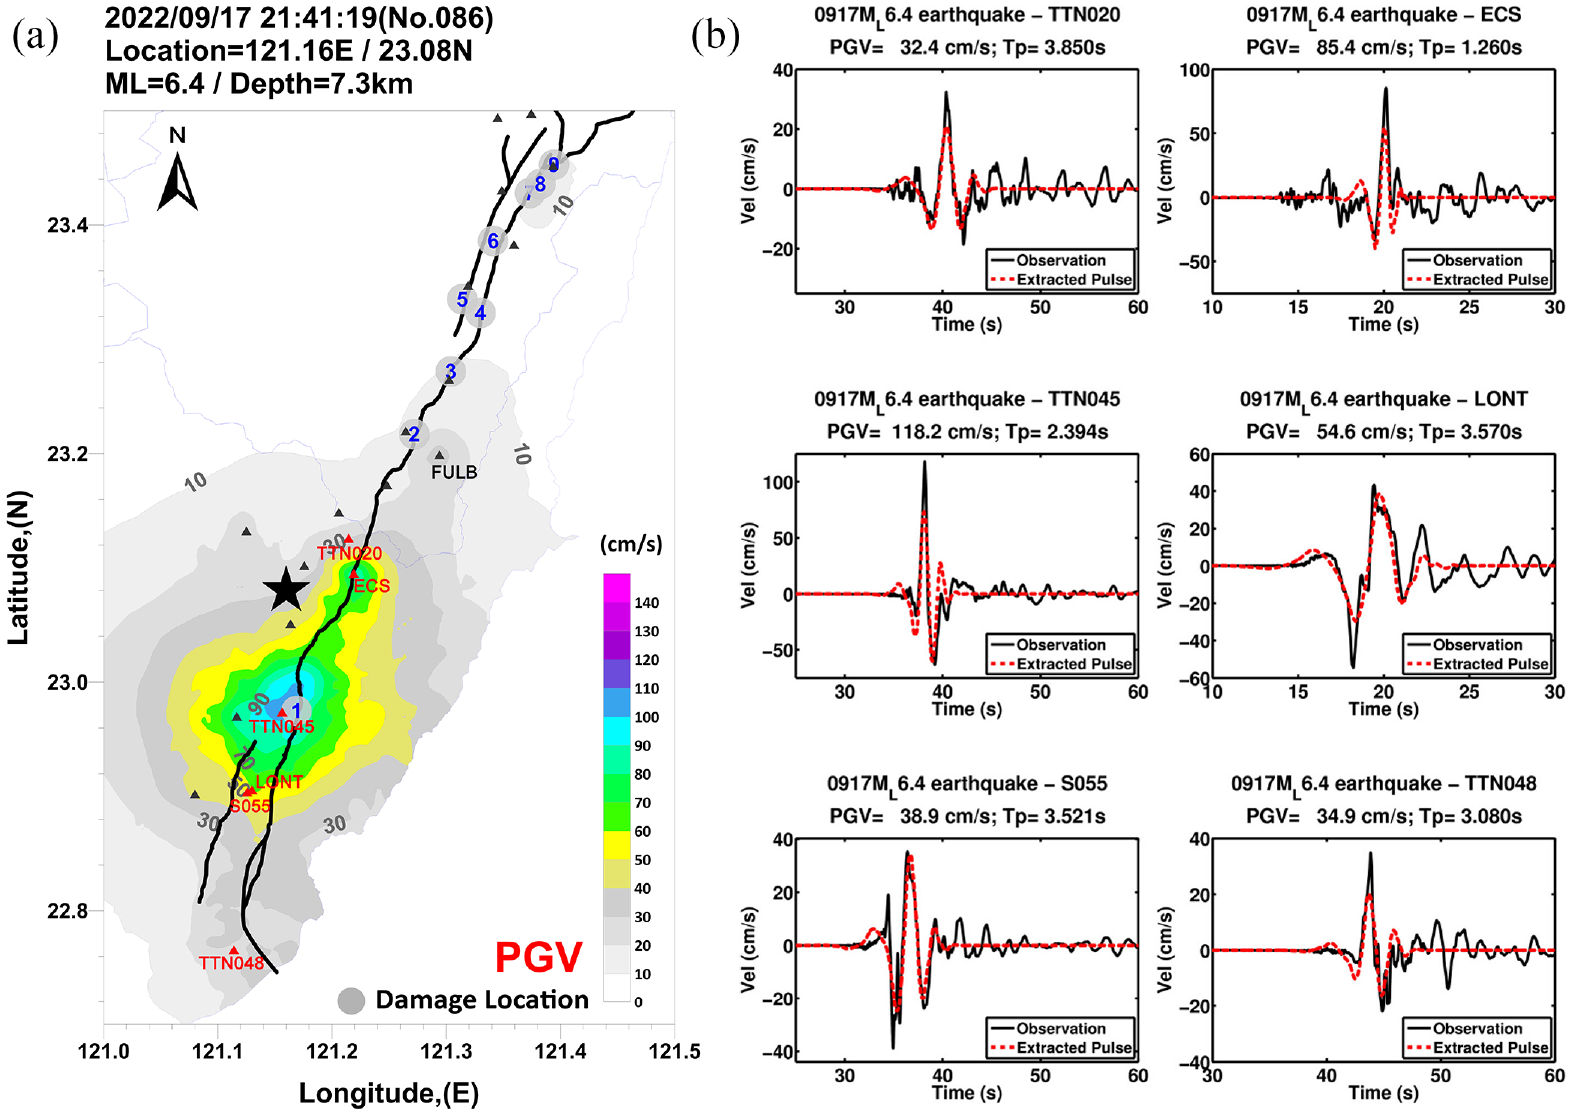
(a) PGV map and the observed velocity pulse at the stations (red triangles). (b) Identified velocity pulse waveforms for the Guanshan earthquake.
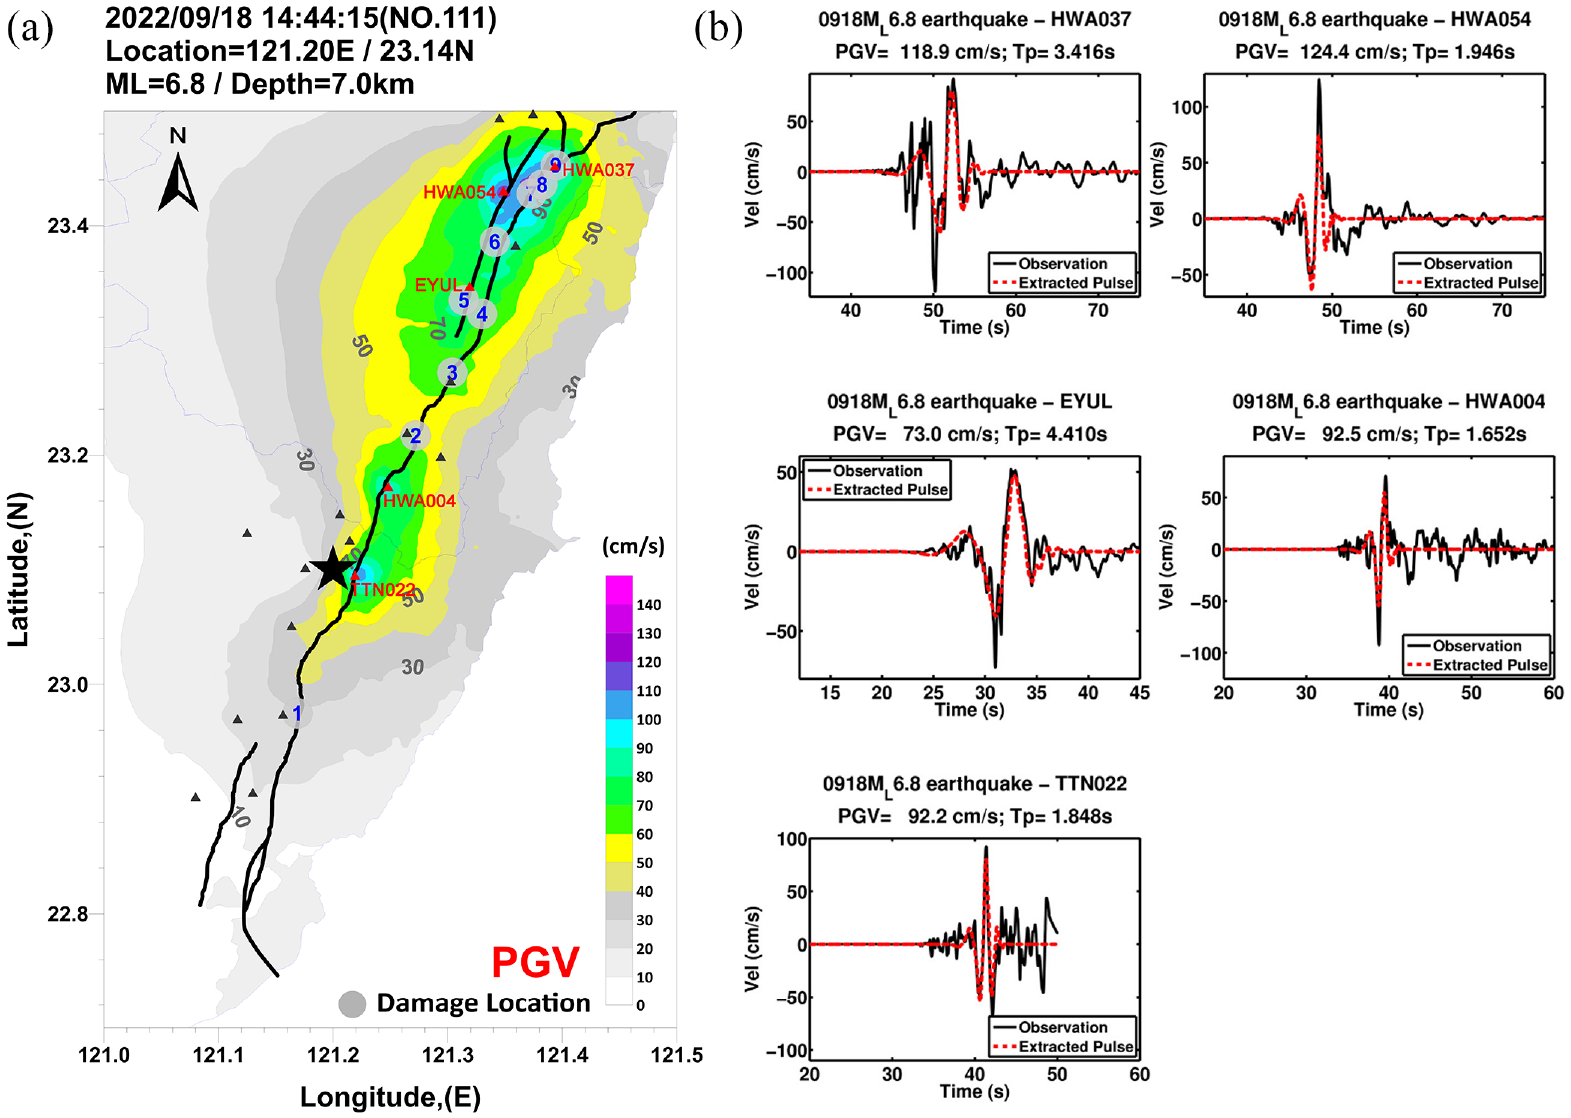
(a) PGV map and observed velocity pulse at the stations (red triangles). (b) Identified velocity pulse waveforms for the Chihshang earthquake.
Pulse-like ground motion
Near-fault pulse-like ground motion is considered a strong-motion characteristic induced by the rupture directivity of a fault, and a velocity pulse with long-period energy and large PGV can be destructive to structures (Gillie et al., 2010; Shahi and Baker, 2011; Spudich et al., 2013). The strong-motion records of the near-fault stations for the Guanshan and Chihshang earthquakes were analyzed to extract velocity pulses following the procedure of Shahi and Baker (2014). Table 2 lists the stations with the velocity time-histories identified as pulse-like ground motions. The locations of the stations are compared with the PGV contour map in Figures 6a and 7a. It is clear that strong motion with large PGV mainly resulted from those containing velocity pulses. In Figures 6b and 7b, the black curves indicate the observed velocity time-histories of the horizontal components, which is converted from the two perpendicular horizontal components in a specific direction to extract the largest pulse, and the red curves indicate the extracted velocity pulses. In general, it is evident that a high degree of similarity between the observational data and extracted pulse occurs approximately at the largest peak wave but the observed velocity waveforms are more complex, which reflect the complexity of the fault rupture in the asperity distribution and wave propagation. For the Guanshan earthquake, the largest PGV of the extracted velocity pulses is 118.2 cm/s at TTN045 station, and the longest pulse period (Tp) is 3.85 s at TTN020 station. For the Chihshang earthquake, the largest PGV of the extracted velocity pulses is 124.4 cm/s and observed at HWA054 station, and the longest Tp is 4.4 s at EYUL station.
Velocity pulses identified in the Guanshan and Chihshang earthquakes
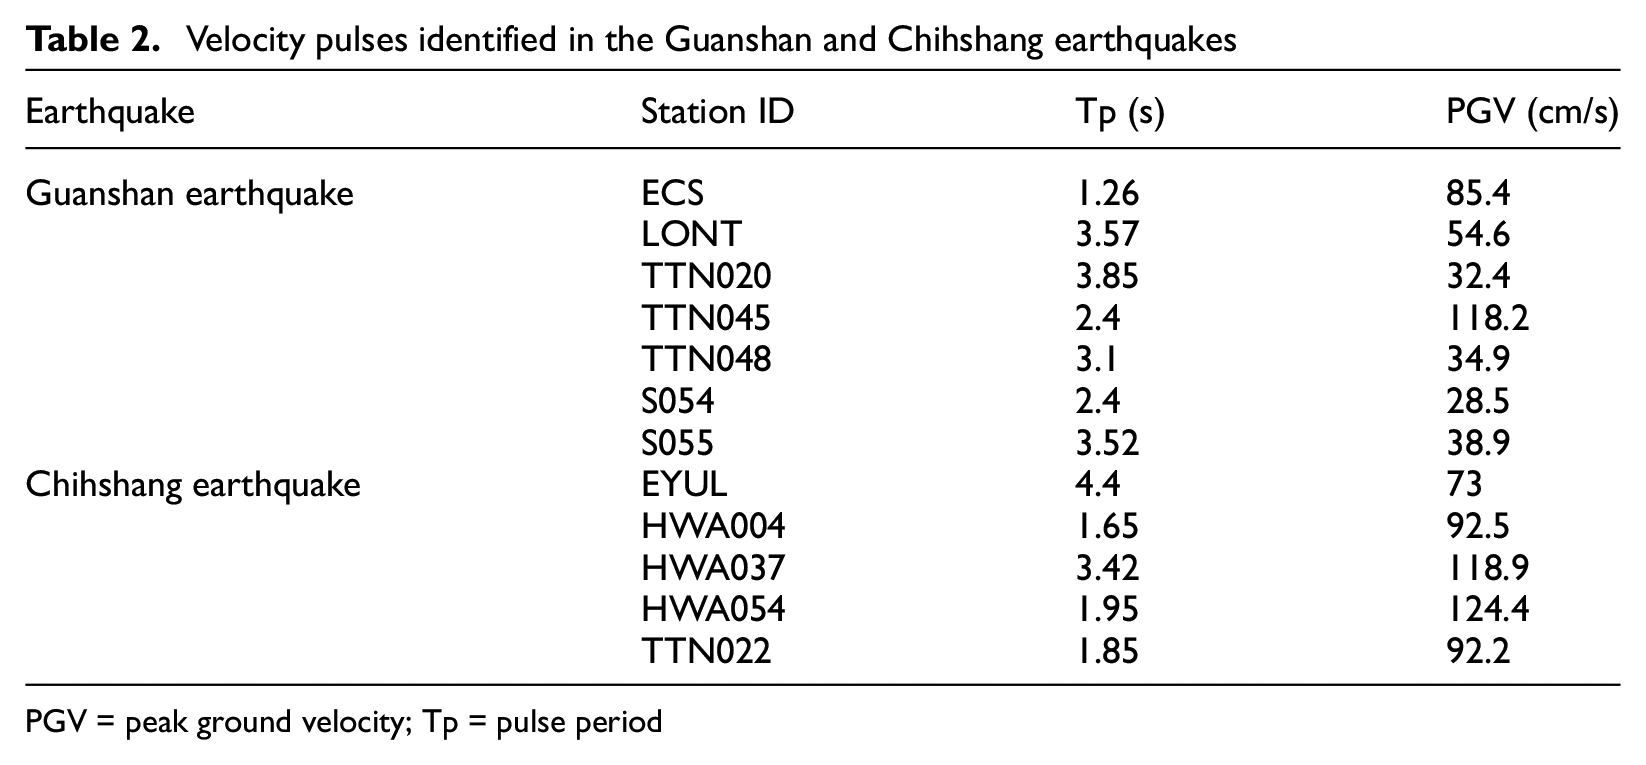
PGV = peak ground velocity; Tp = pulse period
Design and observed response spectra at damage sites
Figures 8 and 9 provide the estimated response spectra at the damage sites and the observed spectra recorded at the nearest strong-motion stations during the Guanshan and Chihshang earthquakes. The estimated response spectra were produced based on nearby observations, the GMPE (Chao et al., 2020), and a spatial correlation model. The estimated response spectra for the damage sites should agree well with the spectra derived from recordings at the nearby station. The difference between the estimated and observed response spectra is expected to increase with the distance between the damage site and the station.
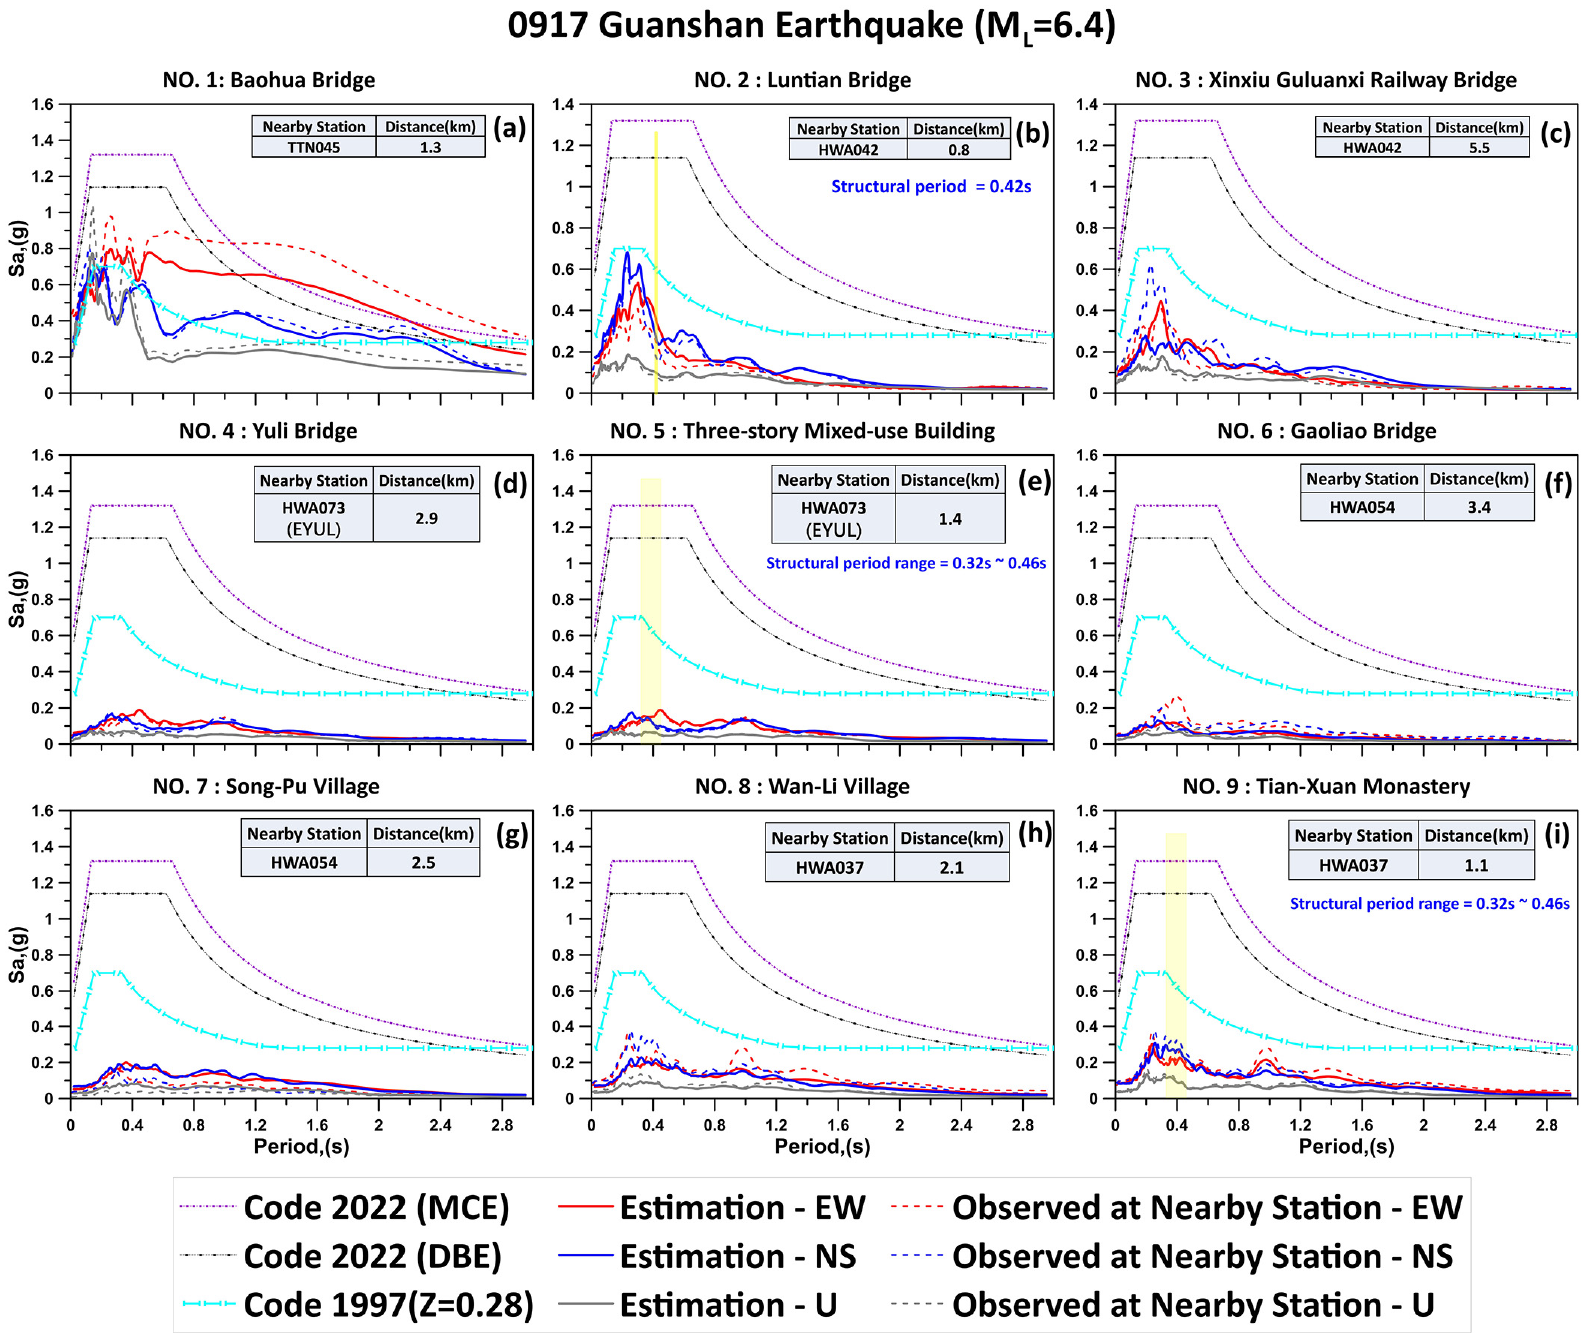
Comparisons of the estimated response spectra of the damage sites with the spectra observed at a nearby stations for the Guanshan earthquake, and the design response spectra of the building code enforced in 1997 (light blue line) and 2022 (black and purple lines). The distance from the damage site to the nearby station is listed in each subplot. The structural periods of some damaged structures are also marked by yellow bars.
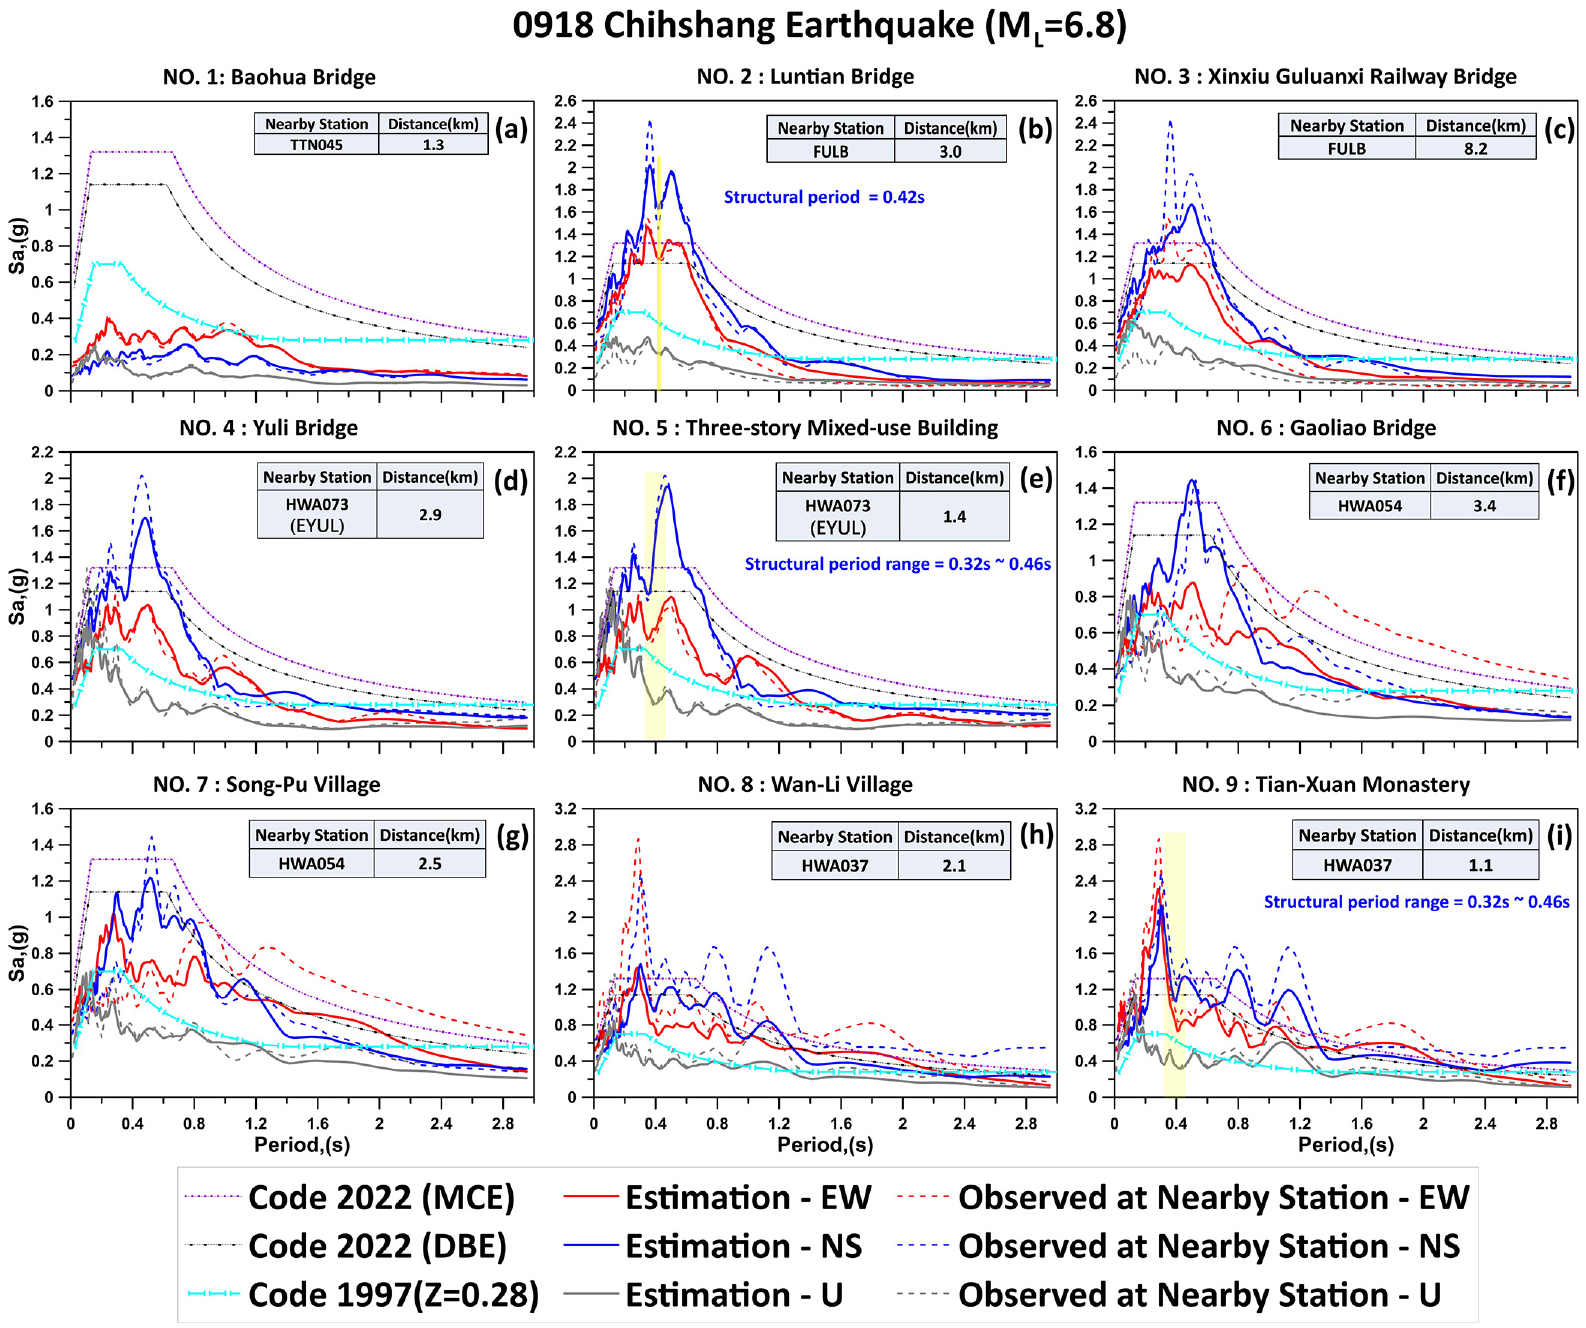
Comparisons of the estimated response spectra of the damage sites with the spectra observed at a nearby stations for the Chihshang earthquake, and the design response spectra of the building code enforced in 1997 (light blue line) and 2022 (black and purple lines). The distance from the damage site to the nearby station is listed in each subplot. The structural periods of some damaged structures are also marked by yellow bars.
The design response spectra of 475- (Design Basis Earthquake) and 2500-year return period (Maximum Considered Earthquake; MCE) of Taiwan’s Building Seismic Design Code (Construction and Planning Agency (CPA), 2022) and the design requirement of the 1997 version (CPA, 1997) are also shown in Figures 8 and 9. The design spectrum for the 1997 version of the site is based on a normalized response spectrum depending on local site conditions and the seismic zone horizontal acceleration factor Z of the townships. Figure 10 shows the 1997 version of the normalized response spectrum for three site conditions. The site conditions were defined by the period of the ground stratum (Tg in seconds), corresponding to the soil stratum’s thickness and shear wave velocities. The soil type 1 consists of Tg less than or equal to 0.2 s, representing a stiff and hard soil site. Soil type 2 includes soils with Tg ranging from 0.2 to 0.6 s, classified to be a medium soil site. The last one, soil type 3, is characterized by Tg larger than 0.6 s, representing a soft and weak soil site. For example, the seismic zone horizontal acceleration factor Z of the Yuli Township is 0.28 in the 1997 version and when a site condition of soil type 1 is assumed, the corresponding 1997 design spectrum is shown as the light blue curve in Figure 8e.
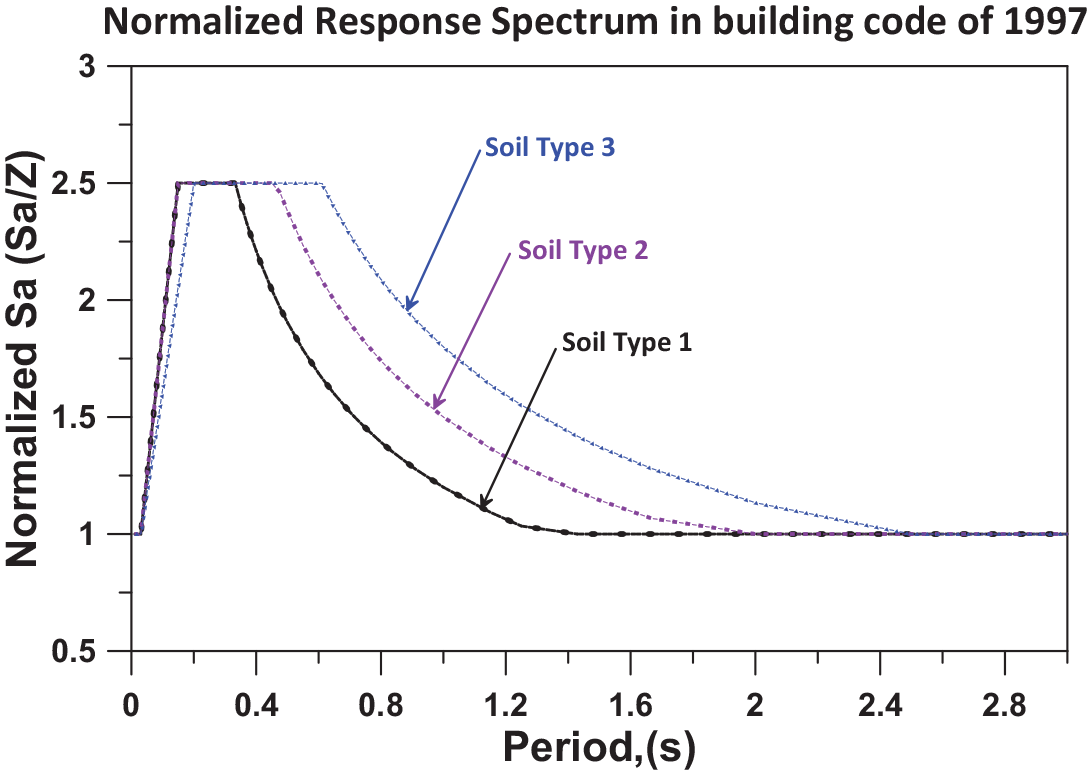
Normalized response spectra for the three site conditions in the Taiwan building code enforced in 1997.
In 2005, the building code considered the near-fault effect by introducing the near-fault adjustment factors NA and NV corresponding to the design SA value at the constant acceleration region and the constant velocity region (CPA, 2005), respectively. However, the near-fault effect is considered directly in the design SA value in the latest version (CPA, 2022), and it decreases with the distance between the target site and the fault. Figures 8 and 9 show comparisons between the response spectra of the station recordings of the two earthquakes of interest and the 1997 and 2022 design spectra at the damage sites. Along the northern Chihshang fault and Yuli fault, the response spectra recorded at the HWA037, HWA054, HWA073 (also EYUL), and FULB stations generated by the Chihshang earthquake are much higher than the design spectra at multiple periods. The large response spectra indicate that the damaged structures at No. 2 to No. 9 (Figure 9b to i) were part of the aftermath of the Chihshang earthquake. Moreover, it also indicates that the near-fault effects at long periods as specified in the 1997 design code (light blue line) or earlier were inadequate.
Building damage
The CPA of Taiwan organized a seismic reconnaissance survey for buildings all over Taiwan after the two earthquake events. The counties of Hualien and Taitung, where the epicenters and seismogenic faults are located, suffered the most severe building damage. Approximately 97 buildings were tagged with red or yellow signs in Taitung County, and more than 70 and 50 buildings were tagged with red and yellow signs, respectively, in the southern part of Hualien. The red sign indicates severe damage that should be fixed immediately; the yellow sign indicates the need for further structural evaluation. However, the mass adoption of retrofit solutions, as was conducted with school buildings in Taiwan, is a challenge for private buildings because it is hard for the owners of an apartment building to reach a common consensus for a retrofit scheme.
Of the damaged structures, 2 buildings and a corridor connecting 2 school buildings collapsed. The collapsed buildings were a three-story, mixed-use building and the three-story Tian-Xuan Monastery (Table 1; Figures 11 and 12). A corridor connecting 2 buildings in Chun-Rih Elementary School near the Tian-Xuan Monastery also collapsed (Table 1 and Figure 13). Many buildings with minor to major damage were also found in the Song-Pu and Wan-Li villages (Table 1; Figures 14 to 16) of Yuli Township in southern Hualien. The damaged buildings were all located along the Yuli and Chihshang faults. The following sections describe the findings of the field reconnaissance on the 2 collapsed buildings and other buildings with structural damage in the two residential villages.
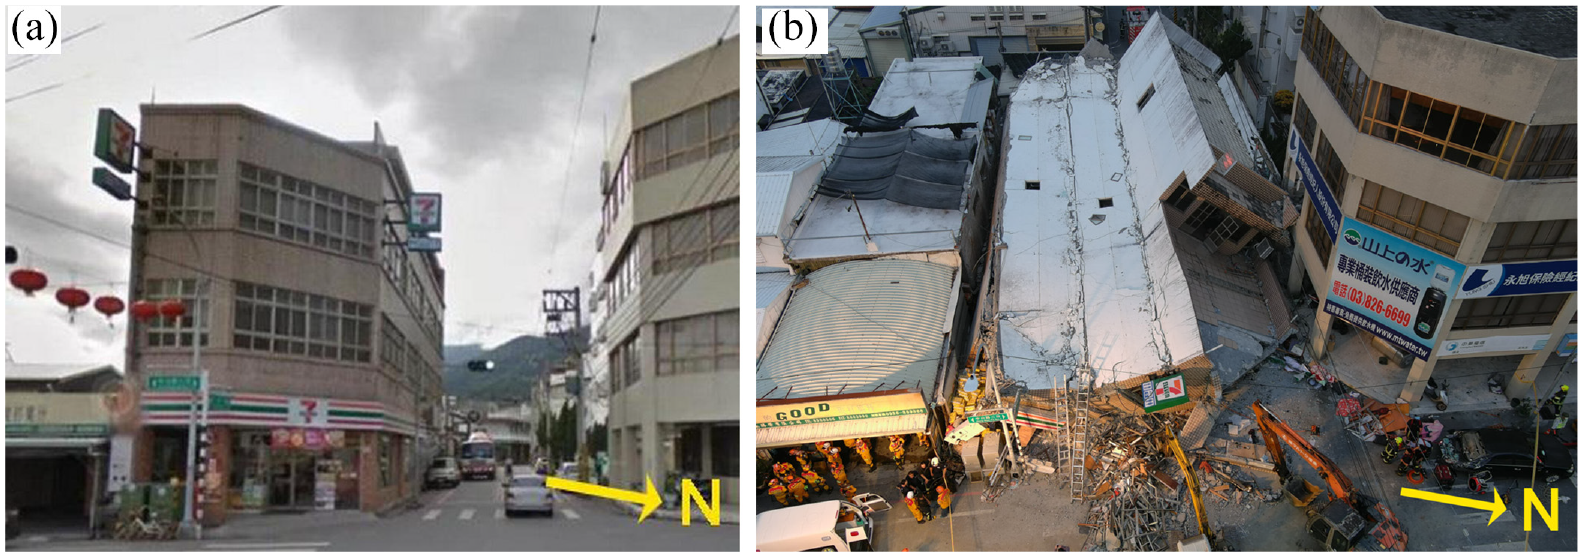
Three-story mixed-use building at site No. 5 in Table 1 (a) before and (b) after the earthquake.
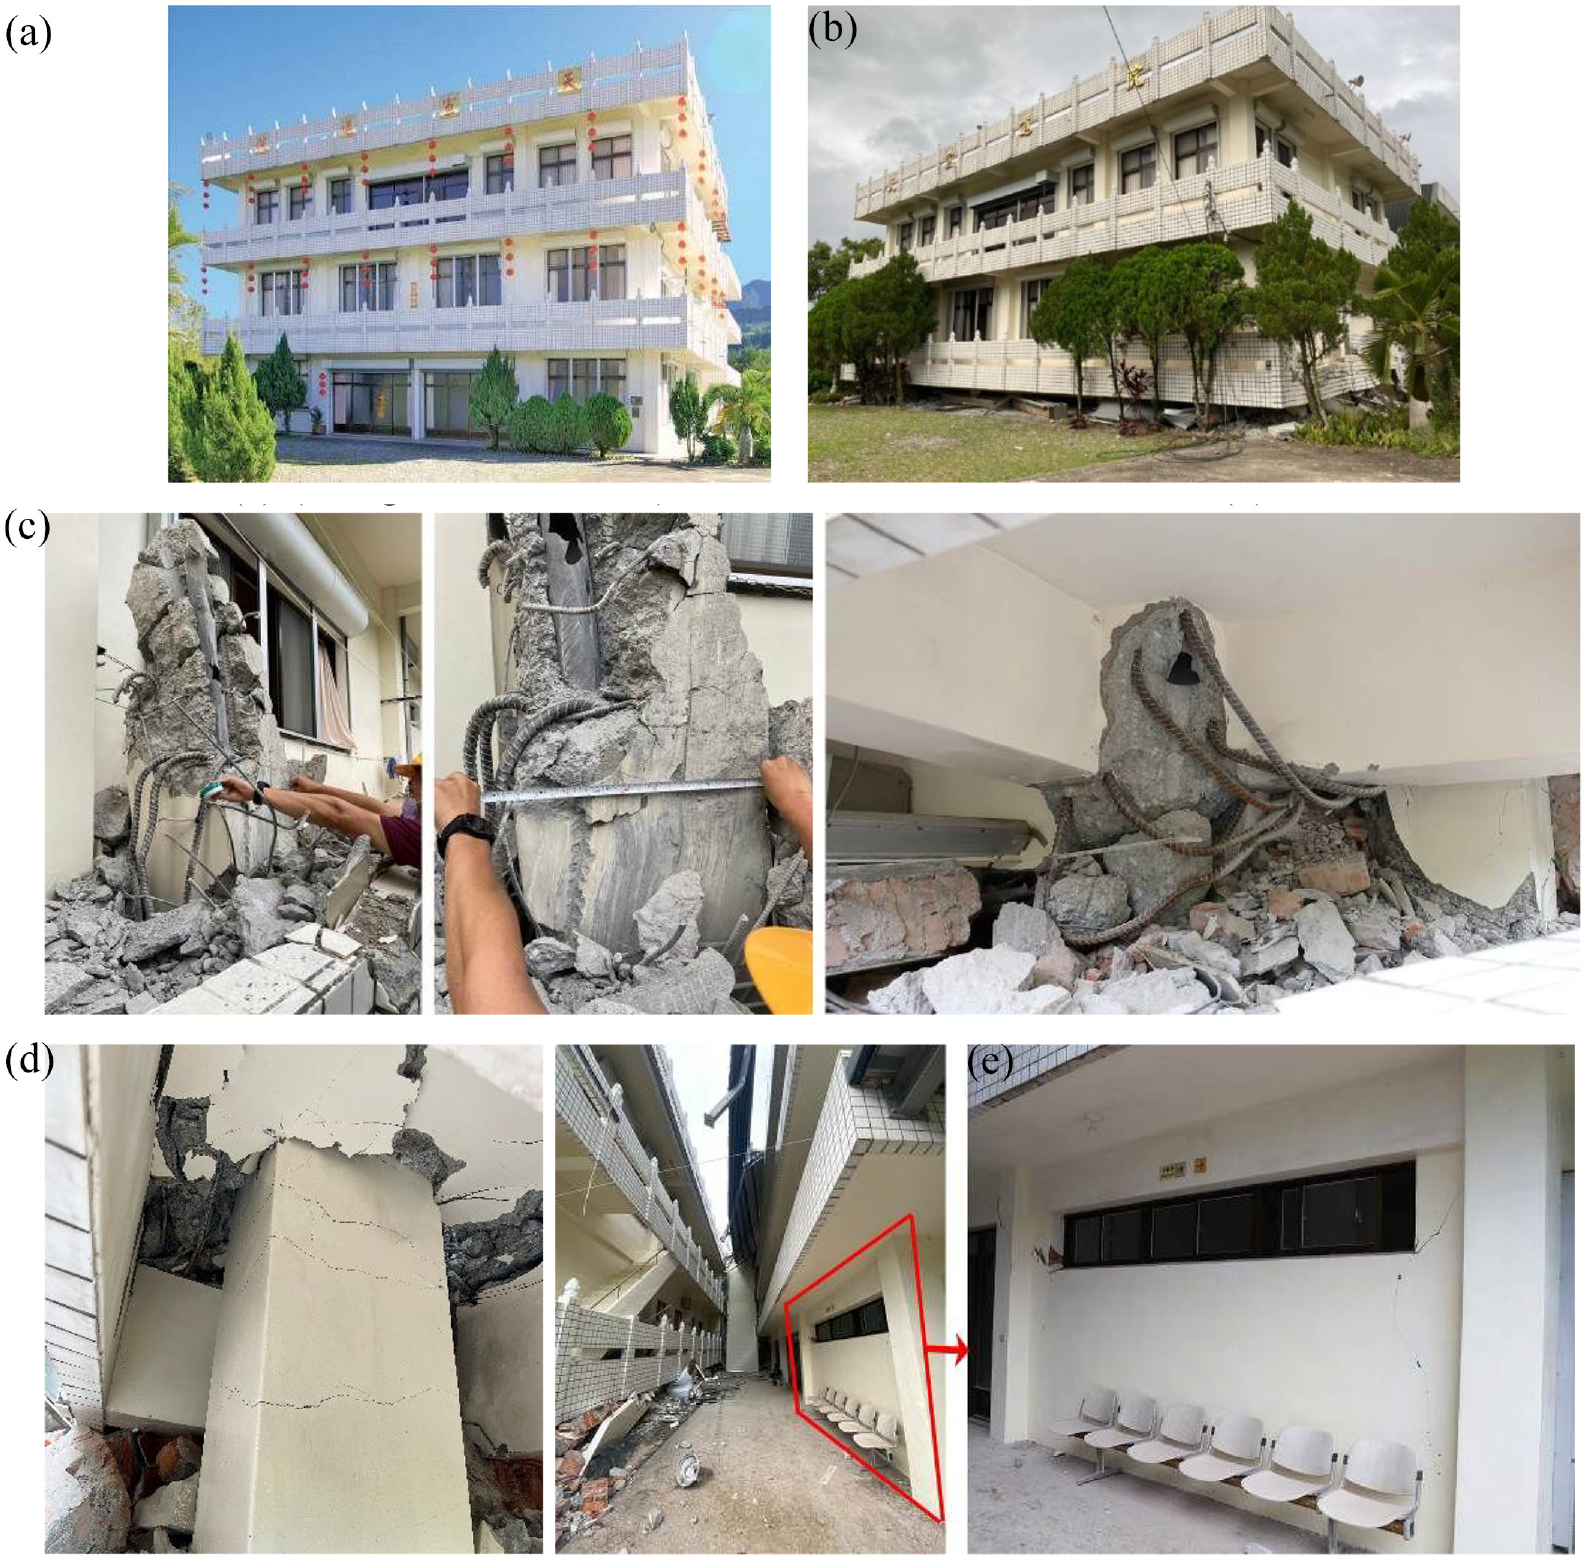
Collapsed three-story monastery building at site No. 9 in Table 1 (a) before and (b) after the earthquakes, (c) crushed columns, (d) damaged columns, and (e) slightly damaged column and wall of the un-collapsed building.
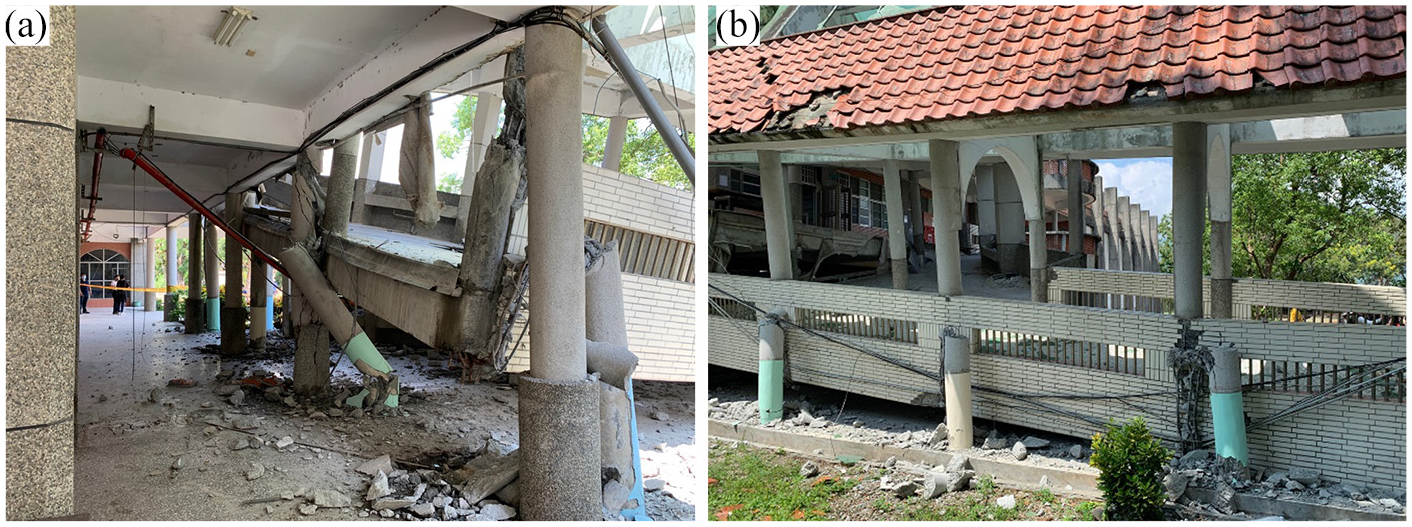
Collapse of a double-level corridor at the Chun-Rih Elementary School close to site No. 9 in Table 1. (a) Front view and (b) side view.
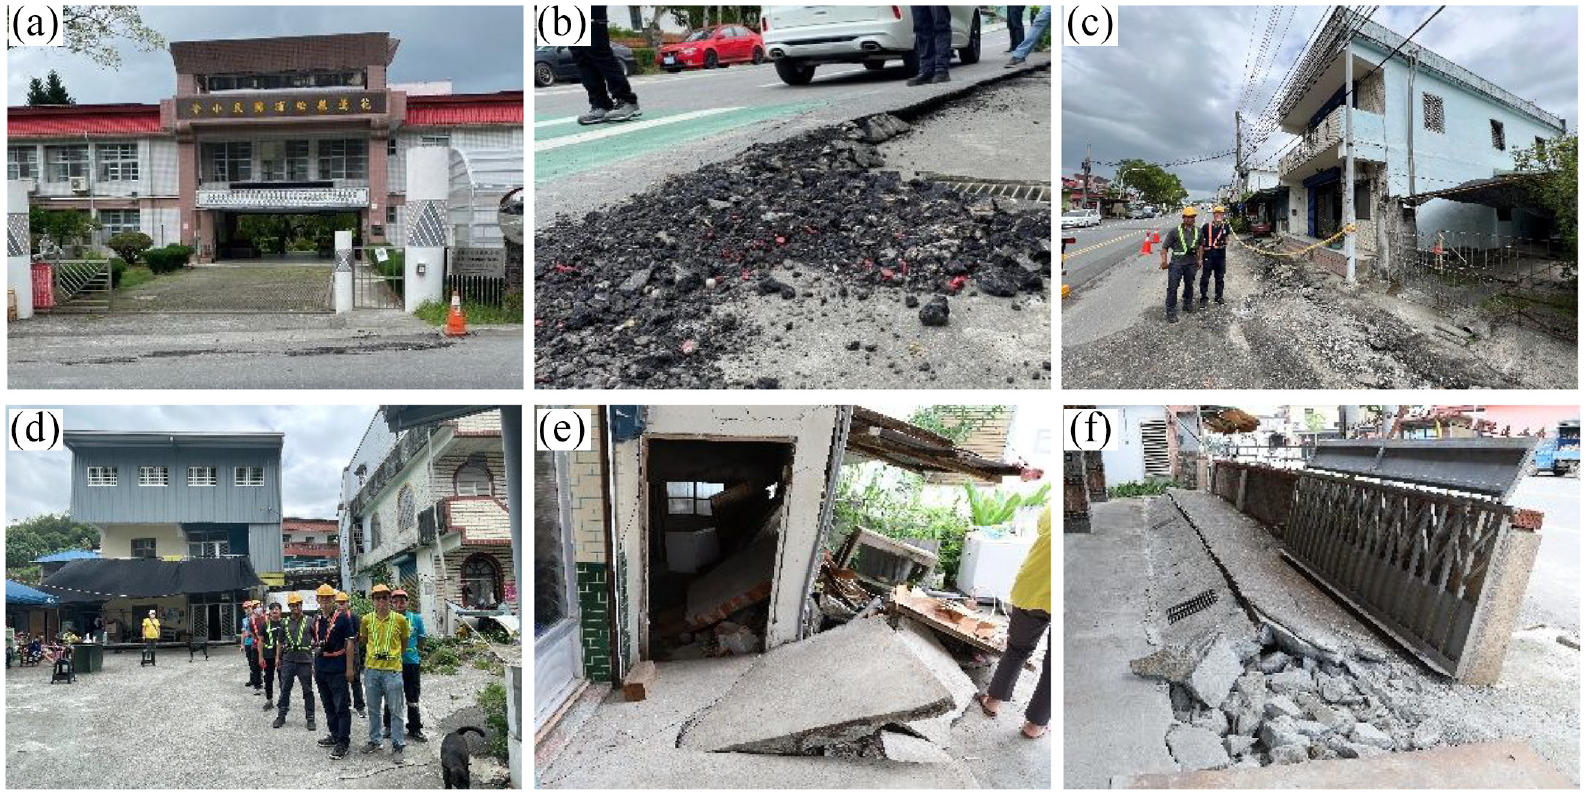
Ground uplifted and crushed in Song-Pu village at site No. 7 in Table 1. (a) Front of the Song-Pu elementary school, (b) opposite of the Song-Pu elementary school, and (c to f) the fronts of 4 residential housing buildings.
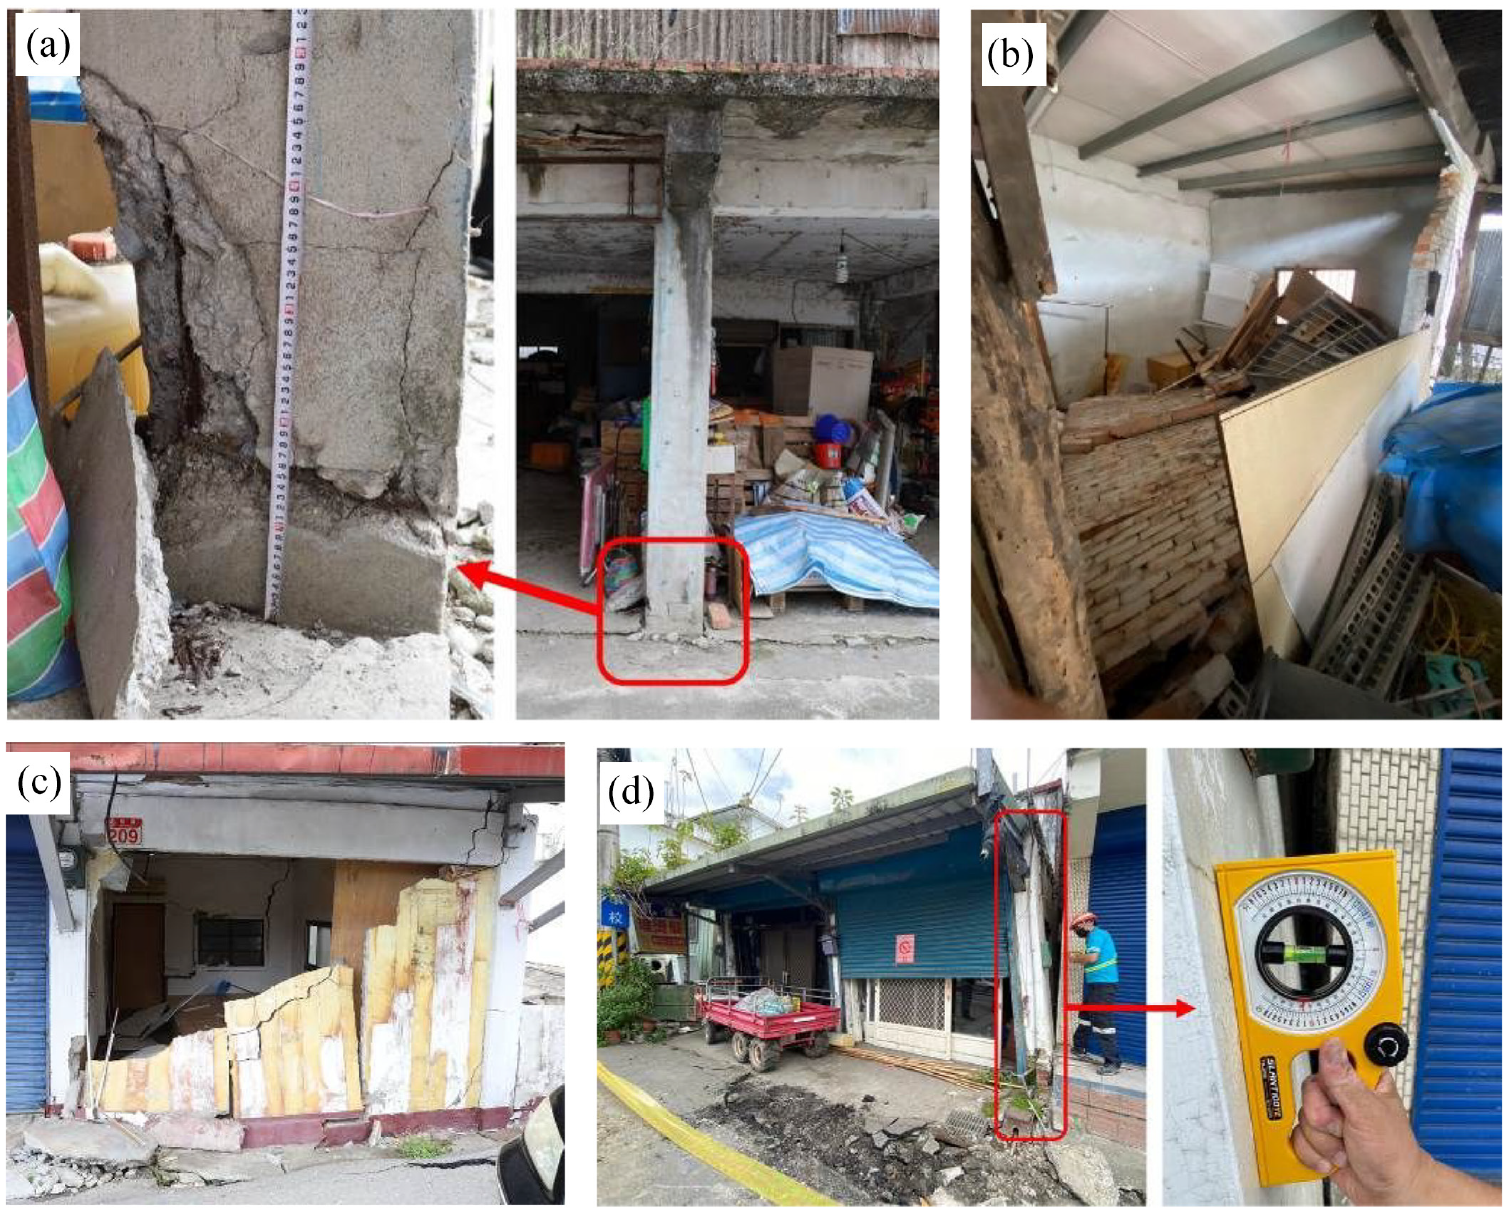
Photographs of the damaged buildings in Song-Pu village at site No. 7 in Table 1. (a) Shear cracks and flexure-shear cracks at a column base, (b) partially collapsed brick wall, (c) large flexural-shear crack at the beam end, and (d) significant residual drift (approximately 8°).
Photographs of the damaged buildings in Wan-Li village at site No. 8 in Table 1. (a) One-story building with severe damage at the column base and (b) significant tilt of a two-story building with a bulge in first-story masonry and flexural cracks along the exterior column.
Three-story mixed-use building
The collapsed three-story mixed-use building (damage site of No. 5) was a reinforced concrete building constructed in 1994. This building was approximately 28 m long by 6 m wide with the longitudinal direction closely aligned in the E-W direction. The first floor was utilized as a convenience store, and the upper two floors were residential apartments. The structural period was estimated to be between 0.32 and 0.46 s based on the approximate fundamental period for moment-resisting frames (ASCE/SEI 7-22, 2022). The period corresponds to the maximum acceleration response spectrum of the nearby stations (HWA073 and EYUL), which was 2.0 g in the N-S component (Figure 9e). Furthermore, the EYUL station observed a velocity pulse with a Tp of 4.4 s and PGV of 73 cm/s, which may have increased the ductility demand during the Chihshang earthquake (Figure 7b). Figure 9 shows the building before and after the collapse. Note that the first story of the corner building was used as a convenience store with large open spaces only on the sides of the building facing the street, resulting in an asymmetric plan and potentially a soft-and-weak first story. Since the building was built before the 1999 Chi-Chi earthquake, no ductile detailing was enforced during construction nor was torsion design implemented for the first-story opening. The significant peaks of the N-S acceleration response spectra were two to three times larger than the design values (between 0.2 and 0.6 s in Figure 9e), and such a building with the dominant period in this period range might be expected to experience high drift concentrations in its first story and collapse in the N-S direction (Figure 11).
Three-story monastery building and Chun-Rih Elementary School
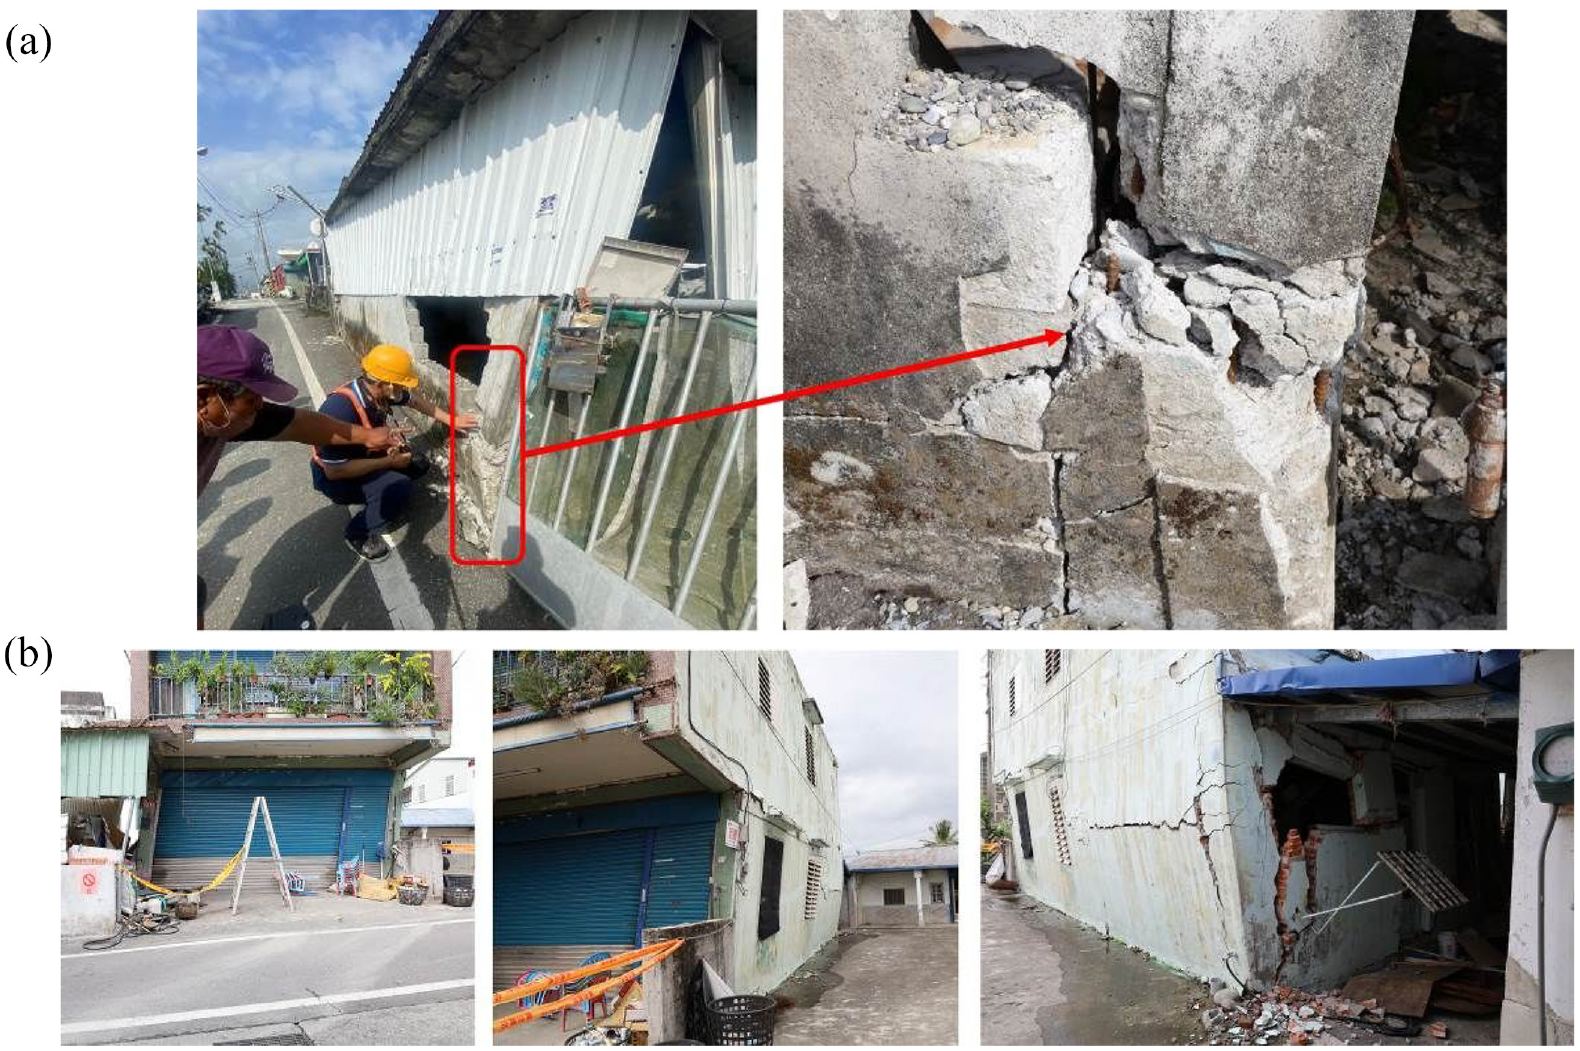
The Tian-Xuan Monastery (damage site of No. 9) in Yuli consisted of 2 adjacent confined masonry buildings constructed in 1978, with the west building collapsing. The collapsed building was approximately 23 m long by 15 m wide with the longitudinal direction close to the N-S direction. The three-story building had an estimated fundamental period between 0.32 and 0.46 s, which is in the region corresponding to the maximum SA response (2.8 g) of the nearby station, HWA037 (Figure 9i). Figure 12 shows the building before and after the earthquakes. The first story had an opening between each column with glass doors and/or windows that appeared to have a wider span compared to the upper floors. The second and third floors had walkways around the perimeter of the building with the slab extending beyond the column lines. After the earthquakes, the first-story columns were completely crushed or shifted and punched through the floor slab, with the second floor coming down near ground level. Figure 12c shows the column main reinforcements, poorly confined with sparse stirrups and bulged outward or had ruptured. There was a water pipeline passing through the column, which was a common construction method for old buildings in Taiwan. The damaged columns had #8 longitudinal reinforcement and the spacing of the #3 stirrup was greater than 25 cm. Figure 12d shows the first-story column punch through the second-floor slab from below. The building moved diagonally and collapsed along the 45° direction, which could have been the direction of strongest shaking considering the maximum acceleration responses in the E-W and N-S directions recorded at the HWA037 station, 1.1 km away, being similar (i.e. 2.8 vs 2.5 g in Figure 9i). Because of the large width-to-height ratio of the building and the deficient transverse reinforcement of the first story, the soft-and-weak first story eventually led to a “sit-down” collapse (Lin et al., 2020). For comparison purposes, the collapsed three-story mixed-use apartment had a smaller width-to-height ratio in the collapse direction, thus the collapsed mode of the mixed-use apartment was the “knee-down” type as shown in Figure 11. The other building at this monastery had the same height but a smaller plan dimension compared to the collapsed building. The existence of a first-story masonry wall could have prevented the collapse. However, the first-story column did experience severe shear cracking from the top end of the first-story column throughout the beam-to-column connection (Figure 12e).
The Chun-Rih Elementary School located close to the site of the collapsed monastery building (damage site of No. 9) experienced damage to a corridor connecting 2 buildings (Figure 13). The strong-motion station HWA037 near the school observed a velocity pulse with a Tp of 3.4 s and PGV of 118.9 cm/s for the Chihshang earthquake (Figure 7b). Figure 13 shows that the corridor was originally two stories. The first story collapsed due to column shear failure or plastic hinge failure at the column base without sufficient confinement.
Residential buildings in Song-Pu and Wan-Li villages
In the Song-Pu (damage site of No. 7) and Wan-Li villages (damage site of No. 8) of Yuli Township, many residential buildings were heavily impacted by the strong motion of the Chihshang earthquake (Figure 9g and h). The 2 stations close to the villages, HWA037 and HWA054, both observed long-period velocity pulses and PGV larger than 110 cm/s (Figure 7). Figure 14 shows the ground failure following the fault rupture trace in Song-Pu Village. The pavement in the front of many buildings was damaged by deep and wide ground cracks with uplifts in some cases. In one building along the fault rupture trace, the interior brick walls had severely collapsed, and the first-story columns were severely damaged experiencing shear cracks and flexure-shear cracks at the column base (Figure 15a). A one-story residential structure had a partially collapsed brick wall and flexural-shear crack at the beam end (Figure 15b and c). The first-story column experienced only minor shear cracks due to the existence of the brick wall. Another one-story building had undergone a significant residual drift of approximately 8° (Figure 15d).
In Wan-Li Village, residential buildings were also heavily impacted by the earthquakes. Figure 16a shows that a one-story building experienced significant damage at its column base with #4 longitudinal reinforcement fracturing. Figure 16b shows a two-story building that has a significant tilt of approximately 9° with major cracks at the bend of the first-story masonry and flexural cracks along the exterior column. Although the damaged building was too unstable to measure its tilt angle, the first-story column did not fail or collapse because the masonry likely continued to partially support the weight.
Bridge damage
Five damaged bridges, including two collapsed bridges, were surveyed during the reconnaissance of the Guanshan and Chihshang earthquakes. From south to north, the five bridges are Baohua Bridge, Luntian Bridge, Xinxiu Guluanxi Railway Bridge, Yuli Bridge, and Gaoliao Bridge. Figure 17 shows the locations of the bridges together with the faults. Most of the bridges were built in an E-W direction across the N-S valley, except for the Xinxiu Guluanxi Railway Bridge, which runs in an N-S direction. The closest distances of the bridges to the faults are listed in each sub-figure of Figure 17. The damage observed in the field was similar to that incurred during the 1999 Chi-Chi earthquake (Amin et al., 2001; Huang et al., 2001; Wang, 2011; Wang et al., 2016), including subsidence to the ground surface of the retaining walls, shear failure of the bridge columns, expansion joint failure, deck falling, extrusion damage to the pavement on deck, buckling of the attached pipelines, and shock-absorber failure.
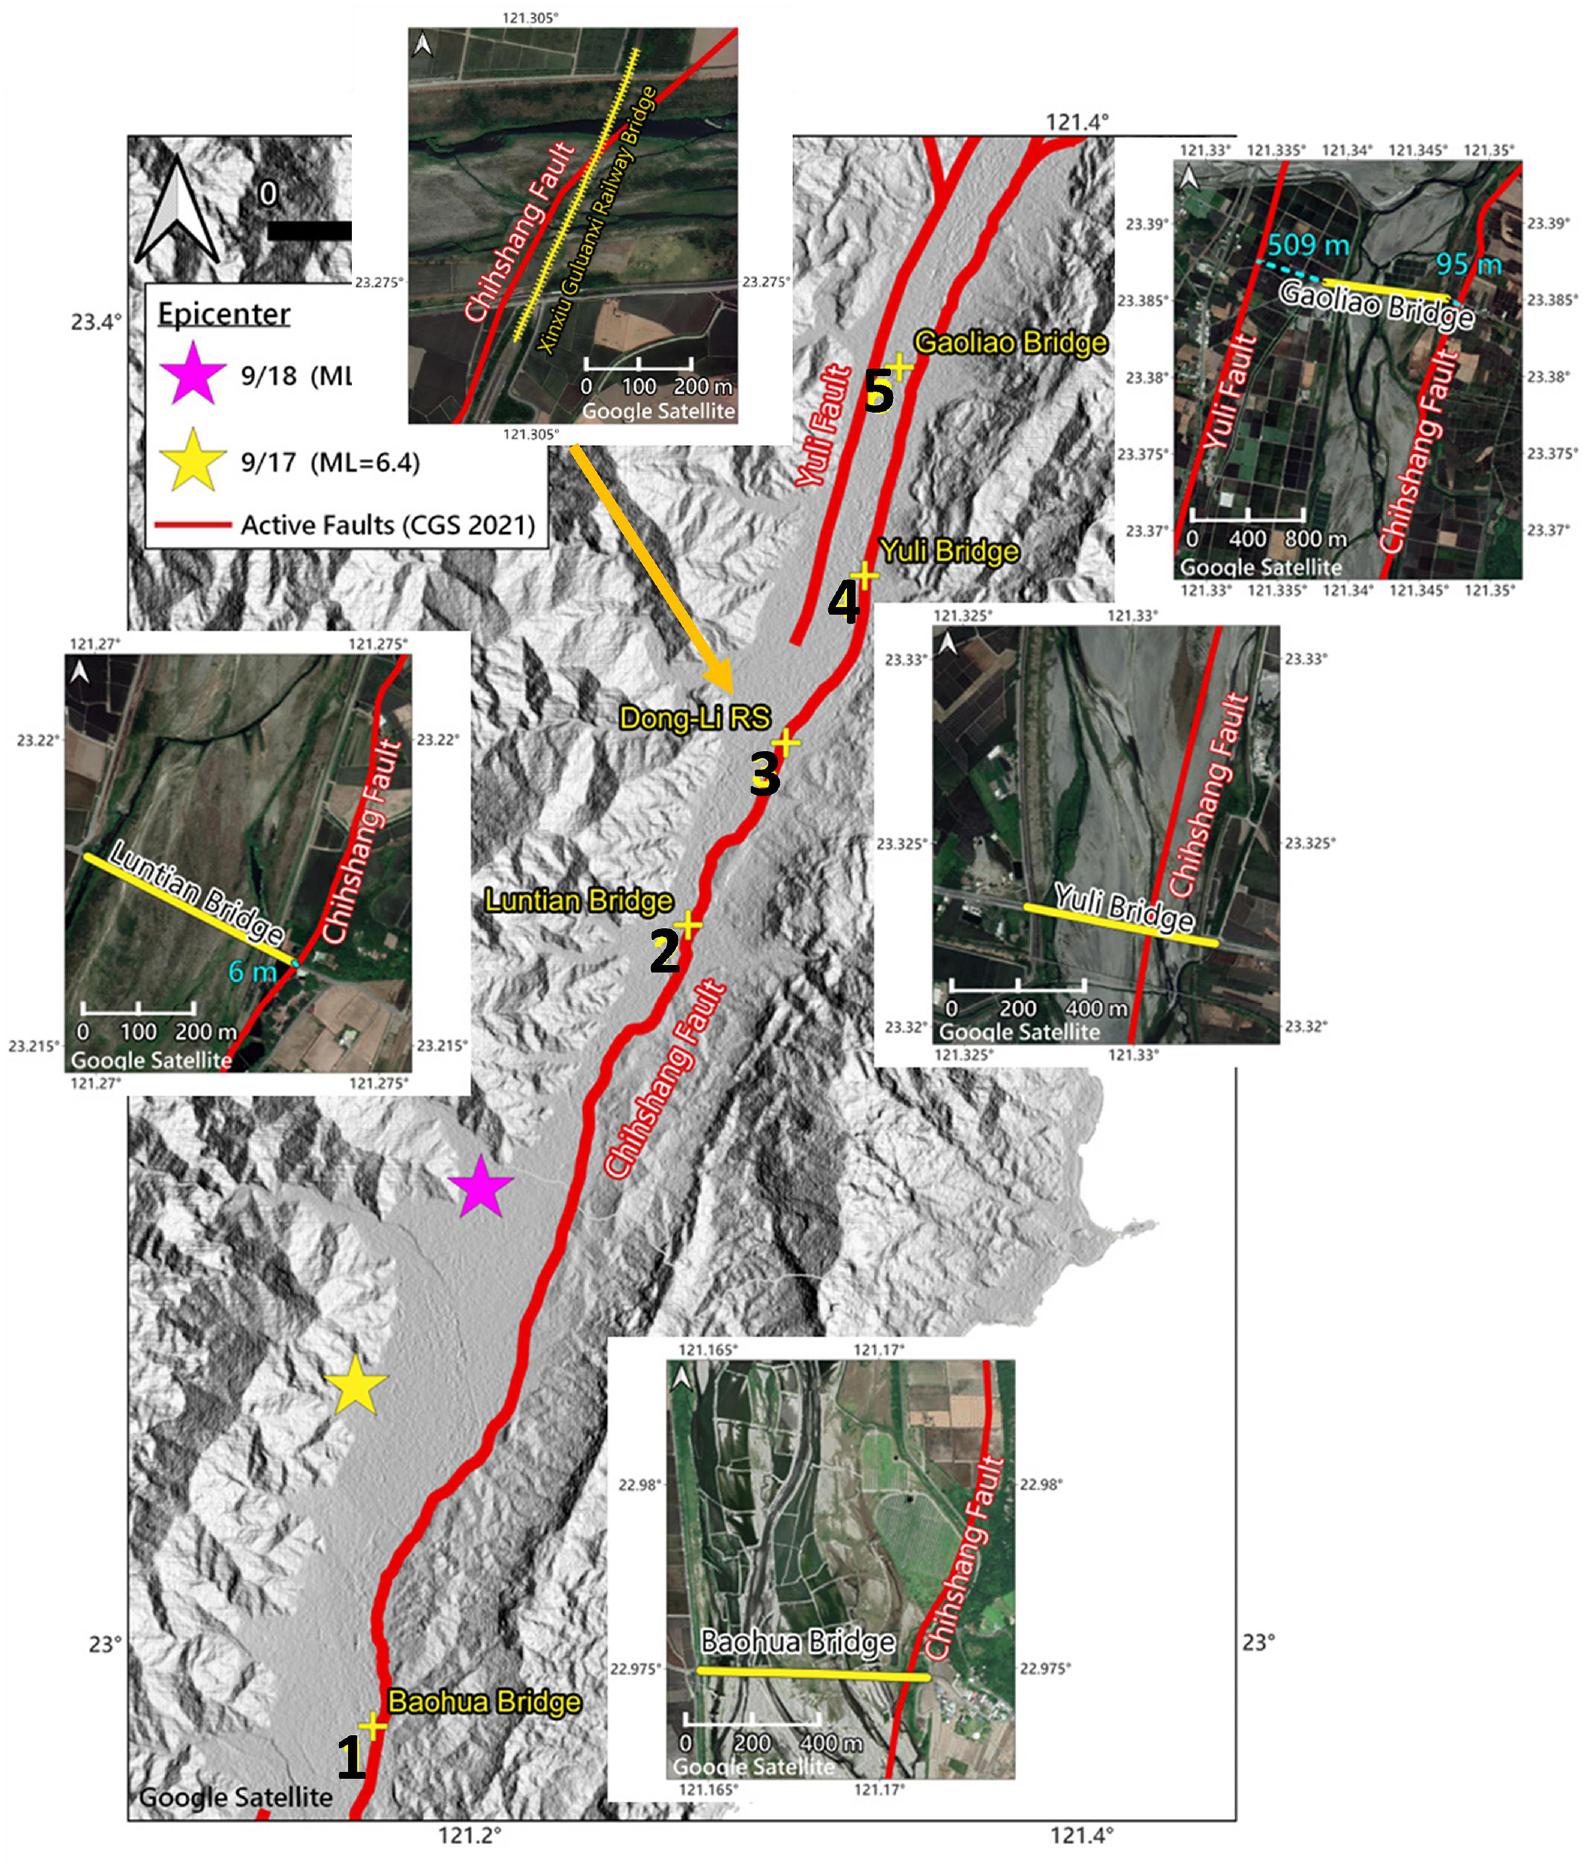
Locations of the five damaged bridges near the faults.
Baohua Bridge
Completed in 1984, Baohua Bridge (damage site of No. 1) was a pre-stressed girder bridge with 17 spans and a total length of 680 m. The TTN045 station, nearby Baohua Bridge, shows the three-component acceleration response spectra for the two earthquakes in Figures 8a and 9a. The peaks of the acceleration response spectra for the Guanshan earthquake are much larger than those of the Chihshang earthquake, especially for the E-W component, which are also larger than the MCE of 2022 design spectra between 1.0 and 2.5 s. It is consistent with the news report that the Baohua Bridge was damaged by the Guanshan earthquake before the Chihshang earthquake occurred.
Figure 18 shows the damage to the Baohua Bridge near the east end close to the Chihshang fault, including the girder dislodgement both longitudinally and laterally, pavement extrusion failure, and flexible pipe compression failure. According to the Global Navigation Satellite System (GNSS) observations of the Central Geology Survey (CGS, 2022), the permanent ground displacements induced by the Guanshan and Chihshang earthquakes are, respectively, 20 and 25 cm toward the west. The bridge had been retrofitted by extending the cap width using 22 cm steel brackets to prevent unseating of the deck (Figure 18c) so that the superstructure did not fail during either earthquake. Given the moderate level of damage, the Baohua Bridge was temporally re-opened within several days to local traffic with limited vehicle weight after the pavement and the bridge guardrail had been repaired.
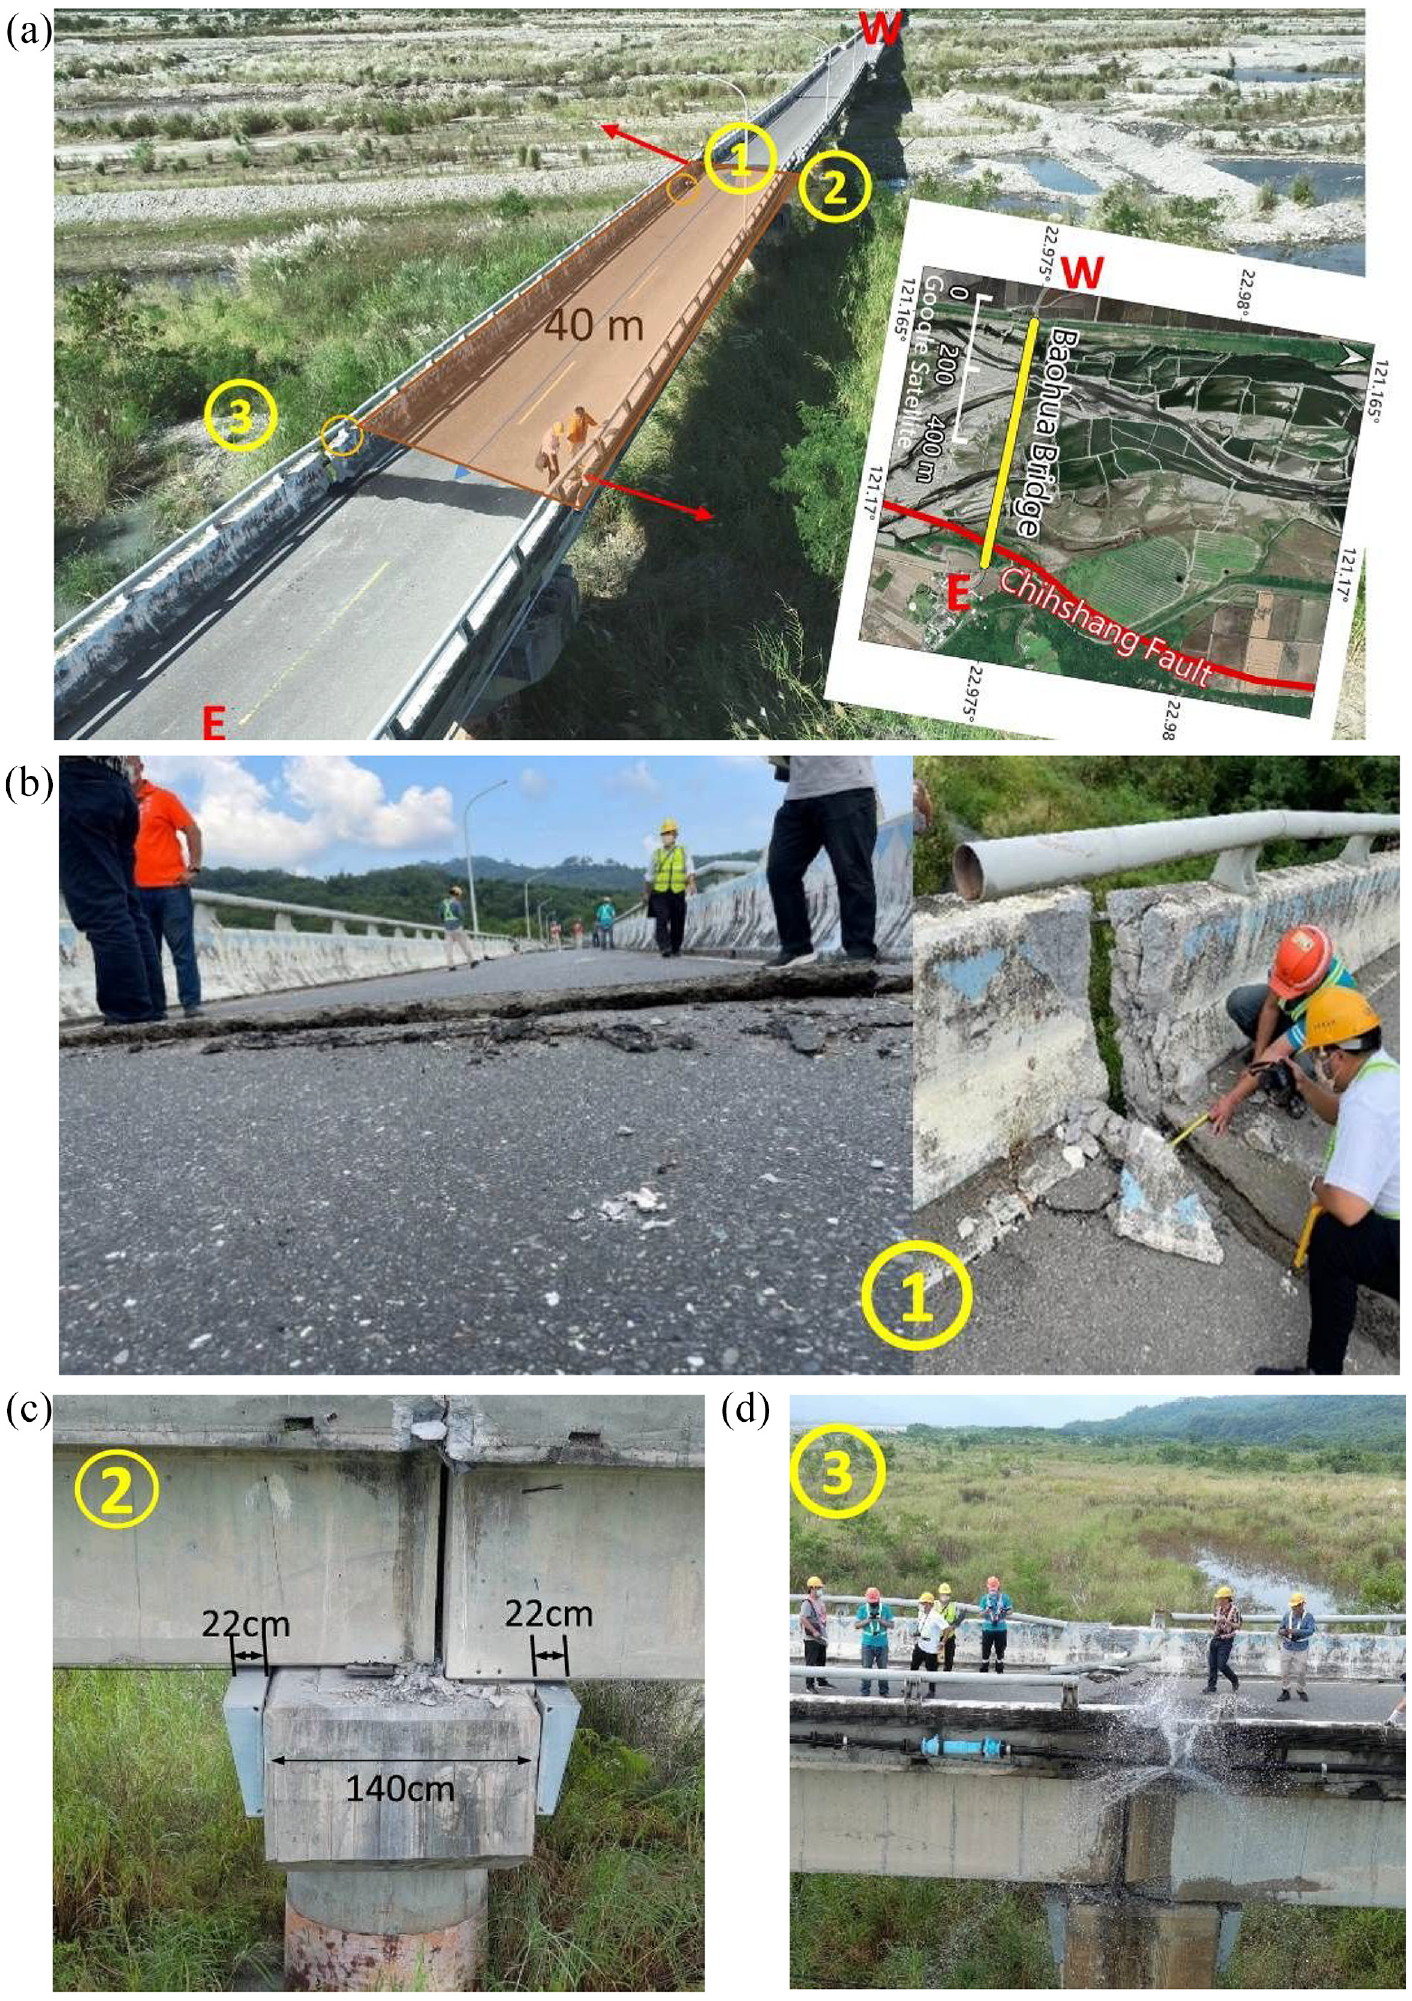
Damage to Baohua Bridge at site No. 1 in Table 1. (a) Bird’s view of the damaged span near the east end, (b) pavement extrusion failure and broken guardrail, (c) girders near the east end dislodged longitudinally and laterally, and (d) attached flexible pipe compression failure during the second earthquake.
Luntian Bridge
Luntian Bridge (damage site of No. 2) was completed in 1982 with a length of 450 and 30 m per span. It is a pre-stressed concrete girder bridge with columns of approximately 5.5 m in height. After the Chihshang earthquake, the west part of Luntian Bridge collapsed toward the north, as shown in Figure 19. The nearby strong-motion station, FULB, observed the N-S component’s maximum acceleration response spectrum for the Chihshang earthquake of approximately 2.4 g at periods between 0.3 and 0.5 s (Figure 9b). From the CGS (2022), the permanent ground displacement near the east end of the bridge was measured as 71 cm toward the northwest and that near the west end of the bridge as 97 cm toward the south.
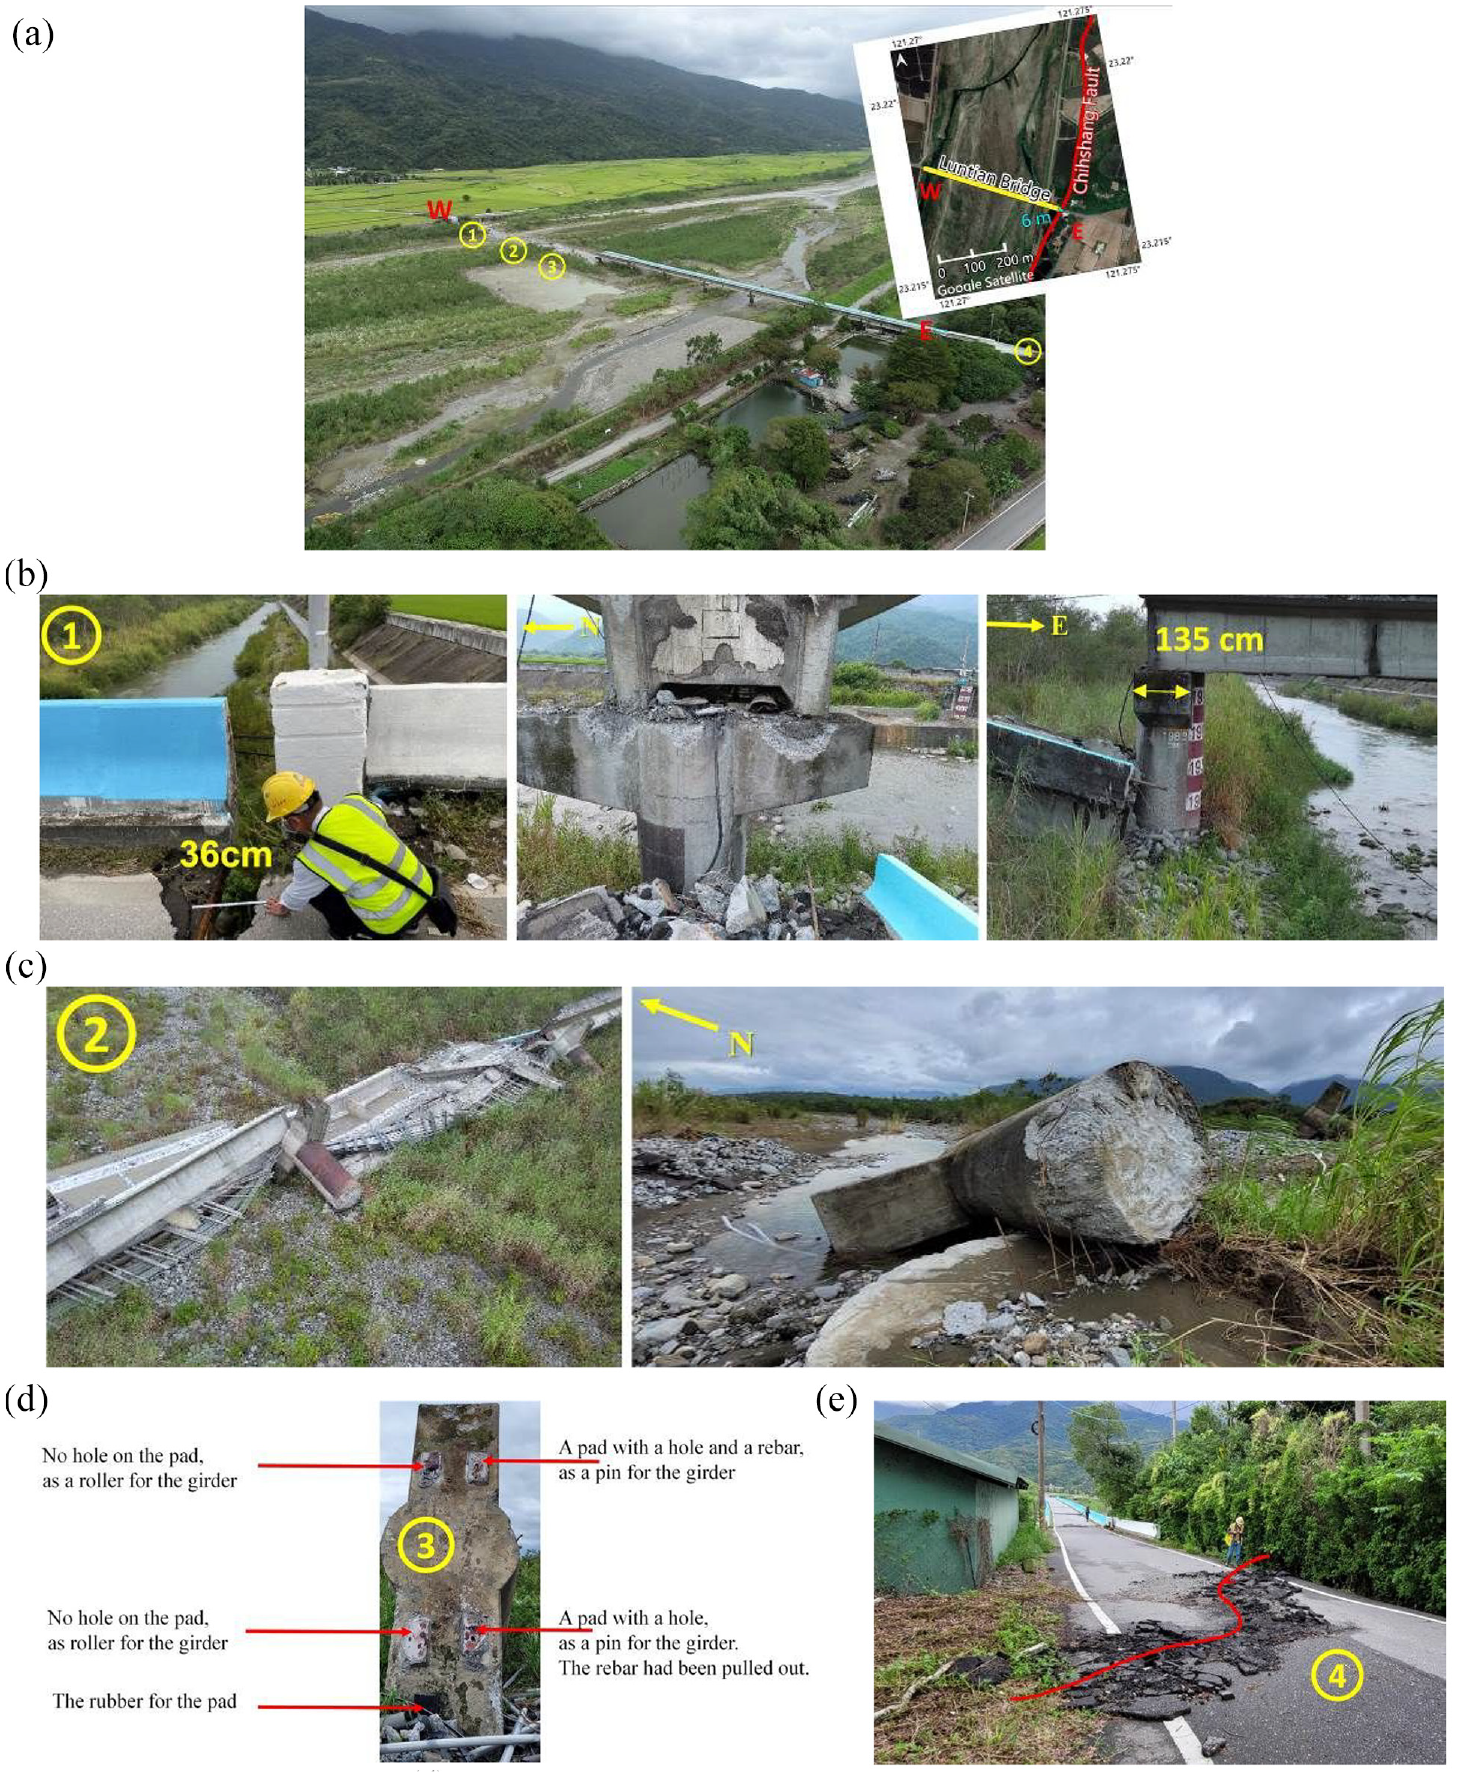
Damage to Luntian Bridge at site No. 2 in Table 1. (a) Bird’s view of whole bridge, (b) first span in the west dislodged longitudinally from the abutment and fallen second span, (c) columns of the west part of the bridge having toppled down and found with sparse longitudinal reinforcement and 45 cm stirrup spacing, (d) bearing structure on the cap-beam, and (e) surface rupture near the bridge east end.
The SA demand of the Luntian Bridge can be estimated based on a single-degree-of-freedom system composed of a lumped-mass cantilever model. The weight of the superstructure was estimated as 132,688 kg per span, and the flexural stiffness of the column was estimated as 30,136,999 N/m (1.35 m in diameter, 5.5 m in height, and 187 kgf/cm2 for the compressive strength of the taken-core concrete). The fundamental period for the Luntian Bridge was calculated to be 0.42 s in the transverse direction of the bridge, assuming the rigidity reduction factor of 0.5 for the column. According to Figure 9b, it is found that the Luntian Bridge suffered a seismic force in the Chihshang earthquake larger than those specified in the 1997 and 2022 versions.
As shown in Figure 19b and c, 7 spans on the western end fell because the columns there toppled in a northern direction, parallel to the Chihshang fault movement as the ground surface ruptured at the east end. All the longitudinal reinforcements ruptured at the interface between the column base and caisson. The column longitudinal reinforcement consisted of #7 rebar sparsely arranged around the perimeter of the column with a stirrup spacing of 45 cm, indicating the absence of confinement at the base. Based on the collapsed column, as shown in Figure 19d, the support-bearing structure between the girders and the columns indicates a pin-roller superstructure system. The right-hand support seat was equipped with holes, rubber cushions, and steel bars, which provided a pin end; the left support seat had no holes or steel bars, which provided a roller end. The reinforcement pull-out failure at the pin end suggests that a large degree of relative movement between the superstructure and the column occurred during the Chihshang earthquake with approximately 34 cm of residual deformation. A surface rupture, which corresponds to the trace of the Chihshang fault, also passed through the east end of the bridge (Figure 19e), although the damage was minor.
Xinxiu Guluanxi Railway Bridge
The Xinxiu Guluanxi Railway Bridge (damage site of No. 3) next to the Dong-Li Railway Station was completed in 2007 with a total length of 580 m. The bridge consists of pre-stressed concrete girders and single-column piers (Figure 20). No column failure was found because the bridge was constructed along the N-S direction parallel to the Chihshang fault movement, in contrast to the previous bridges that lie transverse to the fault direction. The nearby strong-motion station FULB observed the maximum acceleration response spectrum of the N-S component for the Chihshang earthquake of approximately 2.4 g at periods between 0.3 and 0.5 s (Figure 9c). After the earthquake, the power-line columns collided with the girders and broke at the base, causing the beam end damage (Figure 20b). One pre-stressed girder slipped off from the bearing seat, and expansion joint failure occurred with a gap and height difference between both sides (Figure 20c). The maximum lateral dislocation between two adjacent decks was about 56 cm (Figure 20d). The permanent ground displacement recorded at a nearby GNSS station was about 70 cm toward the south (CGS, 2022).
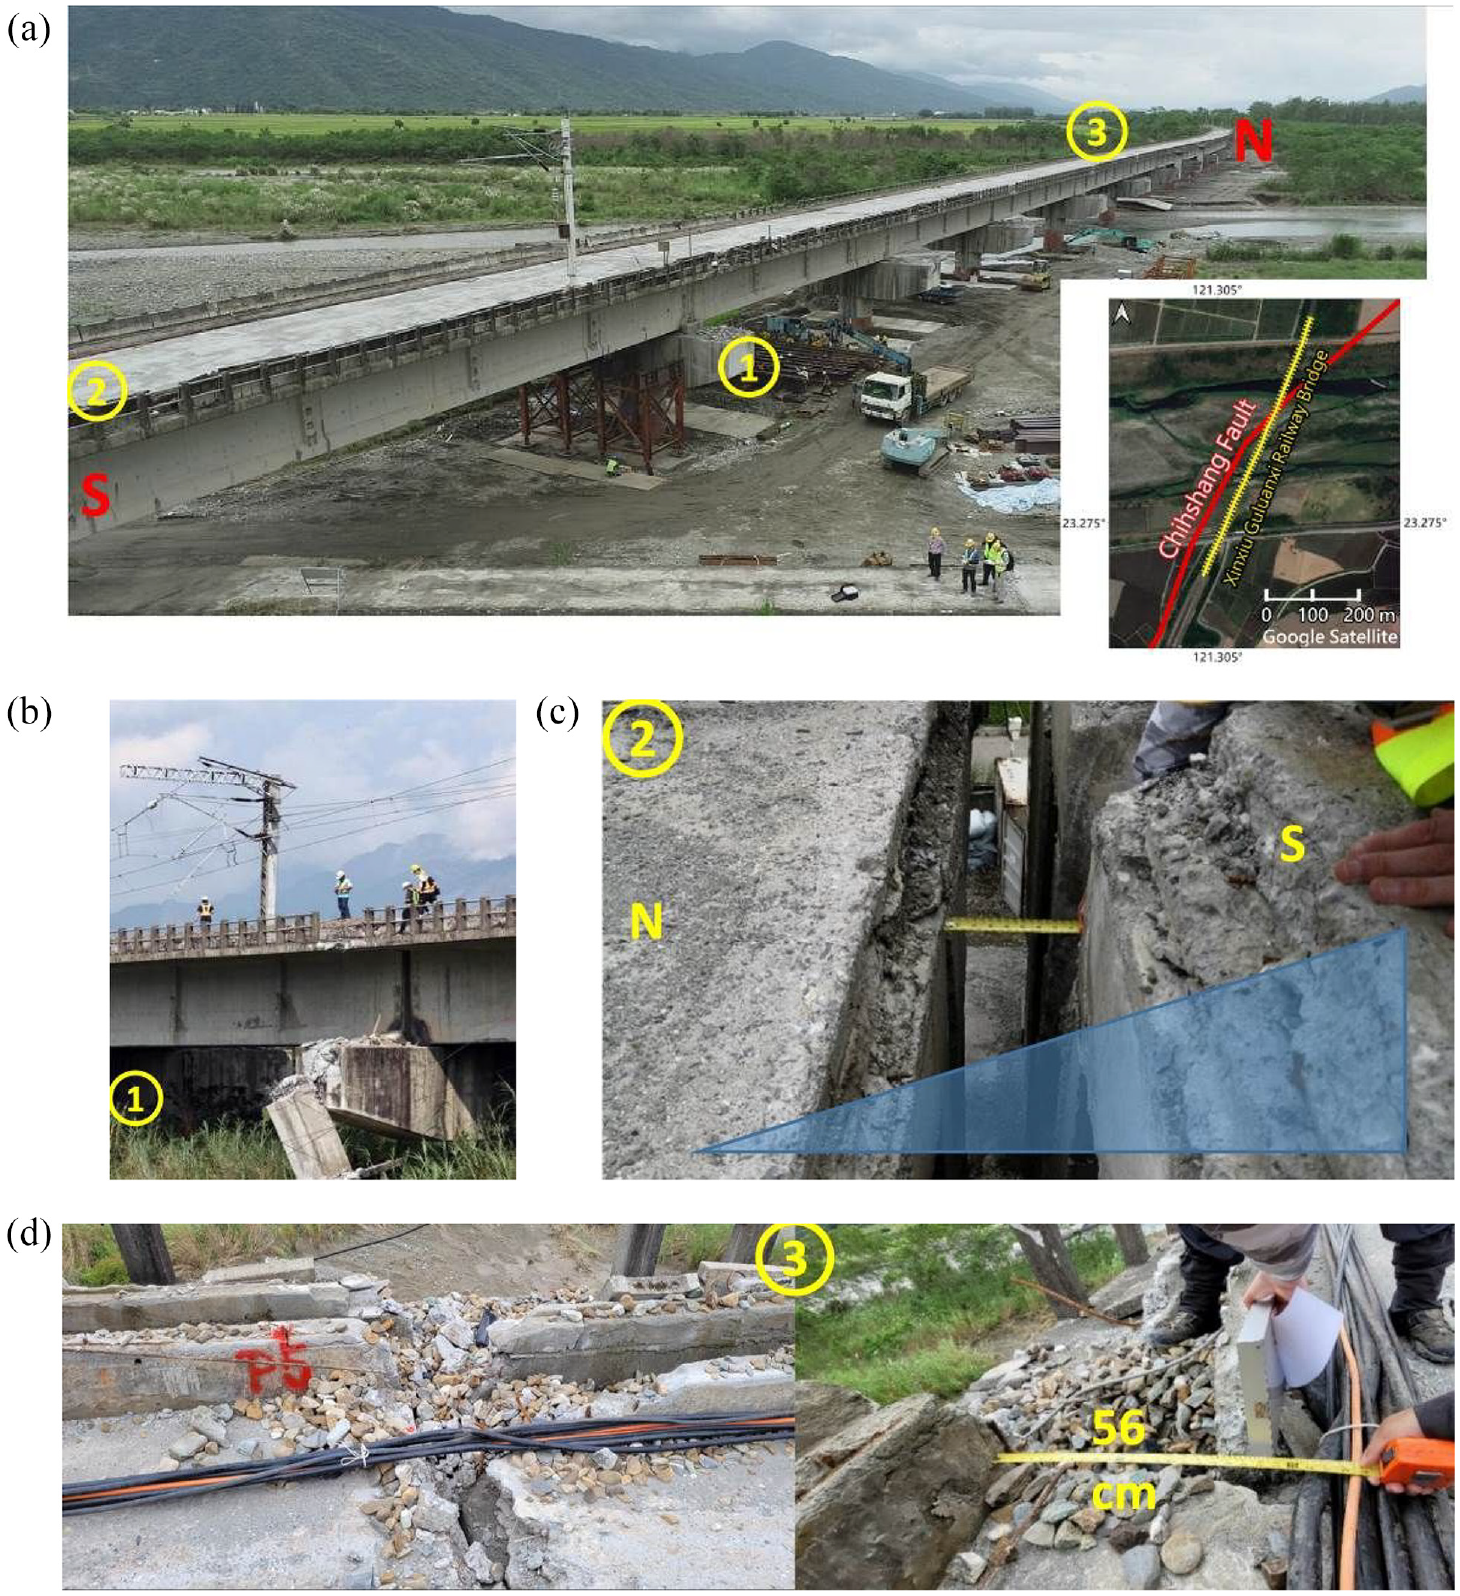
Damage to Xinxiu Guluanxi Railway Bridge at site No. 3 in Table 1. (a) Bird’s view of bridge with steel support and oil jacks to adjust the girders’ position, (b) falling of the power-line columns due to collision with the girders, (c) expansion joint failure in the gap and height difference between both sides and the pre-stressed girders have slipped off from the bearing seats, and (d) 56 cm lateral dislocation of the cable tray on top of pier 5.
Yuli Bridges
The Yuli highway bridge (damage site of No. 4) and the old Yuli railway bridge are located 200 m apart and across the Chihshang fault, as shown in Figure 21. The northbound and southbound parts of the Yuli highway bridge were completed in 1977 and 1994, respectively. The bridge was 575 m long and the columns had been reinforced with steel jacketing at the base before the two earthquakes occurred (Figure 21e). The nearby strong-motion station HWA073 observed the maximum acceleration response spectrum in the N-S component of the Chihshang earthquake of 2.0 g at periods between 0.3 and 0.5 s (Figure 9d). The seismic force exceeded the 1997 design value, particularly for the periods between 0 and 0.7 s. In addition, the permanent ground displacement recorded at a GNSS station near the west side of the highway bridge is roughly 70 cm toward the south, and that near the east side is 50 cm toward the northwest. The E-W component of the ground movement caused extrusion damage to the bridge pavement and buckling of the steel pipeline (Figure 21b and d). The girders dislocated in the E-W direction, and the shock-absorbing block was broken due to the lateral pounding from the girders (Figure 21c). Similar damage was found on the old Yuli Railway Bridge (Figure 21f).
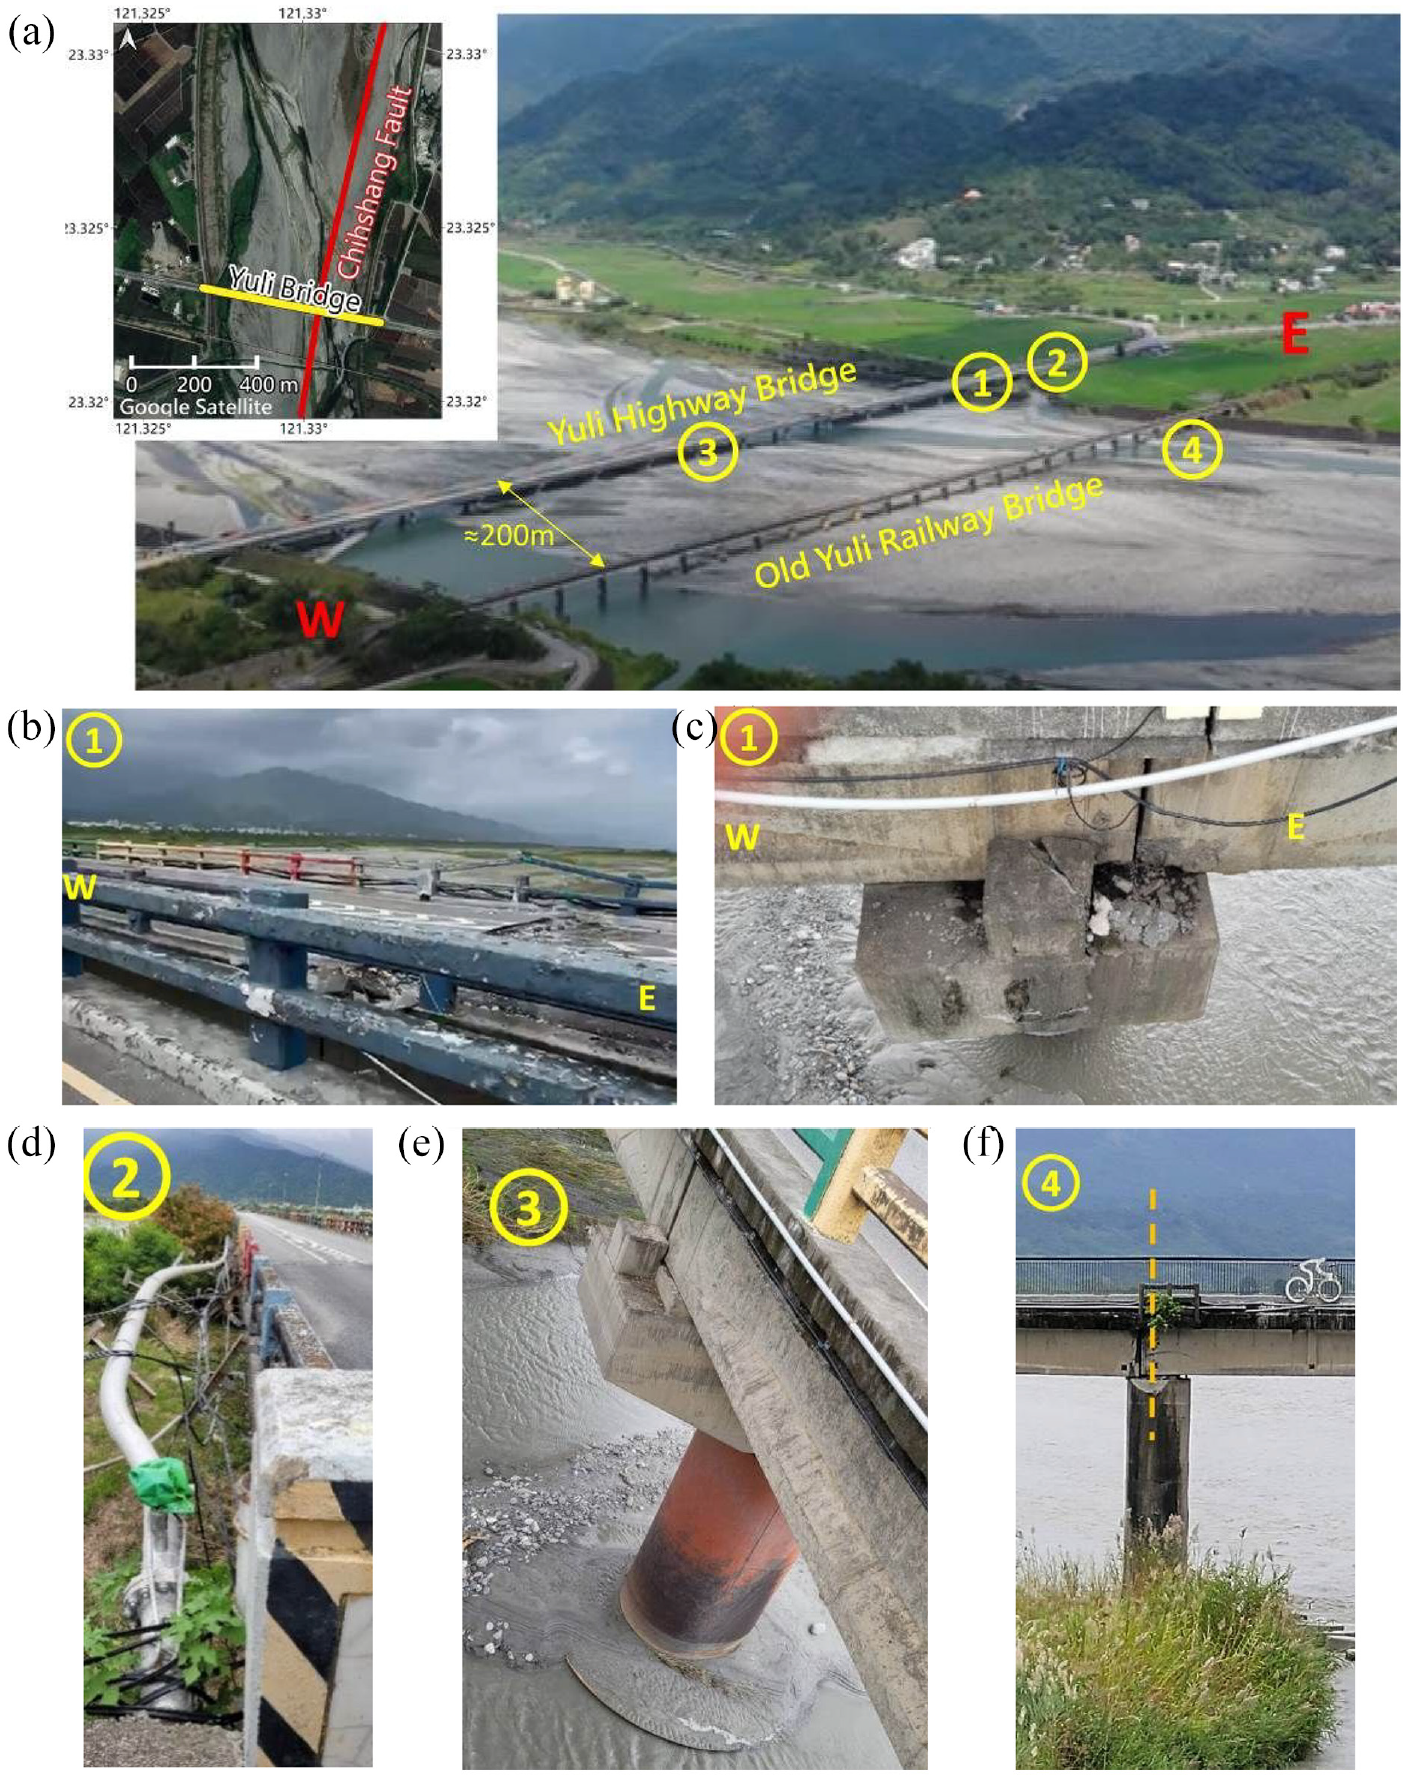
Damage to Yuli Bridge at site No. 4 in Table 1. (a) Bird’s view of whole bridge, (b) deck extrusion damage, (c) broken shock-absorber block restricted the lateral movement of the girders, and the right-hand-side girder nearly dropped into the river, (d) buckling of the attached steel pipeline, (e) jacketing column retrofitted before the earthquake, and (f) similar damage to the old Yuli Railway Bridge, including longitudinal movement and broken shock-absorber.
Gaoliao Bridge
The 880-m long Gaoliao Bridge (damage site of No. 6), completed in 1991, was a pre-stressed girder and single-column bent bridge. The bridge’s east end was 95 m from the Chihshang fault, and its west end was 509 m from the Yuli fault (Figure 22). The nearest stations, EYUL and HWA054, observed long-period velocity pulses of 73 and 124 cm/s during the Chihshang earthquake (Figure 7b). The permanent ground displacement recorded at a GNSS station near the east side of the bridge is roughly 68 cm toward the northwest, and that near the west side of the bridge is roughly 70 cm toward the south (CGS, 2022).
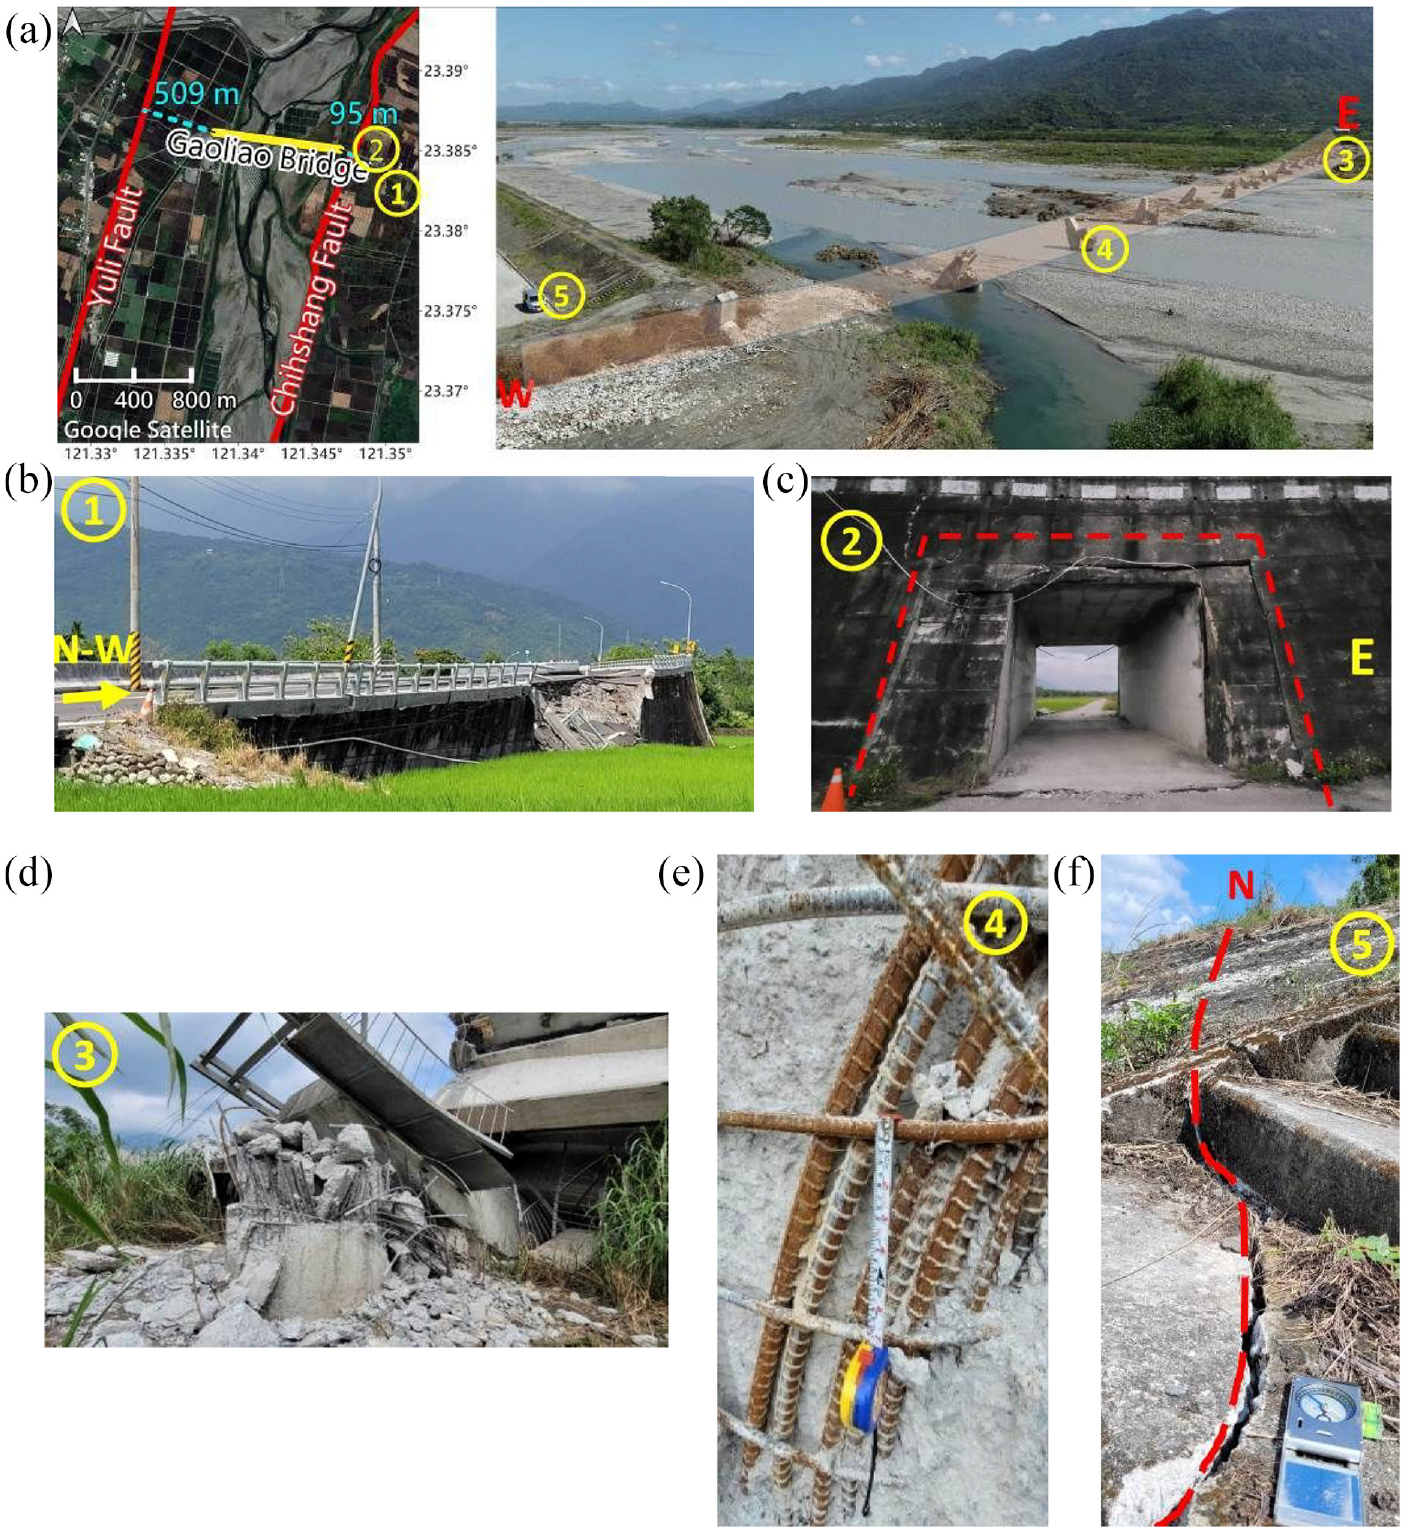
Damages to Gaoliao Bridge at site No. 6 in Table 1. (a) Bird’s view of the collapsed bridge after partial cleaning, (b) road subsidence after the deformation and falling of the retaining wall, (c) cracks on the ground and the retaining wall, (d) shear failure of the columns that toppled down toward the north: the column stirrup spacing was 35 cm without hooks and the breakpoints between the longitudinal reinforcements were on the same plane, (e) large slippage of the rebar indicating poor concrete bonding, and (f) surface rupture on the flood embankment.
The bridge collapsed and had major damage to the east approach. Failure included cracks on the ground surface of the west embankment and the east retaining wall (Figure 22b, c, and f). Columns located from the river bed to the east side experienced shear failure with the top damaged column toppling to the north. The column on the west side failed at the base-to-embankment junction and also rotated to the north. The stirrup spacing of the failed columns was 35 cm on the east end (Figure 22d) and 20 cm in the middle of the bridge span (Figure 22e) without stirrup hooking into the core concrete. Based on the shear-damaged column in Figure 22b, all longitudinal reinforcements were found overlapped at the same height location and either ruptured or pulled out in the earthquake. The absence of the longitudinal reinforcement slippage relative to the surrounding concrete indicated poor bonding between the concrete and reinforcement (Figure 22d and e).
Geotechnical damage
As shown in Figure 23 for the geotechnical survey during the reconnaissance of the Guanshan and Chihshang earthquakes, soil liquefaction was not observed except for a minor event in Fuli, Hualien, which is at location A, near the Luntian Bridge (damage site of No. 2 in Table 1 and Figure 4). The liquefaction location is near the Fuli Floral Seas (Figure 24). By uncovering soil around vegetation, the upper layer might be the product of soil liquefaction. Based on the preliminary map of liquefaction susceptibility in Taitung, issued by CGS in 2019, only the mouth of the Pinan River has a relatively high sediment concentration, resulting in a moderate susceptibility to soil liquefaction, which explains very few discoveries of the soil liquefaction phenomenon throughout this reconnaissance survey.
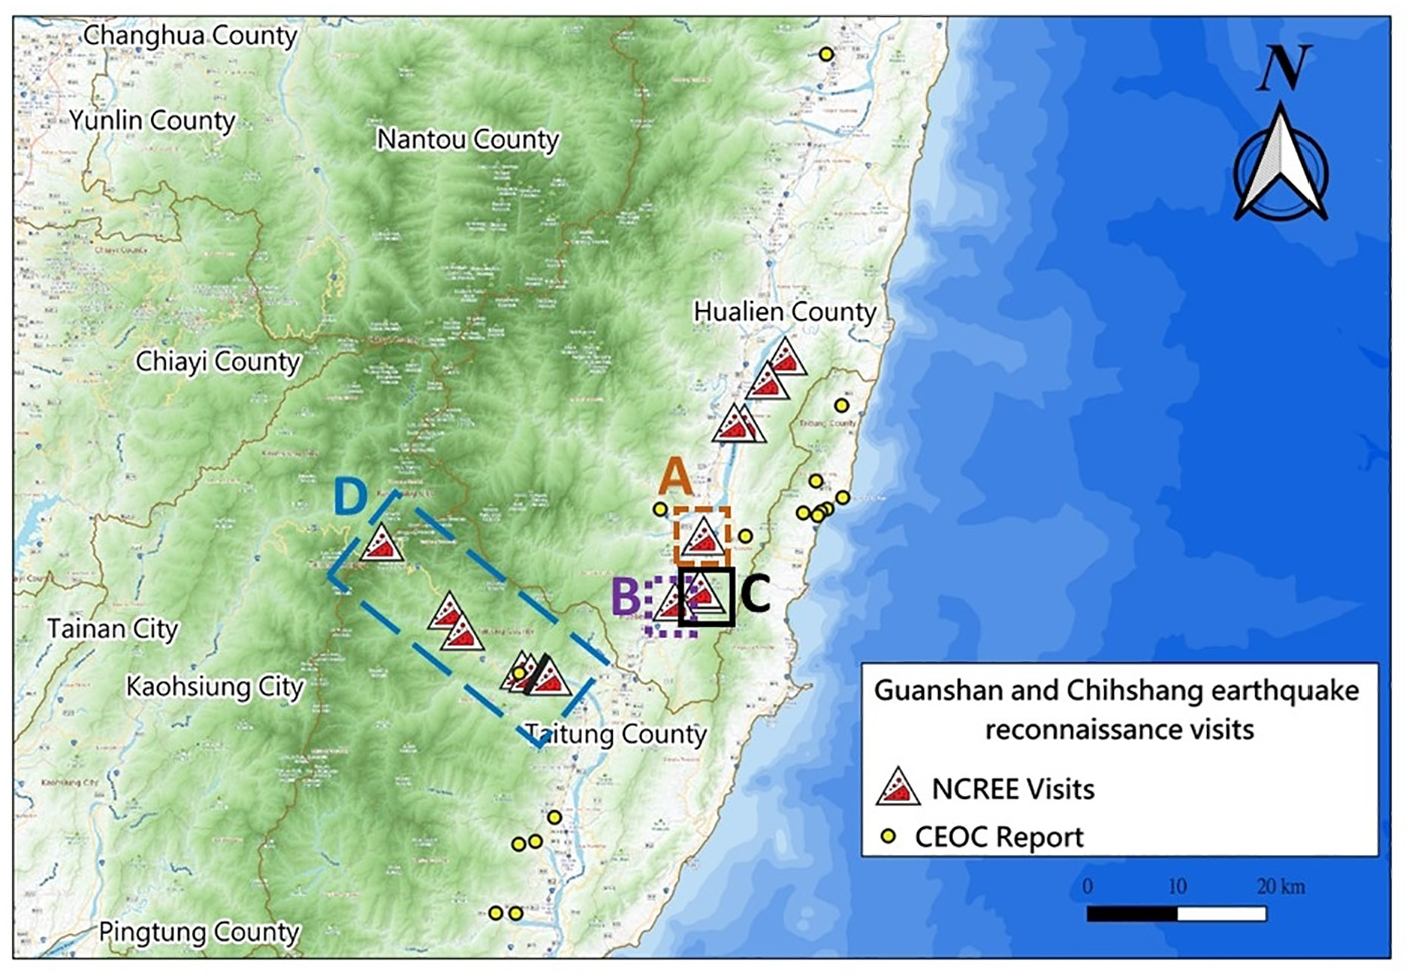
Geotechnical survey locations.
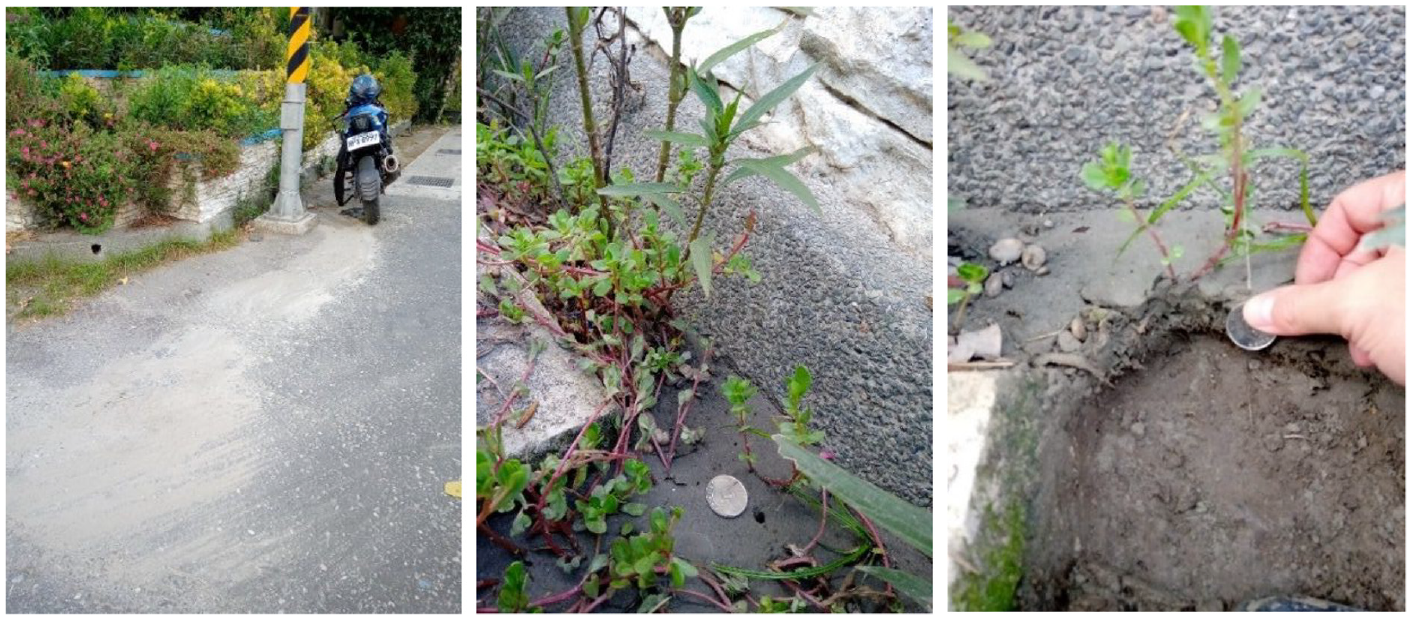
Potential soil liquefaction near the tourist attraction, Fuli Floral Seas.
The damage to the railway system has led to service disruption between Hualien and Taitung. Figure 20 shows the damage of the Xinxiu Guluanxi Railway Bridge (damage site of No. 3 in Table 1) near the Dong-Li Railway Station. The deformed rail tracks and uneven rail roadbed (Figure 25) were observed at the Dong-Li Railway Station (location B in Figure 23). Since the section of the railway roadbed has no lateral constraint on the two sides, the track ballast may move laterally in earthquake motion.
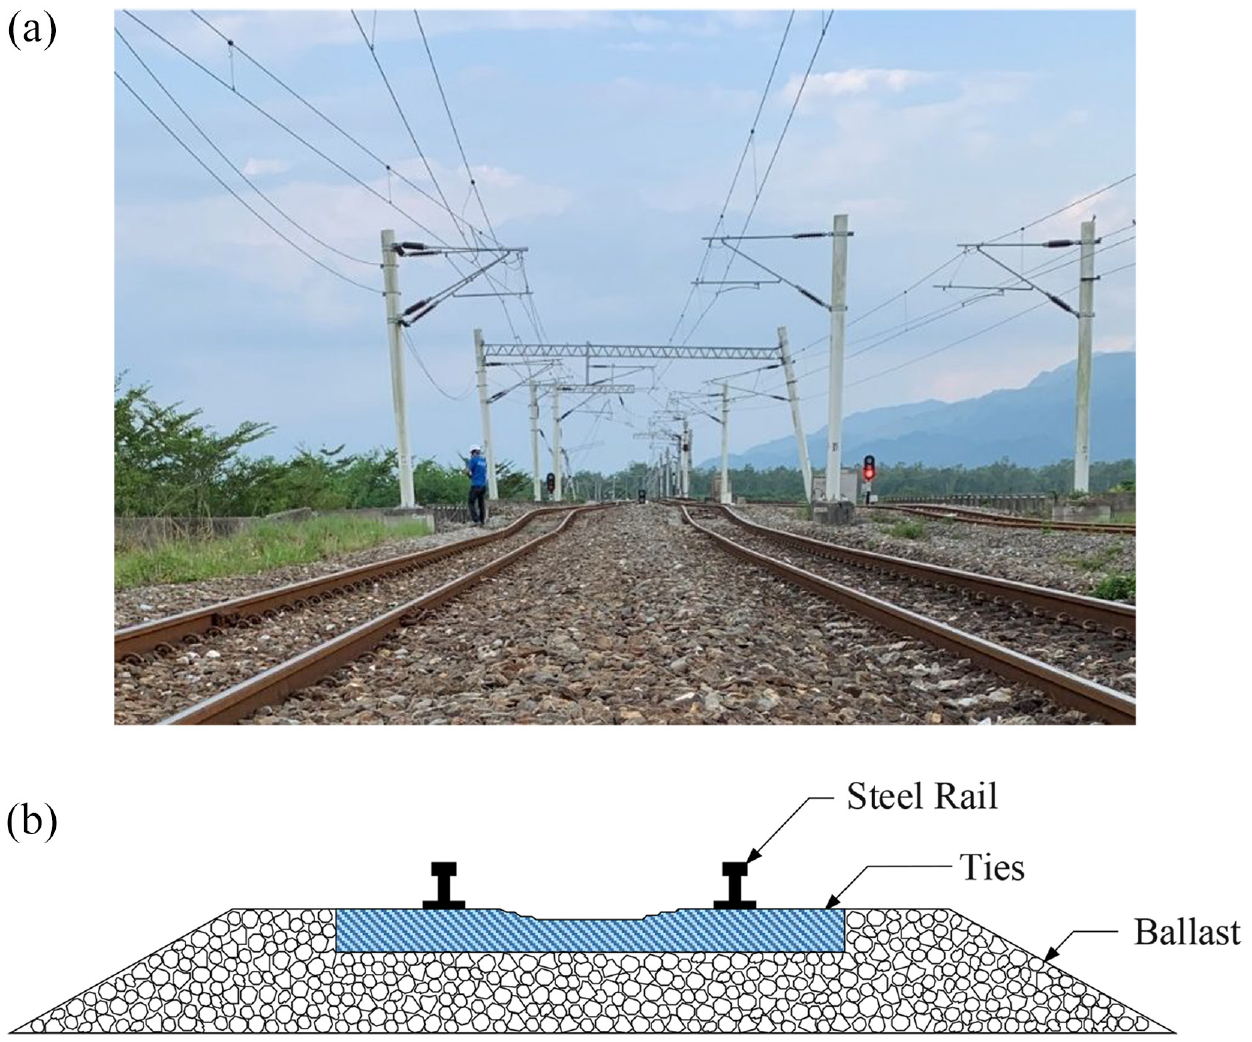
Uneven rail roadbed at Dong-Li Railway Station.
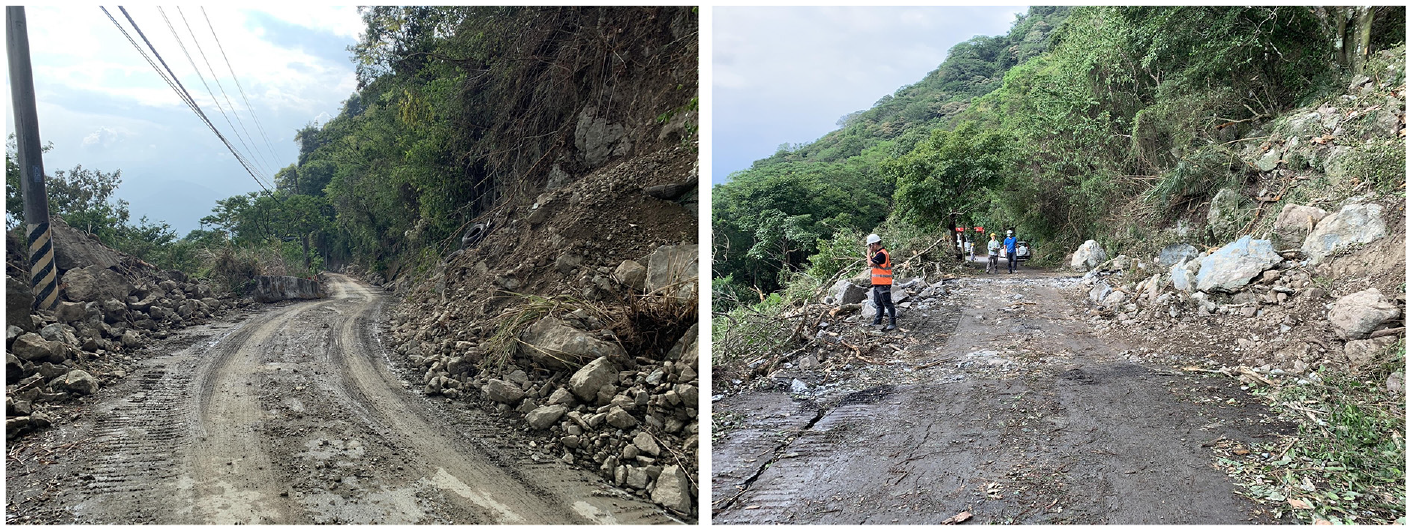
The landslides and rock falls were observed at the Liushishi Mountain in Hualien (zone C in Figure 23) and the Southern Cross-Island Highway in Taitung (zone D in Figure 23). The Liushishi Mountain has its geography categorized as the Tuluanshan Formation, and its lithology classification is mainly the lava, volcanic breccias, and pyroclastic rock. With such lithological properties, its potential damage is primary rock fall and debris slide. There was no damage reported at Liushishi Mountain after the Guanshan earthquake. However, rock falls occurred at multiple locations, causing road closure for several days after the Chihshang earthquake (Figure 26). Figure 27 shows the damage condition at the Southern Cross-Island Highway. Based on the lithological classification, the slope failure on the Southern Cross-Island Highway could be categorized as a rock formation fall and river terrace landslide.
Damage condition at Liushishi Mountain.
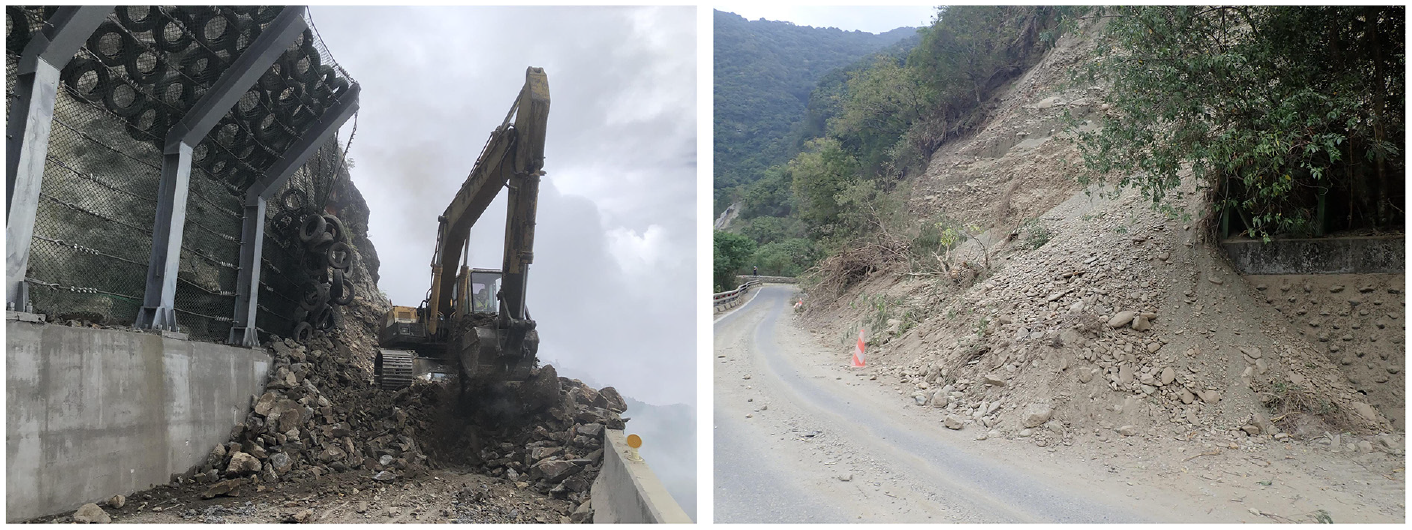
Damage condition of the Southern Cross-Island Highway.
Structural monitoring and analyses
Figure 28 shows the spatial distribution of monitored building structures. The acceleration data from approximately 20 buildings were transferred to the NCREE immediately after the Guanshan and Chihshang earthquakes. The vibrational data of 10 buildings (Table 3) collected from these two earthquakes were analyzed with regard to building performance.
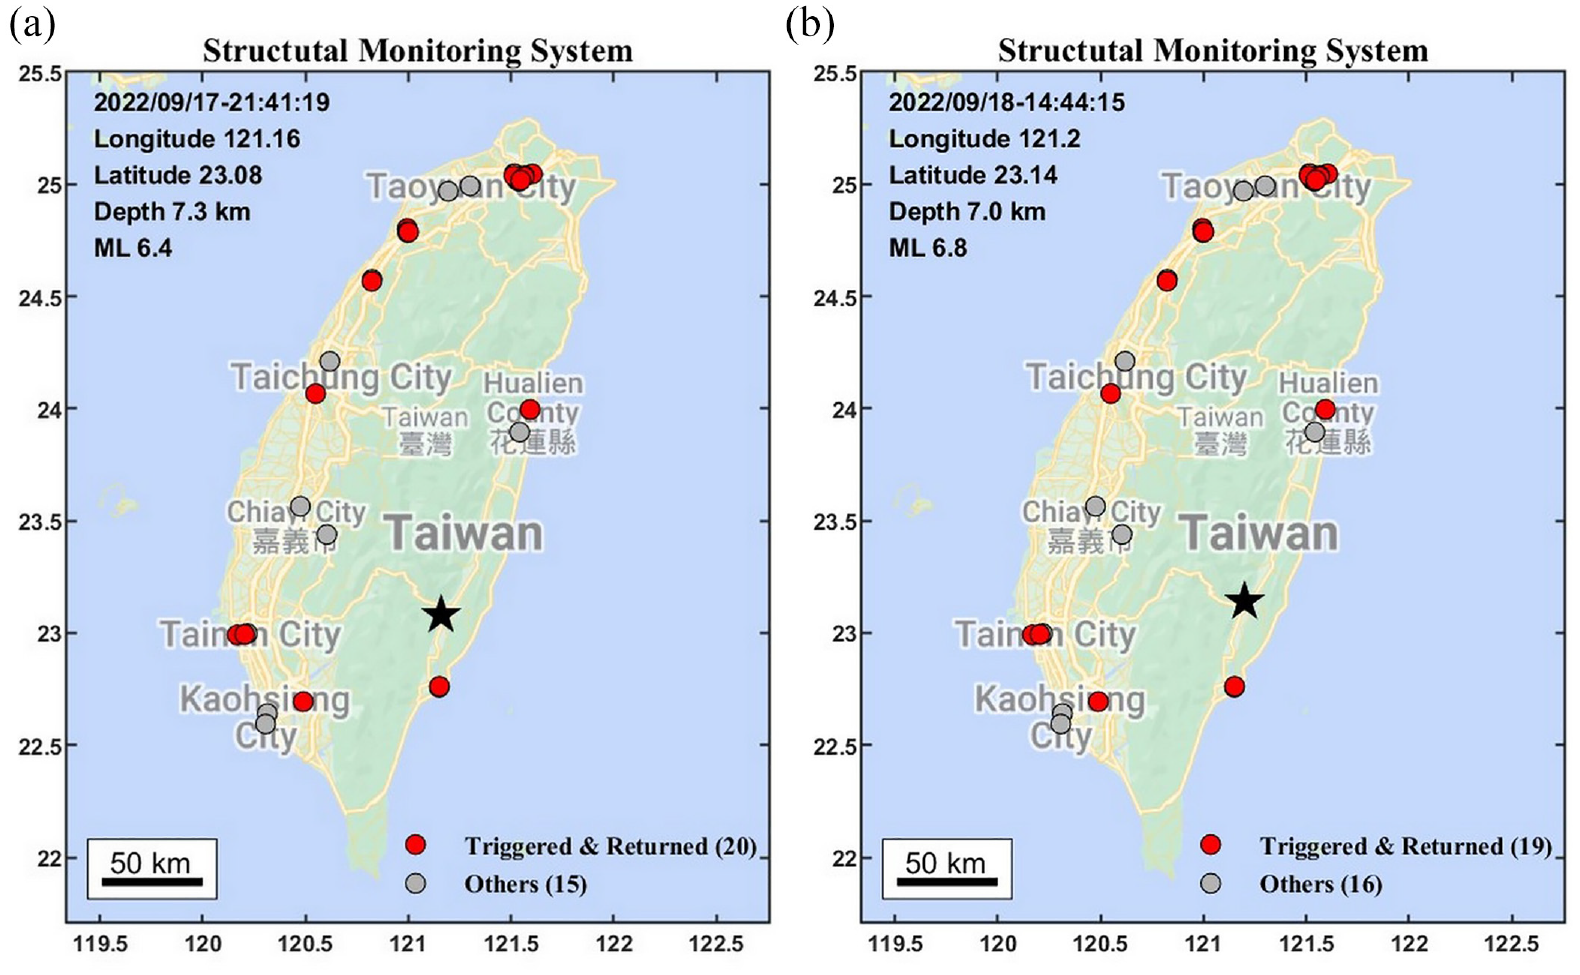
Spatial distribution of the structures with installed structural monitoring systems and the data transfer condition during the (a) Guanshan and (b) Chihshang earthquakes.
Abbreviation for the buildings with structural monitoring systems
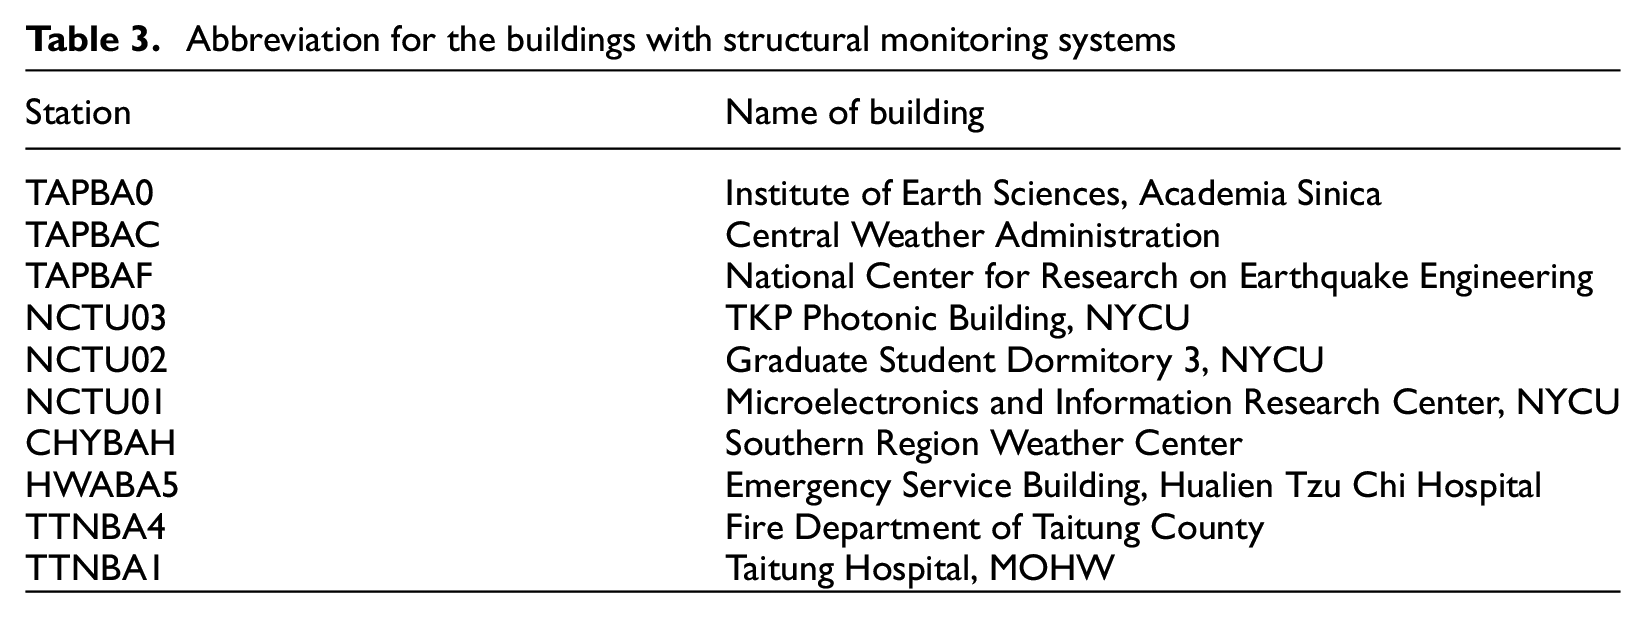
Figure 29 shows the observed peak basement accelerations (PBAs) based on the basement-located instruments and the observed peak accelerations (PAs) calculated based on all instruments for each structure during the Guanshan and Chihshang earthquakes. The largest observed PBA was approximately 0.1 g recorded by TTNBA4 in Taitung, and the largest PA was approximately 0.25 g, recorded at the same building. Figure 30 shows the estimated maximum inter-story drift angle for each building, which were estimated directly from the acceleration measurements through the baseline correction technique (Trifunac, 1976) using a Butterworth high-pass filter with a 0.1-Hz cut-off frequency. The largest estimated maximum inter-story drift ratio was around 0.3% recorded at TTNBA4 in Taitung. Figure 31 shows the estimated fundamental periods and the difference with the estimated fundamental periods for each structure. A widely used subspace identification technique for the long-term monitoring of structures (Loh et al., 2015) was used to compute the fundamental period by using the end-part waveform of the ground motion induced by the earthquakes to capture the modal properties of structural-free vibration. The stiffness variation ratio (SVR) from the identified fundamental periods of two earthquakes for each building is calculated as:

where T9/17 and T9/18 are, respectively, the identified fundamental periods for the Guanshan and Chihshang earthquakes for each building. The estimated SVRs for each building are all less than 8%, as shown in Figure 31. Based on the analysis result of the available acceleration data, no obvious damage should have been observed in the 10 buildings immediately after the Guanshan and Chihshang earthquakes, which is consistent with the observation of these 10 buildings after the events.
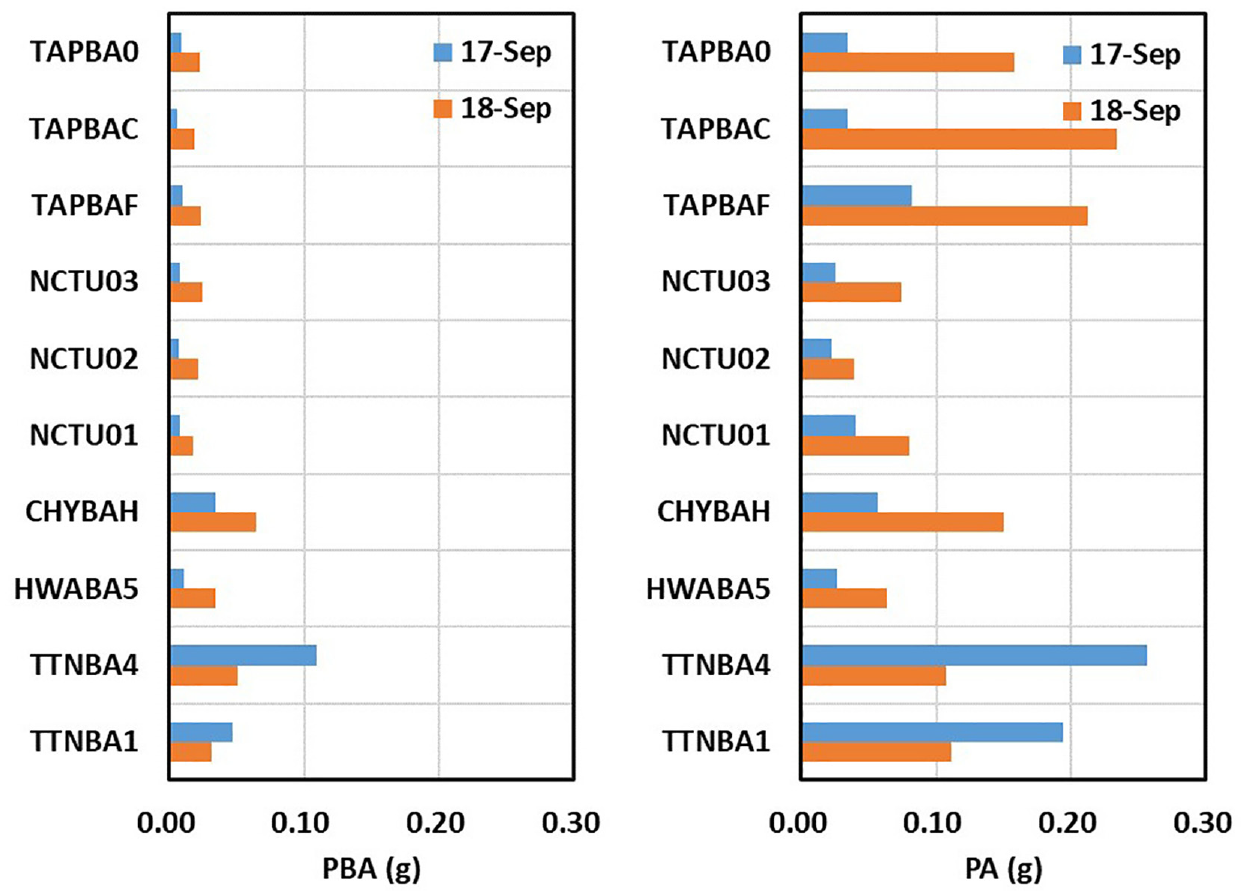
Observed peak acceleration calculated from the basement-located instruments and observed peak acceleration calculated from all instruments for each building with a monitoring system caused by the Guanshan and Chihshang earthquakes.
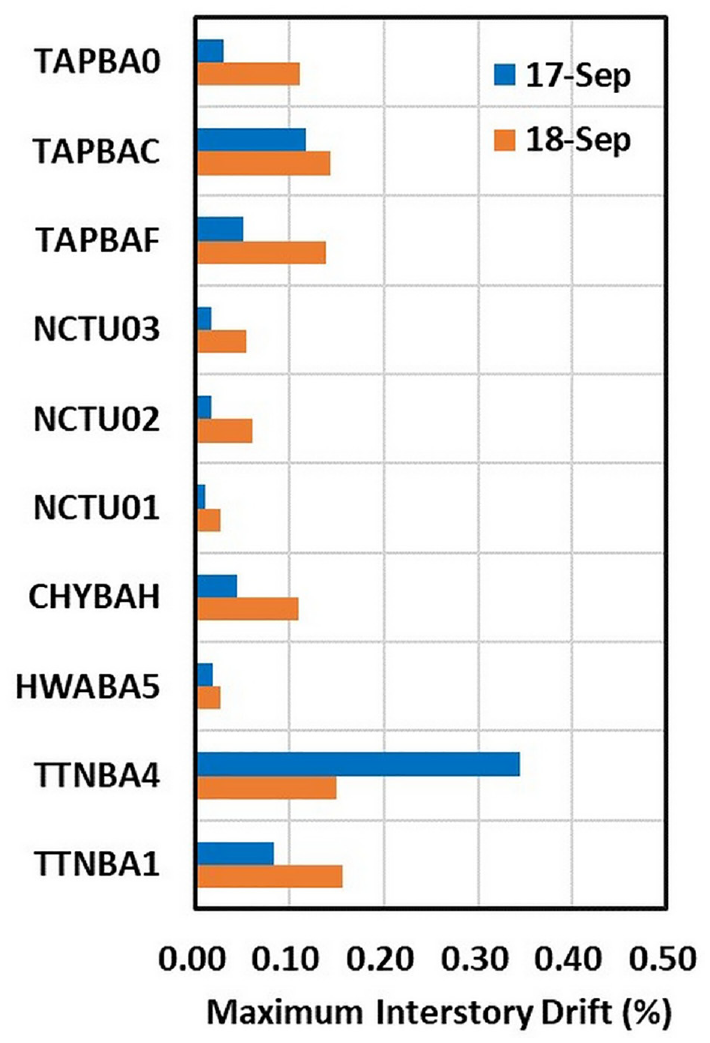
Estimated maximum inter-story drift ratio for each building with a monitoring system caused by the Guanshan and Chihshang earthquakes.
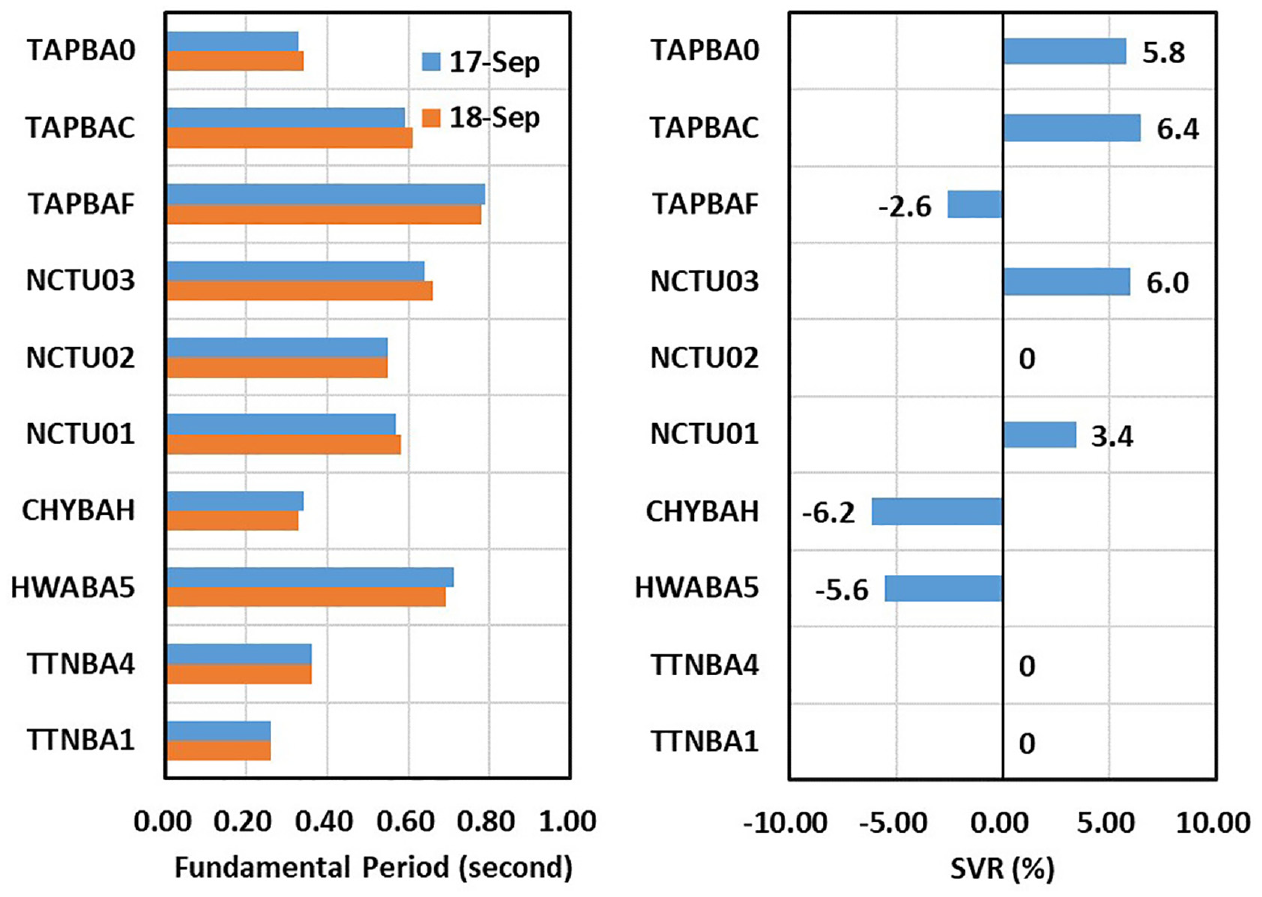
Estimated fundamental period and the difference with the estimated fundamental period for each structure with a monitoring system caused by the Guanshan and Chihshang earthquakes.
Conclusions
The strong motion of the Guanshan and Chihshang earthquakes caused a series of surface ruptures, one fatality, 171 injuries, 2 collapsed buildings and two collapsed bridges, and more than 100 partially damaged buildings and bridges along the N-S Chihshang and Yuli faults in eastern Taiwan. The ground motion intensities of the Guanshan earthquake were relatively higher to the south of the epicenter, whereas those of the Chihshang earthquake were relatively higher to the north (Figures 4 and 5). It is generally recognized that the seismogenic fault of the earthquake sequence was the westward-dipping Central Range structure and the most severe damage, including the collapsed buildings and bridges, was located within the regions with the largest PGV and SA1.0 along the Chihshang and Yuli faults. Furthermore, the large PGVs were caused by the near-fault velocity pulses observed by several stations close to the damage sites. The HWA054 station, 34.1 km north of the epicenter of the Chihshang earthquake, observed the maximum PGV of 131 cm/s with a SA1.0 of 0.66 g (Figures 5 and 7), and the significant fault directivity led the PGV to suddenly reduce to 39 cm/s, which was observed 10 km south from the epicenter. However, the large ground velocity pulses along the northern faults, identified by the collected ground motion data at stations EYUL, FULB, HWA037, and HWA054, were not considered in the seismic design of the existing buildings and bridges.
The 2 collapsed buildings, respectively near the surface traces of the Yuli and Chihshang faults, were both three-story frames with a soft-weak first story. The mixed-use building underwent “knee-down” failure as a result of its small width-to-height ratio in the collapse direction (Figure 11); the monastery building experienced “sit-down” failure as a result of its large width-to-height ratio with an insufficient gravity load bearing and shear capacities in the first-story columns (Figure 12). A corridor attaching adjacent school buildings collapsed due to column failure in shear together with flexure at the column base. The maximum SAs of the observed strong motions near the sites were 1.7 to 2.5 times the design response spectra of the 2022 Taiwan building code at short to medium periods, also significantly higher than those of the 1997 building code (Figure 9). The large SAs at short periods caused the shear failure of the weak first-story columns in low-rise buildings that had little shear reinforcement, particularly when the ground motion intensities in both horizontal directions were similar observed near the fault area. Many partially damaged residential buildings in Song-Pu and Wan-Li Townships showed ground cracks, cracked walls, and column failures. It was also found that the first-story columns could stand even after experiencing the shear failure if the first-story masonry wall continued to partially support the building weight (Figure 12).
Most of the damaged bridges were in an E-W direction and located near or across the Chihshang or Yuli faults (Figure 17). As observed in the damaged buildings, the strong motion, containing strong near-fault velocity pulses, suggested that the seismic force exceeded the design value, particularly for structures with a natural vibration period between 0 and 1.2 s. The Baohua Bridge had been retrofitted with a deck-falling-prevention steel bracket as shown in Figure 18 so its superstructure did not fail during the earthquakes with a ground permanent displacement of 20 to 25 cm. However, the unseating-prevention length of the superstructures of the Luntian and Gaoliao bridges (Figures 19 and 22) was inadequate when subjected to the large ground displacements of 68 to 97 cm observed at nearby GNSS stations. All damaged columns tilted or failed to the north direction, parallel to the Chihshang fault movement from the south to north. It was also found that the collapsed bridge columns that experienced shear failure lacked modern seismic detailing (i.e. no seismic hooks, large stirrup spacing, lap splice at the same elevation of all longitudinal rebars, and no shock absorbers at the cap beam). It also verifies that the column jacketing for Yuli Bridge did enhance the seismic performance of non-ductile bridge piers. Both the retrofitted Baohua Bridge and Yuli Bridge survived in the two strong earthquakes with minor damage. A similar retrofit technique has also been found to improve the performance of non-ductile bridge piers in the 1994 Northridge earthquake (Sheng, 1995).
Building or bridge design near the active faults should consider not only the ground acceleration but also the ground velocity and displacement. An unseating-prevention device and retrofitted jacketing columns can prevent a superstructure from falling, as evidenced by the Baohua and Yuli bridges, respectively. To improve bridge performance near the active faults, a steel bridge girder system could be applied to the superstructure to reduce the weight. A two-column bent substructure could also be used to increase bridge ductility and stiffness compared to a single-column bent bridge system.
Footnotes
Acknowledgements
The authors sincerely appreciate the assistance of the Central Weather Administration in providing the high-quality ground motion records for Taiwan. They also gratefully acknowledge the data and references obtained from the Central Geology Survey, the Central Emergency Operation Center, the Institute of Earth Sciences, Academia Sinica, and the Taiwan Earthquake Research Center. Special thanks are also given to all NCREE colleagues whose combined efforts helped conduct the post-earthquake emergency response and on-site reconnaissance.
Declaration of conflicting interests
The author(s) declared no potential conflicts of interest with respect to the research, authorship, and/or publication of this article.
Funding
The author(s) received no financial support for the research, authorship, and/or publication of this article.