
Abstract
The impact of destructive earthquakes might exceed the local capacity to cope with disasters and lead to an increase in the reconstruction costs. This phenomenon is commonly termed as post-loss amplification, and its main causes include the increase in the cost of construction materials and labor due to the sudden demand, the need to reconstruct following higher standards, or other unexpected costs. We reviewed 70 past earthquakes to identify events where post-loss amplification was observed, and collected a set of seismogenic, socio-economic, geographical, and impact variables for those events. Using this database, we developed two models to predict post-loss amplification, using a composite indicator that reflects the level of destruction in the region, or a parameter that characterizes the frequency of the event. This study indicates increased costs (>10%) for events where the economic losses exceed 1% of the regional gross domestic product, or for events with an estimated return period of at least 10 years. These models can be applied directly in the amplification of economic losses in earthquake scenarios or in probabilistic seismic risk assessment.
Introduction
The unaccounted increase in losses due to catastrophic events has led to solvency issues in the insurance and reinsurance sector in the past (e.g. Hurricane Katrina 2005; Northridge Earthquake 1994), as well as to budgeting shortfalls in local and national governments during the reconstruction and recovery stages (Döhrmann et al., 2013; Olsen and Porter, 2011b). This phenomenon known as post-loss amplification (PLA) is common in large disasters and can be defined as the additional or increased cost in the aftermath of the event. PLA can be caused by a number of factors including: (1) a temporary increase in the price of materials or labor as a result of the increased demand exceeding the available supply (demand surge); (2) an increase in transportation costs due to limited accessibility to the affected area; (3) an increase in costs due to the need to “build back better” or the requirement to comply with more modern building regulations; (4) inflation in the costs due to large delays in the reconstruction process; (5) administrative costs related to the use of international funding; and (6) other expenses related to activities such as demolition, debris removal, and site cleaning (General Insurance Practice Committee, 2015; Olsen and Porter, 2010).
After the 1994 M6.7 Northridge earthquake, a 20% PLA was observed, mostly related to the lack of labor in the region and thus the need to bring workers from elsewhere. This added cost combined with issues in handling insurance claims almost led to the bankruptcy of the twentieth century Insurance Company (Olsen and Porter, 2010). Other well-known examples include the 2008 M7.9 Sichuan and 2011 M6.1 Christchurch earthquakes, reporting PLA values of 30% and 40%, respectively, due to the need to rebuild according to higher code specifications, as well as inflation in the labor force and material costs (Stuart, 2016; Wu et al., 2012). Given the importance of this phenomenon, there is a rising interest in modeling these additional costs to avoid the underestimation of economic losses, and potential solvency issues. In addition, PLA plays a major role in the calibration and validation of existing catastrophe risk models using data from past events (e.g. Lloyds, n.d.). Disregarding this effect might lead to inaccurate comparisons between observed and estimated impacts. In this context, several studies have investigated how PLA should be defined, what should be included, its possible causes, how to measure it, and how to model it (Döhrmann et al., 2013; General Insurance Practice Committee, 2015; Olsen and Porter, 2010, 2011a, 2011b).
Olsen and Porter (2010) developed a remarkable basis on this topic, describing the main definitions that have been used in the insurance, academic, and governmental sectors since 1970. These authors also provided information on historical events where demand surge was reported (including five earthquakes), a description of some of the available models at the time, and an explanation of seven socio-economic scenarios that could result in demand surge. The authors also concluded that at the time there were no public models that could fully explain this phenomenon, partially due to the lack of data to derive empirical formulations. Catastrophe risk modeling companies (e.g. AIR Worldwide Corporation, 2009) have developed PLA models, but their assumptions and formulations are not publicly available and thus cannot be externally used nor validated. Nevertheless, it is well-known that the demand surge component of a catastrophe model modifies the ground-up losses by multiplying them by a factor typically between 1.0 and 1.6 (Olsen and Porter, 2010).
Considering the previous points, and with the objective of providing quantitative data for the calibration and validation of regional loss models, this study aims at (1) identifying the main components to model PLA for earthquakes; (2) developing an open database of historical earthquakes with the reported or estimated PLA; and (3) creating an empirical model to incorporate PLA in earthquake scenarios or probabilistic seismic risk assessment. Additional recommendations are provided for the possible use of the database, as well as for the derivation of additional models. All the data used in this study are publicly available through a GitHub repository (https://github.com/gem/pla).
A PLA database for earthquake loss assessment
Data collection and quality control
In this section, we describe the process followed to create the PLA database, along with the associated assumptions and variables. As previously mentioned, PLA includes additional costs that may occur after a disaster. It is important to mention that this value may vary depending on the use of the data. For example, for the insurance sector, PLA will include only the increase in the loss from the moment after the event until the moment when the last claim has been handled. On the contrary, for a government or local authority, it should include any increase from the moment the event occurs, until the completion of the reconstruction process. Ideally, the best estimate of PLA would be the difference between the officially reported losses after the occurrence of the event, and the officially reported expenditure when the last claim is handled or once the reconstruction process is completed. For this database, we considered the latter case due to data availability, but note that the parameters in the database can be adjusted to the former case with some additional data.
Information describing PLA is extremely rare and uncertain, partially due to the difficulty in estimating accurately losses both immediately after the event and after the completion of the reconstruction process. For this reason, proxy data are often explored to estimate the potential increase in the reconstruction costs. For the development of the database, we first investigated whether direct PLA data was available for the event of interest. When this was not available, we searched for estimates of initial versus final losses to calculate the PLA. When neither were available, additional costs before and after the event were consulted. These included increases in labor and construction material costs given the sudden higher demand in the region and increased demand for labor; increases in transportation costs in the cases where materials must be imported from other regions (or when the main access to the disaster zone is damaged and thus longer routes are used); and additional costs when a new building code is enforced. Other costs may also include the costs of cleaning and removal of debris from the construction sites and administrative costs related to claim handling. For each event, we specify how the PLA was estimated and the main source of information. Moreover, recognizing that the quality of the data differs from region to region, we provide a qualitative reliability score for each data point collected ranging from 1 to 5 (with 1 being the most reliable), as described in Table 1.
Description of the categories defined for the assessment of the reliability of the collected PLA
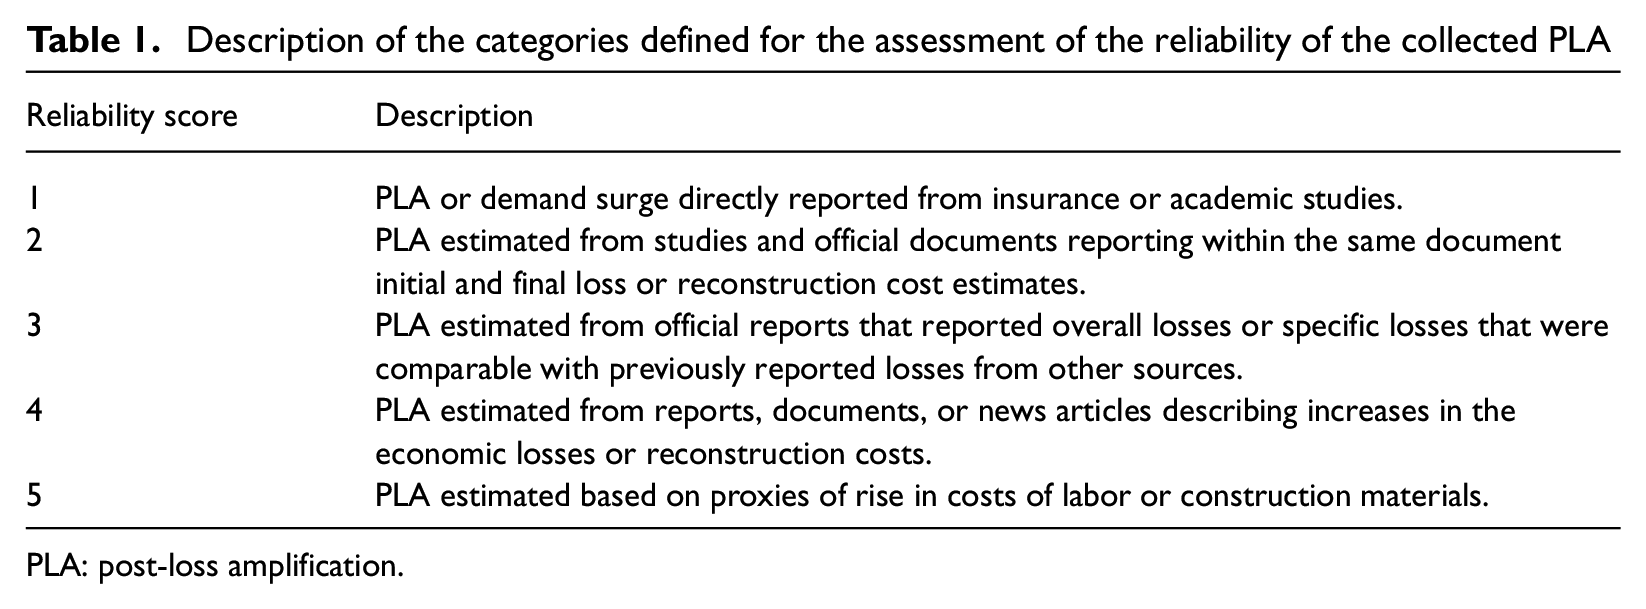
PLA: post-loss amplification.
Considering that PLA is a phenomenon that tends to occur only for large disasters (as the reconstruction costs of localized events can be absorbed by the local economy), we considered earthquakes with minimum nominal losses (at the year of the event) of 100M USD according to the The International Disaster Database EM-DAT (Guha-Sapir et al., n.d.) and the National Oceanic and Atmospheric Administration (National Geophysical Data Center/World Data Service, n.d.) databases. Both databases are open and report losses since 1970. This criterion led to 194 earthquakes of which only 70 had information that could be used to calculate PLA. We reviewed the economic losses reported by each database, and for events with large discrepancies, we collected additional information from local sources (also documented in the PLA database) to establish a more realistic value. For the development of the empirical models, we explored both the loss at the time of the event, and an economic loss considering factors such as inflation and increase in the building stock. The loss at the time of the event was brought to present value following three different procedures: (1) considering the Consumer Price Index (CPI) factor reported by EM-DAT, (2) using a gross domestic product (GDP) Price Power Parity (PPP) index considering the value in the year of the event and 2022, and (3) using the CPI factor and the increase in the built environment taken from the Global Human Settlement Layer (Pesaresi and Politis, 2023). We decided to use the third option to adjust the loss at the time of the event as it allows to account not just for the increase in the costs but also for the additional construction in the region. We note that while the reported loss was adjusted to today’s reality, we did not attempt to modify the reported or estimated PLA, considering how the socio-economic conditions of the region evolved throughout the years. For example, it has been reported for some of the events that some of the causes for the loss amplification included difficulties in transporting materials and hiring workers. Improvements in the transportation infrastructure and the current digitalization of the construction sector are likely to mitigate these issues, at least in the Western world. We investigated different sources of data regarding how the road and railway networks have evolved throughout time, but current databases are temporally and spatially incomplete, and tend to reflect only the current conditions. For these reasons, the adjustment of the PLA for each event was not possible and remains one of the potential future directions for this study.
We consulted official reports, earthquake databases, reports from nongovernmental organizations (NGOs), academic articles, newspaper articles, and other sources of information to populate the database. In each case, additional variables regarding the characteristics of the seismic event and possible factors that may affect the PLA were also collected. Based on previous literature (Olsen and Porter, 2010), we collected or estimated the list of parameters described in Table 2.
Variables of the earthquake PLA database
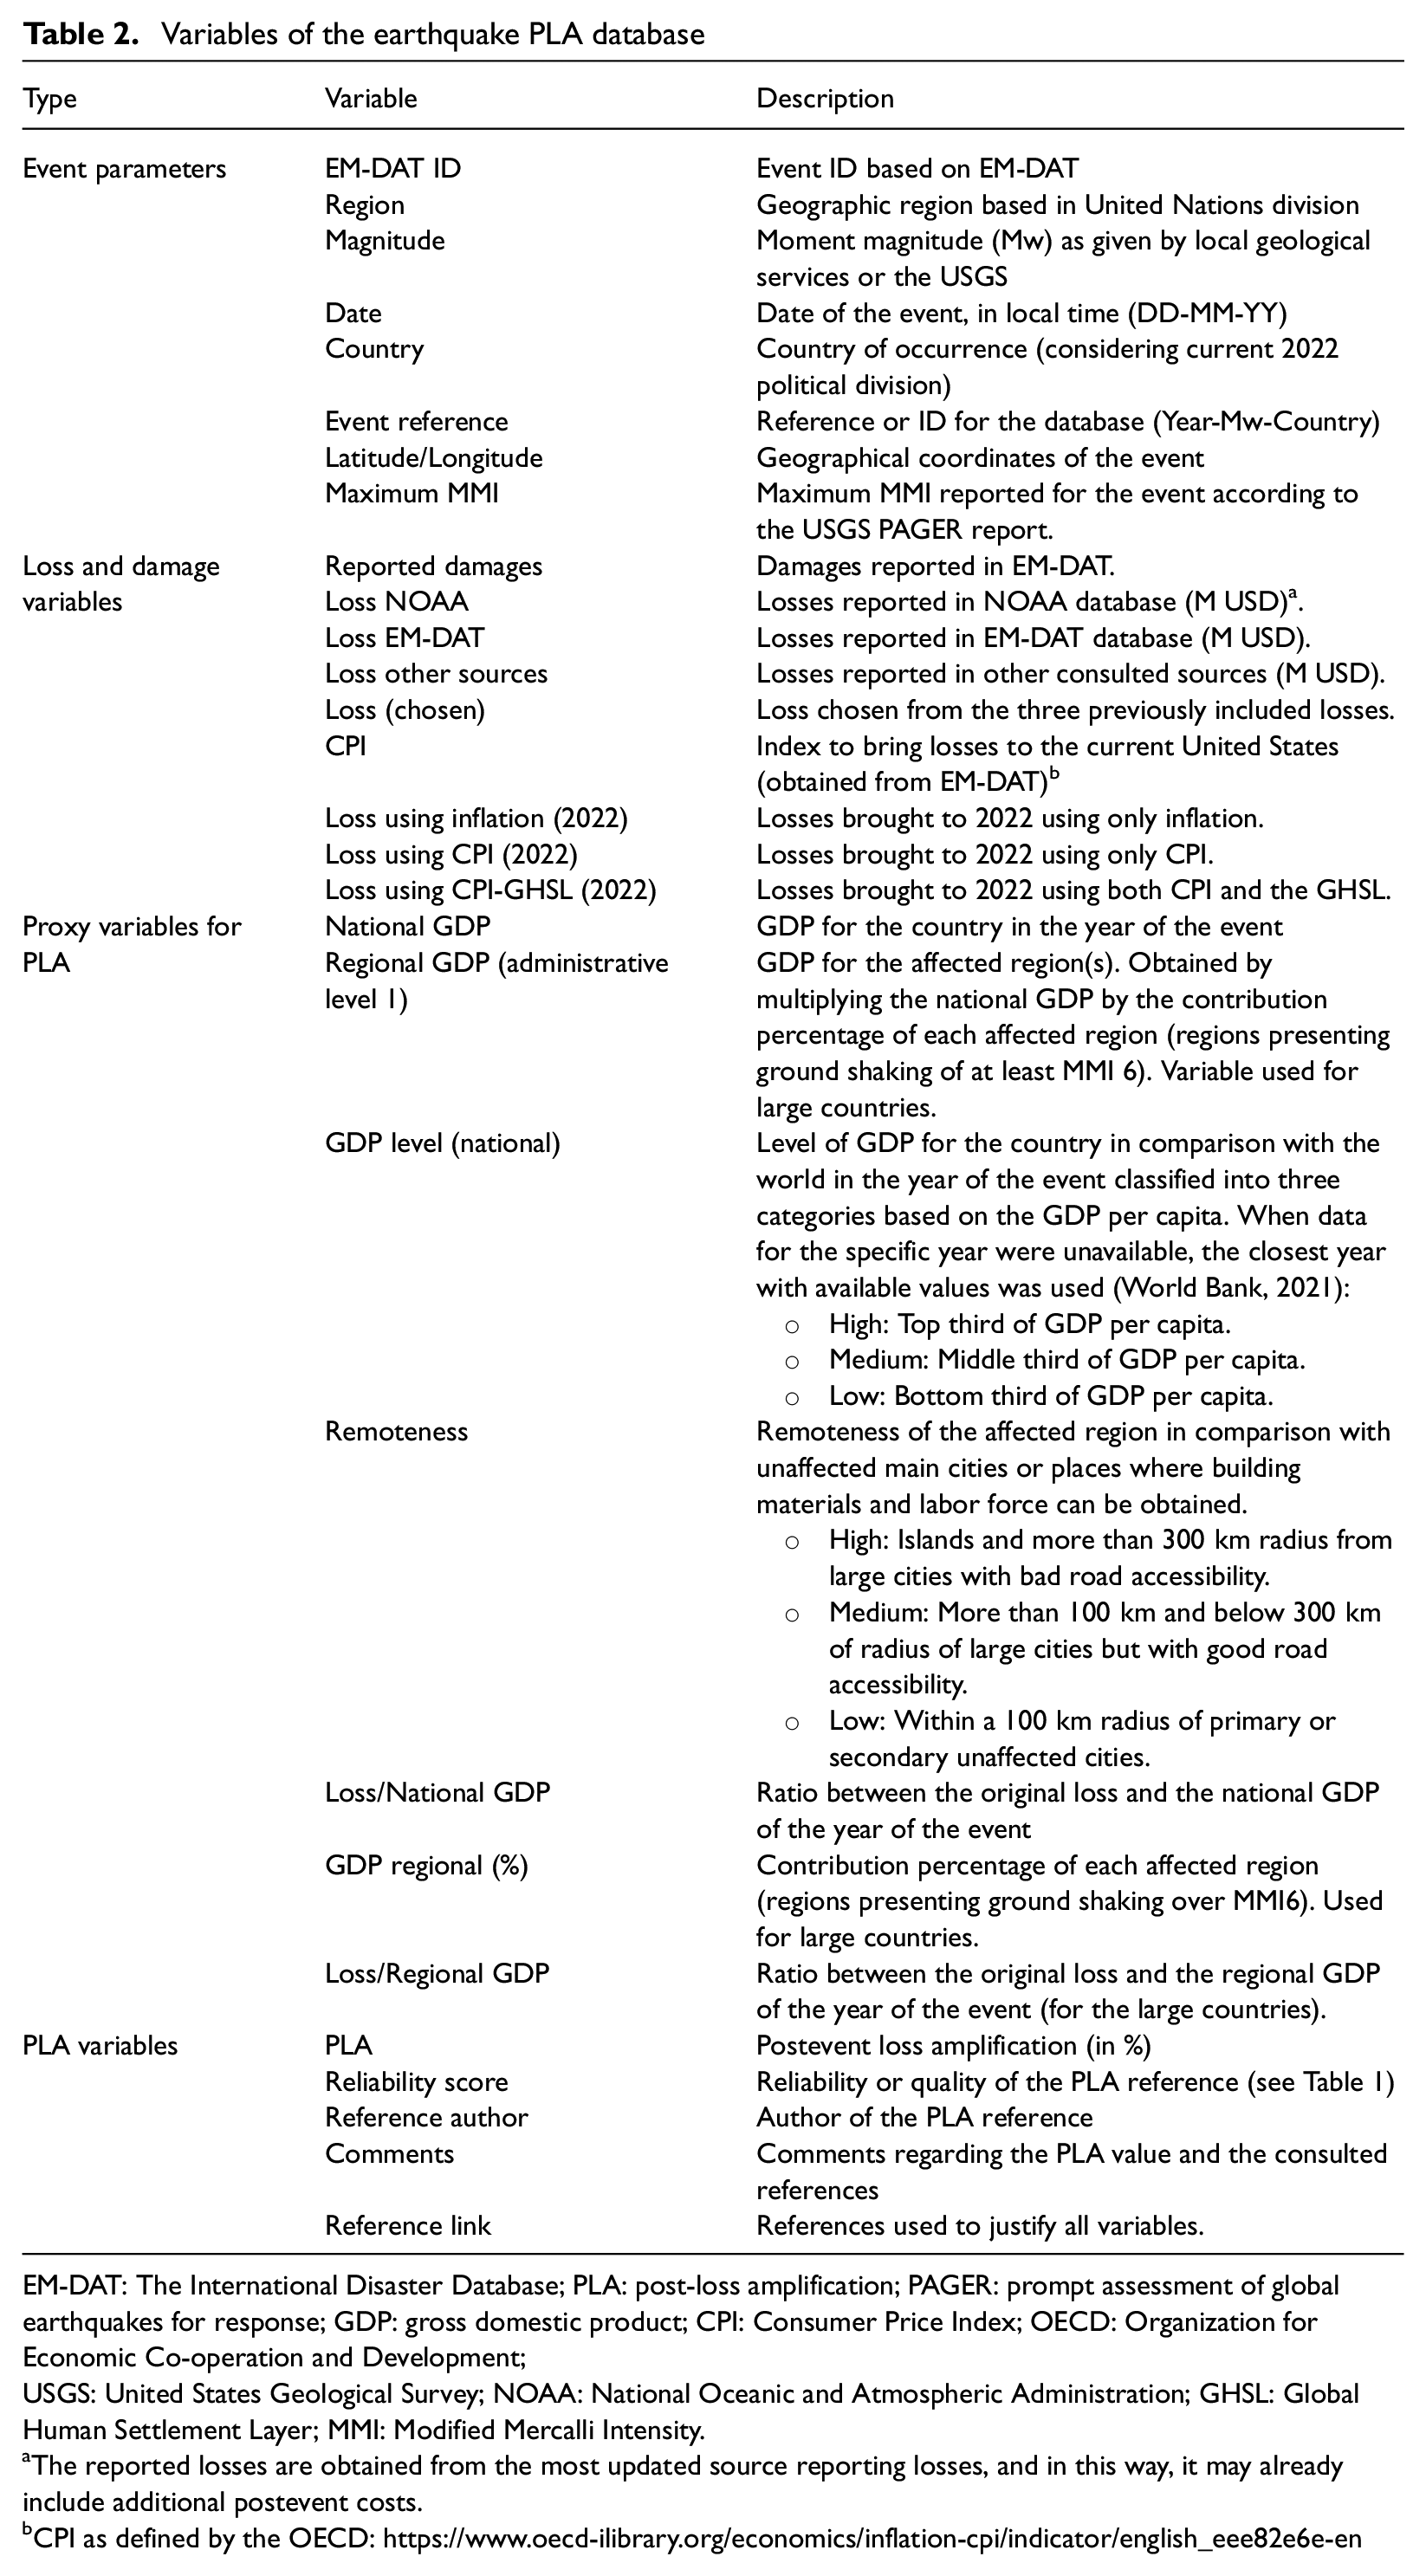
EM-DAT: The International Disaster Database; PLA: post-loss amplification; PAGER: prompt assessment of global earthquakes for response; GDP: gross domestic product; CPI: Consumer Price Index; OECD: Organization for Economic Co-operation and Development; USGS: United States Geological Survey; NOAA: National Oceanic and Atmospheric Administration; GHSL: Global Human Settlement Layer; MMI: Modified Mercalli Intensity.
The reported losses are obtained from the most updated source reporting losses, and in this way, it may already include additional postevent costs.
CPI as defined by the OECD: https://www.oecd-ilibrary.org/economics/inflation-cpi/indicator/english_eee82e6e-en
Review of the PLA database
The review of the database indicated a clear concentration of events in Europe and the Americas, doubling in both cases the numbers for Asia and Africa. Regarding these last two regions, it is important to note that there is limited information for large events (apart from some reports in the local languages), and for this reason, these are certainly underrepresented. For the events that occurred in East Asia (e.g. Japan and China), all earthquakes were investigated, but several did not report any information about demand surge or PLA. For half of the events, Modified Mercalli Intensities (MMIs) of VIII and IX were reported, indicating widespread damage in the building stock and infrastructure. There is also a stronger prevalence of events in high-income countries, not necessary because PLA is more common in these countries, but because there is often more data available. We also analyzed the GDP at the time of the event. However, PLA is a consequence that occurs at the local or regional level, and not necessarily at the national scale, in particular for large countries. For this reason, we considered the GDP at the first administrative level or within the affected area for large countries (China, the United States, India, Indonesia, Algeria, Mexico, Spain, and Italy), as further discussed in the following section. The global distribution of the selected events is presented in Figure 1, while Figure 2 presents the bar charts for some of the collected variables.
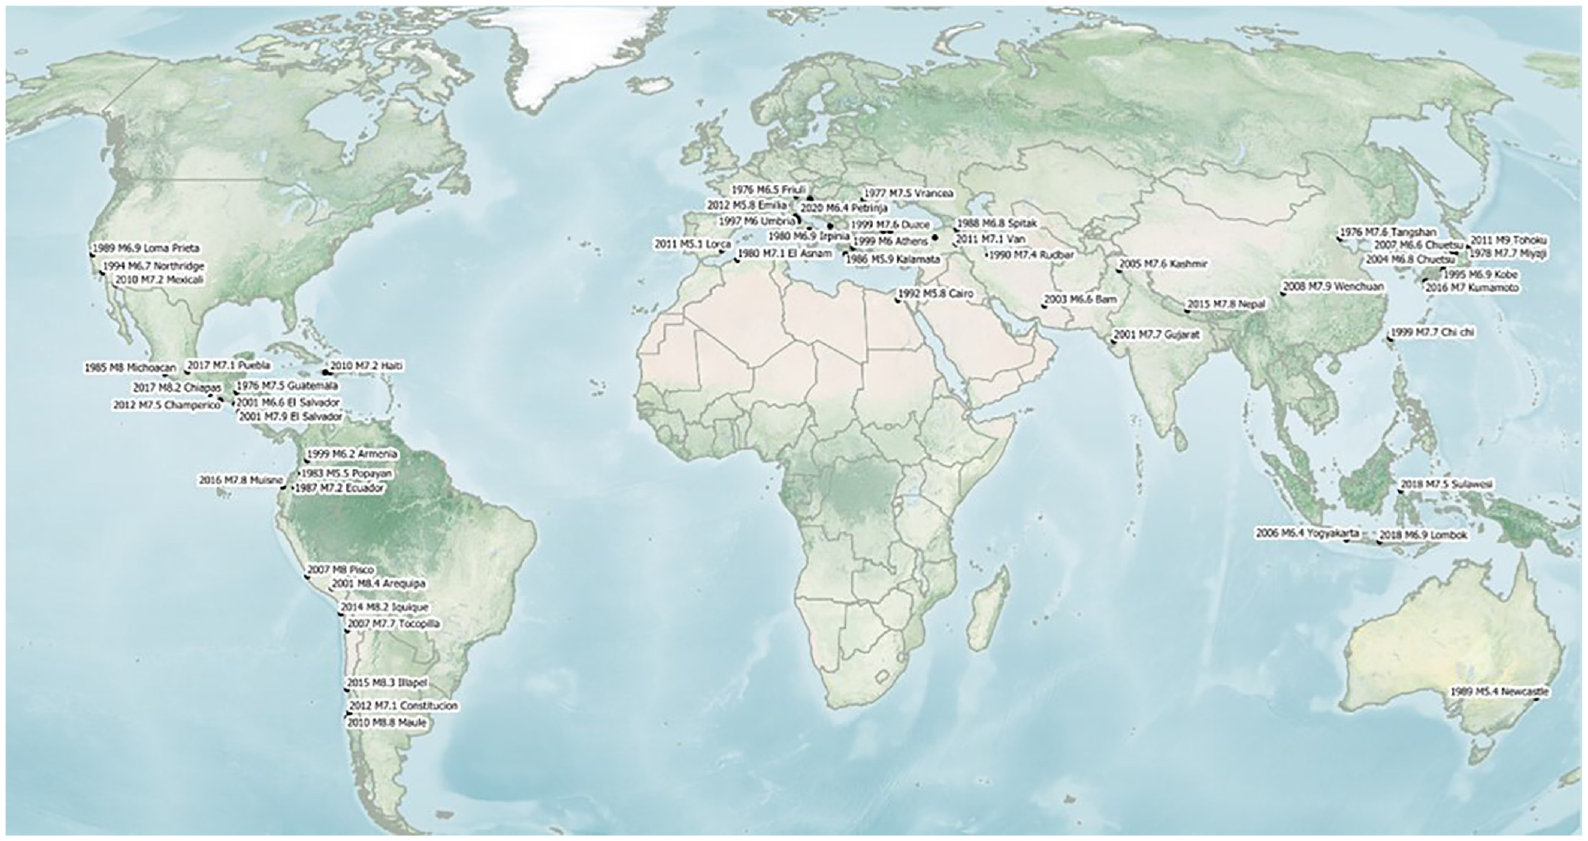
Geographical distribution of the selected events in the post-loss amplification database.
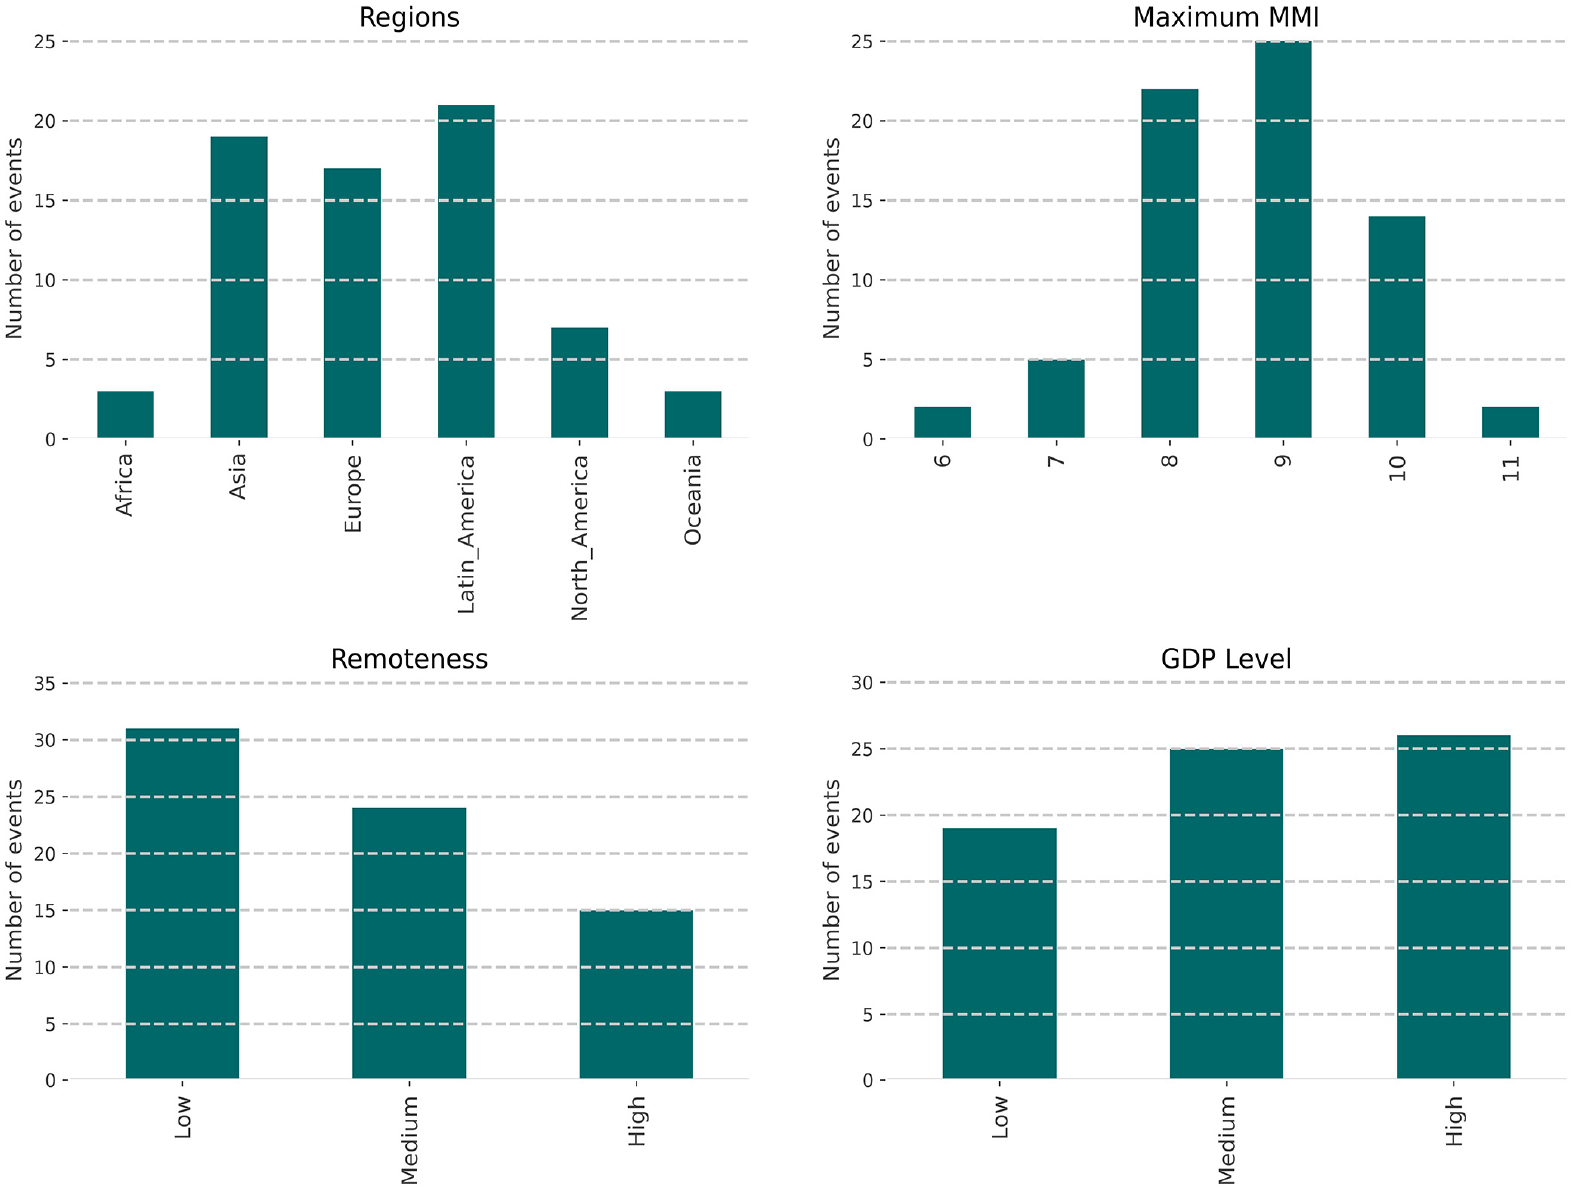
Bar charts of some of the variables in the database: Region (top-left), maximum MMI (top-right), remoteness (bottom-left), and GDP level (bottom-right).MMI: Modified Mercalli Intensity; GDP: gross domestic product.
Regarding the reliability of the PLA values, as previously mentioned, we defined a classification system comprising five categories, as described in Table 1. The distribution of the events against this reliability score and main source of information are shown in Figure 3.
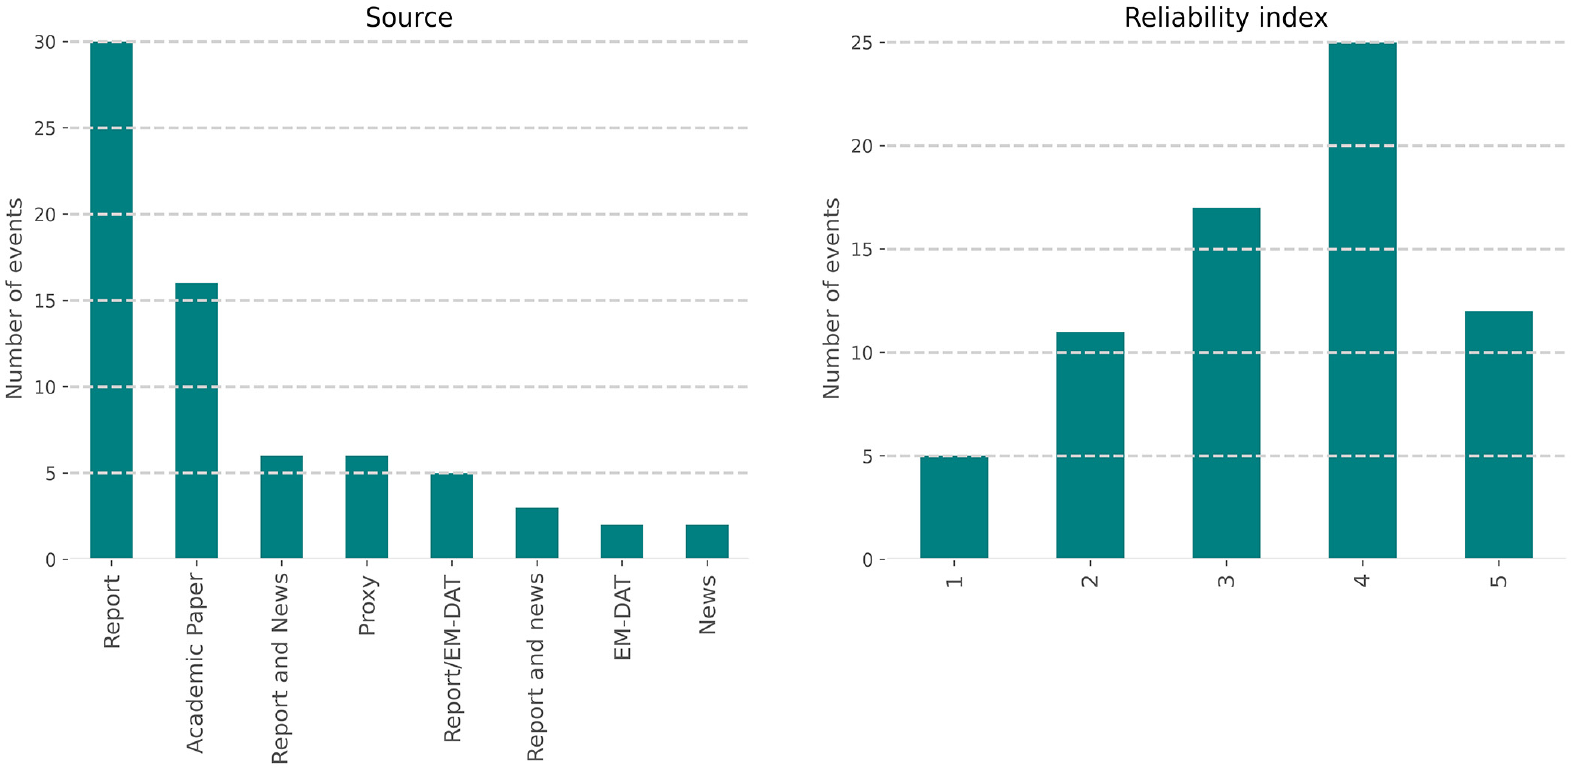
Bar charts of some of the variables of the database: source of the information (left) and reliability score (right).
The PLA database was designed to become a collaborative, transparent, and open effort, identical to other initiatives supported by the Global Earthquake Model (GEM) Foundation. It is envisioned as a dynamic resource that becomes more complete as additional data become available or other events where PLA is reported occur. It is available in a public GitHub repository (https://github.com/gem/pla), and any user can clone the database, propose modifications, and contribute with additional data. Currently, the database features 70 events with reported PLA. The potential uses for the database are further described in the concluding remarks and used in this study for the development of an empirical PLA model.
Analysis of the PLA database for earthquakes
Several analyses were conducted to identify possible correlations between the previously described variables and PLA. As stated in previous literature (e.g. Döhrmann et al., 2013; Olsen and Porter, 2010, 2011b), PLA arises from a combination of two main factors: a sudden demand for reconstruction efforts caused by a destructive earthquake and an insufficient coping capacity in the affected country or region. Considering this, the following variables were contemplated, given their possibility to explain the PLA phenomenon. To represent the “demand,” we analyzed the magnitude of the event, maximum MMI, and reported economic loss (both the original and adjusted losses to current conditions). To represent the “capacity,” we considered the remoteness and GDP of the country or region. We recognize that other potentially more complex variables might correlate with either the demand of the event or the capacity of the region, but such variables are impractical to obtain or estimate for a large number of seismic events. Moreover, we applied a log transformation to some of the variables to explore nonlinear relationships. The correlation analyses for the “demand” variables are shown in Figures 4 and 5, while the “capacity” variables are illustrated in Figures 6 and 7. Understanding that PLA comes as a result of the interaction between “demand” and “capacity,” in Figure 7 we also present the correlation between PLA and the compositive variable loss/regional GDP. The correlation analysis between all variables (for a total of 14 variables) has been included in the public repository, along with the estimation of the statistical significance (p value), to allow users to understand whether the reported correlation can be deemed as statically relevant.
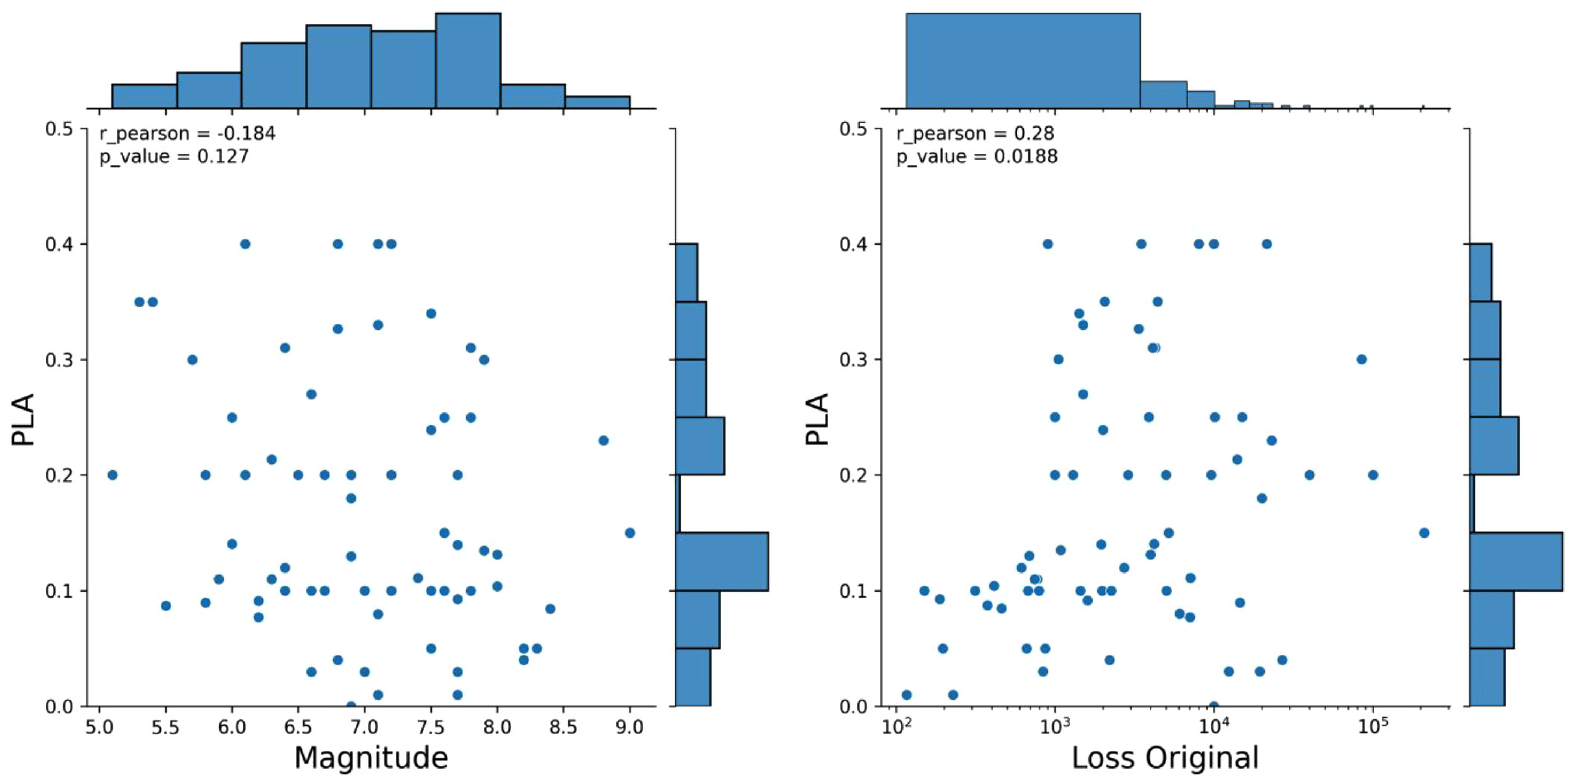
Correlation analyses for demand variables magnitude (left) and original loss (right).
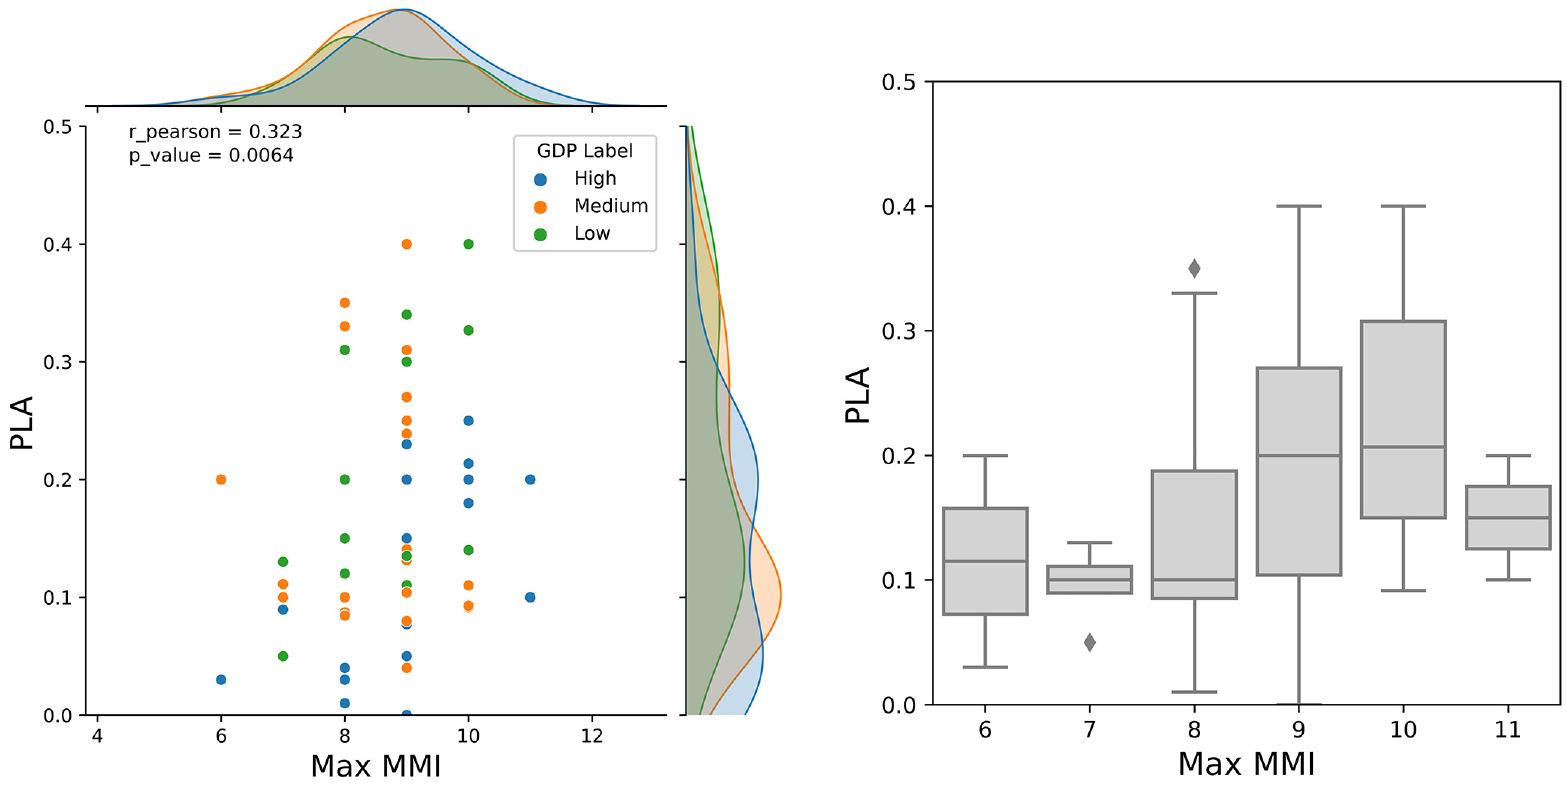
Correlation analyses for the demand variable maximum Modified Mercalli Intensity.
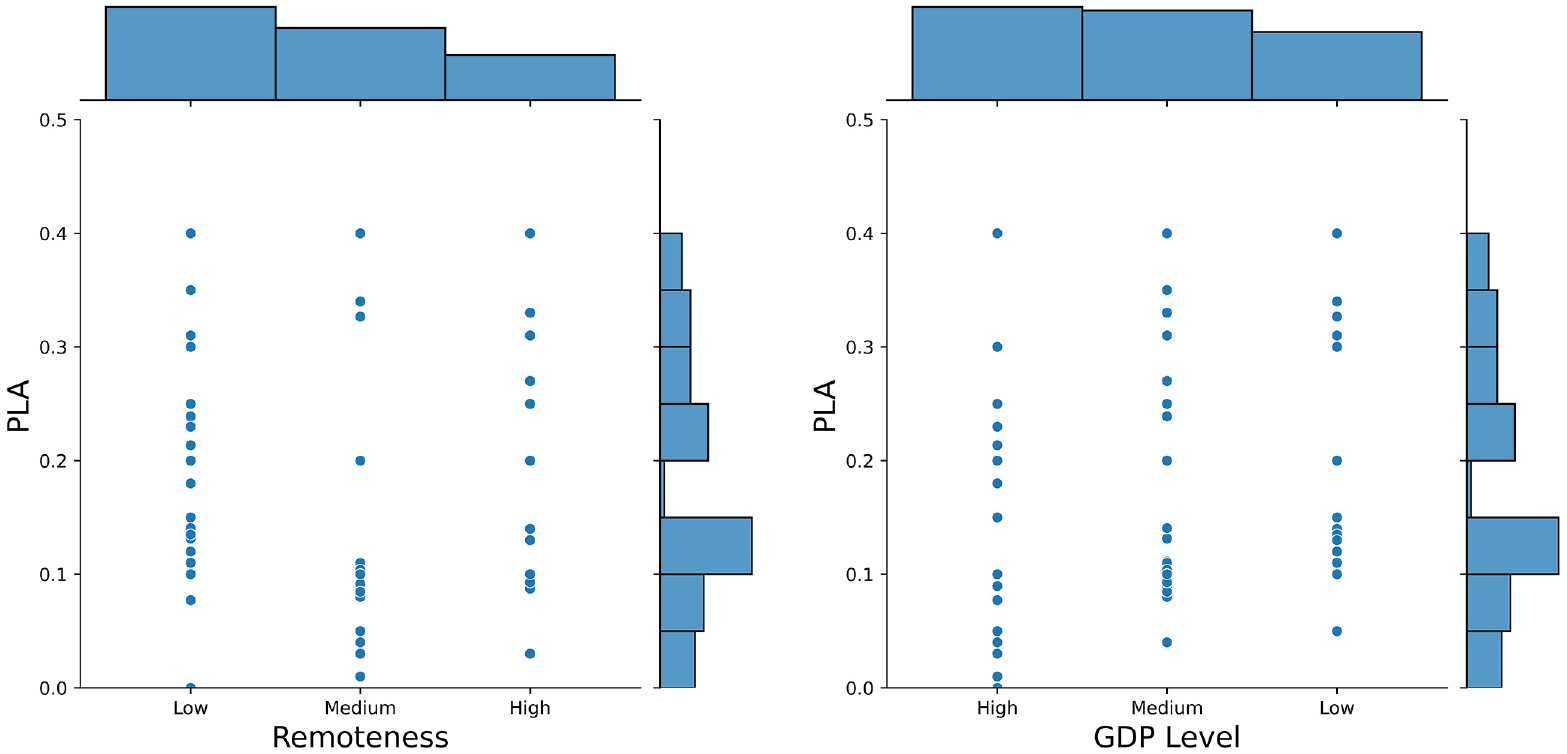
Correlation analyses of “capacity” variables remoteness (left) and gross domestic product level (right).
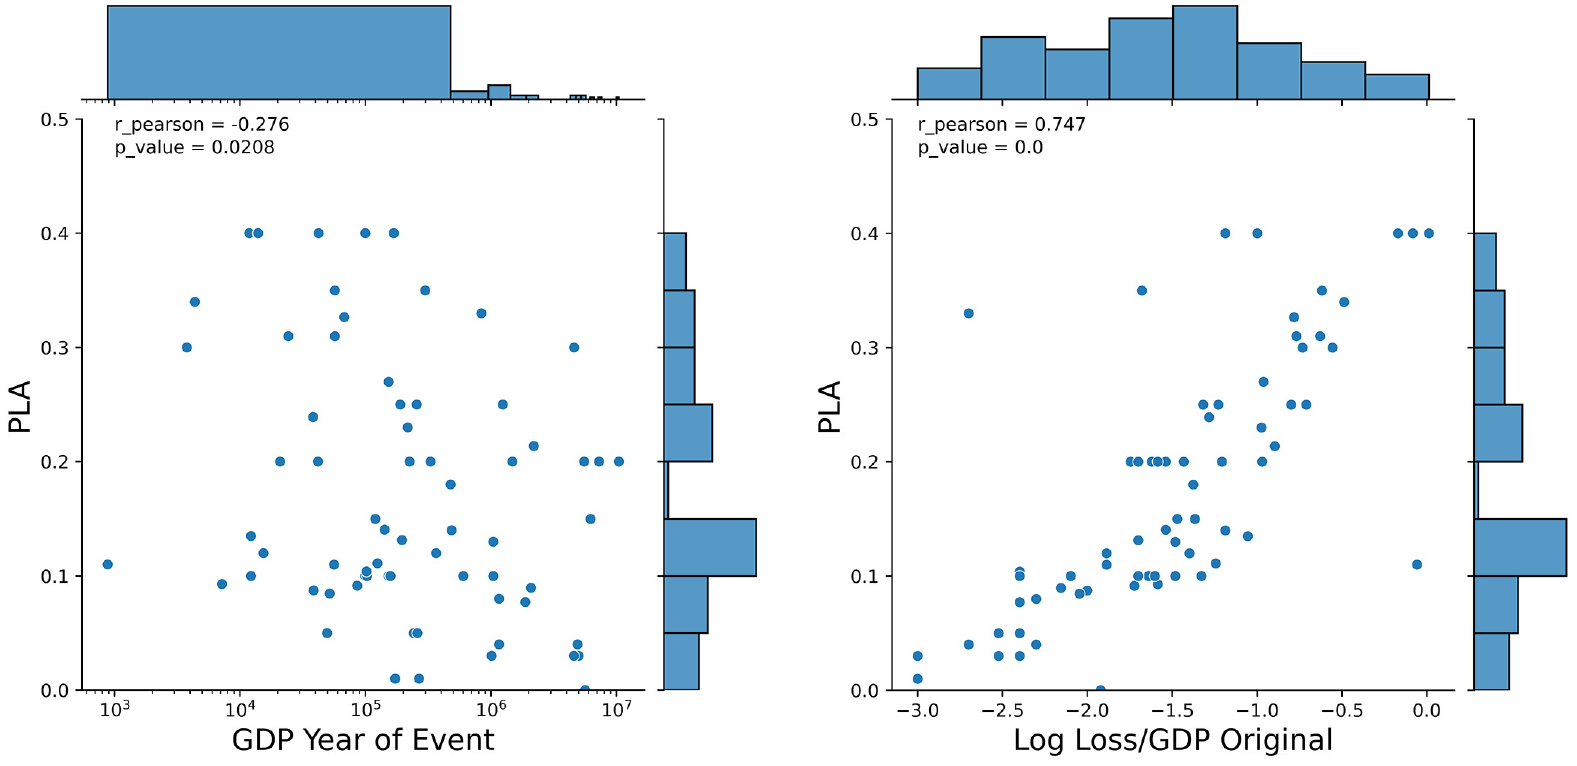
Correlation analyses for “demand” variable GDP and transformed proxy variable loss/regional GDP.GDP: gross domestic product
The evaluation of the various variables against the PLA did not reveal any clear correlation, but it did indicate some trends. From Figure 4, it is evident that magnitude is not a strong predictor of PLA. This is a rather expected outcome, given that for several events in the past (e.g. 1986 M5.7 San Salvador, 2011 M5.1 Lorca, 2020 M5.3 Zagreb), the magnitude was moderate (M < 6.0), but still a significant loss amplification was observed. The evaluation of the reported economic loss also did not indicate any correlation, but it is possible to define a maximum PLA against the reported loss. This trend can support modelers in understanding what the maximum PLA might be given the estimated impact of the events. Finally, regarding the maximum MMI, it is possible to observe a correlation, though not sufficiently strong to derive a predictive model. It is worth mentioning that for most of the events where a maximum MMI of IX was reported, PLA of at least 10% was observed.
Regarding the “capacity” variables, two analyses were done considering both quantitative and categorical variables. For the categorical variables, remoteness does not seem to have a significant correlation with PLA, and this finding is further discussed in this study. On the contrary, the GDP categorical variable does present a significant inverse relationship with PLA (i.e. the collected or estimated PLA was slightly higher for low-income countries). This might reflect the more difficult coping capacity typical of less developed nations. For the numerical variables, the GDP does not seem to have a clear correlation. However, we observe a trend when considering the proxy variable loss/regional GDP (which includes both the “demand” and “capacity” dimensions), in particular when this variable is transformed using the logarithm of base 10. This last variable was considered for the development of the empirical PLA model described in the following section.
Development of an earthquake PLA empirical model
Existing studies that covered the evaluation of PLA are exclusively qualitative and targeted at meteorological hazards in specific regions. This complicates their extrapolation to other perils and to other geographical contexts. Currently, most of the literature focuses on hurricanes or cyclones in the United States and Australia, given the availability of disaster data and construction costs in these countries. For example, McAneney (2007) proposed a model to predict postevent loss inflation for cyclones in Australia. Hallegatte (2008) presented a model to estimate macroeconomic losses after Hurricane Katrina. Olsen and Porter (2013) investigated the increase in the costs of common construction materials after hurricanes in the United States and proposed a model to predict demand surge. Khodahemmati (2018), Khodahemmati and Shahandashti (2020) compared postdisaster construction material costs and inflation against the no-disaster condition. Other relevant studies covering increased reconstruction and labor costs due to hurricanes in the United States include Arneson (2019), Belasen and Polachek (2008, 2009), and Döhrmann et al. (2017).
For the case of earthquakes, to the knowledge of the authors, there are no studies providing a comprehensive database or model for PLA. The only qualitative approximations were performed by Olsen (2012), Chang et al. (2012), and Kahandawa et al. (2021). Olsen (2012) studied this phenomenon based on data from three earthquakes (1886 M7.3 Charleston, 1906, M7.9 San Francisco, and 1994 M6.7 Northridge), reaching similar conclusions to those of their study for hurricanes. Chang et al. (2012) performed a statistical analysis using questionnaires completed by construction experts after the 2008 M7.9 Sichuan earthquake. Kahandawa et al. (2021) analyzed essential variables affecting repair costs in New Zealand.
The review of the variables presented in the previous section indicates that PLA depends heavily on the level of destruction caused by the seismic event and the coping capacity of the affected region. As illustrated in Figure 4, the same level of impact (at least in terms of economic losses) might cause different loss amplifications, or no amplification at all. For example, the 1989 M6.9 Loma Prieta and 1999 M7.7 Chi–Chi earthquakes caused losses between 10B and 12B USD (18B to 21B USD for the 2022 projection), but there was no PLA reported for the former, while there was a 20% loss amplification for the latter. This finding might be due to the greater capacity of California to cope with destructive events in comparison with Taiwan, at least at the time of each event. From this review, it is reasonable to assume that the local economy and construction sector are in general prepared to respond to the reconstruction needs of frequent events, which explains the lower PLA for events whose economic loss was small proportional to the regional or national GDP. On the contrary, rare events tend to cause an “unusual” level of destruction (or demand) that might exceed the capacity of the local economy and construction sector, leading to the increase in the costs. This rationale led us to explore, in addition to the already described variables, a parameter that could characterize the temporal frequency (or return period) of the reported loss.
We performed two regression analyses: the first considers the proxy variable original loss/regional GDP (with its logarithmic transformation) as shown in Figure 7. We note once again that for large countries (China, the United States, India, Indonesia, Algeria, Mexico, Spain, and Italy), we estimated the GDP of the regions severely affected by the event (i.e. where a MMI of at least 6 was reported), as opposed to the GDP of the whole country. This variable is relatively straightforward to calculate shortly after the occurrence of destructive events, which enables the consideration of PLA in earthquake scenarios or in rapid loss assessment (e.g. prompt assessment of global earthquakes for response (PAGER)—Jaiswal and Wald, 2010).
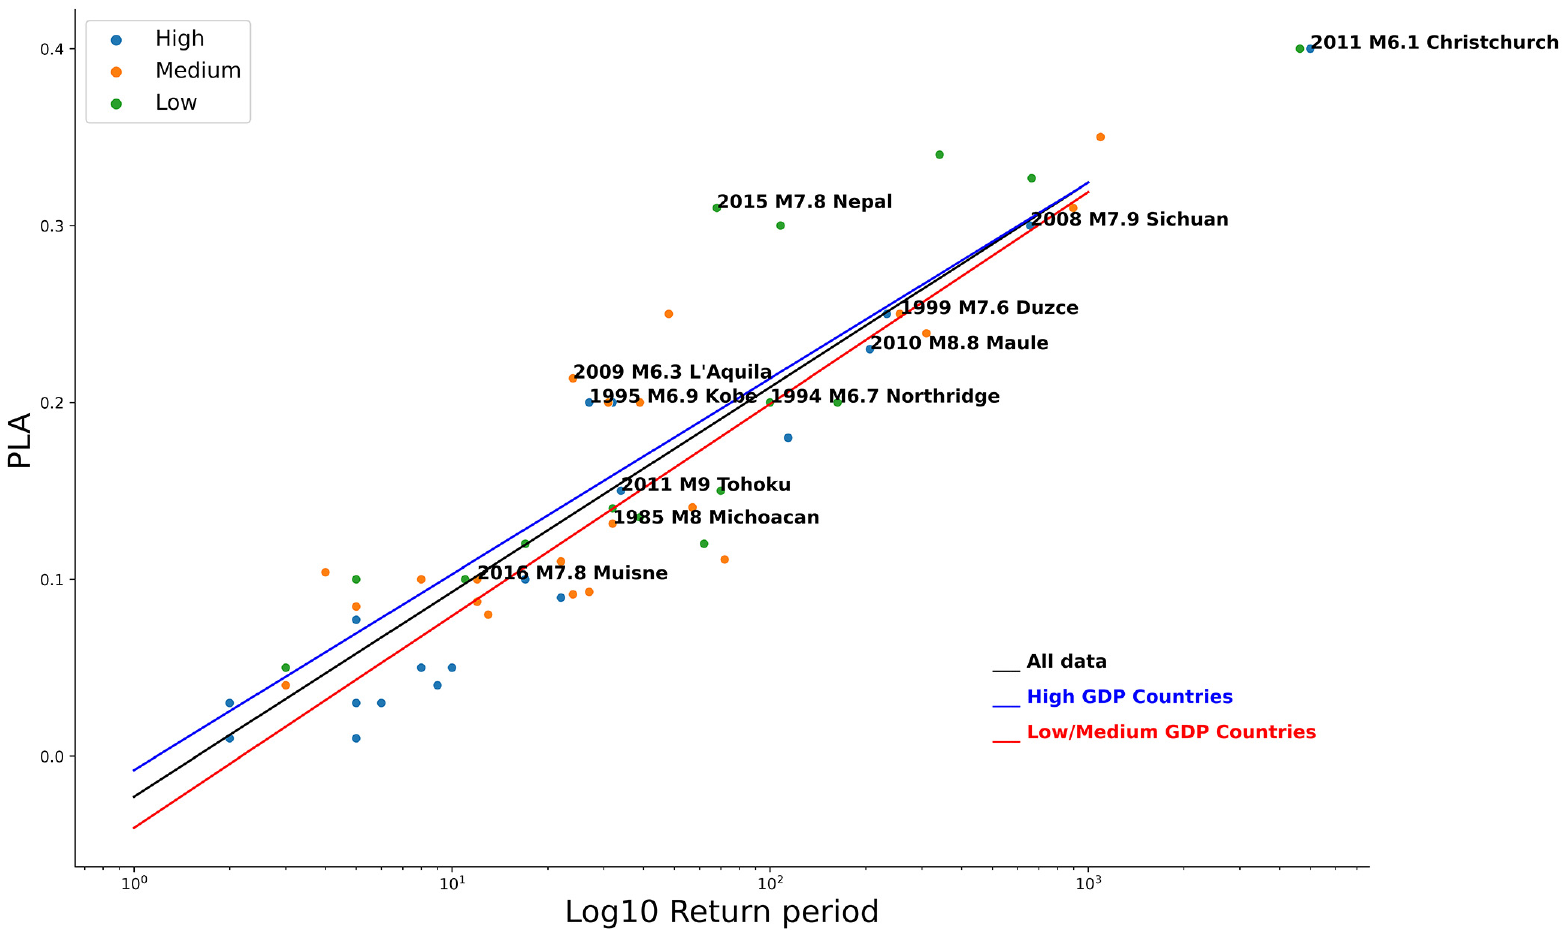
For the second regression analysis, we explored a variable that characterizes the frequency of the loss of each event. Using the probable maximum loss (PML) curves from the global seismic risk model (Silva et al., 2020) of the GEM Foundation, we estimated the expected return period of the reported loss (adjusted to today’s value, and with and without the logarithmic transformation). Since none of the loss curves from the global seismic risk model considered PLA, we first decreased the reported loss according to the PLA value (when needed) and then estimated the corresponding return period. The global loss model from the GEM Foundation comprises 30 national or regional probabilistic seismic risk models, and thus, the reliability of the PML curves varies globally. This variability has not been properly quantified by the authors, and thus, it has been neglected in this version of the PLA model. To investigate the influence of the coping capacity of each region, we performed these analyses considering the remoteness and GDP categorial variables. Figure 8 presents the distribution of the PLA with the estimated return period.
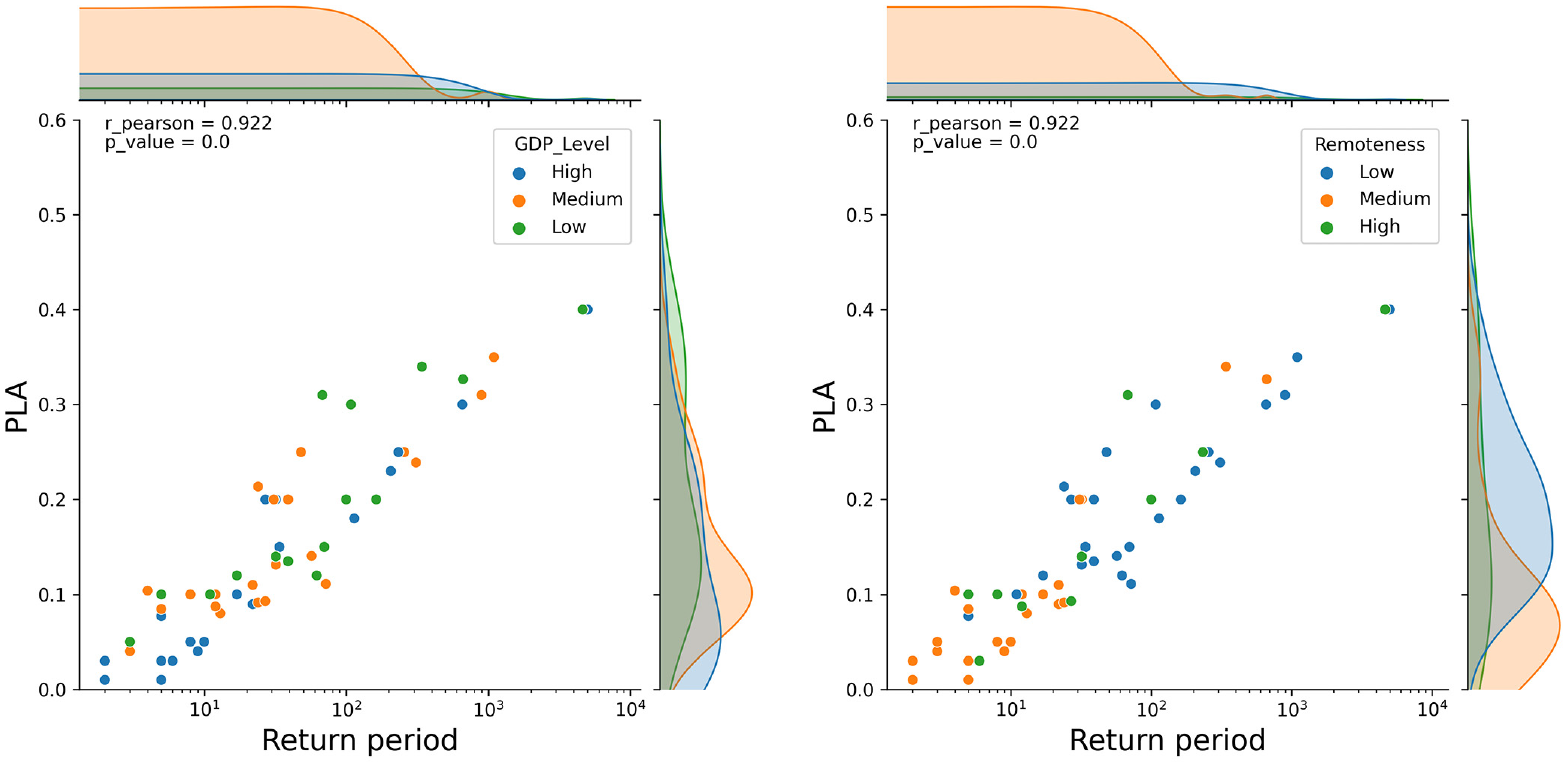
Correlation analyses for the logarithm of the return period (according to Silva et al., 2020), considering the gross domestic product level (left) and remoteness (right) of the affected region.
These analyses revealed a strong correlation between the PLA and the frequency of the reported economic loss, as expected. However, this explanatory variable (i.e. return period) is conditional on the probabilistic seismic risk model for the associated country, and should another model had been used, the results would have been different. This dependency on the chosen seismic risk model is further discussed in the following section.
No benefits were found in disaggregating the data according to the remoteness variables, as also observed in Figure 6. However, the disaggregation of the data according to the GDP level indicated minor significant differences, so we decided to perform the regression analysis considering three groups of data: (1) all data, (2) high-income countries, and (3) middle-to-low-income countries.
The evaluation of these results, as well as the ones reported in Figure 7 (i.e. variable loss/regional GDP), allowed the identification of clear outliers, which required an additional investigation of the causes for the lack (or considerable) loss amplification. These outliers represented events where the reconstruction costs were heavily affected by factors such as the political situation of the country or cascading effects. For example, the 1972 M6.3 Managua event occurred during a dictatorship, and the government decided not to respond adequately to the earthquake. This led to an underestimation of the reconstruction costs as the reconstruction was mostly done by nonofficial organizations, and the documentation of the recovery was limited. This represents an event in which despite the large (and rare) economic losses, no significant PLA was reported. The opposite effect was observed in the 1987 M7.2 Ecuador earthquake, where notwithstanding the large economic losses and widespread damage (i.e. maximum MMI of IX), this event caused massive damage to the oil pipelines around the country, which increased the cost of every product up to 40% due to the dependency of the country on this commodity. In total, six events were excluded for the development of the empirical model due to these external factors (this information is included in the PLA database, in the “Comments” column).
We explored several functional forms to establish a parametric model between PLA and the independent variables (i.e. logarithm of the loss/regional GDP and return Period) and opted for the formulations that led to a high correlation factor, while still being relatively simple. The regression parameters for both regression analyses are reported in Table 3, and the resulting models are illustrated in Figures 9 and 10.
Regression analyses using the variables loss/regional GDP and return period
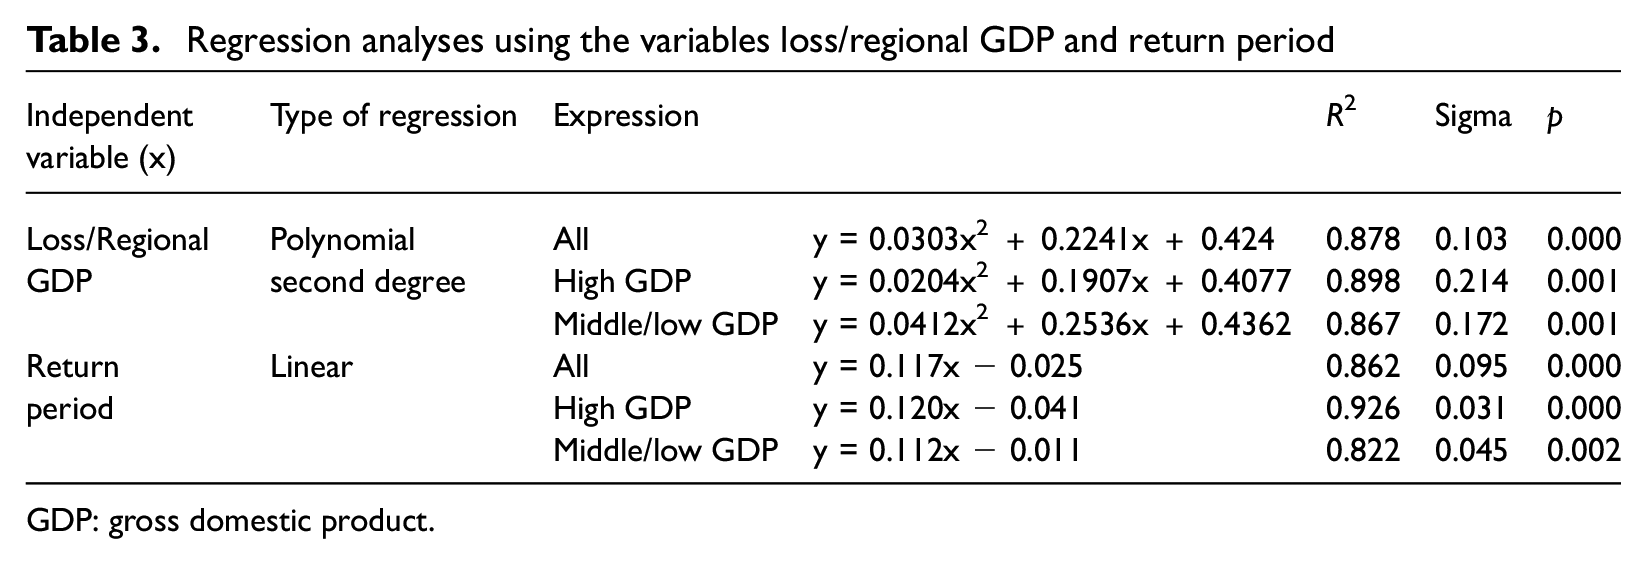
GDP: gross domestic product.
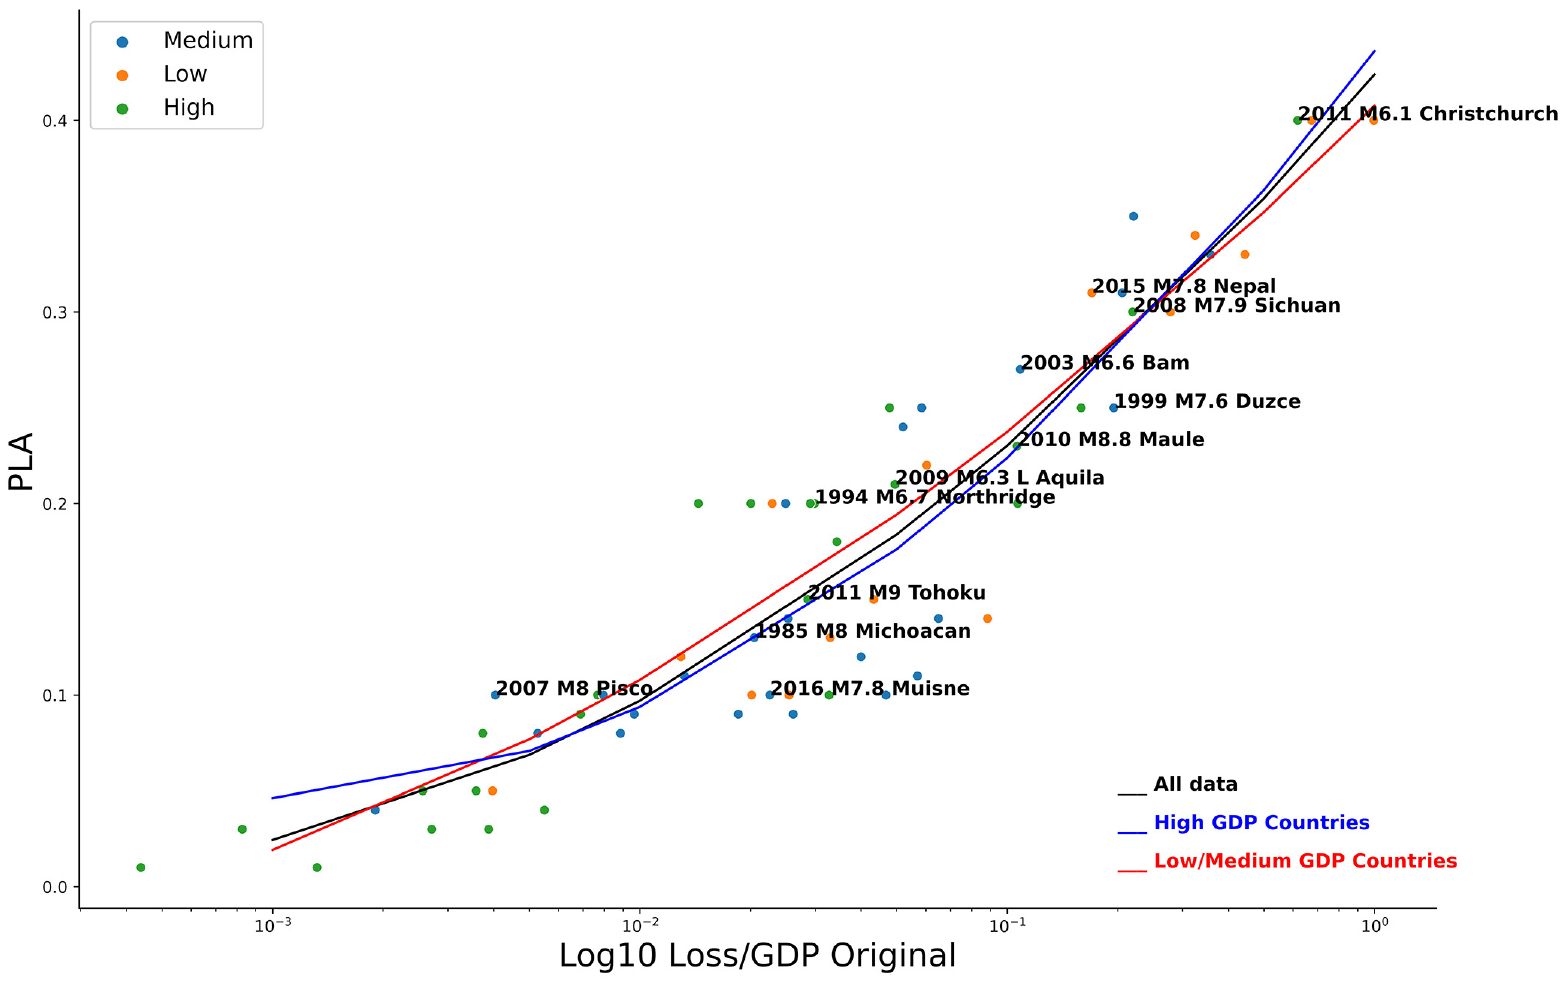
Empirical PLA model using the loss/regional GDP variable.PLA: post-loss amplification; GDP: gross domestic product.
Empirical post-loss amplification model using the return period variable.
Discussion of the results
The paucity of specific data regarding the effects of destructive events in reconstruction costs is extremely challenging. As previously stated, the number of events with official and reliable data is rather limited, and consequently, various sources of information (with varying degrees of reliability) must be consulted. Even for the same event, multiple sources (e.g. government, international organizations, local organizations, and scientific community) may report different impacts. Moreover, the reported data are by no means exhaustive. There is a significant amount of work done locally during the reconstruction process that is not accounted for in “official numbers” (e.g. auto-construction, private investment, and NGO initiatives).
It is also known that data reported globally tend to underestimate the actual damage. For example, UNISDR (2013) showed that moving from global to national databases increased global loss estimates by 50%. However, collecting local data is often difficult as some documents might not be publicly available, and the ones that are might be in the local language. EM-DAT indicates that for some parts of the world, most of the disaster data are still missing (Centre for Research on the Epidemiology of Disasters (CRED) Crunch, 2021), with events in Africa missing 95% of the parameters that are typically collected for each disaster. This may render the database biased and less suitable for some regions in the world. In addition, loss data are updated without a proper version control, making it difficult to understand whether the reported value is what was estimated right after the event, or the final cost after most of the reconstruction was completed. This issue highlights the need to approach the problem of PLA modeling as a community effort, in which experts from different regions can contribute with additional data to the public repository, allowing the adjustment of the proposed models, or the derivation of new ones using other variables.
Another important issue worth mentioning is the fact that losses are frequently reported as a total number, which makes it extremely difficult to disaggregate between direct or indirect losses, or to isolate factors that might be unrelated to the seismic event but could be causing an increase in the reconstruction costs. This is the case of concurrent events such as the coronavirus 2019 (COVID-19) pandemic during the earthquakes in Croatia (2020 M5.3 Zagreb and 2020 M6.4 Petrijna events), the official dollarization of El Salvador during the 2001 M7.9 earthquake, or the global recession in the early twenty-first century. Finally, reconstruction processes may take years or even decades, and thus even today, we may not be seeing the final reconstruction cost of some of the selected events. The definition of a timeframe for the estimation of PLA is one of the major challenges.
The two models proposed herein provide a strong correlation with PLA (R2 > 0.85). The results indicate a slightly stronger correlation when aggregating the data for high-income countries, which could be due to the higher reliability and accuracy in the available data. We also observed a greater PLA for low-to-middle-income countries for the same return period, which could be due to the lower capacity to cope with disasters. On the contrary, the level of remoteness of the affected area does not seem to significantly influence the loss amplification, which is a rather counterintuitive finding. Such lack of correlation could be due to different reasons, including the limited number of events in the database, or the criterion adopted to define the three categories, which is mostly based on rough geography parameters. This outcome could also indicate that other factors (e.g. capacity of the construction sector, governance, and efficiency of the transportation network) have a stronger influence in the potential amplification of the losses.
A relevant PLA (>10%) was observed when the losses exceed 1% of the regional GDP, or for events with a return period longer than 10 years. This level of losses is relatively frequent, which highlights the need to consider the potential amplification of losses in rapid loss assessment, earthquake scenarios, or probabilistic seismic risk analyses. From the review of the 70 selected events, we did not find evidence of a PLA greater than 40%. For this reason, although the proposed models could mathematically be extrapolated to input variables outside of the range indicated in Table 3, we recommend saturating the PLA at 40%.
The PLA prediction models were generated using data with different levels of reliability, as illustrated in Figure 3. However, due to the limited number of events in the database, it was not possible to use only data with a high-reliability score in the regression analysis, as that would lead to a model derived only based on a few dozen data points. We also explored the possibility of associating each data point with a weight proportional to the reliability level, but with the current data, it was not possible to define a logical criterion to define such weights.
Conclusion
The first version of an open-access database with relevant data to model PLA due to destructive earthquakes was presented in this study. With this database, two empirical models to estimate PLA were derived. The first model uses the ratio between the direct economic losses and the GDP in the affected region, and it can be rapidly estimated shortly after the occurrence of strong events, thus allowing an early understanding of whether PLA should be expected. The second model uses the estimated return period (or level of frequency) of the loss, and it can be easily incorporated in probabilistic seismic risk assessment. This procedure usually occurs during the derivation of event loss tables, which contains the set of stochastically generated seismic events, associated economic loss, and corresponding annual rate of exceedance (or return period). This is conditional on the probabilistic seismic risk model that was used to estimate the return period of each reported economic loss. Consequently, incorporating this equation within other probabilistic seismic risk models might lead to inconsistencies in the risk results. Instead, we recommend leveraging upon the data featured in the PLA database to adjust the regression parameters accordingly. It is also important to note that the application of both PLA models to the same seismic event might not necessarily lead to the same loss amplification, despite the high correlation. For example, if two events occur in the state of Washington and Florida and generate the same economic loss (e.g. 1B USD), the return period associated with such loss for the former state will obviously be lower than for the latter, given that seismic activity is higher in Washington. According to the return-period-based empirical model proposed herein, the PLA would be greater in Florida. On the contrary, the GDP of the state of Florida is twice that of the state of Washington, which means that according to the GDP-based empirical model, the PLA would be higher in Washington. This inconsistency between the two models is possible, but it can be mitigated by not considering the GDP of the entire country (or the first administrative level for the cases of large countries such as the United States), but instead, the GDP generated in the affected region. The combination of the “regional” GDP with the reported loss is a greater indicator of the level of destruction caused by the seismic event.
For the development of the prediction models, it was necessary to adjust the losses reported at the time of the event, to today’s reality. In other words, what would be the direct economic losses if such events were to occur today? As previously discussed, there are different approaches that can be employed to adjust these losses, each one with its own advantages and limitations. We note that most methods focus on the incorporation of inflation and increase in the building stock of the affected area but tend to neglect improvements in the built environment due to the introduction of design regulations or urban planning. The exploration or development of more advanced procedures to adjust historical losses was out of the scope of this study, but it is part of another ongoing effort by the GEM Foundation, that aims at adjusting different impact metrics from historical events, including economic losses, number of damaged buildings, and casualties.
The PLA database can be directly used to estimate the expected PLA for a given event, by identifying similar earthquakes (in terms of geography, socio-economic development, and magnitude of the impact), and adopting the observed PLA. It is important to mention that there may be events like the ones described for Nicaragua and Ecuador for which these models are not suitable, as they cannot model external factors or the impact on specific sectors of the economy. These models are currently being incorporated within the global seismic risk model of the GEM Foundation, which will allow understanding how much PLA can affect probabilistic seismic risk estimates, and consequently, any risk transfer instruments or risk reduction measures designed using those metrics.
Footnotes
Acknowledgements
The author(s) are grateful to the insightful comments and feedback received from reviewers all which helped improve in a significant way the outcome of this article.
Declaration of Conflicting Interests
The author(s) declared no potential conflicts of interest with respect to the research, authorship, and/or publication of this article.
Funding
The author(s) received no financial support for the research, authorship, and/or publication of this article.