
Abstract
Until recently, the orientation of maximum horizontal spectral response was generally believed to not have a predominant orientation at rupture distances greater than 5 km. However, a recent study found that the orientation of maximum spectral response for strike-slip earthquakes in the NGA-West2 database tends to occur close to the epicentral transverse orientation, that is, an orientation perpendicular to a line connecting the epicenter to the station. This article investigates directionality in the 6 February 2023 Türkiye doublet earthquakes (Mw 7.8 and 7.5) with strike-slip faulting. The orientation of the maximum response of 5%-damped linear elastic oscillators was studied. The spatial distribution of the level of polarization, which in this article refers to the amount of directionality, and intensities at specific orientations were also studied. The maximum spectral response was found to occur systematically close to the epicentral transverse orientation, consistent with previous observations for other strike-slip earthquakes. For the Mw 7.8 event where the location of maximum slip was relatively far from the epicenter, it was found that the orientation of maximum spectral response is, on average, closer to the maximum slip transverse orientation (i.e. perpendicular to a line connecting the station to the surface projection of the point of maximum slip) when compared to the epicentral transverse orientation over most period ranges. This suggests that the maximum slip transverse orientation may be a better estimator for determining the orientation of maximum spectral response in large-magnitude strike-slip earthquakes, although further study using more events is warranted. Polarized motions were observed over large geographical areas, and the orientation of maximum spectral response was found to be close to the epicentral or maximum slip transverse for Joyner–Boore distances up to the farthest studied (400 km). These findings further support the case for the development of orientation-dependent ground motion models for strike-slip earthquakes.
Keywords
Introduction
Earthquake ground motions at a given site are typically recorded in two horizontal and one vertical components. The two horizontal components of ground motion can be combined into a single time series associated with a specific azimuth and rotated incrementally to obtain an intensity in any specified orientation at a given site (Boore, 2010). It is well known that the intensity of horizontal ground motion can vary significantly with changes in orientation, a phenomenon referred to as directionality (Hong and Goda, 2007; Poulos and Miranda, 2022; Shahi and Baker, 2014). Although this variation in intensity with orientation has been known for years, current ground motion models (GMMs) provide estimates of a single scalar measure of ground motion intensity, therefore neglecting directionality effects. Prior studies have proposed different ways of obtaining this scalar measure of ground motion intensity at a given site. For example, Joyner and Boore (1982), Boore et al. (1997), and Abrahamson and Silva (1997) used the geometric mean of intensities of the two as-recorded horizontal intensities. Boore et al. (2006) and Boore (2010) proposed the use of horizontal intensities that are independent of horizontal sensor orientations. Other works have studied ratios between different scalar measures of ground motion intensity at a site (e.g. Beyer and Bommer, 2006; Boore and Kishida, 2017).
When studying the effects of rupture directivity, Somerville et al. (1997) observed that for periods longer than 0.6 s, the response spectral ordinates at the strike-normal orientation tended to be larger than those at the strike-parallel orientation, implying that the orientations of maximum intensity are closer to the strike-normal orientation. Follow-up studies found that there was indeed a higher probability of the orientation of maximum intensity being closer to the strike-normal orientation but only at rupture distances less than 5 km (e.g. Huang et al., 2008; NEHRP Consultants Joint Venture, 2011; Shahi and Baker, 2014). For rupture distances greater than 5 km, these other studies observed that the angle between the orientation of maximum intensity and the fault strike did not exhibit a clear pattern and was essentially random with an approximate uniform probability distribution. Accordingly, current seismic design standards in the United States for conducting response history analysis indicate that sites located away from near-fault regions do not exhibit predominant orientations (American Society of Civil Engineers (ASCE), 2016, 2022).
The studies mentioned in the previous paragraph focused on studying the directionality of spectral response with respect to the fault strike (i.e. strike-normal or strike-parallel), that is, with respect to an orientation common to all recording stations. In a contrasting approach, Poulos and Miranda (2023) studied the orientation of maximum spectral response with respect to the epicentral transverse orientation, which is the orientation perpendicular to a line segment connecting the station to the epicenter. This orientation, in general, is different for each recording station and is defined by the position of each station relative to the epicenter. They used the NGA-West2 ground motion database (Ancheta et al., 2014) to investigate the orientation of maximum response of 1966 ground motions recorded on strike-slip earthquakes and 2226 ground motions recorded on reverse-faulting earthquakes that had moment magnitudes greater than or equal to five. They found that for strike-slip events, there was a notable tendency for the orientation of maximum spectral response to be close to the transverse orientation. In addition, they concluded that the orientation of maximum intensity got closer to the transverse orientation as oscillator period increased. This finding is significant since it means that the probability distribution of the orientation of maximum intensity is not uniform as previously thought and that it can be estimated from the geographic location of the site relative to the location of the epicenter.
Poulos and Miranda’s (2023) motivation for examining the orientation of maximum response with respect to the transverse orientation was that S waves from theoretical double couple point sources in a homogeneous medium exhibit polarization transverse to the direction of propagation. In their study, they used the epicenter as the location of the point source. However, ground motion at a specific location is caused by a combination of waveforms produced by slip occurring at different points on the fault rupture. Given that the location of the maximum slip is the principal contributor to the total slip that generated the earthquake, it may be a better point source for the radiation patterns. For smaller magnitude earthquakes, the location of maximum slip may be located close to the epicenter. Conversely, for large-magnitude events, it is not uncommon for the location of maximum slip to be far from the epicenter. For example, using more than 80 finite-source rupture models for 50 earthquakes, Mai et al. (2005) found that rupture initiates in regions of low slips in 48% of the events they investigated. The hypocenter occurred in regions of very large slips in only 15% of the events. Therefore, there may be limitations to using the epicenter to estimate orientations of maximum spectral response for large-magnitude events.
The 6 February 2023 Kahramanmaras earthquake doublet generated one of the most extensive collections of strong motion data recorded to date from strike-slip events with moment magnitudes above 7.4. Hence, this earthquake doublet provides an exceptional opportunity to validate and further study the observations by Poulos and Miranda (2023) for strike-slip earthquakes. The epicenter for the larger magnitude mainshock was located relatively far from points of large slip and thus also provides an opportunity to investigate how well the epicentral transverse works in predicting the orientation of maximum response.
This work studies the directionality of ground motions recorded during the 2023 Kahramanmaras earthquake sequence, focusing on the Mw 7.8 and Mw 7.5 doublet. The orientation of maximum intensity for 5%-damped linear elastic oscillators subjected to the ground motions, as well as their spatial distribution, is investigated. The work of Poulos and Miranda (2023) is extended by investigating the orientation of maximum response with respect to the transverse orientation of a line segment connecting a station and the surface projection of the point of maximum slip. That is, the point of maximum slip is treated as the point source for radiation patterns, and its ability to predict the orientation of maximum intensity for the Türkiye doublet is investigated. A comparison between using maximum slip transverse and epicentral transverse is provided. The spatial distribution of polarization, which in this article refers to the amount of directionality quantified by the ratio between the minimum and maximum spectral response within the horizontal plane, and intensities at transverse and radial orientations are also evaluated. In addition, the possible influence of the level of polarization on the angular difference between the orientation of maximum intensity and epicentral transverse orientation is studied.
Selection of earthquake ground motion records
The Türkiye sequence initiated on 6 February 2023, at 01:17 (UTC) with the Mw 7.8 earthquake on a north-east-striking fault previously mapped as the Sakçagöz and Narlı segments of the Dead Sea fault (DSF) (Emre et al., 2018) and propagated to the Erkenek, Pazarcık, and Amanos segments of the East Anatolian Fault (EAF) in southern Türkiye. The epicenter for this first event occurred at 37.226°N, 37.014°E near the town of Şatırhüyük, in the Nurdağı district of the Gaziantep province, with a focal depth of 10 km (United States Geological Survey (USGS), 2023b). USGS focal mechanism solutions found the event, henceforth called the Mw 7.8 Kahramanmaras earthquake, occurred due to strike-slip faulting on a nodal plane with a strike of 228°, a rake of −1°, and a dip of 89°. The Mw 7.5 event occurred approximately 9 h after the first event at 10:24 (UTC) on the Sürgü and Çardak faults, which are splay faults of the EAF with an epicenter located northeast of Kahramanmaras at 38.011°N, 37.196°E. The focal depth for the event, henceforth called Mw 7.5 Elibistan earthquake, was 7.4 km, and the faulting style was strike-slip occurring on a nodal plane with a strike of 277°, a rake of 4°, and a dip of 78° (USGS, 2023a). Following the two major events, numerous aftershocks were recorded, with over 400 of the aftershocks having moment magnitudes greater than five (Earthquake Engineering Research Institute (EERI) and Geotechnical Extreme Event Reconnaissance Association (GEER), 2023). This article focuses only on the Mw 7.8 and 7.5 events.
The strong motion network operated by AFAD consists of the Turkish National Seismic Network (TNSN) and the Turkish National Strong Motion Network (TNSMN), initially installed with analog instruments in 1973 and updated over time to include over 327 stations with digital instruments by 2009 (Akkar et al., 2009). The considerable extent of shaking and the wide adoption of seismic instrumentation in Türkiye make this doublet two of the best-recorded strike-slip events with moment magnitudes above 7.4. Soon following the events, AFAD released the strong motions recorded in both networks (AFAD, 2023a, 2023b). This article uses the processed versions of these ground motion records. The record processing performed by AFAD followed the procedure proposed by Paolucci et al. (2011), which includes mean removal, baseline correction, instrument correction, and band-pass filtering using a second-order acausal frequency-domain Butterworth filter.
The strong motion records used in this study were selected based on the following criteria. First, since the study of directionality requires both horizontal components and their orientations, only stations that recorded both horizontal components and where the azimuths of each component are known were considered. Second, only records where at least one of the two as-recorded horizontal components had a peak ground velocity (PGV) of 1 cm/s were considered. This criterion guarantees a strong signal-to-noise ratio for a wide range of periods, especially for the long-period range. Finally, for records that passed the requirements above, the oscillator response was evaluated only up to the maximum usable period for the record (Boore, 2004), which was calculated as 1 divided by 1.25 times the low-pass corner frequency following the method of Abrahamson and Silva (1997). This last criterion is necessary to ensure that the signals used for long-period oscillators are suitable. The available records were then visually evaluated to identify and remove waveforms that had recording issues such as early termination or late start. Overall, a total of 231 records for the Mw 7.8 event and 222 records for the Mw 7.6 event passed the filtering criteria outlined above.
Orientation of maximum intensity
The most commonly used measure of ground motion intensity in earthquake engineering is the 5%-damped response spectral ordinate, which represents the peak response of a single-degree-of-freedom linear elastic oscillator with a damping ratio of 5% at different periods of vibration. The bidirectional response of a given oscillator can be computed when subjected to the two horizontal components recorded at a specific station, and the oscillator’s movement can be tracked to generate a vectorial trace of the response in the horizontal plane or hodograph. Figure 1 shows the spatial distribution of the recording stations considered for the Mw 7.8 Kahramanmaras earthquake and the relative displacement hodograph of 5%-damped oscillators for four different natural periods when subjected to the horizontal components of ground motions recorded at each station. See Figure ES2 in the electronic supplement for a similar figure but for the Mw 7.5 Elbistan earthquake. In these figures, each hodograph is normalized by the maximum spectral response at each station such that the normalized peak amplitude is the same for all stations. In general, the displacement traces shown in the figure have an approximately elliptical shape with major axes clearly larger than the minor axis, suggesting that the oscillator response tends to have a preferred orientation of larger intensity. It is apparent that across the four periods shown, the hodographs for stations that are in close geographic proximity to each other generally have similar displacement traces. These findings are consistent with the recent observations made by Poulos and Miranda (2023). In addition, it is apparent that the orientation of response in the hodographs of adjacent stations becomes even more similar as the period of oscillation increases.
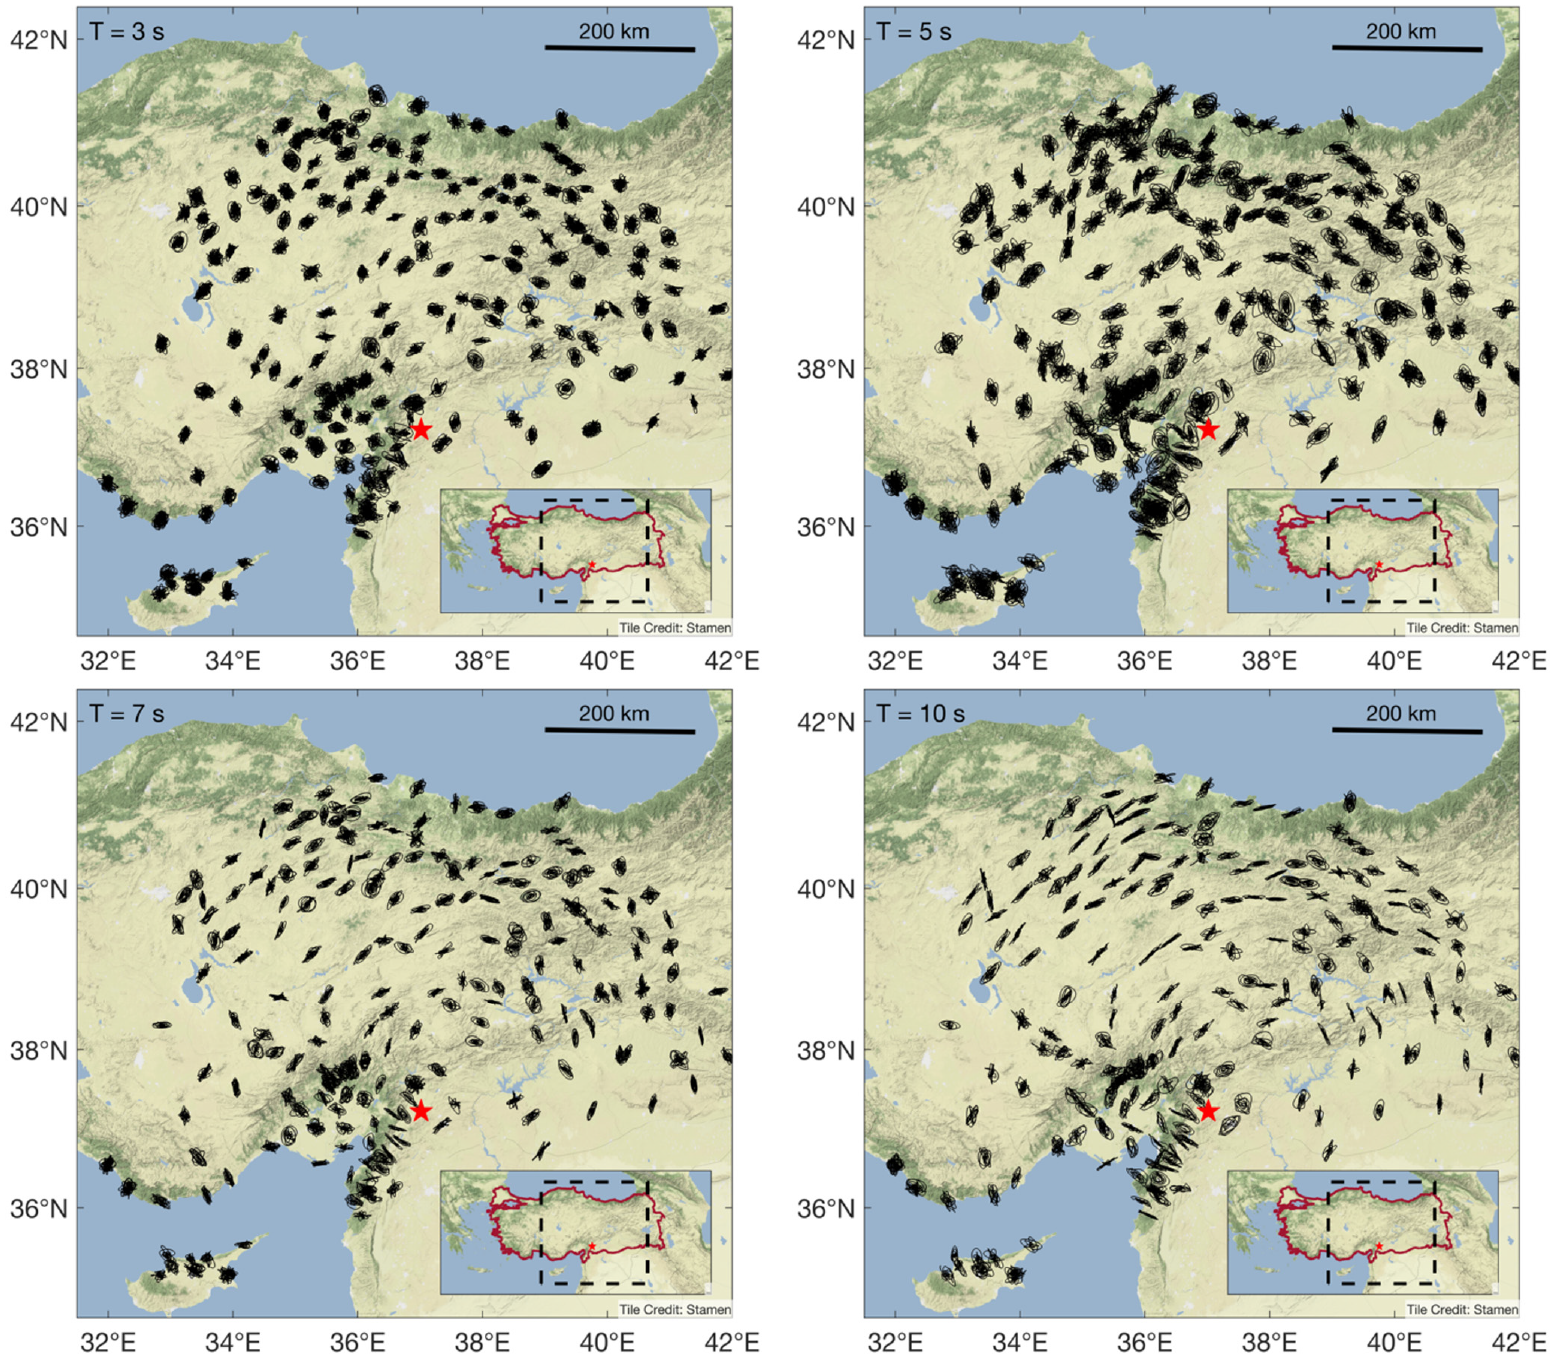
Spatial distribution of relative displacement hodographs of 5%-damped linear elastic oscillators subjected to ground motions recorded during the 2023 Mw 7.8 Kahramanmaras earthquake. Oscillator period is shown in the top left corner of each panel. The hodographs are normalized to fit inside a circle with a radius equal to the maximum recorded displacement.
The maximum spectral response at each recording station shown in Figure 1 corresponds to the point in the relative displacement history that is farthest from the resting point (origin) in each hodograph. For an oscillator with a given natural period and a relative displacement response history

As such, the orientation of maximum response corresponds to the orientation of this point farthest from the origin of each hodograph, defined as follows:

where
Alternatively, the maximum response can also be determined by first combining the two recorded horizontal responses into a single time series,


However, calculation with Equations 1 and 2 is significantly faster than with Equations 3 and 4. The orientation of maximum response is the azimuth associated with the maximum intensity within the rotations (Boore, 2010).
Poulos and Miranda (2023) defined the angular difference between the transverse orientation (i.e. the orientation that is perpendicular to a line segment connecting the station to the epicenter) and the orientation of maximum intensity as the angle α∈ [−90°, 90°]. This angle is measured with respect to the transverse orientation and is positive if the orientation of maximum intensity is counterclockwise and negative if clockwise. For this study, the direction of maximum intensity within the transverse orientation (clockwise or counterclockwise) is not important. Instead, the angular difference, |α| between 0° and 90° is used. In Figure 2, the colors of the circles at each station indicate the angular difference for the oscillators subjected to the Mw 7.8 event, with blue circles indicating the orientation of maximum response is closer to the transverse orientation and red circles indicating that the maximum response is closer to the radial orientation.
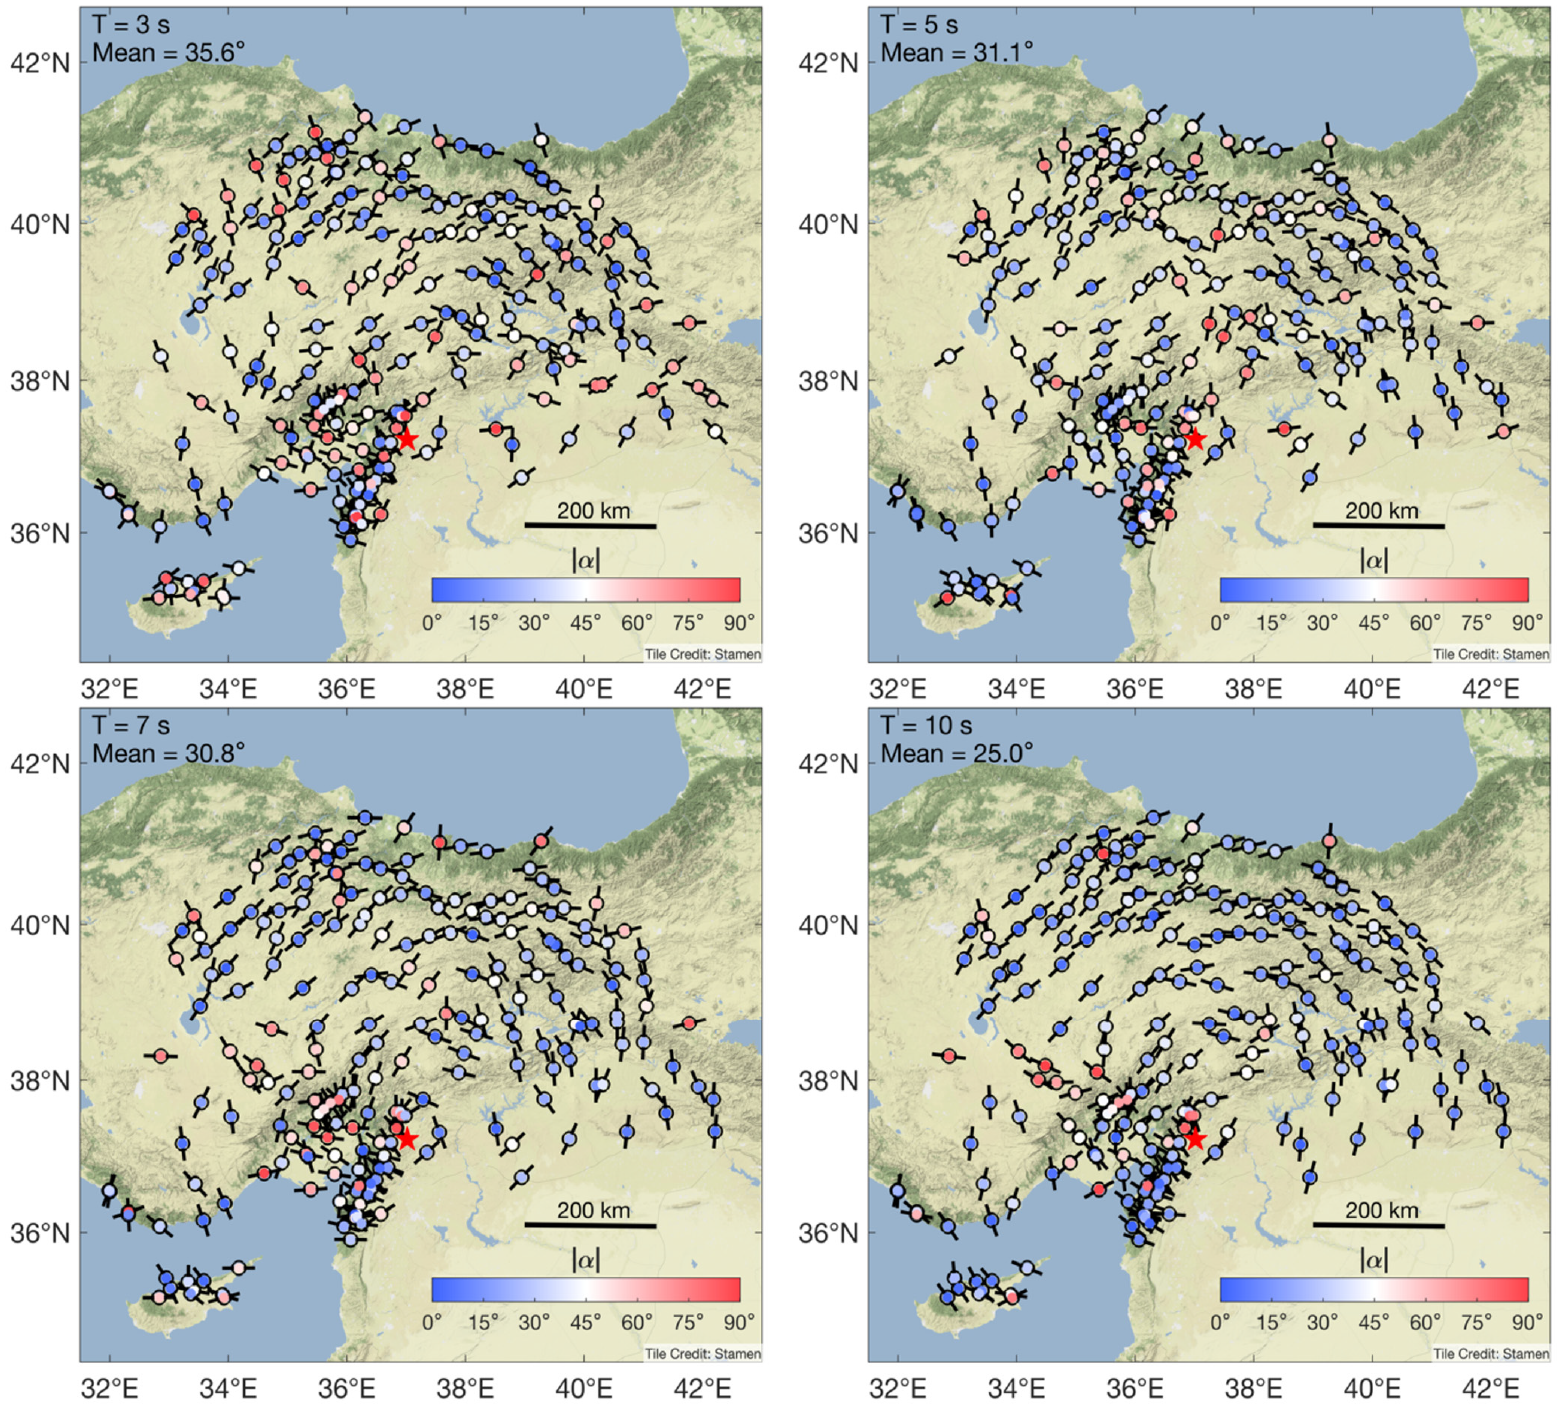
Orientation of maximum response of 5%-damped linear elastic oscillators subjected to recorded ground motions from the 2023 Mw 7.8 Kahramanmaras Earthquake and their angular difference with respect to the transverse orientation. The orientation of the maximum response at each station is shown by short black lines, and the angular difference is indicated by the color inside each circle. Oscillator period and mean |α| for each panel are shown in the top left corner.
Two main observations can be made from Figure 2. First, the orientation of maximum intensity, as indicated by the short black lines at each recording station, is similar for stations that are close to each other and, over the geographic region, appear to form a circular pattern around the epicenter. Second, most stations have blue-colored circles, suggesting that the predominant orientation of maximum intensity appears to be close to the transverse orientation. Both observations become more apparent as the oscillator period increases. See Supplemental Figure ES3 in the electronic supplement for a similar figure for the Mw 7.5 Elbistan earthquake.
As discussed in the introduction, Poulos and Miranda (2023) considered the epicenter to compute transverse orientations. However, ground displacements at a particular site are the result of the superposition of various waves generated by slip that occurs at different points on the rupture surface. Although the maximum slip location may be situated near the epicenter for smaller magnitude earthquakes, for large-magnitude events, it is not uncommon for the maximum slip location to be far away from the epicenter. Figure 3 shows the horizontal projection of the USGS (2023a, 2023b) finite fault models developed for the Mw 7.8 Kahramanmaras and Mw 7.5 Elbistan earthquakes. For the larger magnitude event, it is apparent that the location of maximum slip occurred far away from the epicenter (an approximate separation of 55.4 km), while for the Elbistan event, the locations practically coincide (an approximate separation of 4.8 km). For each rupture in Figure 3, a grid of hypothetical recording stations is included to show that the epicentral transverse orientation (shown by the blue lines) and the maximum slip transverse orientation (shown by the gray lines) are notably different in the near field for the case where the epicenter is located far from the point of maximum slip as it occurred in the Mw 7.8 main event, whereas the two orientations essentially coincide for the Mw 7.5 event.
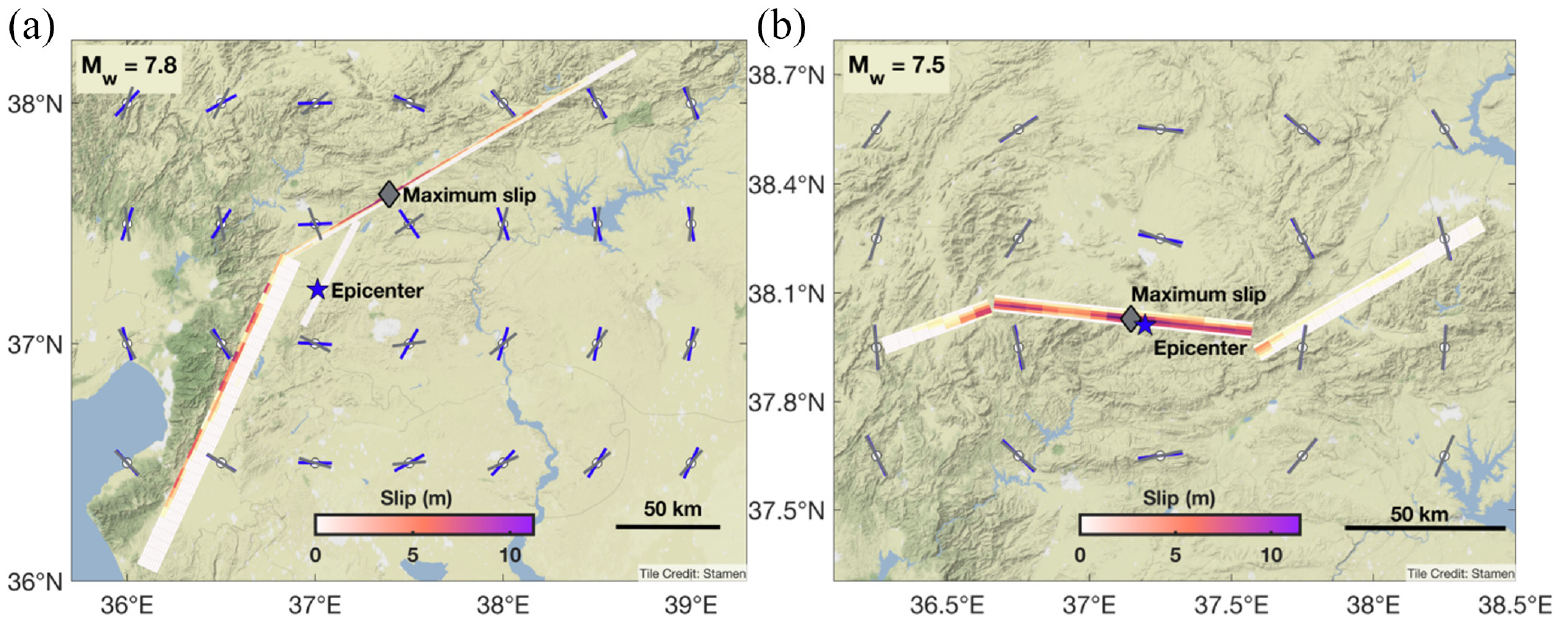
Horizontal surface projection of finite fault models for the (a) Mw 7.8 and (b) Mw 7.5 events per USGS (2023a, 2023b). The epicenter is indicated by the blue star, and the location of the maximum slip is indicated by the gray diamond. The epicentral transverse orientation at points surrounding the fault is shown by the short blue lines, while the maximum slip transverse orientation is shown by the short gray lines.
Since the location of the maximum slip is the primary contributor to the total slip that generated the earthquake, it may be a better center/source for the radiation patterns. To examine this, the angular difference between the orientation of maximum intensity and the maximum slip transverse orientation (i.e. perpendicular to a line segment connecting the station and the horizontal surface projection of the point of maximum slip) was computed for each station. This was then compared to |α| computed using the epicenter as done by Poulos and Miranda (2023). Figure 4 shows histograms of the angular difference between the orientation of maximum intensity and the epicentral or maximum slip transverse orientation for four different oscillators subjected to the Mw 7.8 Kahramanmaras earthquake. The oscillator periods used in these histograms are the same as those used for Figures 1 and 2.
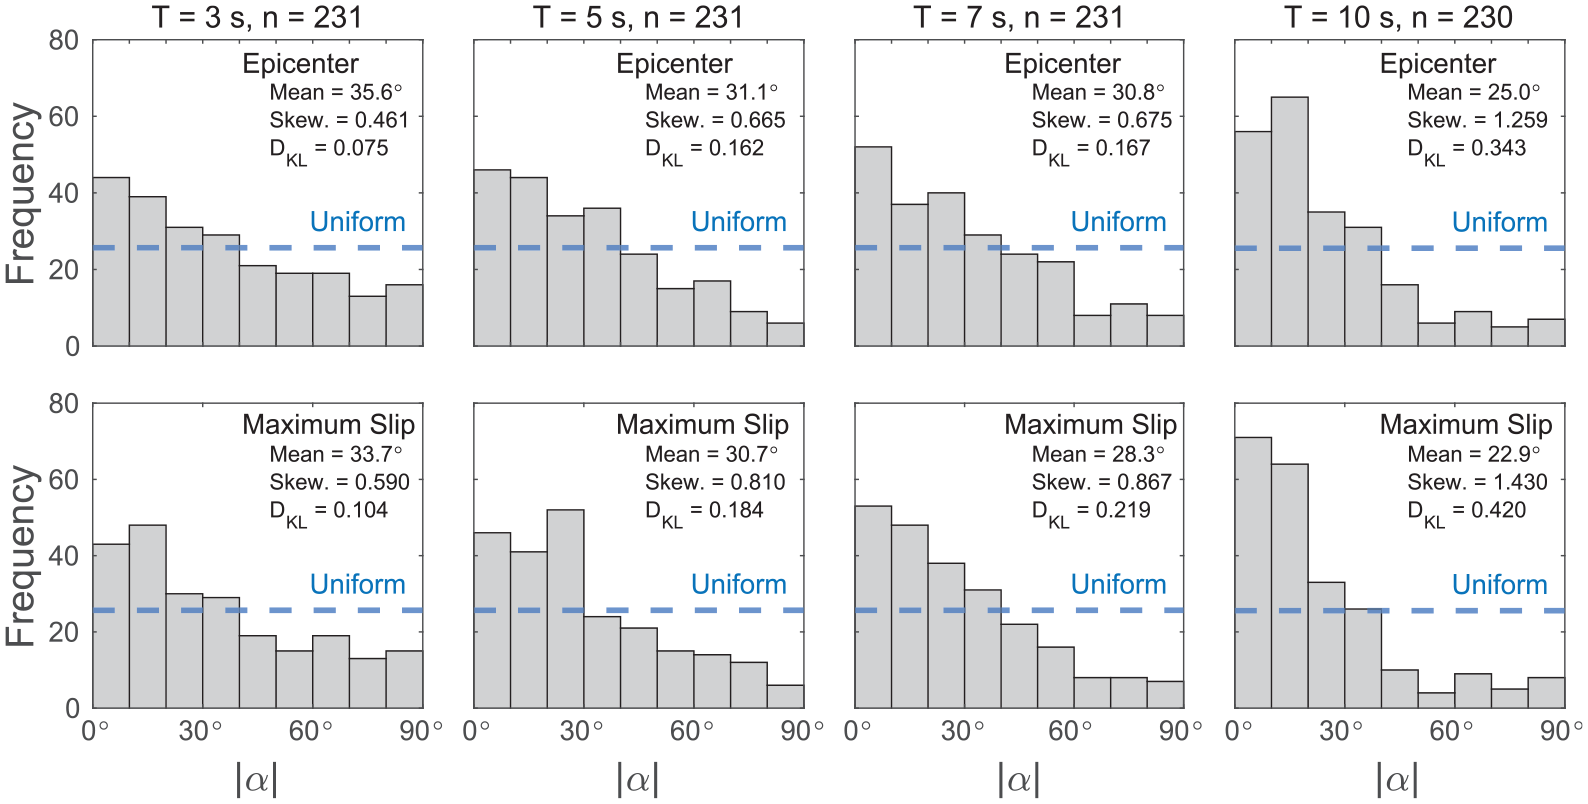
Histograms of the angular difference between the orientation of RotD100 and the transverse orientation for oscillators subjected to ground motions recorded during the 2023 Mw 7.8 Kahramanmaras earthquake with periods of T = 3 s, T = 5 s, T = 7 s, and T = 10 s. The dashed lines represent the histogram should the orientation of RotD100 be uniformly distributed with respect to the transverse orientation.
From Figure 4, it can be observed that, regardless of whether the epicentral transverse or the maximum slip transverse orientation is considered, the histograms are heavily skewed to small values of |α| and have, in all cases, mean angular differences notably below 45°. Should the orientation of maximum spectral response be equally likely with respect to either the epicentral or maximum slip transverse orientation, the distribution would be more uniform, as indicated by the dashed blue lines, and would have a mean closer to 45°. Inset in each histogram is the Kullback–Leibler divergence (DKL) (Kullback and Leibler, 1951), which, in this case, measures how much the observed distribution of the histogram differs from a uniform distribution. For reference, a theoretical triangular distribution with maximum density at 0° and 0 density at 90° would have a DKL value of 0.1931 relative to a uniform distribution. The DKL value would be 0 if the empirical distributions are perfectly uniform. However, the DKL values provided on each histogram indicate that the empirical distributions are notably different from a uniform distribution, and the maximum intensity tends to occur closer to the transverse orientation. See Supplemental Figure ES4 in the electronic supplement for a similar figure for the Mw 7.5 Elbistan earthquake.
The second significant observation from Figure 4 is that mean |α| tends to be smaller when using the location of maximum slip as the point source than when using the epicenter. Furthermore, for the four periods, using the point of maximum slip to compute the transverse orientations leads to larger skewness coefficients, again indicating that this is a better point source for estimating the orientation of maximum response. To better understand the influence of period on the orientation of maximum response, Figure 5a shows the variation of mean |α| with oscillator period.
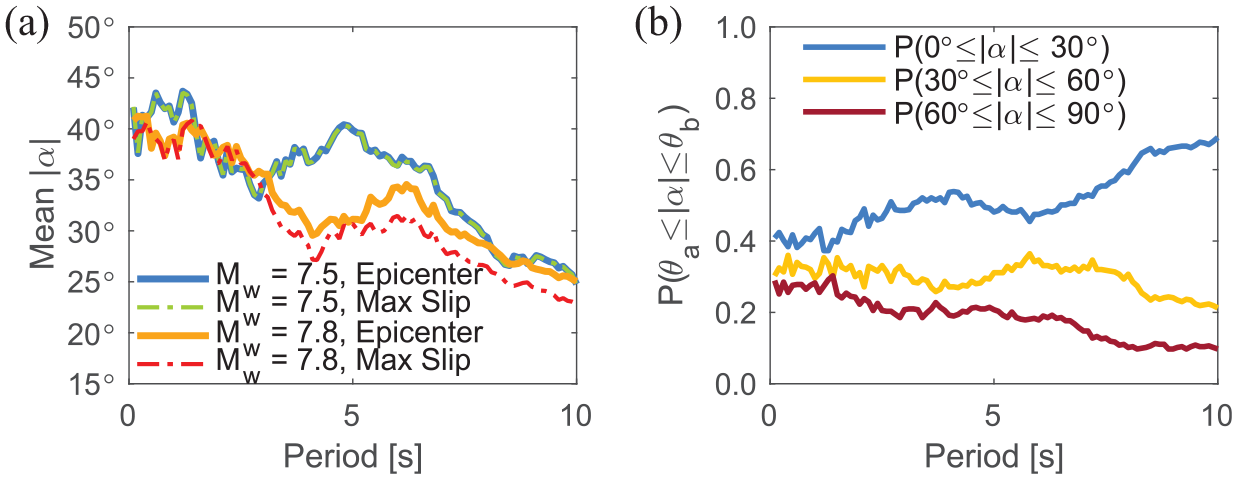
(a) Influence of oscillator’s period of vibration on the mean angular difference between the orientation of RotD100 and the transverse orientation for oscillators subjected to recorded ground motions from the 2023 Kahramanmaras earthquake doublet. The solid lines represent the mean angular difference computed with respect to the epicentral transverse orientation while the dash-dot lines represent the mean angular difference computed with respect to the transverse orientation of the point of maximum slip. (b) Probability of the angular difference between the orientation of RotD100 and the epicentral transverse orientation being between [0°, 30°], [30°, 60°], and [60°, 90°].
Figure 5a confirms that the mean orientation of maximum intensity is, with the exception of a narrow range of periods, closer to the maximum slip transverse orientation for the Mw 7.8 event where the location of maximum slip is far from the epicenter. In contrast, there is almost no difference in mean |α| for the Mw 7.5 event where the location of the epicenter and maximum slip practically coincide. This suggests that for these earthquakes, the orientation transverse of the maximum slip is better than the epicentral transverse at estimating the orientation of maximum intensity and is likely to be the case for other large-magnitude strike-slip earthquakes. In addition, Figure 5a shows that mean |α| tends to decrease with increasing period, meaning that the orientation of maximum intensity gets closer to the epicentral or maximum slip transverse orientation with increasing period. This is further illustrated by Figure 5b, where the probability of being within 30° of the epicentral transverse shows a tendency to increase with period. For the Türkiye doublet, the probability that the orientation of maximum spectral response is within 30° of the epicentral transverse was two to six times higher than the probability of being within 30° of the radial orientation.
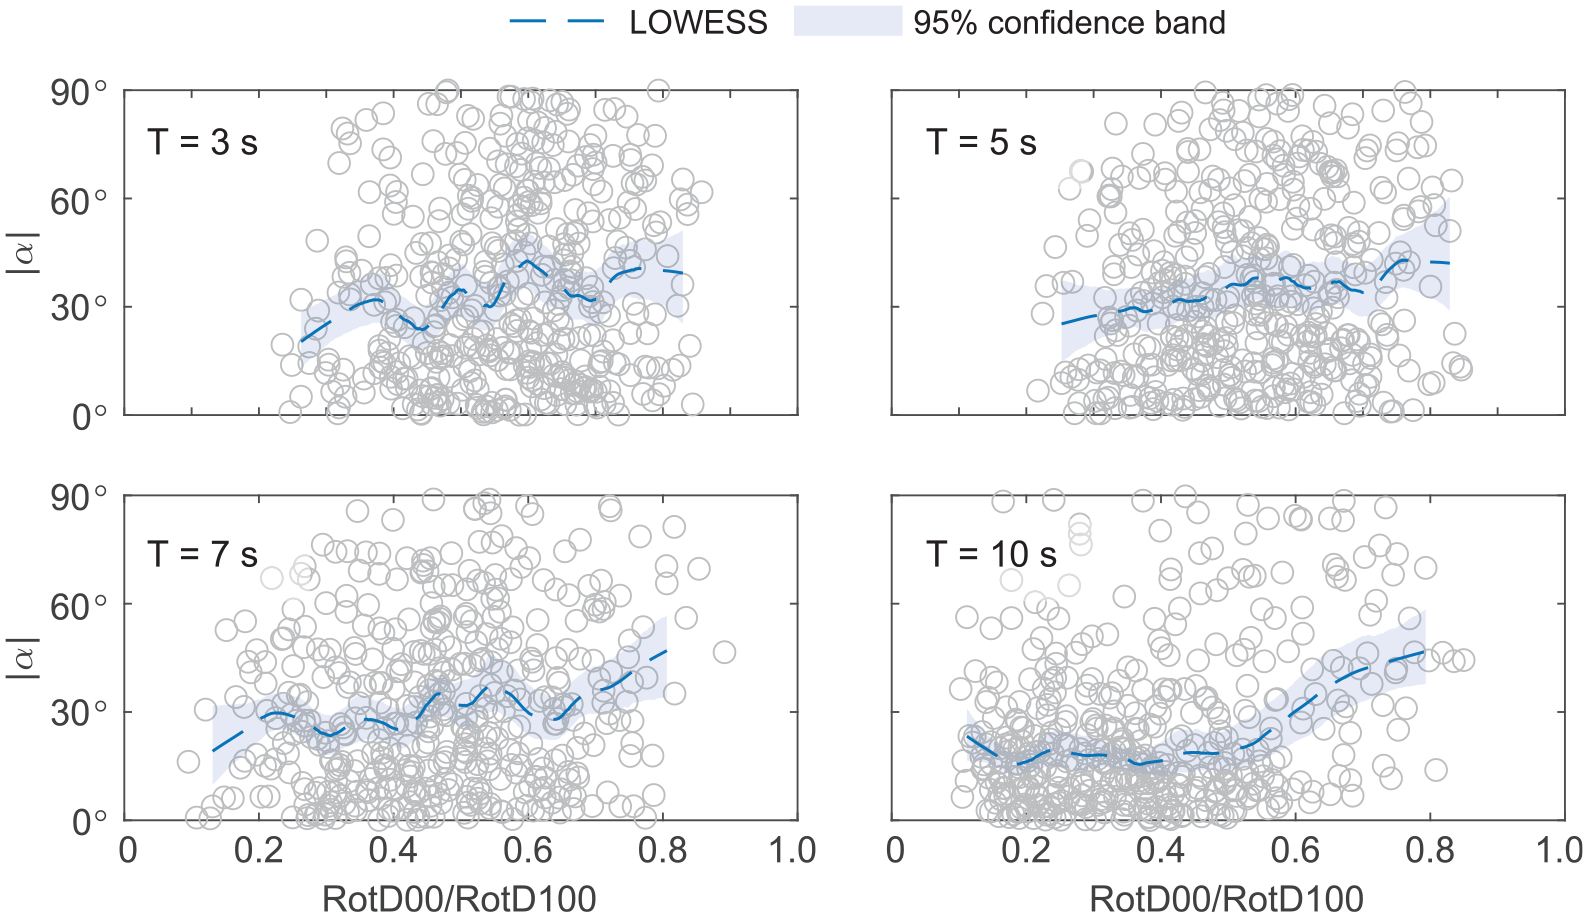
Although Poulos and Miranda (2023) investigated the orientation of maximum intensity with respect to the epicentral transverse, they did not evaluate the influence of source-to-site distance on |α|. Figure 6 evaluates the possible influence of Joyner–Boore distance on |α| for oscillators subjected to both the Mw 7.8 and 7.5 events. Also shown in each of the scatter plots is the change in angular difference with increasing distance to the rupture using locally weighted scatterplot smoothing (LOWESS) and its corresponding 95% confidence band computed using bootstrapping. Figure 6 suggests that the distance to the source does not have a notable influence on the orientation of maximum intensity with respect to either the epicentral or maximum slip transverse for the Türkiye earthquake doublet. The orientations of maximum spectral response remain closer to the epicentral and/or maximum slip transverse orientations than a uniform distribution case (as demonstrated by mean |α| values notably below 45°) for all Joyner-Boore distances, indicating that there is a predominant orientation of maximum spectral response at distances greater than 5 km and this continues to be the case even for distances as far as 400 km.
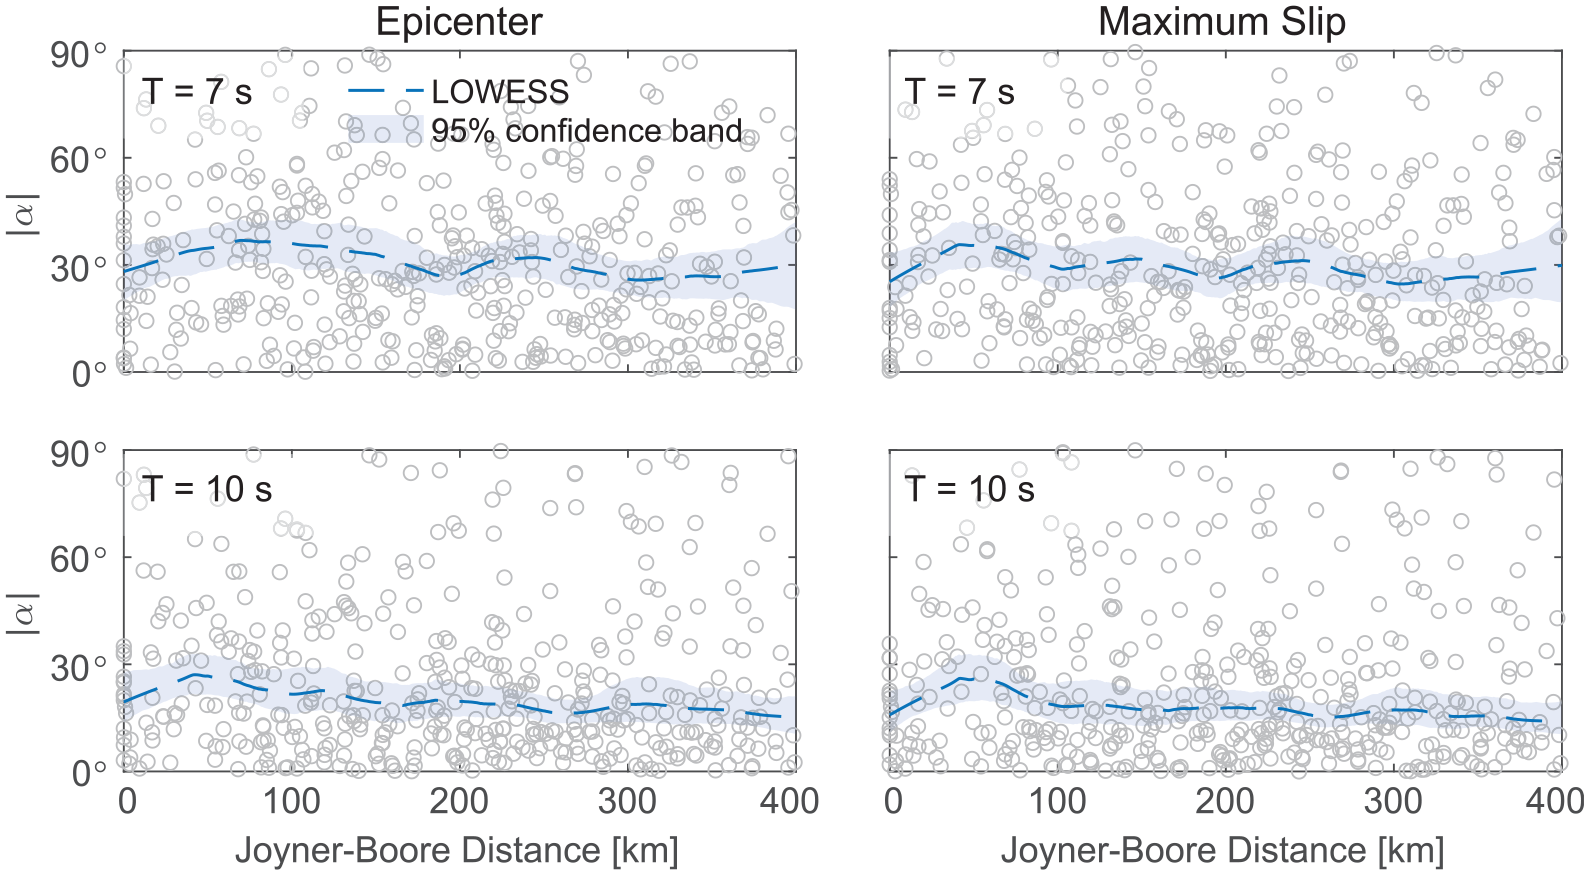
Evaluation of the possible influence of Joyner–Boore distance on the angular difference between the epicentral transverse orientation and the orientation of RotD100 for oscillators with periods of T = 7 s and T = 10 s. The dashed line represents locally weighted scatterplot smoothing (LOWESS), and the shaded area represents 95% confidence bands. These results consider both the Mw 7.5 and 7.8 events (a total of 453 records at 7 s and 452 records at 10 s).
Spatial distribution of polarization in recorded ground motions
As discussed in the prior section, the observed hodographs in Figure 1 tend to have bidirectional responses characterized by elongated elliptical shapes. An oscillator’s response is said to be polarized if it exhibits a notably larger intensity in certain orientations than in others. The level of polarization can be qualitatively seen in the shape of the hodographs at each station. However, since there are numerous stations and oscillator periods considered, a quantitative measure of polarization is preferred so that trends can be investigated. In previous studies, the most common method of quantifying the level of polarization has been computing ratios between two scalar intensities for a given station. For example, Shahi and Baker (2014) quantified the level of polarization through the ratio of maximum spectral response (RotD100) and the median spectral response of all orientations (RotD50). An unpolarized ground motion would have a RotD100/RotD50 ratio close to 1, whereas a fully polarized motion would have a ratio of
Another method of quantifying the level of polarization is by using the
Figure 7 shows the spatial distribution of the level of polarization as measured by RotD00/RotD100 for 5% damped oscillators with four different fundamental periods when subjected to ground motions recorded during the Mw 7.8 Kahramanmaras earthquake. The level of polarization is indicated by the color inside the circle located at each recording station. Stations with low RotD00/RotD100 ratios (i.e. strongly polarized records) are indicated by red circles, and stations with high RotD00/RotD100 ratios (i.e. records that are not strongly polarized) are indicated by yellow circles. It can be observed that as the oscillator period increases, the level of polarization increases. For 10 s oscillators, most stations are red-orange-colored, indicating they are strongly polarized. Furthermore, many stations that are far from the epicenter and/or rupture are orange/red colored, implying that even stations far away from the rupture can exhibit strong levels of polarization. Even at 3 s, a large percentage of the stations far from the rupture are orange-colored and hence fairly polarized. Similar results were obtained for the Mw 7.5 Elbistan earthquake, which are available in Supplemental Figure ES5 of the electronic supplement.
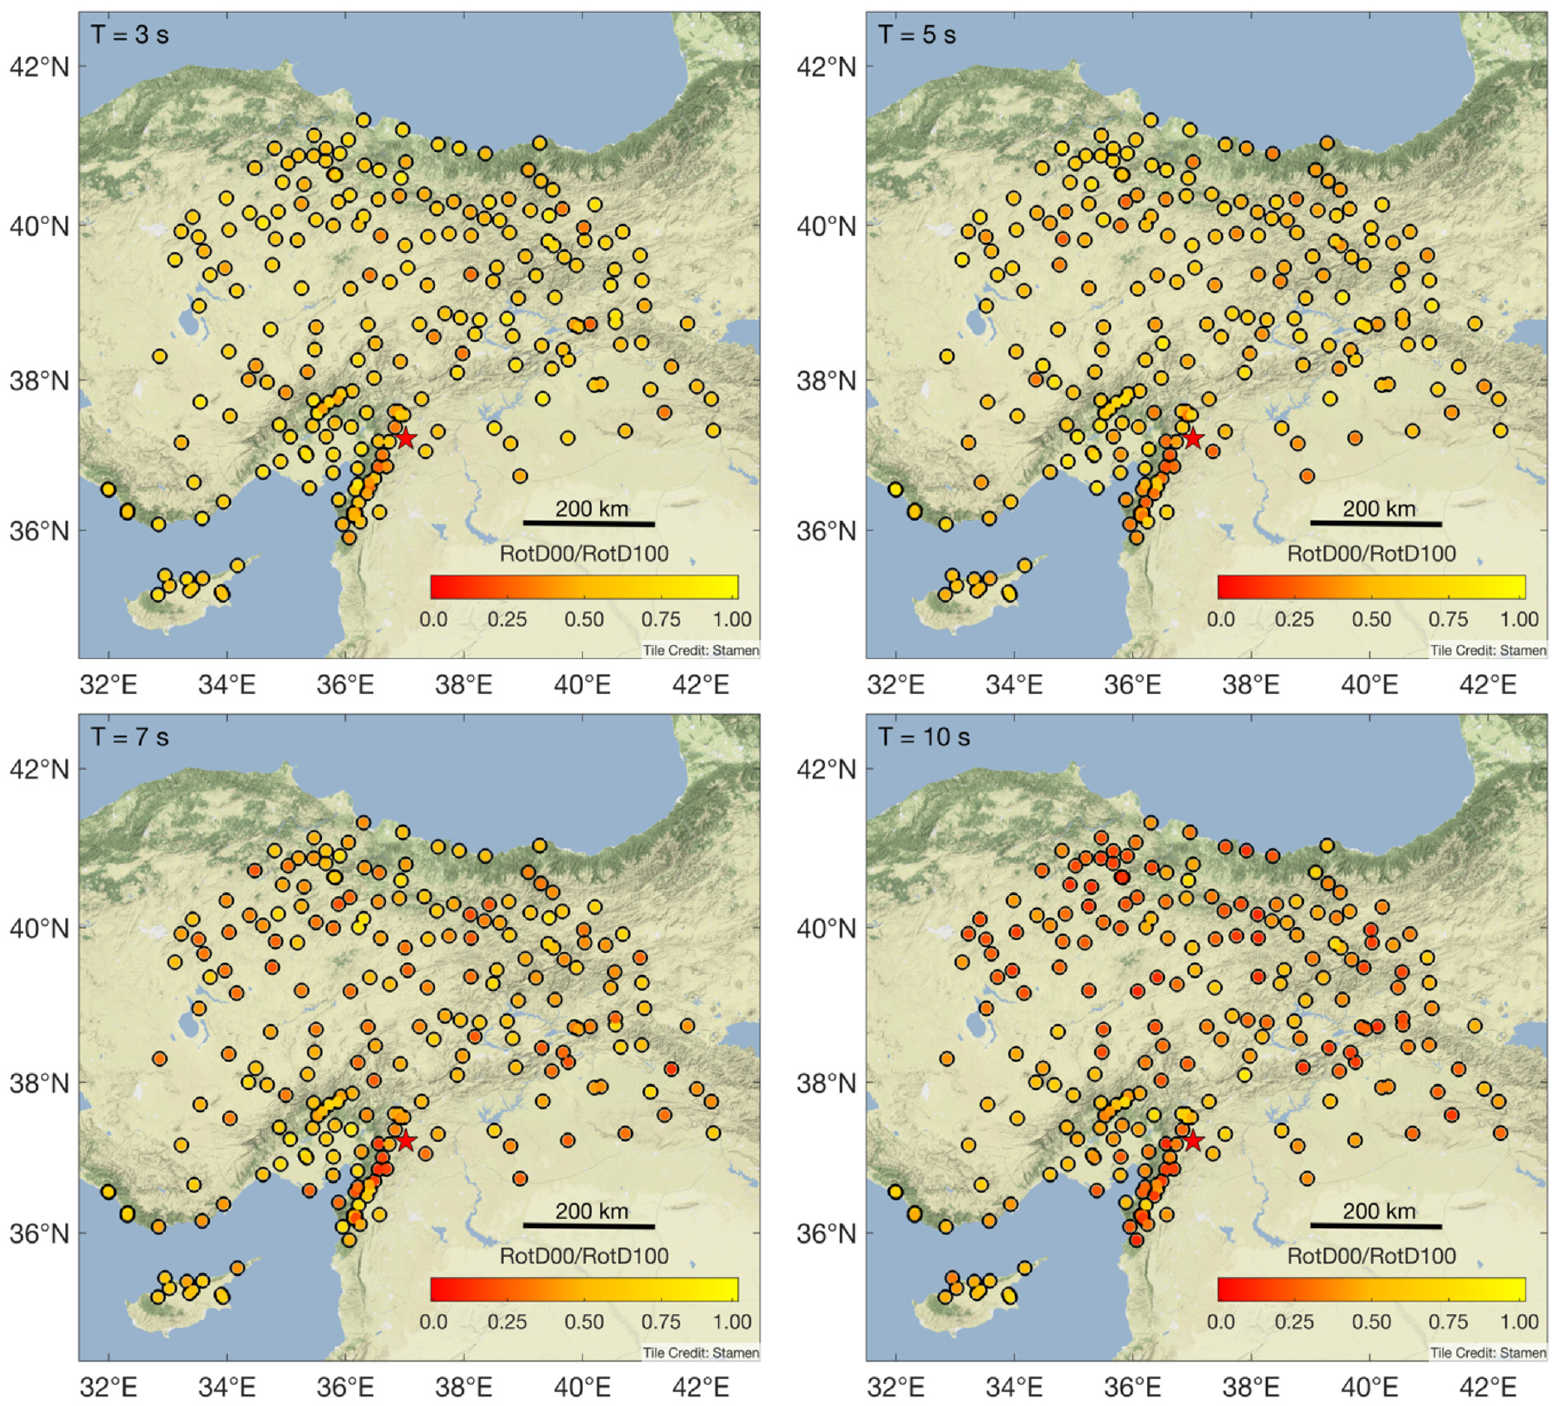
Geographic distribution of RotD00/RotD100, for 5%-damped linear elastic oscillators subjected to recorded ground motions from the 2023 Mw 7.8 Kahramanmaras earthquake for T = 3 s, T = 5 s, T = 7 s, and T = 10 s. A fully polarized motion would be represented by a bright red circle, and a fully unpolarized motion would be shown by a bright yellow circle.
The influence of distance on the level of polarization for the Türkiye doublet is further examined in Figure 8, which shows RotD00/RotD100 ratios as a function of distance to the source as measured by Joyner–Boore distance. In this figure, each point on the graph represents a recording station, and the dashed blue line shows a LOWESS with a 95% confidence band. From this figure, it can be seen that, with the exception of sites less than 25 km from the rupture where the level of polarization decreases with increasing distance, the level of polarization, in general, remains relatively constant even at very long distances (e.g. 400 km). It is important to note that even at 400 km, the mean RotD00/RotD100 at 10 s is approximately equal to 0.4, which is still significantly polarized. Figure 8 also shows that as the oscillator period increases, the scattered points tend to move downward, indicating an increase in the level of polarization. This is further emphasized by Figure 9, which shows that the mean level of polarization increases almost linearly with a period. The interquartile range for the observations, represented by the shaded bands in Figure 9, shows that although there is some variability in the level of polarization, it is generally not very large.
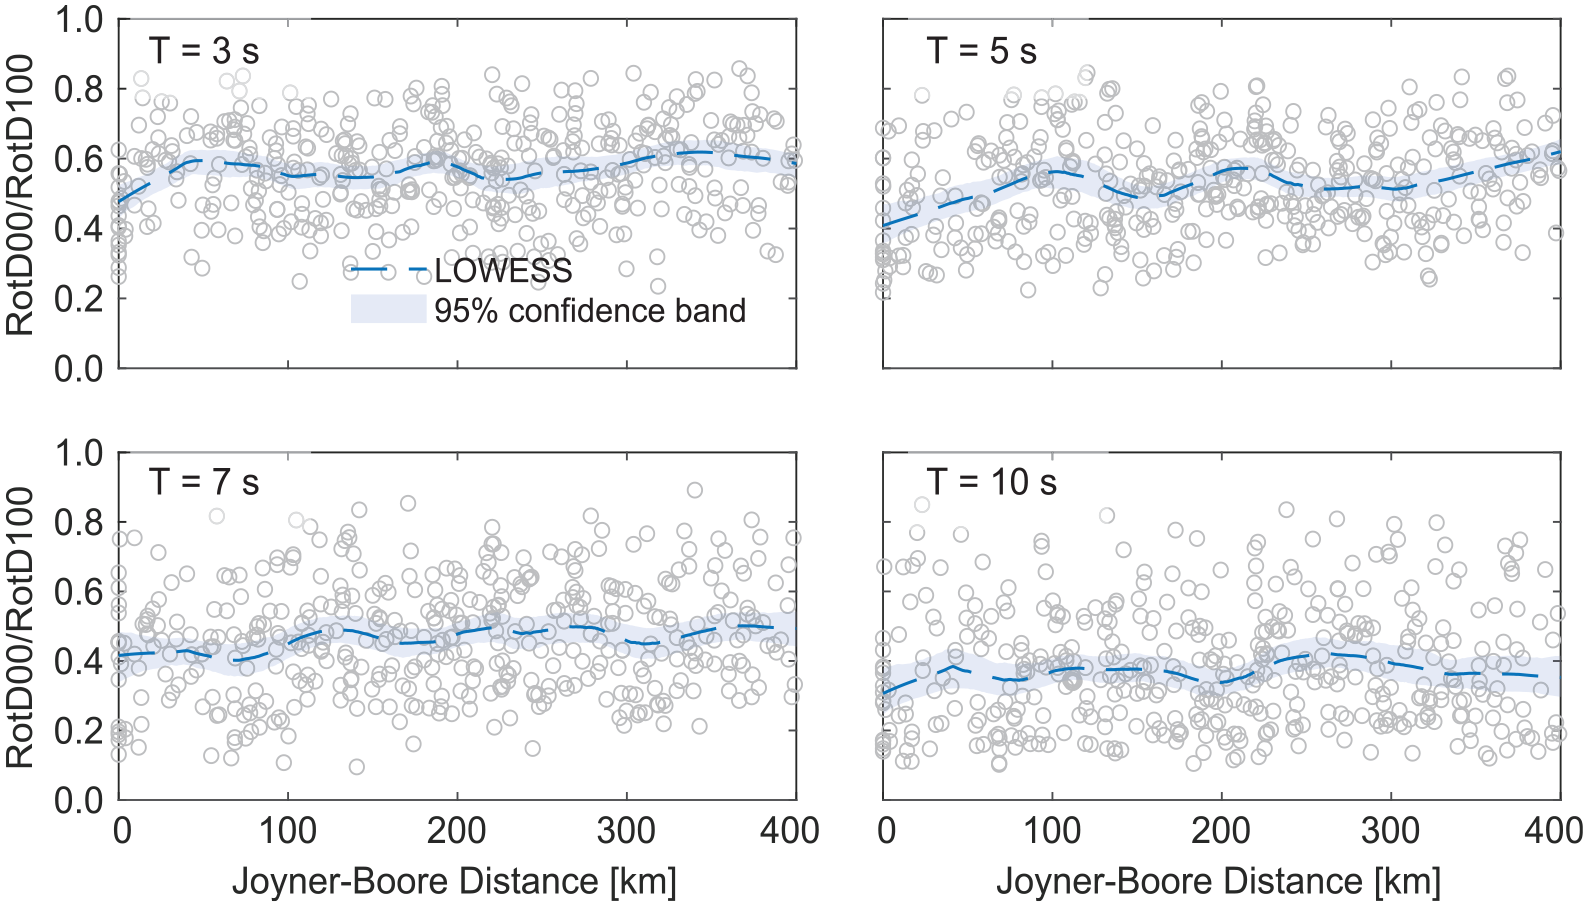
Influence of Joyner-Boore distance on the level of polarization, as measured by RotD00/RotD100, for 5%-damped linear elastic oscillators with periods of 3 s, 5 s, 7 s, and 10 s. The dashed line represents locally weighted scatterplot smoothing (LOWESS) considering both the Mw 7.5 and 7.8 events (a total of 453 records at 7 s and 452 records at 10 s).
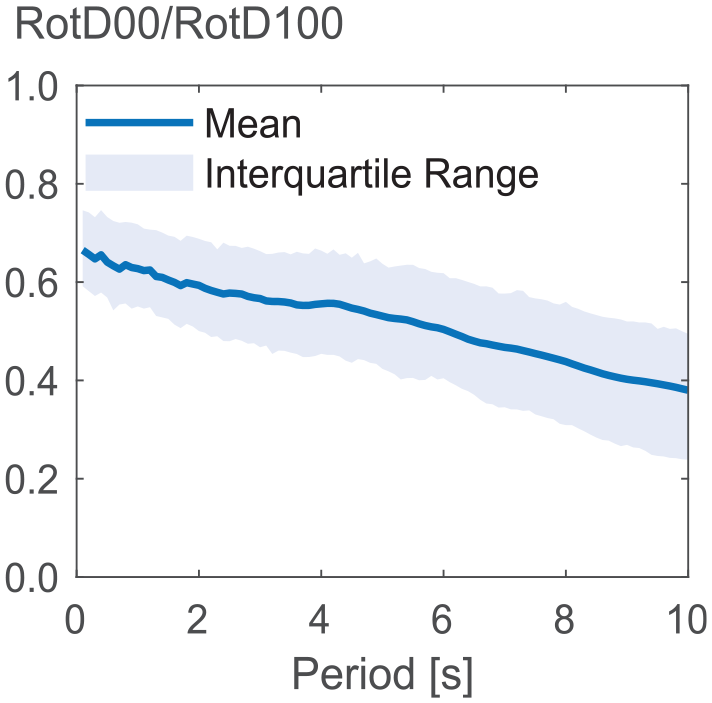
Influence of period of vibration on level of polarization, as measured by the mean ratio of RotD00/RotD100, for 5%-damped linear elastic oscillators. Shaded bands around the means represent the interquartile range of this ratio at each period.
So far, it has been illustrated that recorded ground motions in the Türkiye doublet are polarized even at short periods and tend to become more polarized with increasing periods. It has also been shown in the previous section that the orientation of maximum spectral response appears to be close to the epicentral or maximum slip transverse orientation. Combining both observations, it would be of interest to determine whether the level of polarization is correlated with the orientation of maximum intensity. Figure 10 examines the possible influence of polarization of recorded ground motion on the angular difference between the orientation of maximum spectral response and the epicentral transverse orientation for four oscillator periods subjected to both events in the Türkiye doublet. Scatterplot smoothing was performed starting at points from the ends where at least 1% of the total data points are available. This is necessary since the smoothing is highly sensitive to the small number of data points at the tails that may not be representative of the trends (i.e. this region is characterized by very wide confidence bands).
Evaluation of the possible influence of the level of polarization, as measured by RotD00/RotD100, on the angular difference between the epicentral transverse orientation and the orientation of RotD100 for periods of T = 3 s, T = 5 s, T = 7 s, and T = 10 s. The dashed line represents locally weighted scatterplot smoothing (LOWESS) considering both the Mw 7.8 and 7.5 events. LOWESS was performed starting and ending at points where at least 1% of the data points were available.
As shown in Figure 10, the scatter points are generally clustered toward the bottom (i.e. toward low values of |α|). As the period of oscillator increases, the cluster in the bottom quadrant of the plots gets denser and shifts toward the left, with more stations simultaneously exhibiting high polarization and an orientation of maximum intensity closer to the epicentral transverse orientation. Furthermore, the LOWESS for each period suggests that as the level of polarization decreases (i.e. RotD00/RotD100 increases), |α| tends to increase. This means that the epicentral transverse orientation may be good at estimating the orientation of maximum response for highly polarized motions but may not be as good for motions with a small level of polarization. This observation is important because, if the motion is strongly polarized, it shows a clear orientation with strong intensity, and the estimation of this orientation becomes important. Meanwhile, if the motion is not strongly polarized, determining its orientation of maximum response is not as important.
Seismic intensity at transverse and radial orientations
In the prior two sections, it has been shown that the orientation of maximum intensity for the Türkiye doublet tends to be close to the epicentral or maximum slip orientations, consistent with the findings of Poulos and Miranda (2023) for strike-slip earthquakes. Awareness of the orientations where strong and weak spectral responses will occur could be beneficial in the development of orientation-dependent GMMs. Most current GMMs, including those used in the NGA-West2 project (e.g. Boore et al., 2014), predict only the median intensity (i.e. RotD50) of all orientations. However, engineering design standards in the United States use the maximum intensity (RotD100). If the intensity of the transverse orientation is used to estimate the maximum intensity, then it would be important to study the intensity at the transverse orientation relative to that of RotD50. This can be achieved by computing the ratio of the intensity at the transverse orientation to the RotD50 intensity (SaT/SaRotD50). This ratio can be used as a conversion factor to transform RotD50 intensities estimated using existing GMMs to the intensity at the transverse orientation, which can then be used for engineering design. Figure 11 shows the distribution of the ratio between the spectral response at the transverse or radial orientation and RotD50 for four oscillator periods subjected to records obtained in the Türkiye doublet. Note that, at any orientation, the largest possible intensity is RotD100. Thus, the largest value any SaX/SaRotD50 ratio can take is
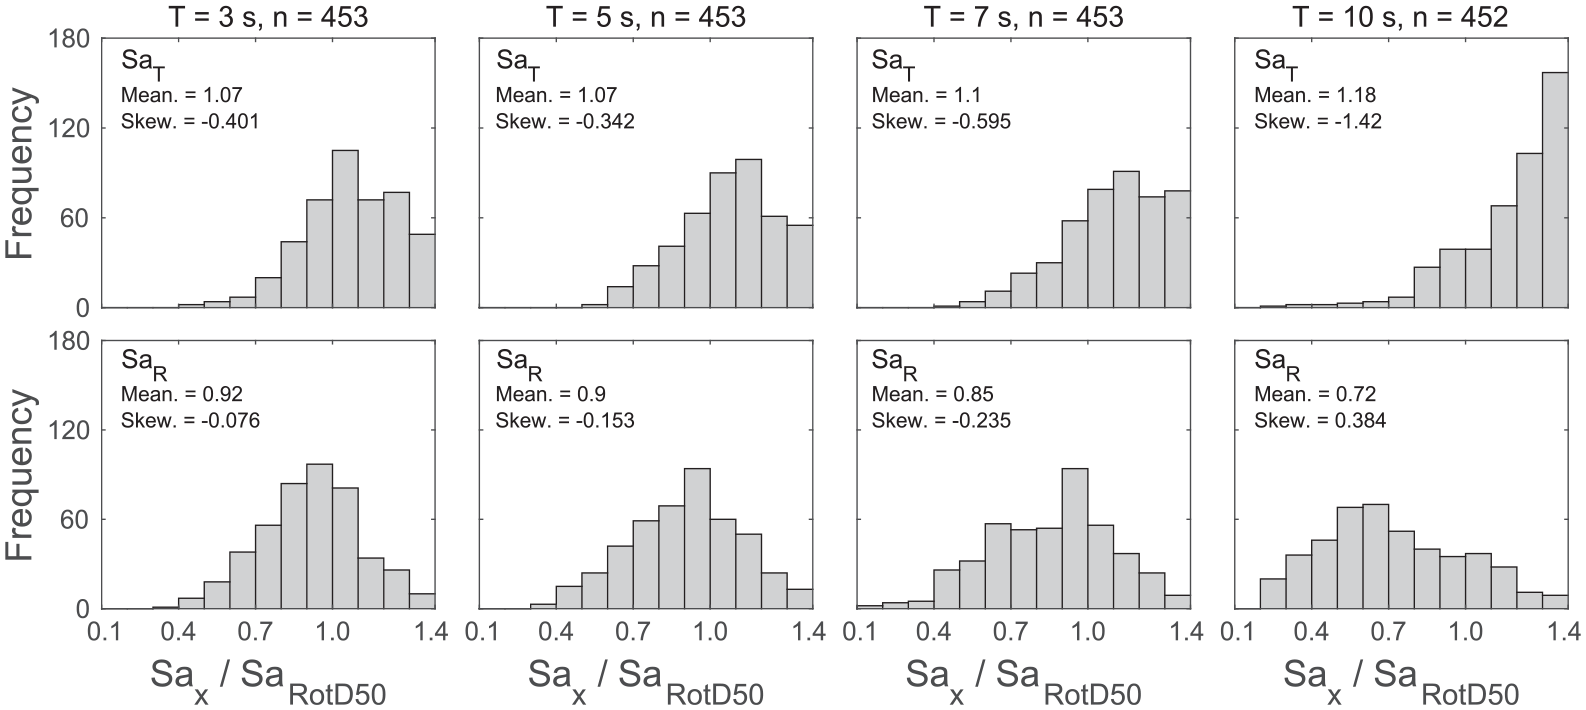
Histograms of the ratio between the ground motion intensity at the transverse or radial orientation and the median intensity (i.e. RotD50) for oscillators with fundamental periods of T = 3 s, T = 5 s, T = 7 s, and T = 10 s. The sample size is indicated for each period and includes both the Mw 7.8 and 7.5 events in the sequence.
Multiple observations can be made from Figure 11. The intensity in the transverse orientation (top row) is notably larger than in the radial orientation (bottom row) at the four periods shown. Moreover, this difference in intensity between the transverse and radial orientations increases as the oscillator period increases. This variation with the oscillator period is further evaluated in Figure 12a, where the mean intensity in the transverse orientation increases nonlinearly from approximately 1.09 times the radial intensity at short periods to about two times the radial intensity for an oscillator of 10 s. Figure 11 also shows that the mean of SaT/SaRotD50 shifts to the right and gets more skewed with increasing periods. At a period of 10 s, more than 34% of the ratios are larger than 1.3. In contrast, the opposite trend is observed for SaR/SaRotD50, with the mean shifting to the left with increasing period. Thus, the intensity at the transverse orientation is significantly above the median intensity of all orientations for most recording stations, while the opposite holds for the radial orientation.
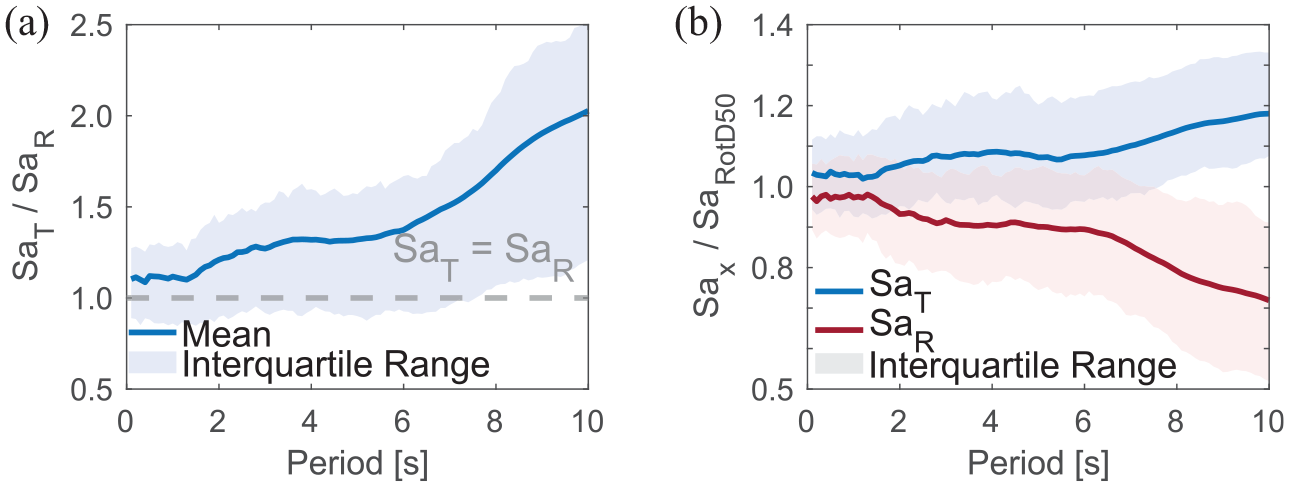
Influence of period of vibration on the mean ratio between (a) the intensity at the transverse orientation and the radial orientation and (b) the intensity at the transverse orientation or radial orientation and the RotD50 intensity. Shaded bands around the means indicate the interquartile range at each period.
To better understand the influence of period, Figure 12b plots the variation in the mean SaT/SaRotD50 ratio and SaR/SaRotD50 ratio. The figure further illustrates the observations made in the histograms of these ratios for four periods. In particular, Figure 12b shows that mean SaT/SaRotD50 ratios increase with period from approximately 1.02 at low periods to 1.17 at 10 s. In contrast, mean SaR/SaRotD50 ratios decrease at a more rapid rate from 0.98 at low periods to 0.73 at 10 s. Figures 11 and 12 imply that, for this earthquake doublet, the mean intensity from all orientations in the epicentral transverse orientation systematically exceeds the median intensity for all oscillator periods, while intensities at the radial orientation are practically always lower than RotD50 at all periods of vibration. These SaT/SaRotD50 ratios identified can be used to develop correction factors for GMMs to eliminate the systematic underestimation of ground motion intensities at the transverse orientation.
Summary and conclusions
The directionality of ground motions recorded during the 6 February 2023, Mw 7.8 Kahramanmaras and Mw 7.5 Elbistan earthquakes in the Türkiye doublet has been investigated. The orientation of the 5%-damped maximum spectral response and its spatial distribution have been carefully studied. The spatial distribution of the level of polarization and intensity at specific orientations was also investigated.
At present, the consensus for cases with no strong site effects is that at distances greater than 5 km from the rupture, ground motions do not have a predominant orientation. In this article, it was found that the orientation of maximum response is systematically close to the epicentral transverse orientation (i.e. orientation perpendicular to a line segment connecting the epicenter to the station), consistent with previous observations by Poulos and Miranda for other strike-slip earthquakes.
For the Mw 7.8 event, where the point of maximum slip was relatively far from the epicenter, it was found that the orientation of maximum response is, on average, closer to the orientation perpendicular to the maximum slip transverse orientation (i.e. perpendicular to a line connecting the station to the projection of the point of maximum slip) when compared to the epicentral transverse orientation. This suggests that the maximum slip transverse orientation may be a better estimator for orientation of maximum response in large-magnitude earthquakes where rupture size becomes important in the near field, although further study using more events is warranted. Furthermore, the orientation of maximum response was found to be close to the epicentral or maximum slip transverse for Joyner–Boore distances up to 400 km, indicating that for strike-slip earthquakes there is a predominant orientation even at long distances to the rupture. These findings further support the case for the development of orientation-dependent GMMs where the orientation of maximum response is predicted by either the epicentral or maximum slip transverse orientation.
Response of oscillators subjected to the Mw 7.8 Kahramanmaras and Mw 7.5 Elbistan earthquakes were found to be fairly polarized at short periods and highly polarized at long periods. Polarized motions were observed over large geographical areas, and Joyner–Boore distances up to 400 km. As ground motion records become more polarized, the orientation of maximum intensity tends to be closer to the epicentral or maximum slip transverse. Finally, the intensity at the epicentral transverse orientation was, on average, 1.02 to 1.17 times larger than the median intensity from all orientations (RotD50) (depending on the period), indicating that current GMMs systematically underestimate the ground motion intensity in the transverse orientation in strike-slip earthquakes. These types of results can be used in the future to improve the estimation of the ground motion intensity at specific orientations.
Supplemental Material
sj-docx-1-eqs-10.1177_87552930231203989 – Supplemental material for Directionality and polarization of response spectral ordinates in the 2023 Kahramanmaras, Türkiye earthquake doublet
Supplemental material, sj-docx-1-eqs-10.1177_87552930231203989 for Directionality and polarization of response spectral ordinates in the 2023 Kahramanmaras, Türkiye earthquake doublet by Nathan Girmay, Alan Poulos and Eduardo Miranda in Earthquake Spectra
Footnotes
Acknowledgements
The authors are grateful to the Turkish Disaster and Emergency Management Authority (AFAD), which operates the Turkish National Strong Motion Network, for installing and maintaining strong motion instrumentation in Türkiye and for collecting, processing, and distributing the ground motions used in this study through their Turkish Accelerometric Database and Analysis System (TADAS). The authors would also like to thank Dr M. Abdullah Sandikkaya and Dr Sinan Akkar for the information they provided on the strong motion recordings in the Türkiye earthquakes.
Declaration of conflicting interests
The author(s) declared no potential conflicts of interest with respect to the research, authorship, and/or publication of this article.
Funding
The author(s) disclosed receipt of the following financial support for the research, authorship, and/or publication of this article: The authors would like to thank the financial support they received that allowed them to conduct this investigation. The first author received funding from the John A. Blume fellowship from Stanford University. The second author received funding from the National Agency for Research and Development (ANID)/Doctorado Becas Chile/2019-72200307, and from the Nancy Grant Chamberlain Fellowship from Stanford University.
Supplemental material
Supplemental material for this article is available online.
References
Supplementary Material
Please find the following supplemental material available below.
For Open Access articles published under a Creative Commons License, all supplemental material carries the same license as the article it is associated with.
For non-Open Access articles published, all supplemental material carries a non-exclusive license, and permission requests for re-use of supplemental material or any part of supplemental material shall be sent directly to the copyright owner as specified in the copyright notice associated with the article.