
Abstract
This article presents the recorded data from an experimental campaign on stiffened steel column bases. The connection configuration comprises an exposed base plate on which vertical stiffeners are welded to strengthen the assembly. Using stiffened column bases is common in several countries where providing thick steel plates is not practical. However, despite their broad application in existing steel structures, there was rare experimental data collected exclusively on their hysteresis response to seismic excitations. The designed testing program intends to document the connection behavior under cyclic loading. This article describes the data collection process, including specimen geometry, material properties, construction details, test setup, instrumentation, and loading history. The qualitative observations are reported to support the data application, and the recorded data set is deposited publicly for future use (DOI: 10.5281/zenodo.7058873).
Introduction
The term “stiffened column base” refers to a category of exposed column connections in which some components are attached on top of a base plate. The stiffened configuration of this study is formed by welding a layout of stiffeners perpendicular to the base plate top surface. The described arrangement allows the designer to use a significantly thinner base plate than the comparable unstiffened column base. Stiffened column bases are the prevalent configuration in regions where material and construction limitations govern the connection design. In such places, extra welding costs are reasonable compared to providing an unstiffened thick base plate or the expensive erection of embedded column bases. Stiffened column connections are extensively used for steel structures in seismically active areas; however, they are not thoroughly investigated.
Base plate design guidelines currently focus on proportioning exposed and embedded column bases (American Institute of Steel Construction (AISC), 2016b, 2018; Fisher and Kloiber, 2006) for building loads. In the past decade, several studies have sought to characterize the response of the column bases in detail for both exposed and embedded types (Borzouie et al., 2015; Gomez et al., 2010; Grilli et al., 2017; Steenhuis et al., 2008; Torres-Rodas et al., 2017, 2022). From this body of research, analytical models are developed to estimate the column base hysteretic response (Torres-Rodas et al., 2016, 2018) and used in system-level studies to predict the Steel Moment Frame response to seismic loads (Torres-Rodas et al., 2020; Zareian and Kanvinde, 2013). In summary, the features of exposed unstiffened and embedded column bases are practically identified; however, stiffened column connections did not receive this attention.
Previous studies have rarely dealt with stiffened column bases. In contrast, technical references (Blodgett, 1966) address them as typical column bases for high-rise buildings capable of developing large moment resistance. The stiffened details are also mentioned in Seismic Provisions for Structural Steel Buildings (AISC, 2016b) as an example of rigid base assemblies for moment frames. The traditional design methods for stiffened column bases are either purely theoretical or extended from unstiffened column bases to stiffened connections without experimental validation. The conventional approach to identifying the internal forces and stresses of stiffened column bases considers three variables: (1) anchor rod tensile force, (2) concrete bearing length, and (3) maximum developed bearing stress under the base plate. These variables are computed using two equilibrium equations (moment and vertical force) and one equation for strain compatibility of the connection (assuming rigid behavior for the stiffened connection). In contrast, the maximum developed bearing stress under the base plate is assumed to equal the maximum concrete bearing stress (Fisher and Kloiber, 2006) for exposed unstiffened column bases subjected to large moments. The attained forces for each component indicate the required design capacity of anchor rods, stiffeners, and the base plate. The theory of plates and yield line theory is utilized (through practical equations) to determine the required stiffened base plate thickness. Although the described design methodologies for stiffened column bases seem reasonable, there is a general lack of sufficient experimental evidence to explore their adequacy. There are few experimental tests available on stiffened column connections. Bahri et al. (2019) tested composite columns and examined one stiffened column base in their program, although their detail is slightly different, that is, no perimeter stiffener is performed. In addition, in some experimental studies, stiffeners are welded on top of a conventional exposed column base to improve the connection behavior (Trautner et al., 2015; You and Lee, 2020); their design approach differs from the studied stiffened column bases in this project, and the base plate thickness is not reduced.
Notwithstanding the stiffened column bases application in existing buildings, the lack of a targeted study to investigate their behavior heightens the need for a comprehensive research effort, backed by a detailed experimental campaign, to discover hysteresis behavior and failure modes of these stiffened connections. The authors have realized this knowledge gap and devised a comprehensive research endeavor to understand the behavior of stiffened steel column bases through carefully planned experiments, develop analytical models for such connections (i.e. hysteretic response), and study their impact on the system-level response. This publication summarizes the devised experimental campaign. The potential similarity between stiffened column bases and thick unstiffened column bases was used to craft the number and characteristics of the experiments. Accordingly, four experiments on stiffened connections comparable with the properties of tests implemented by Gomez et al. (2010) on exposed column bases were conducted. The experiments featuring the current design and practice of stiffened connections are examined as supplementary specimens to previously published research (Gomez et al., 2010). The scope of the study focuses on pure bending; no axial load was applied to the specimens. This article reports the details of the variables, specimen casting, erection procedure, testing program, and captured data.
Test objectives and data reuse
The following list enumerates the objectives of the testing program and how the recorded data can serve the earthquake engineering community:
Quantifying the hysteretic characteristics of stiffened column bases, including rotational stiffness, flexural yield strength, ultimate strength, and modes of deterioration.
Understanding the sensitivity of stiffened connections’ response to geometry or material properties’ variations.
Recognition of and understanding their failure modes.
Investigating the impact of stiffened column base construction methods on their behavior. The conventional design procedure of column bases ignores the effect of erecting methods while analyzing the connection. Astaneh-Asl (2008) outlined a few concerns over the load-transfer mechanism of base plate connections when leveling nuts are used for erecting the column.
Evaluating the design procedure of stiffened column bases. The adequacy of analysis and design assumptions to predict the strength of stiffened connections can be investigated using experimental results.
The published and curated data set provides the opportunity for future researchers to expand and reuse the data and generate knowledge for the improvement of connection behavior and system-level performances. Moreover, since the experimental programs are costly and time-consuming, the alternative is virtual testing utilizing validated models against the physical test results. This study supplies the necessary foundation for the succeeding virtual simulations and further exploration of this connection type. Direct access to the collected data provides more reliable checking principles for the verification models and enhances the certainty of the modeling techniques in either finite element simulations or analytical studies. Furthermore, the variety of column bases is wider than the established column base configurations in northern America (Torres-Rodas et al., 2022). The invented connections also enrich the column base literature (Freddi et al., 2020; Hassan et al., 2022). Publishing the experimental data sets on various types of column connections can lead to gathering a precious collection similar to Prequalified Moment Connection specifications (AISC, 2016a) but on column bases.
Testing program
Test setup
The test setup consists of a steel cantilever column anchored to a concrete foundation through a stiffened column connection (Figure 1). The loading condition was pure bending about the strong axis of the column section. A hydraulic actuator with 1000 kN axial capacity applied the lateral load to the column. The actuator had a total nominal stroke of 330 mm and was set in the middle of this range before loading. The quasi-static displacement-controlled cycles simulated the seismic excitation; the lateral loading history was introduced following the SAC Joint Venture loading protocol (Krawinkler et al., 2000) (Figure 1). The displacement magnitudes applied at the top of the column arise from the prescribed drift amplitudes multiplied by the distance from the actuator’s center to the base plate’s top surface. This lever arm was approximately 2080 mm in all tests; the total column height was 2260 mm. Three pairs of full depth and 15 mm thick stiffeners (resembling the continuity plates) were provided inside the column section and adjacent to the load application point to minimize the local effects of the concentrated forces on the column body. Four 22 mm long anchor rods with the nominal yield stress of 1000 MPa passing through the full depth of the foundation fixed the setup to the laboratory’s strong floor. Moreover, the supplementary lateral supports prevented foundation movement in horizontal directions. Lateral support was designed to prevent the out-of-the-loading plane movements of the column; detail is provided in the uploaded data bank.
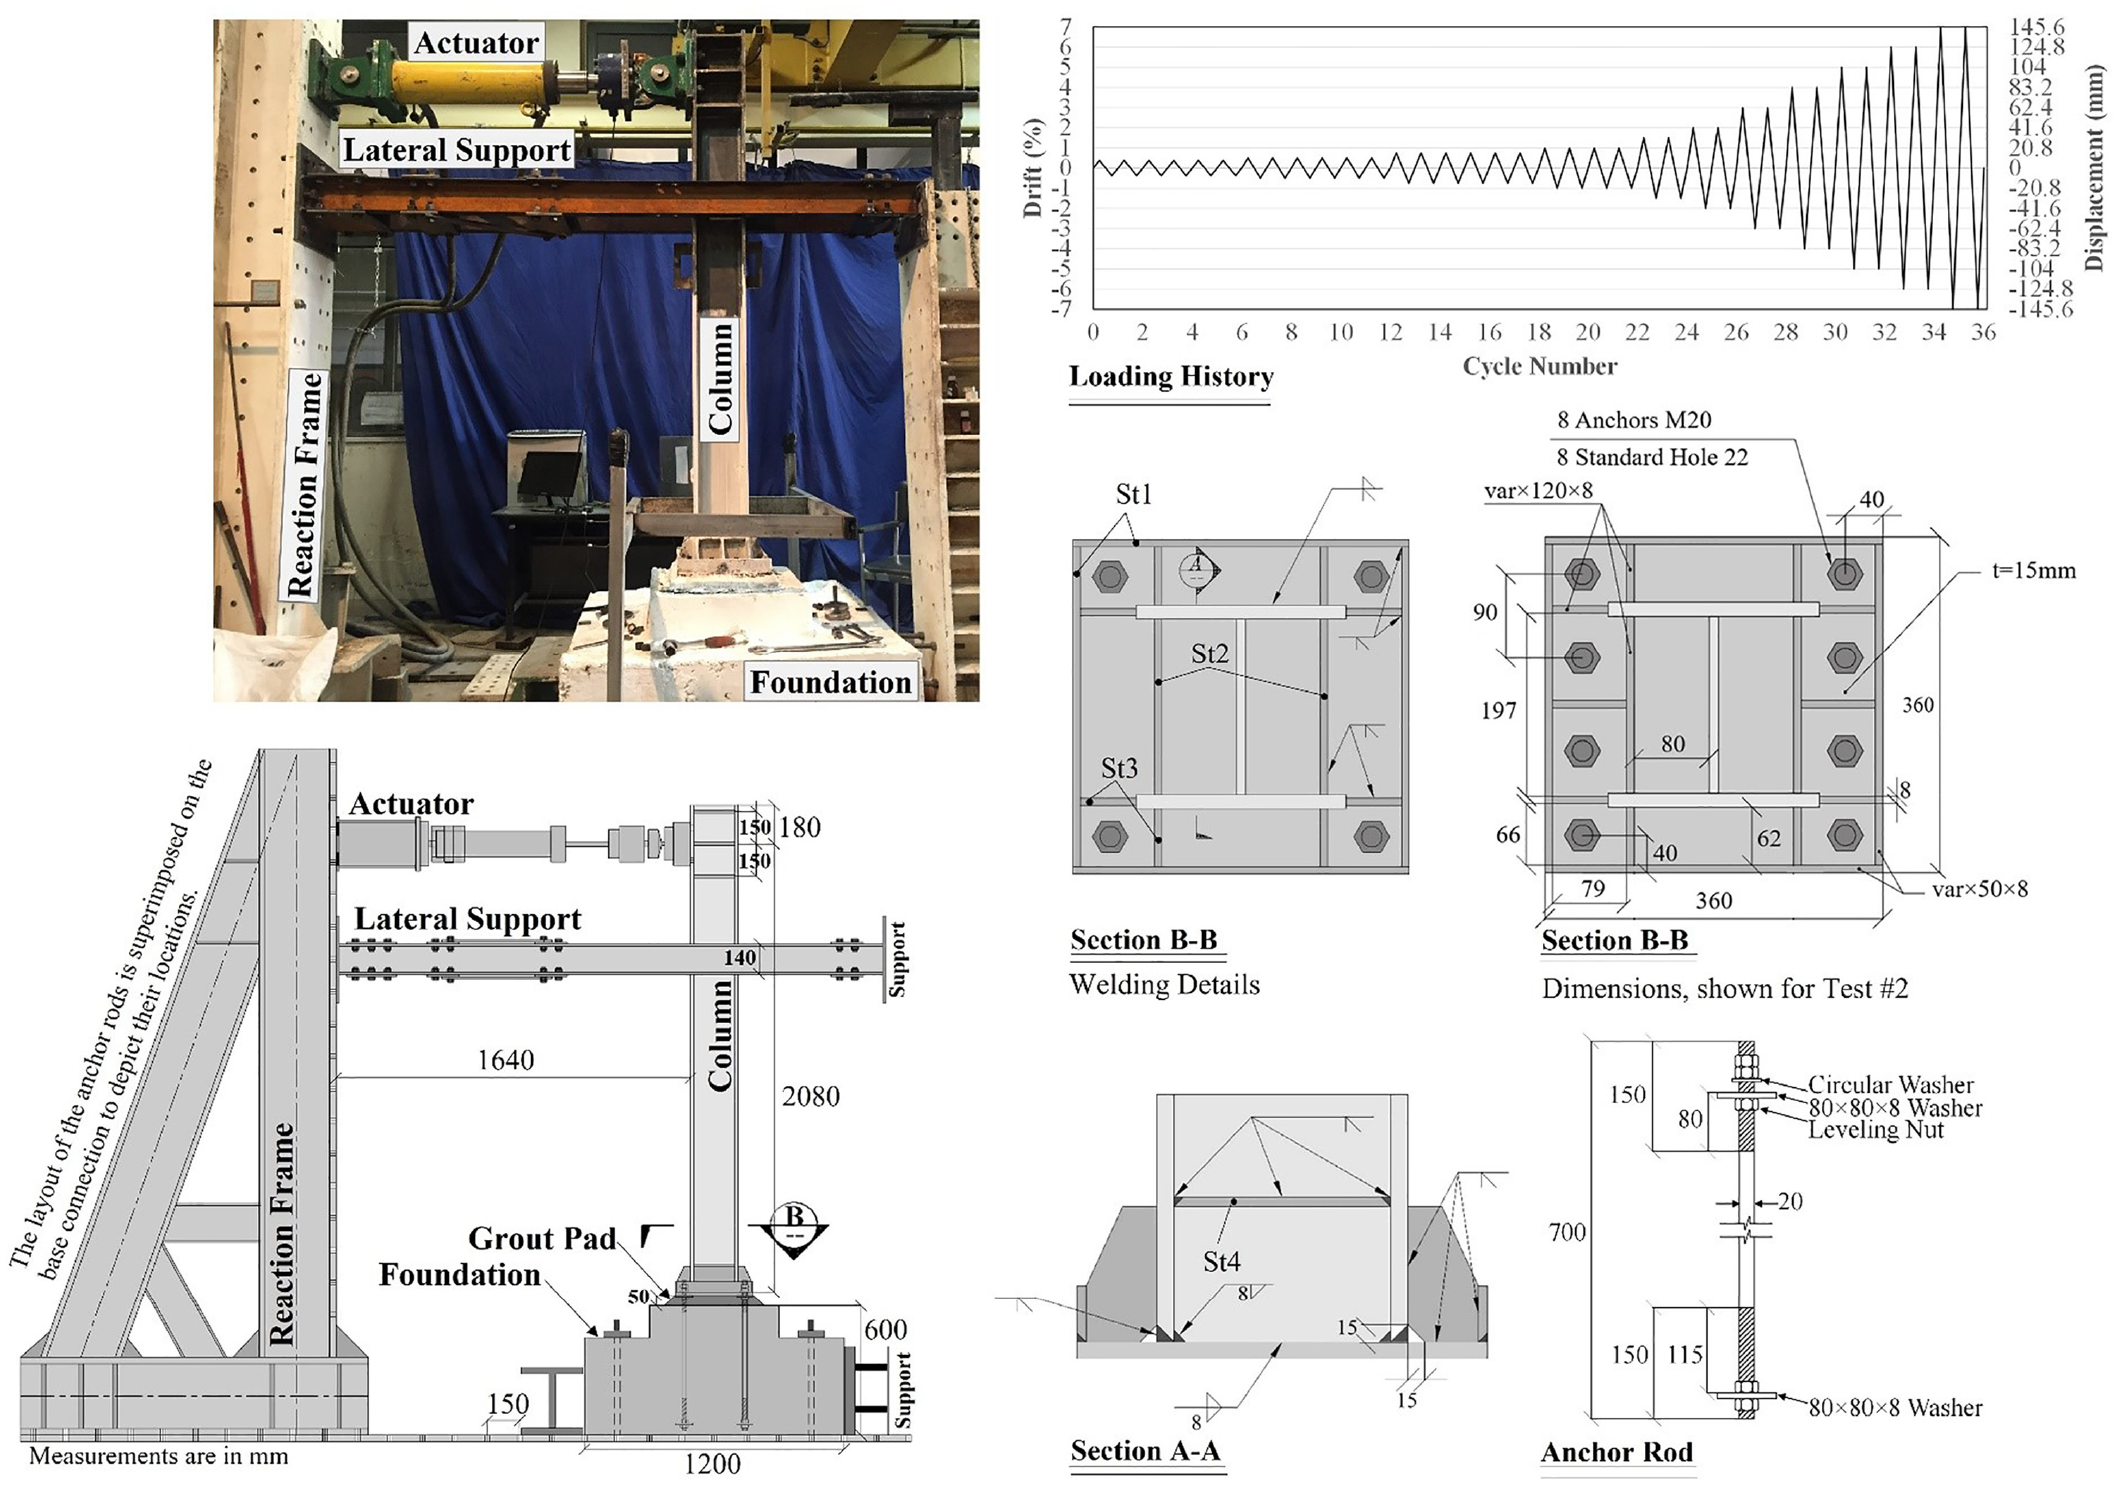
Overview of the test setup.
Specimens
Prototypes represent the practice of design and construction for stiffened column bases. Column properties were identical for all specimens; a built-up I-shaped section comprising 225 mm by 15 mm flanges and a 190 mm by 10 mm web. The column plates conformed to the S355 grade from EN 10025 (British Standard European Norm (BS EN), 2004), which has a 355 MPa specified minimum yield stress. The test purpose necessitates forcing the damages to occur in the connection components rather than the column; the column features were adopted strong enough to prevent any failure—yielding or local buckling. The entire column height was 2260 mm. Complete Joint Penetration (CJP) groove welds reinforced by a pair of 8 mm fillet welds connected the column’s flange and web plates along the column height. No weld access hole was used for welding the column flanges to the base plate surface; this approach eliminates the unnecessary loss of the web material (Myers et al., 2009), considering the limited web length (due to the column size). Therefore, the column was technically attached to the base plate by a combination of Partial Joint Penetration (PJP) groove weld and an 8-mm reinforcing fillet weld. Figure 1 schematically illustrates the connection detail.
Base plates were fabricated 360 mm × 360 mm in size. Stiffeners were made of 8 mm steel plates for all specimens. Referring to Figure 1, the height of stiffeners designated as St1 and St2 were 50 and 120 mm, respectively. Stiffeners placed between the column and peripheral stiffeners were trapezoidal, St3; 120 mm height at the column face and 50 mm at the junction with outer plates. Detailed 25 mm length before cutting these trapezoidal stiffeners satisfies welding procedure requirements and is inspired by the prequalified endplate moment connection design (AISC, 2016a). Stiffeners were clipped where they met the connecting welds of different components. Two horizontal plates, St4, were also provided inside the column section to minimize the local effects attributed to deformations and forces from other stiffeners at this high-stress point of column flange. All connection plates were S235 grade steel in accordance with EN10025 designation (BS EN, 2004); the specified minimum yield stress of 235 MPa. Test #2 had a different arrangement with eight anchor rods shown in Figure 1.
The discussed assembly was connected to a concrete foundation through anchor rods (eight rods in Test #2 and four rods in other tests). The design of anchor rods was accomplished for the specified minimum tensile strength of 800 MPa and resulted in 20 mm diameter rods (ISO, 2013). The 40 mm edge distances for anchor rods guarantee reasonable clearance for tightening the nuts. The manufacturer produced 700 mm length anchor rods with 150 mm threads at each end. Plate washers at the bottom of the rods anchored them against tension forces. These 80 mm × 80 mm × 8 mm washers provided 545 mm anchorage length measured from the top surface of the foundation to washer plates. The Grout pad thickness was approximately 50 mm. The first specimen was implemented on a cement-based grout pad. Limitations on the project schedule led the researchers to continue with the epoxy grout material—which requires less curing time before load application—after the first test.
Design specifications suggest several methods for column erection; setting nuts and washers, setting plates, and shim stack are the popular methods for plumbing the column while executing the column base connection (Fisher and Kloiber, 2006). However, the setting nuts approach, also known as leveling nuts, represents the construction practice of stiffened connections. This method includes placing the assembly on the top of leveling nuts, aligning the column vertically by adjusting the nuts level, and finally filling the space between the base plate and foundation with grout material. Note that the top nuts were snug tightened using an ordinary spud wrench.
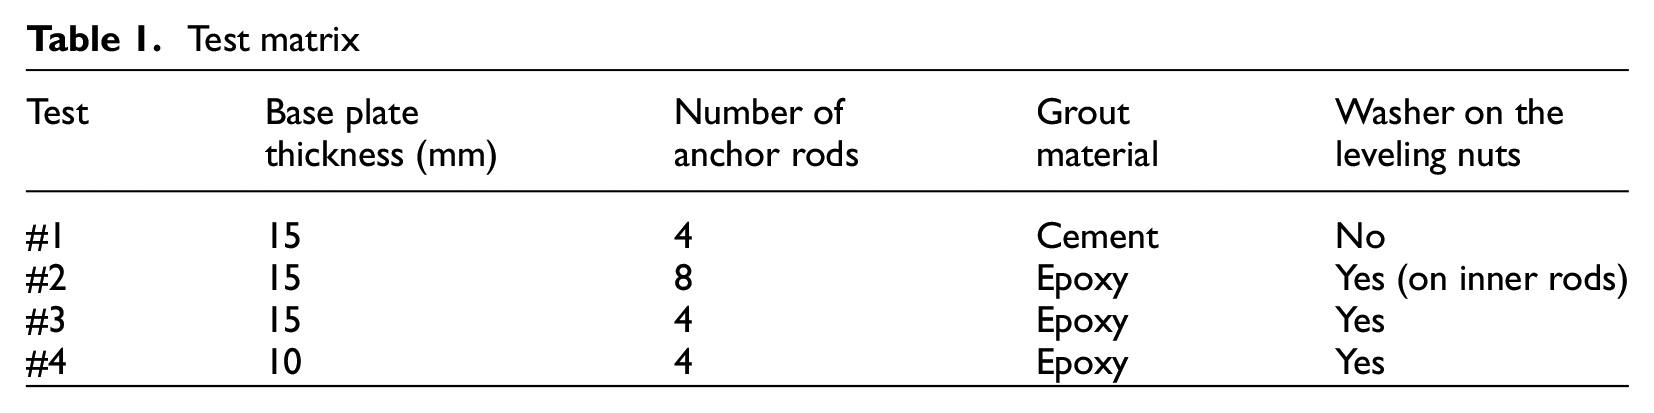
Test matrix
In place of a prearranged list of variables to be examined, an Adaptive Test Matrix was utilized to detect the effective parameters on the connection behavior with respect to the ongoing test results. Features of the first specimen originate from the comprehensive test program on exposed column bases published by Gomez et al. (2010). The first connection in this research program (stiffened column base, Test #1) is equivalent to their second test (i.e. Test #2); the optimal stiffened base plate was designed for a similar column section and target design moment. The obtained stiffened connection is determined as the benchmark of this study, Test #1.
The construction method for erecting the first test conforms to the current practice for stiffened connections; the column was directly installed on the leveling nuts in Test #1 (i.e. no washer on leveling nuts). However, undertaken changes in the subsequent tests stem from damage observations during Test #1 described in the following sections. These modifications include (1) inserting washers on top of the leveling nuts and (2) utilizing an epoxy grout instead of the cement-based material.
A conventional layout for stiffened column bases is to distribute the anchor rods in multiple rows around the connection. However, design guidelines (Fisher and Kloiber, 2006) fail to address anchor rods located in more than one row at each side of the column’s strong axis. Test #2 traces such a configuration with an increase in anchor rod rows; two inner rows are added compared to the other specimens. In Test #2, four leveling nut-and-washer sets were installed on inner anchor rod rows; no leveling nuts were used on the outer rows. The first two specimens (i.e. Test #1 and Test #2) were constructed and tested before deciding on the properties and construction of other specimens following the Adaptive Test Matrix approach. The results of Test #1 inspired the research team to proportion Test #3 to be similar to Test #1 except for changing the grout material and adding washers on top of the leveling nuts. Moreover, the rigid behavior of the connection assembly during the first three tests (Tests #1, #2, and #3) motivated the research team to proportion Test #4 with a reduced base plate thickness compared to the other tests. The arrangement of the assessed variables is set out in Table 1.
Test matrix
Materials
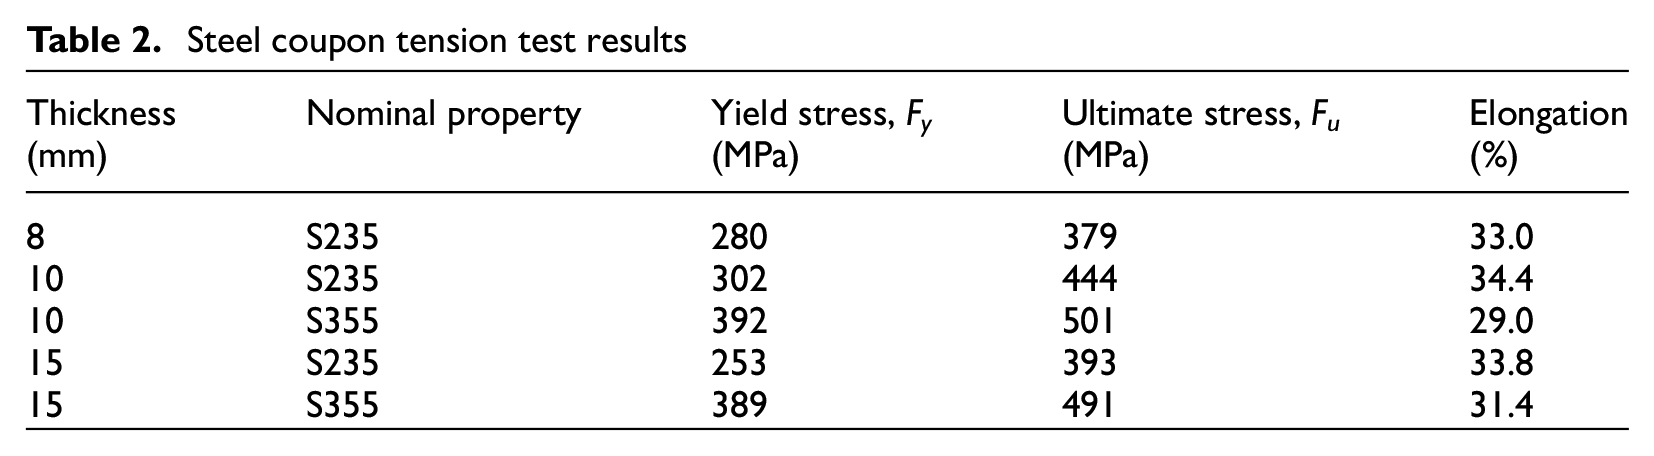
Ancillary tests were executed on steel coupons extracted from connection components at the Material Laboratory of the Sharif University of Iran. Table 2 demonstrates the results based on the strength grade and thickness of the plates. The ancillary tension test on a sample from the threaded part of anchor rods declared the available yield and ultimate strength of 885 and 945 MPa, respectively. Moreover, inspections showed that the nominal 20 mm diameter of the rods is reduced to 17.65 mm diameter at the threaded length.
Steel coupon tension test results
Foundations were constructed with ready-mix concrete and cured for 28 days before assembling the test setup. The construction team collected cubic samples with 150 mm dimensions from the concrete truck mixer, and three of them were examined on each full-scale test day. Data from cubic samples are converted to the equivalent cylinder values (BS EN, 2016) since test specifications define the compressive strength of concrete based on a cylinder sample. Furthermore, a cylinder sample was core drilled after the first test from the unaffected part of the foundation pad; the compression test showed a strength equal to 25.96 MPa. The measured dimensions of the cylinder were 200 and 91.85 mm in height and diameter, respectively. High-strength non-shrink grout material filled the gap between the base plate and the foundation pad. The grout sampling form was 50 mm cubes; a set of three samples were tested on the day of each principal test (American Society for Testing and Materials (ASTM) C109/C109M, 2016). Table 3 reports the obtained information from testing the concrete and grout materials.
Concrete and grout test results
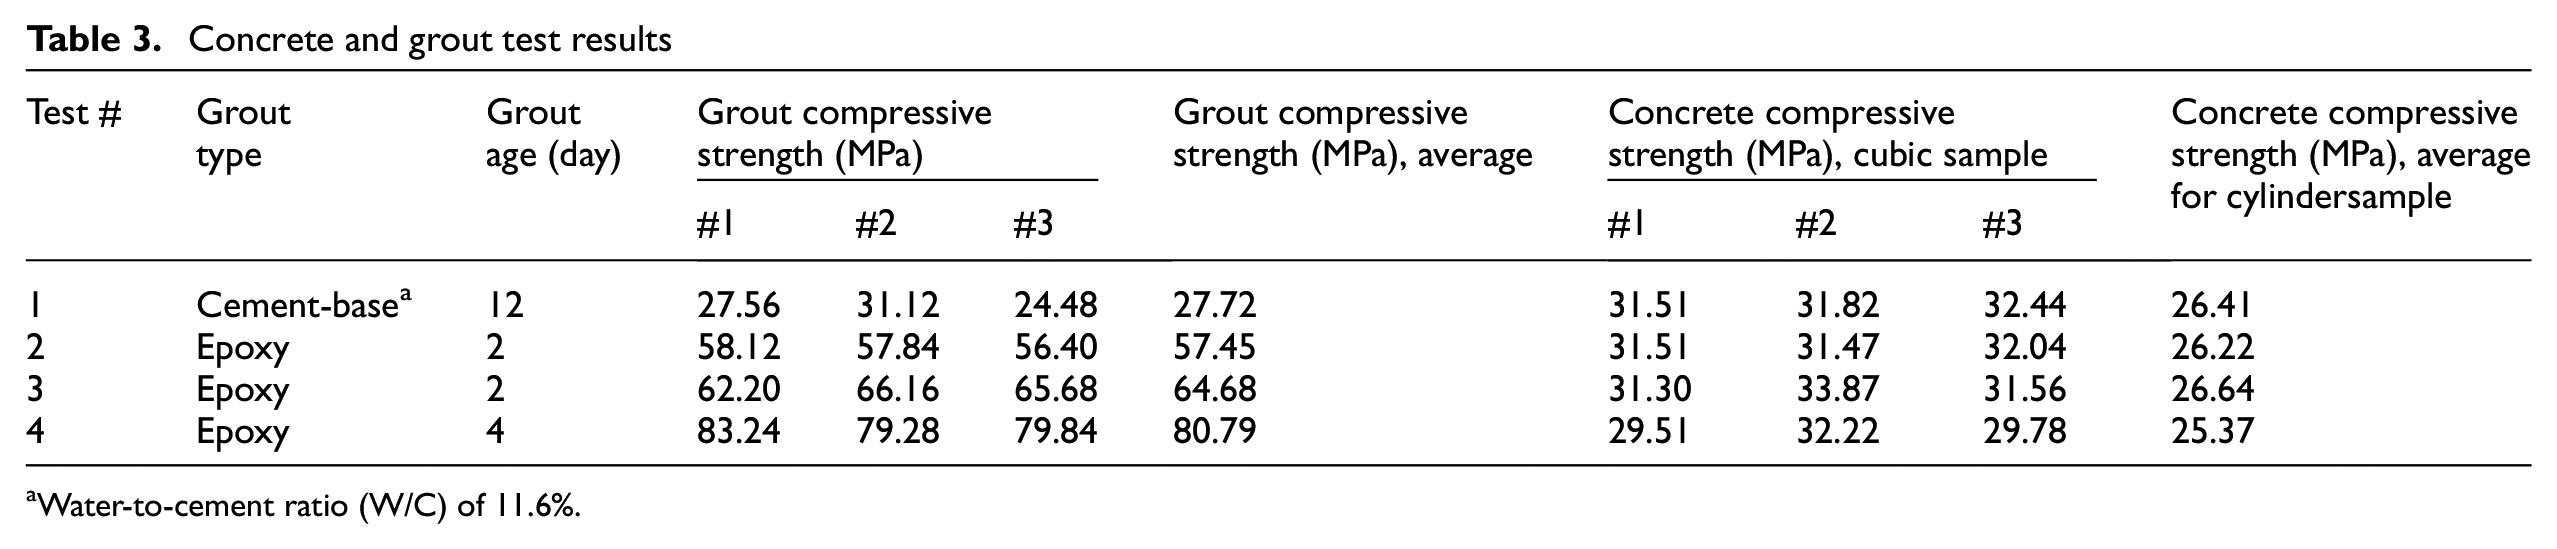
Water-to-cement ratio (W/C) of 11.6%.
Instrumentation layout
The instrumentation map of the testing program is illustrated in Figure 2; Table 4 explains the undertaken notation for each sensor. A hydraulic actuator with 1000 kN axial capacity applies the required displacements on top of the column. The measurement designated with “Jack” represents the force reported by the actuator as the developed load corresponding to the applied displacement amplitude. A 300-mm linear variable differential transformer (LVDT), installed in front of the loading system, records the column top displacements. Moreover, the actuator measured the developed force in each half cycle.
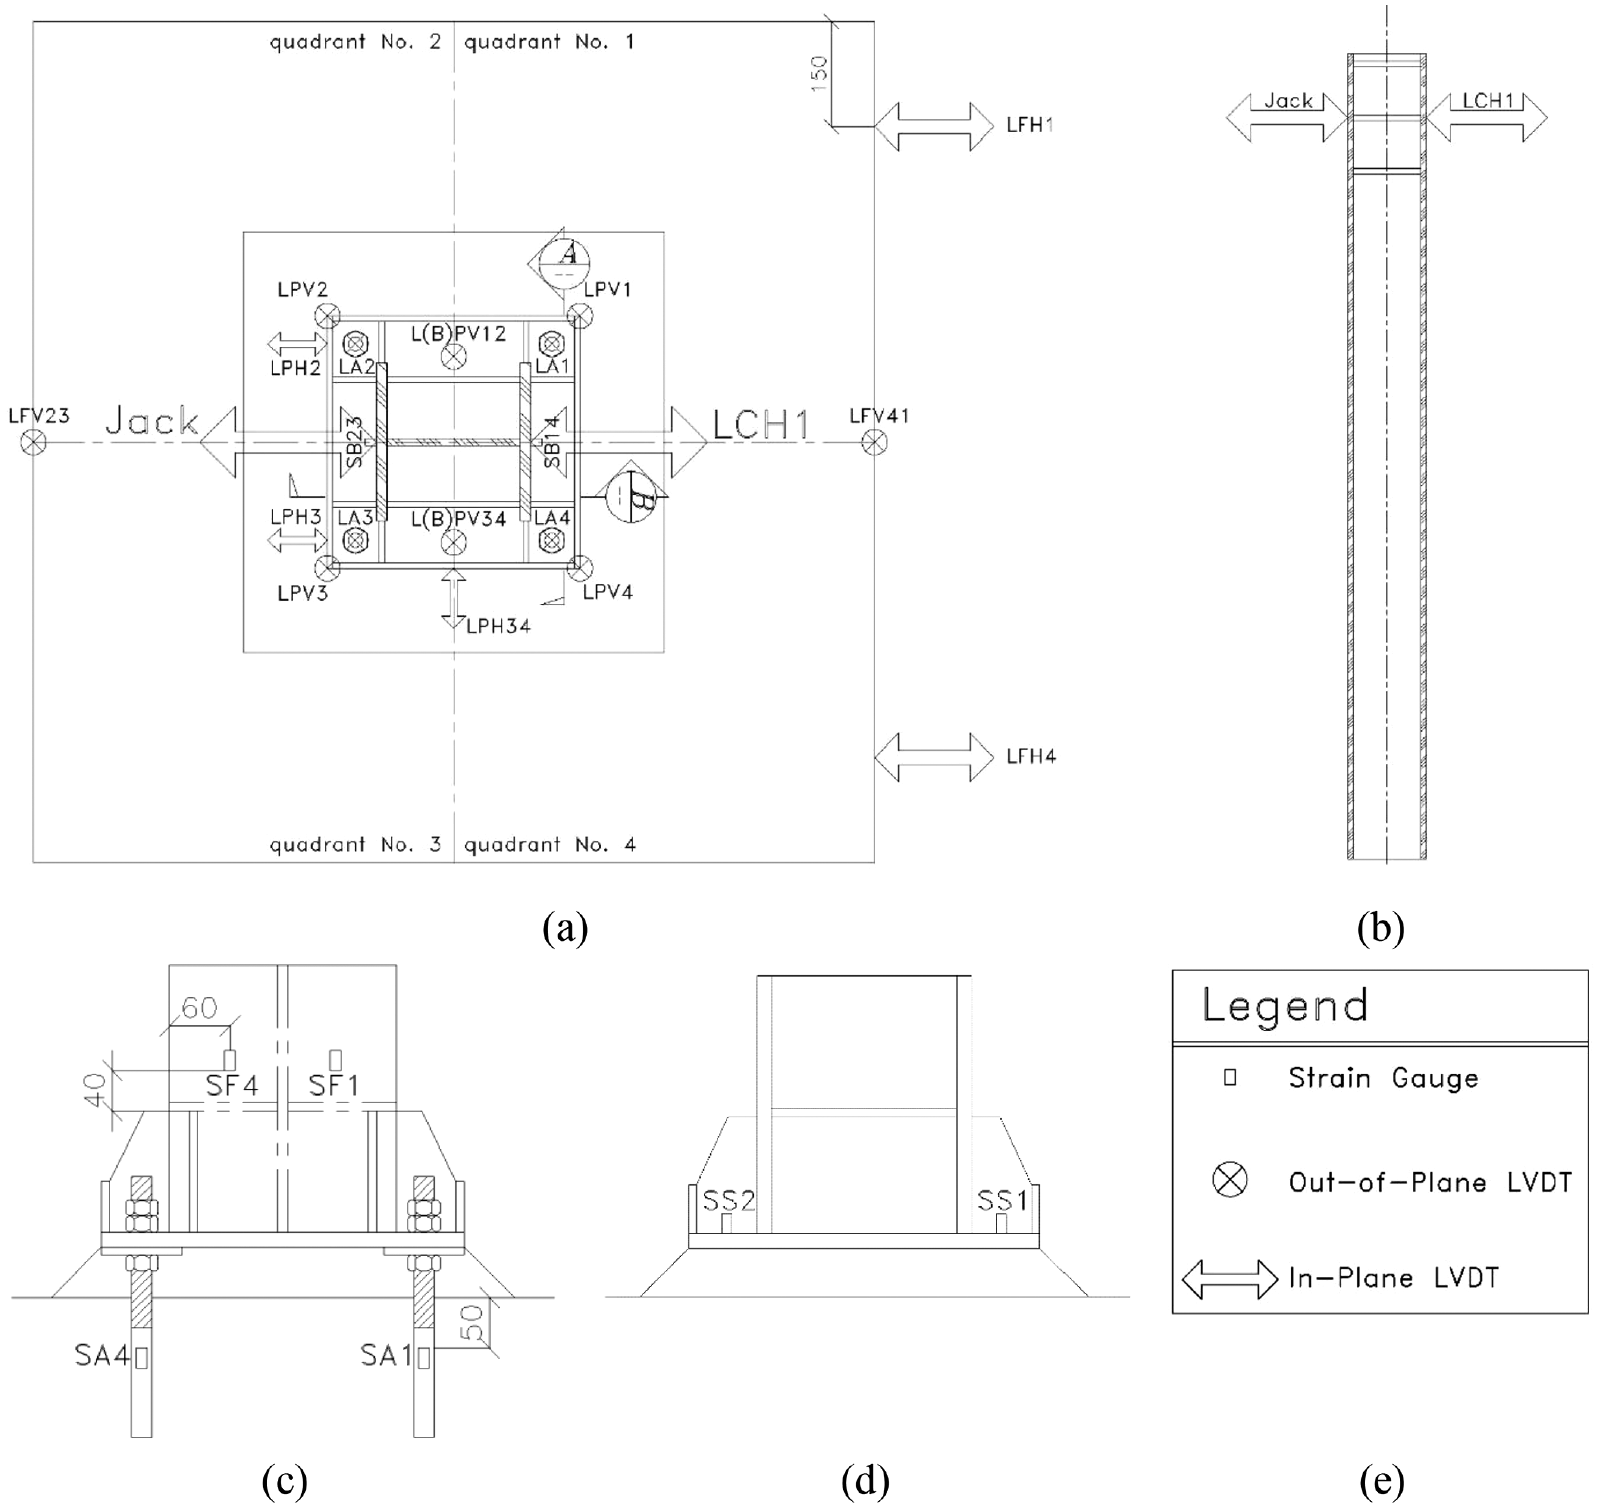
Instrumentation map (a) top view, (b) column view, (c) section A-A, (d) section B-B, and (e) legend.
Notation of the instruments
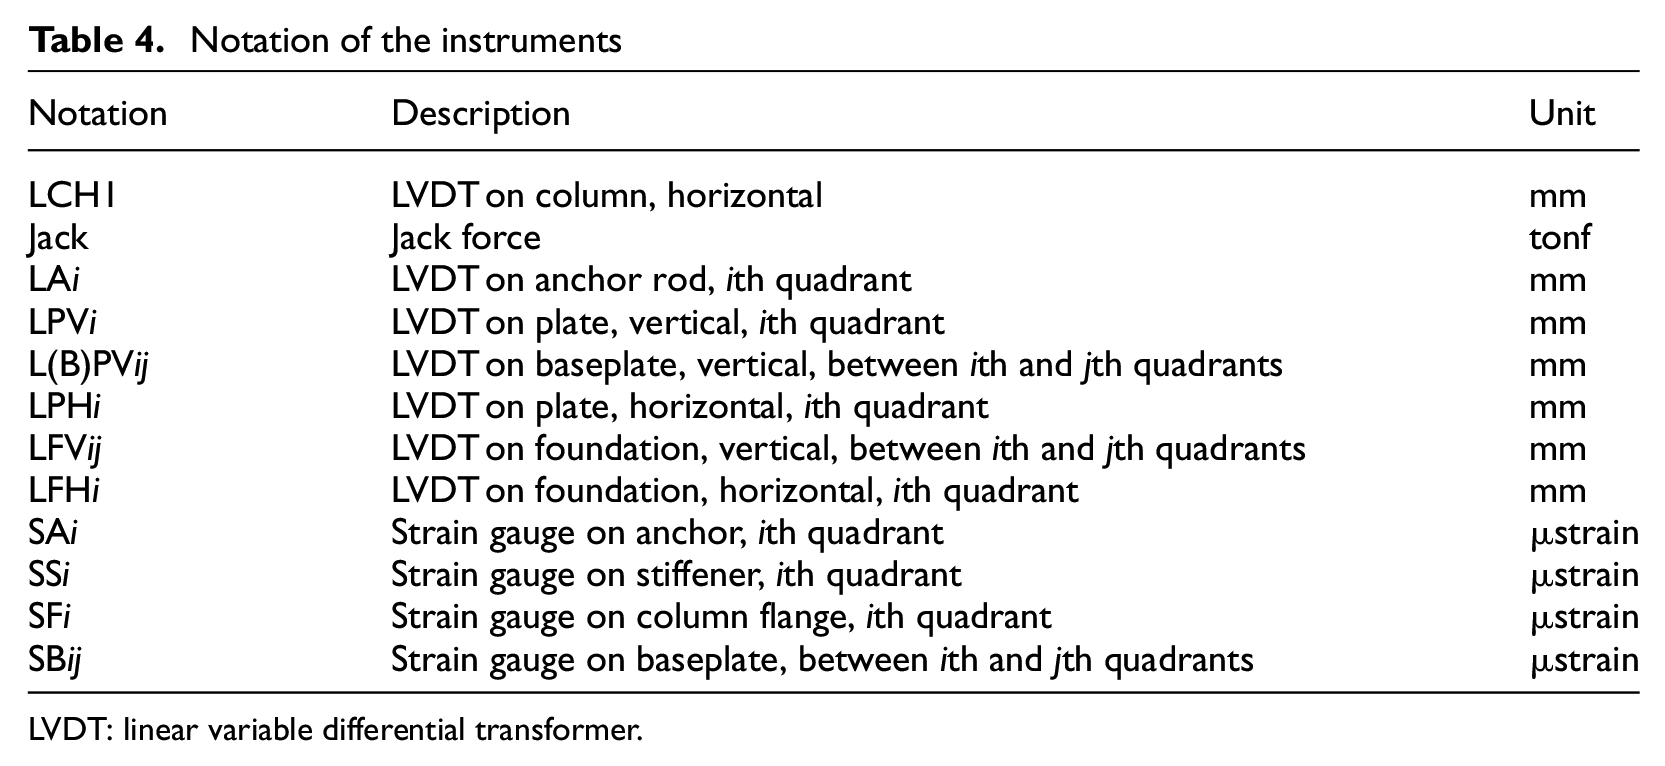
LVDT: linear variable differential transformer.
Several sensors monitored the response of the specimen to the applied loading history. LVDTs recorded the induced relative movements along the LVDT direction during the testing program with respect to the laboratory’s strong floor. Accordingly, LVDTs were installed on a frame independent of the specimen (Figure 3). Moreover, strain gauges were set on stiffeners, base plate, and column flanges to measure the developed strains in steel components.
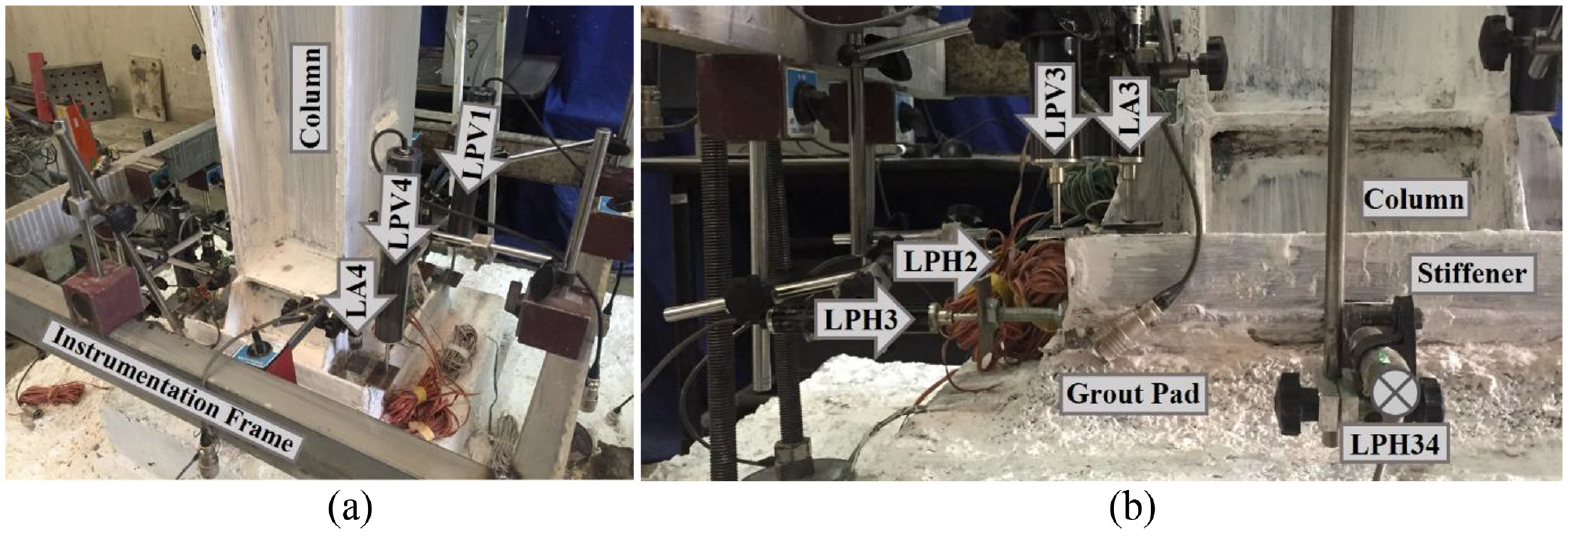
LVDTs installation detail (a) instrumentation frame and (b) LVDTs photograph.
The number of installed instruments compelled the research team to use two data loggers: a dynamic and a static one. The dynamic data logger recorded the time history response of connected instruments automatically during the testing procedure. However, static data logger measurements are discrete and recorded at specific points of the testing time—at zero and maximum column drift amplitudes—by a manual push.
Test observations
The observations are divided into two categories, qualitative comments while conducting the experiments and the visual inspection of the specimens after testing. Damage progression during the testing program outlines the resisting mechanism of the stiffened column base connection against the applied load. The common observation for all the tests in this study was the crack initiation at the contact surface of the concrete foundation and grout pad. Cracks emerged in the primary elastic cycles. This phenomenon was followed by a separation between the base plate and grout pad in the subsequent cycles (at the tension side of the connections) earlier than 0.5% drift cycles (Figure 4). The formation of crack lines with a 45 degree orientation was the next principal observation for Test #1 (Figure 5a). They produced a pyramid-like shape around each anchor rod, with a larger surface in contact with the base plate. The gap further opened as tests progressed, especially on the tension side of each half cycle. The loose grout particles filled the generated space. No evidence of the damage was noticed in the column at the column base location during the tests.
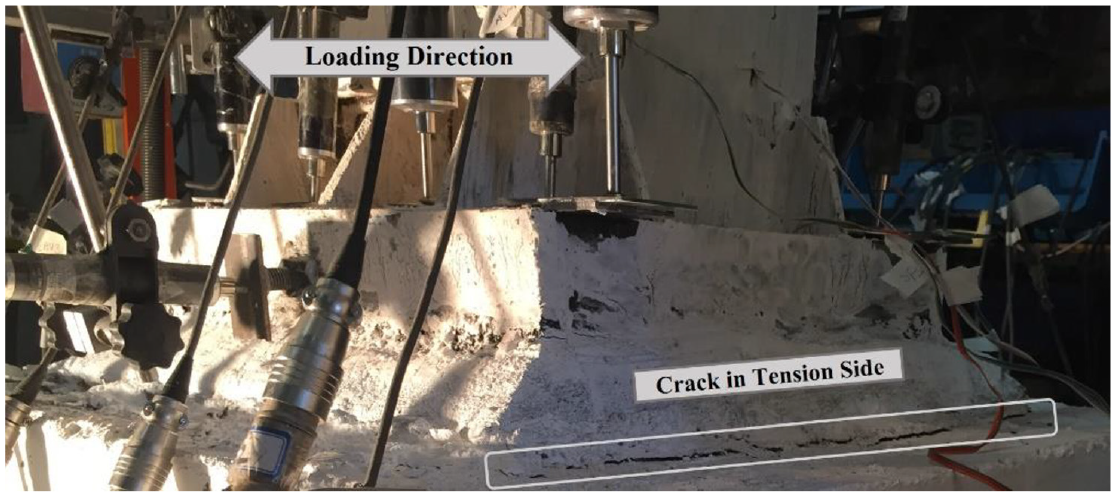
Crack initiation from the connection tension side, Test #2.
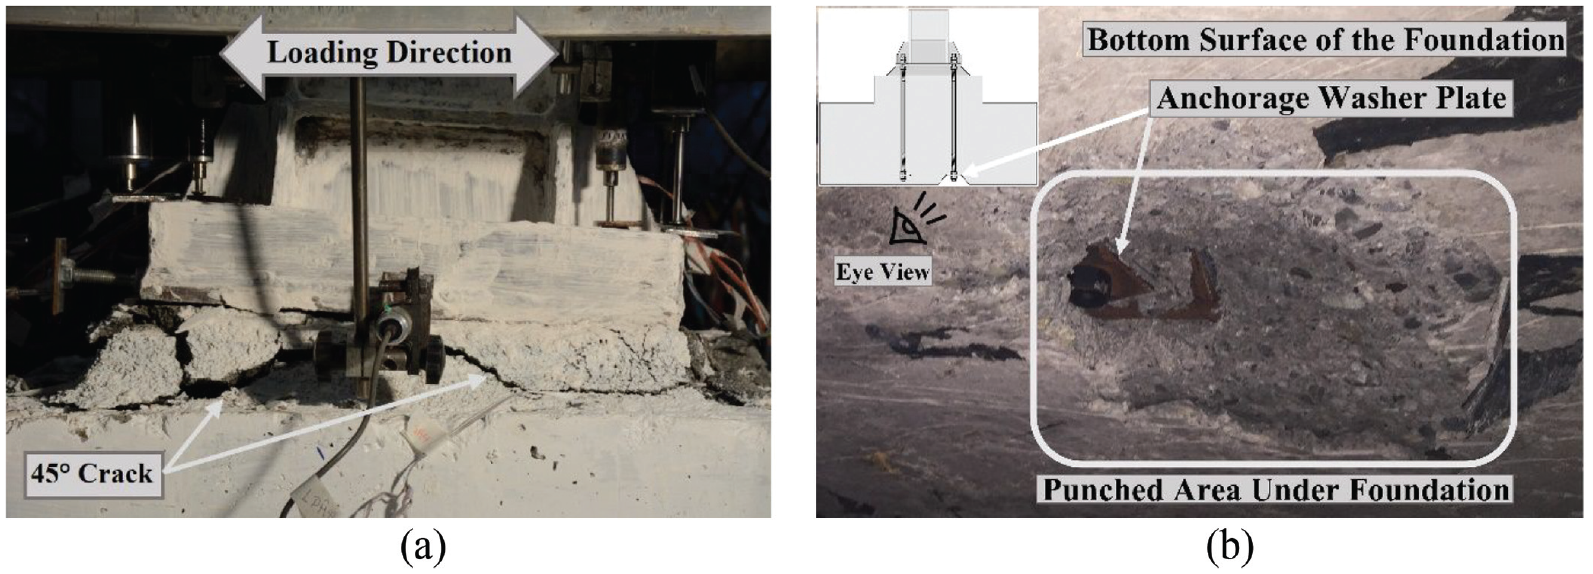
Damage observations, Test #1 (a) formation of a 45° crack in tension side and (b) foundation punch.
Anchor rod longitudinal deformation is the main component of connection rotation. On the tension side of each half cycle, anchor rods are pulled as the base plate forces the nuts upward. Their elongation is associated with the magnitude of developed forces; the lengthening of anchor rods correlates with the drift amplitude. During the unloading part of the following half cycle, the elastic portion of the anchor rod’s elongation is contracted where the base plate comes into contact with the leveling nuts/washers. Upon contact, the base plate continues to push the leveling nuts/washers downward. Comparing the collected data for the deformation of anchor rods (and their hysteresis response) proves that the yielding of anchor rods coincides with the first yield point of the connection envelope curve. Furthermore, it is noticeable that the stiffened connection response is mainly controlled by the anchor rods and the grout pad deterioration. This means that the base plate and stiffeners remained undamaged. The connection performs similarly to an integrated rigid system, and the base plate flexibility did not contribute to the connection deformations during testing.
A zone of the crushed concrete was observed under the foundation of Test #1, precisely under one of the anchor rods. This failure was recognized while disassembling the Test #1 setup (Figure 5b). The low-thickness concrete located directly under the lower washer plates of the rods was crushed, and the anchorage washer plates were visible. This push-out failure mode drew on the possible impact of setting nuts and washers on the assembly behavior. The design procedure of column bases treats the imposed bending moment on the connection as a developed force-couple. This couple comprises the tensile force in anchor rods and concrete bearing area under the base plate, in tension and compression sides, respectively. Therefore, anchor rods are only controlled for their available tensile strength. The qualitative observation of the punched foundation led the research team to postulate that the load path in the compression side presumably changes when the leveling nuts are used. Leveling nuts provide stiffer support compared to the grout pad and force the anchor rods, instead of the grout pad, to carry the induced internal forces in the compression side. This alternative load path is not considered in the design procedure, and the compression force is expected to be resisted by the grout pad and concrete footing.
After detaching the column from the foundation, inspection showed that the cement-based grout material of Test #1 formed an intact rhombus shape attached to the foundation at the middle of the grout pad. Four corner parts adjacent to anchor rods were fractured due to tension–compression cycles. Moreover, anchor rods bent about their axis perpendicular to the loading direction, and their deformation was oriented toward the column (Figure 6a).
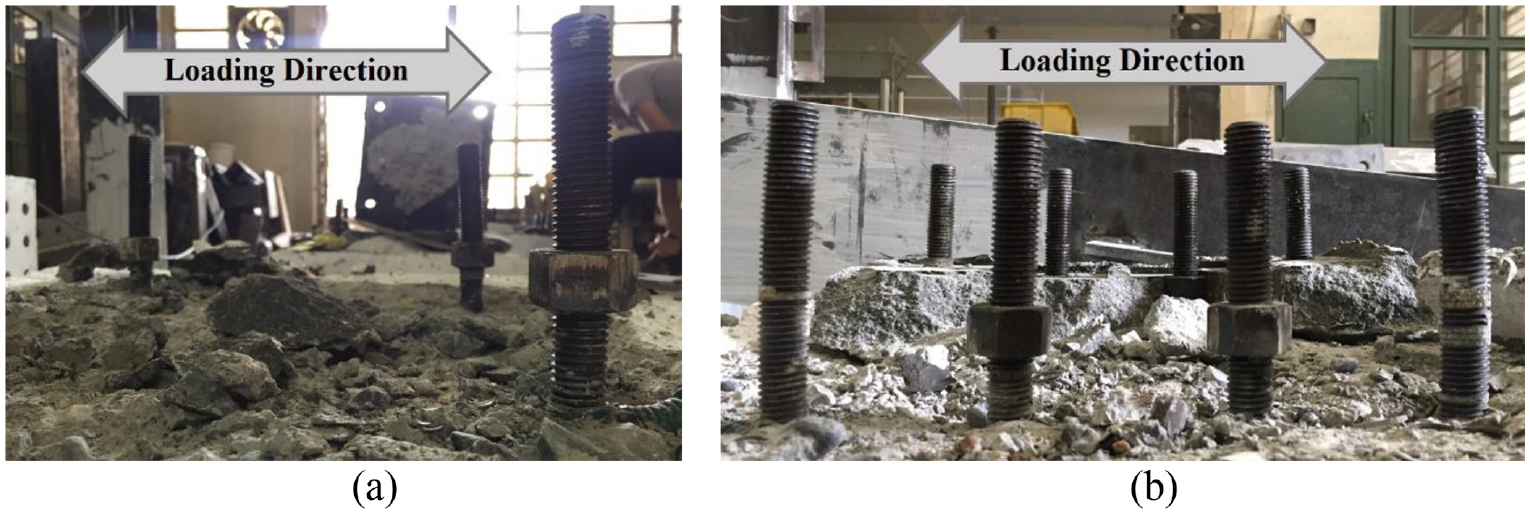
Anchor rods deformation (a) specimens with four anchor rods and (b) specimen with eight anchor rods.
Instead of the cement-based grout of Test #1, epoxy grout was used in Tests #2–#4, which resulted in distinctly different damage observations in the grout pad. In contrast to the cement-based grout that was crushed under applied loading during Test #1, tiny cracks occurred in the epoxy grout. The compact nature of the epoxy grout prevented the debris from falling into the anchor rod zone during Tests #2–#4. However, crack development at the farthest edge of the tension side was observed, followed by the separation of the base plate from the grout pad.
In Test #2 with eight anchor rods, the grout’s crack orientation was reversed compared to Test #1 and occurred in grout pad faces perpendicular to the loading direction. Referring to recorded data and visual observations, the outer anchor rods elongated more than the inner rods. Consequently, developed tensile forces in the anchor rods of each row are proportional to their distance from the center of rotation for the connection. Another behavior particular to Test #2 was the contribution of the base plate in the connection deformation. Unlike the rigid performance of the base plate in Test #1, the restraint provided by the inner anchor rods forced the plate to bend slightly in Test #2. However, this deformation was not permanent; the base plate and stiffeners looked intact after the test. The disassembled specimen was inspected after the test, and the deformed shape of anchor rods shows more local bending for the outer rows (Figure 6b). In contrast to the first test, no damage was identified under the concrete foundation in Test #2.
The observed damages in the grout pad of Test #3 are distinct from the benchmark Test #1 since the nature of the grout material was changed. Cracks of the grout pad emerged directly under the edge of the base plate. However, neither utilizing high-strength grout material with a compression strength more than two times the compression strength of the footing nor adding washers on top of the nuts changed the load path. Qualitative observations obtained from Test #4 were analogous to Test #3.
Organization of the test data
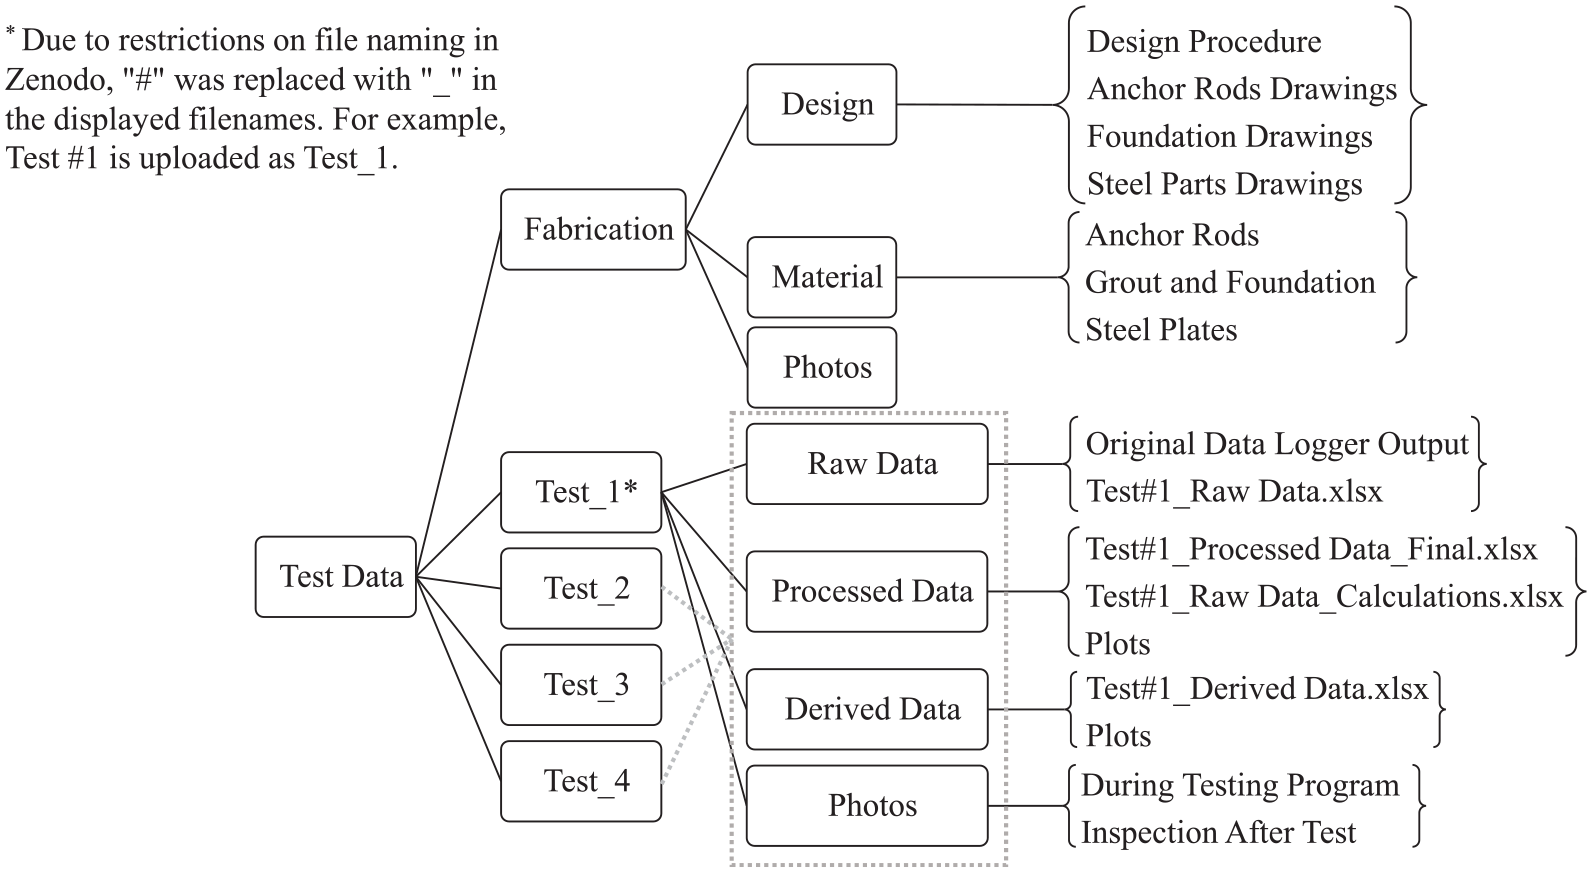
The collected data set during the testing program is archived in a public data repository for potential applications. Data set is available with DOI: 10.5281/zenodo.7058873. Figure 7 summarizes the organization of the test data. The fabrication folder includes the design procedure of stiffened column bases and specimen drawings, materials’ test results, and photos from the manufacturing process. The subfolders designated with each test number deliver the related results in (1) raw data, (2) processed data, (3) derived data, and (4) photos.
Organization of the test data.
The “1- Raw data” folder signifies the pure recordings during the testing program. LVDTs and strain gauges were connected to a dynamic and a static data logger. The “Original Data Logger Output” folder contains two spreadsheets; the original (i.e. sensor output) files are saved from data loggers right after the test. These files are not synced with the instrumentation map (Figure 2), and outputs are reported as data logger channel numbers. The provided “Test#i_Raw Data.xlsx” combines the prescribed original outputs in one file and reflects the name of the recorded instrument by each channel.
The “2- Processed Data” folder provides the revised outputs. The “Test#i_Processed Data_Final.xlsx” file embodies the ultimate corrected data. The “Test#i_Processed Data_Calculations.xlsx” includes the undertaken calculations to process the raw data set. The “Plots” folder visualizes the post-processed time history of each instrument. The data processing commences with removing the data related to disconnected channels during the experiment and sorting the channels in a meaningful order. Some sensors exhibit initial readings before testing starts; tightening the anchor rods, for example, leads to initial recordings in strain gauges. Therefore, measurements are shifted to a practical coordinate axis at the beginning of the test to eliminate the impact of initial readings in instruments. In some cases, incorrect calibration factors were applied to the data loggers for a channel, which is adjusted in the final outputs. Furthermore, a negative sign is applied in the output of LVDTs and Jack channels to synchronize with the loading direction (Figure 2).
The “3- Derived Data” folder presents the spreadsheet of the implemented calculations on the processed data to derive comprehensive insight on the connection behavior. The “Plots” subfolder demonstrates the derived data. The derived data includes base moment versus column drift, base moment versus base rotation, connection stiffness, and energy dissipation presented in the spreadsheet.
The “4- Photos” folder consists of two subfolders. Pictures in the “During Testing Program” subfolder are taken by a fixed camera facing the connection during the test. Pictures are associated with zero displacement position and target amplitude at each cycle. While “Inspection After Test” contains some photos of the damaged specimen after each test.
Examples of the processed and derived data
Processed data
Figure 8 illustrates an example of the obtained plots from processed data in Test #2. Collected and processed data include the displacement of the column top (at the load application point), the developed forces in the hydraulic actuator, deformations, and induced strains in the anchor rods and connection components. The processed data lead to a comprehensive understanding of the response of the stiffened column base to the applied loading history. For example, comparing the time history of LVDTs on inner and outer anchor rods in Test #2 reveals the distinct rigidity of the connection.
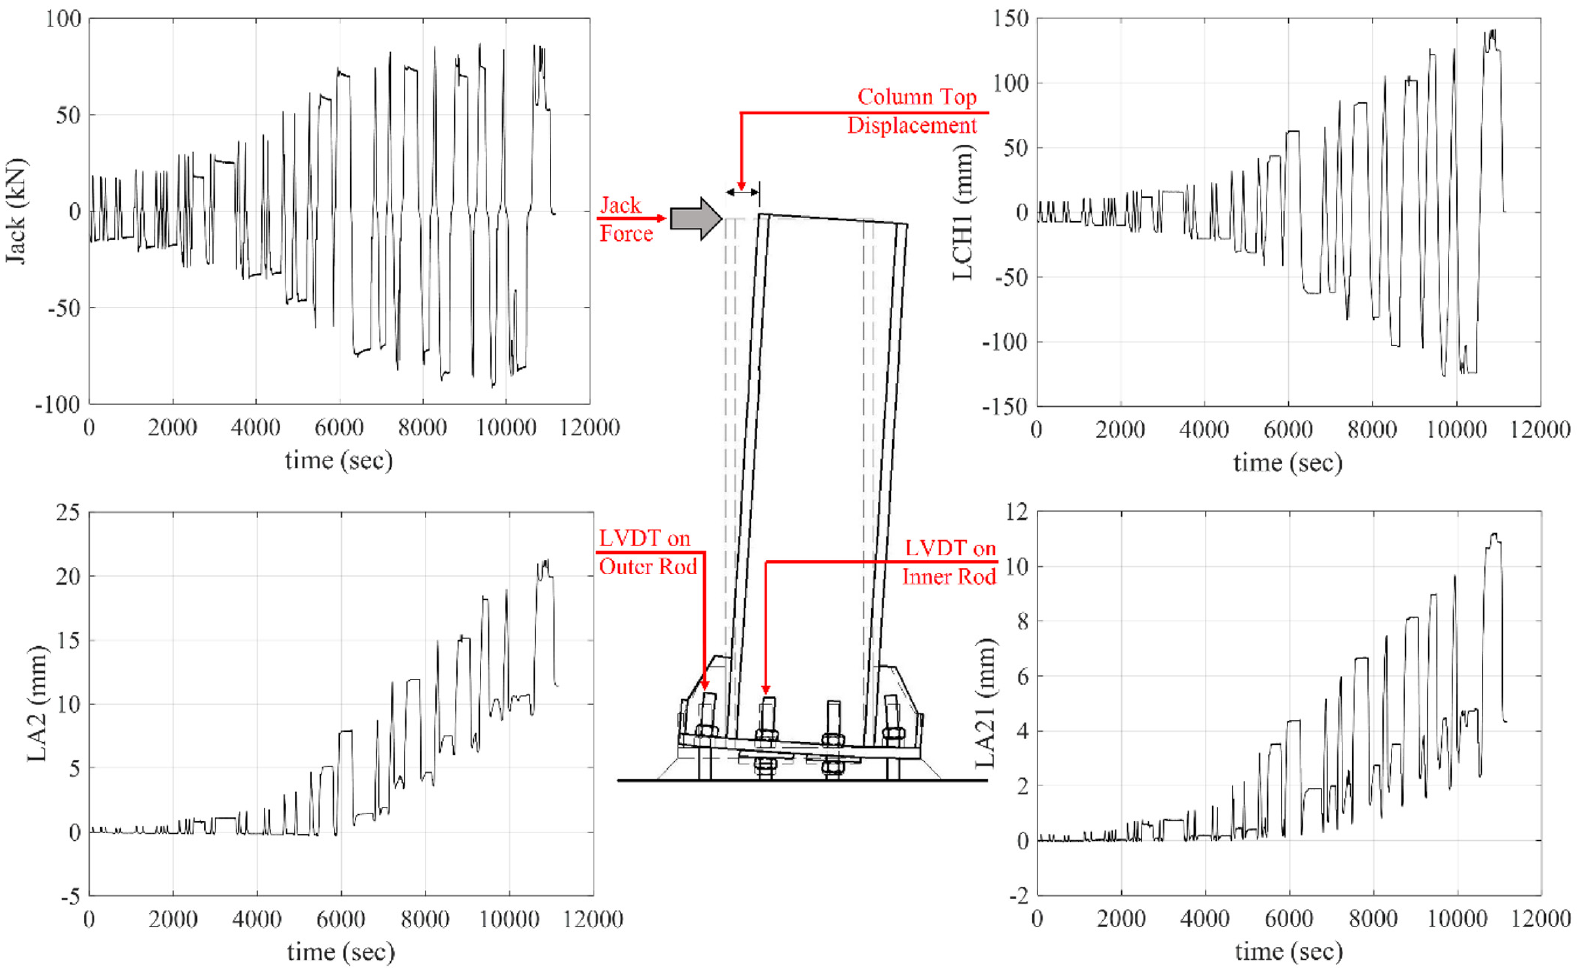
Example of processed data, Test #2.
Derived data
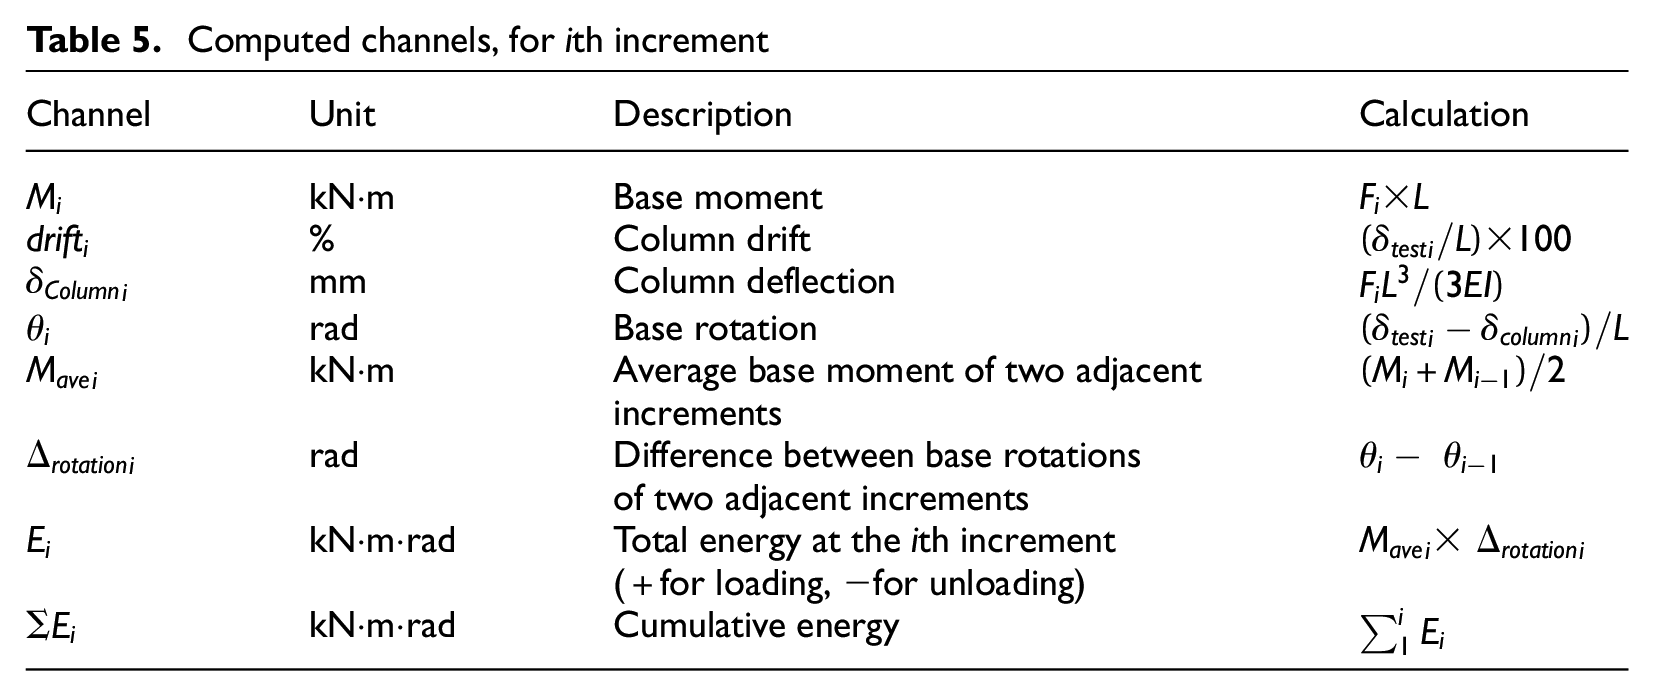
This section describes the derived data calculated using the test processed data. Table 5 organizes the required computed new channels. In this table, Fi denotes the processed data for Jack (i.e. the actuator force) and
Computed channels, for ith increment
Base moment versus column drift
Figure 9 depicts the cyclic response of stiffened column bases studied herein. The plots are obtained using the processed version of the developed force in the actuator and displacements of the column top frame. These curves show the base moment versus the column drift for tested specimens (Table 5). Table 6 highlights the quantitative results from the connection response to the loading history; values represent the maximum moment at the first cycle of the specified drift amplitudes. A positive sign denotes a pushing of the hydraulic jack; in the reverse direction, results of pulling half cycles are shown as negative drifts.
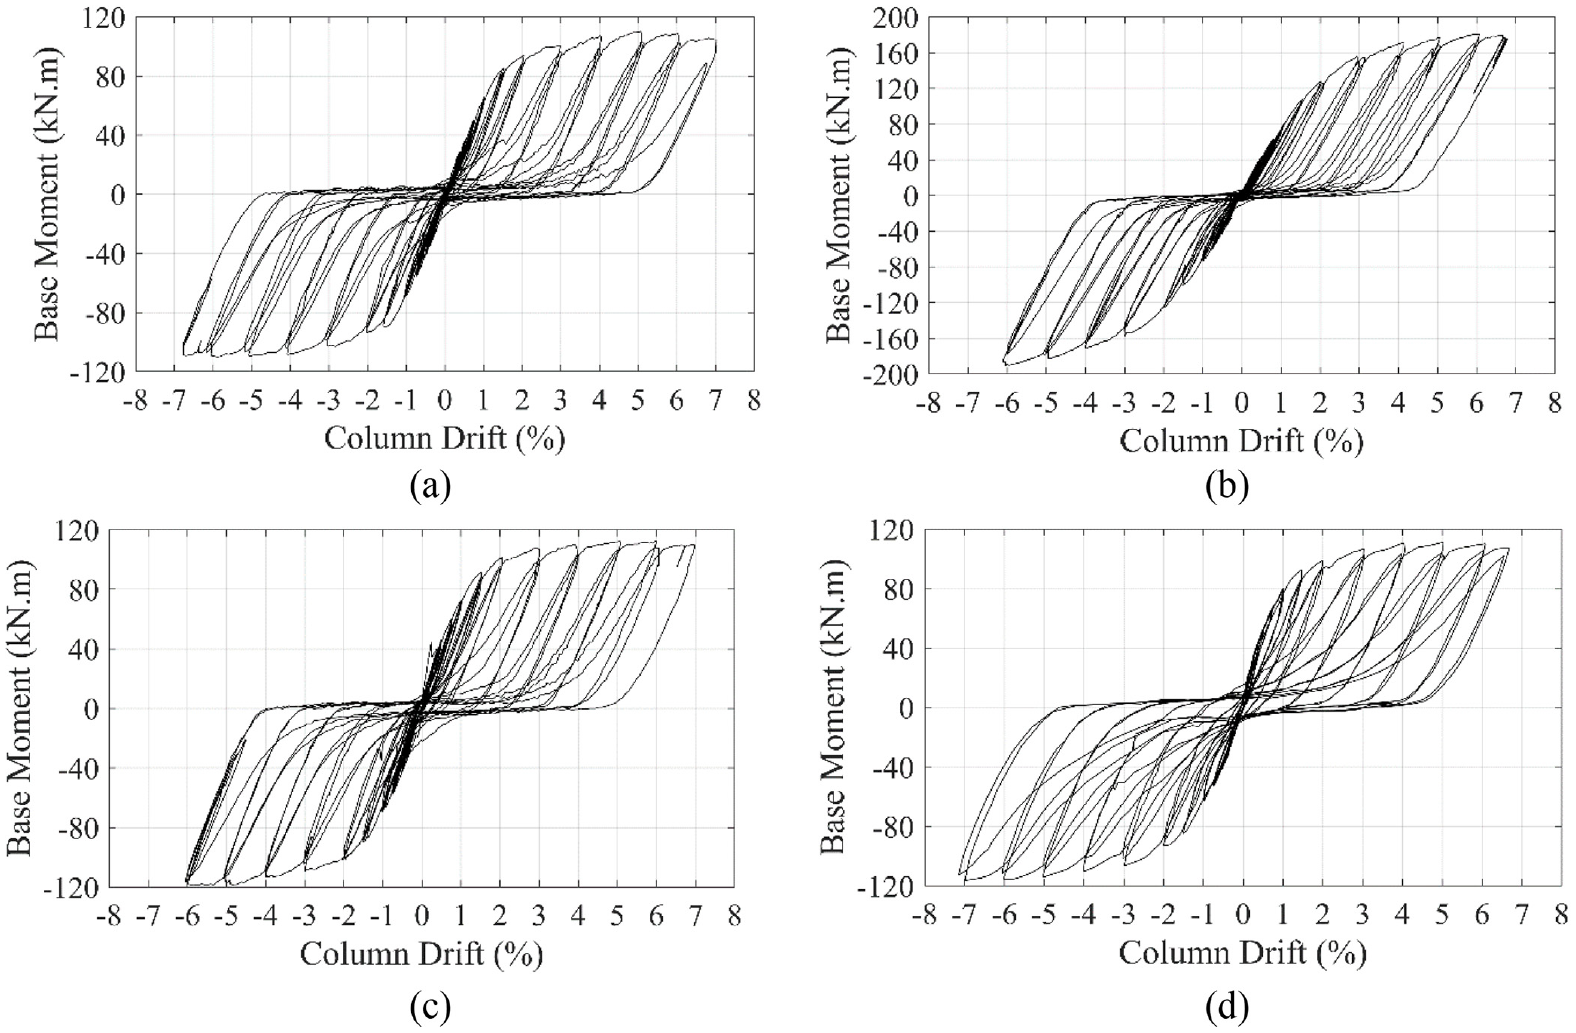
Hysteretic response (a) Test #1, (b) Test #2, (c) Test #3, and (d) Test #4.
Summary of the recorded hysteretic characteristics
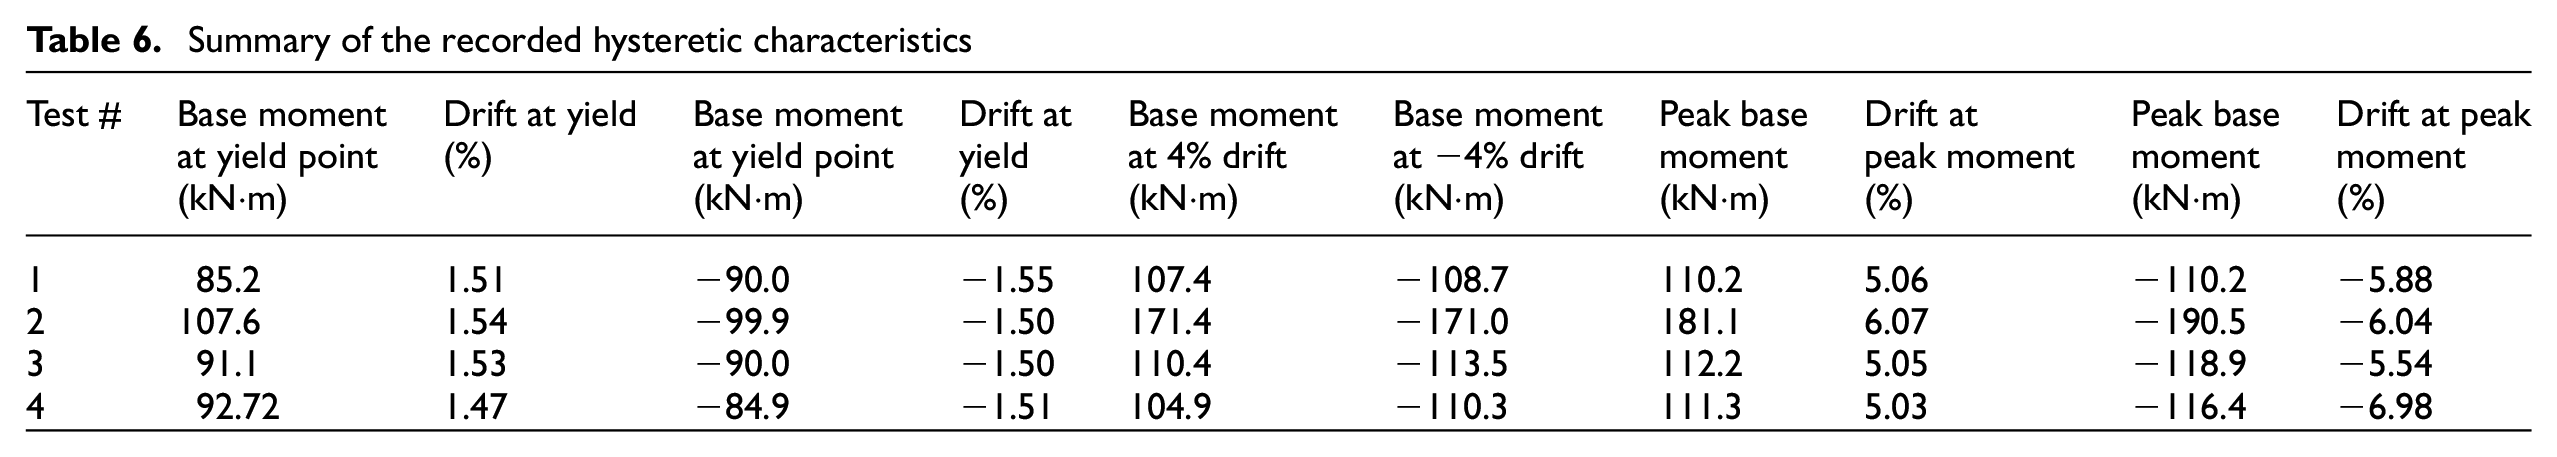
Focusing on the envelope curve (backbone) of the connection responses, the point of change in stiffness is inferred as where the connection reaches the first yield mechanism. This phenomenon is followed by a strain hardening path up to the second failure (capping point) and then strain-softening (post capping) behavior (Ibarra et al., 2005). According to the experimental results (Figure 9), the behavior of the stiffened column bases is not precisely symmetric in two loading directions (forward and reverse). The connection moment–drift response is slightly different on the positive and negative sides. In the positive direction, the curve reaches the capping point and initiates the softening branch. But the backbone curve is in the resisting zone on the negative side, and no reduction is observed in the flexural strength. However, the limited stroke of the actuator resulted in the termination of the tests before the connection fracture.
Stiffened column bases have a pinched hysteretic behavior; recorded curves conform to the pinching model characteristics (Ibarra et al., 2005). After the elastic region, the second cycle of each amplitude exhibits a basic strength deterioration, which is more noticeable for larger amplitudes. Two types of stiffness deterioration are observed; accelerated reloading stiffness deterioration and unloading stiffness deterioration. Slight basic strength deterioration is also evident for the pushing side after the peak point. Hysteretic properties of Test #2 and Test #3 comply with the response characteristics of Test #1.
The observed flexural strength of Test #1 surpasses the design strength requirement of stiffened column bases. The recorded yield moment in Test #1 is equal to 87.6 kN m—computed as the average of two loading directions—even though the connection was designed for a target moment of 61 kN m. This is close to 43% overstrength and corroborates the conservative prediction of the undertaken design procedure on the connection strength.
Results show increased connection flexural strength by adding inner anchor rod rows in Test #2. At least an 18% rise in the first yield moment and a notable 58% enhancement in the flexural strength at 4% column drift are recorded. However, the envelope curve of Test #2 does not provide a clear distinction for the yield point. Moreover, the backbone curve for Test #2 has a steeper slope in the post-yielding branch compared to the other tested connections. Subsequently, less change in stiffness occurred in Test #2 after the first yield. Strengthening the grout pad and modifying the construction method in Test #3 resulted in a negligible growth in the connection flexural strength compared to Test #1.
Test #4 was built with a base plate thickness 33% smaller than the required thickness computed following the design procedure of stiffened column bases (the thickness of the base plate in Test #1). Surprisingly, no perceptible influence on the response envelope curve and the flexural strength is recognized. However, a change in thickness altered the characteristics of the hysteretic behavior. Instead of the sudden increase in the loading slope (at each half cycle) observed in the previous tests, Test #4 response is directed toward the target amplitude with a more smooth loading phase. The first three tests with thicker base plates showed a more rigid behavior, while the thickness reduction affected the internal behavior of the specimen in Test #4.
Base moment versus base rotation
The recorded displacement by LCH1 (Figure 2) counts the summation of the tip displacement of the column due to base rotation and the deformation of a cantilever column. In contrast, the system-level analysis is implemented based on the pure behavior of the column connections. Therefore, the derived base moment versus column drift can be converted to the base rotation as the horizontal axis (Table 5) for future investigations on the effect of column bases on the performance of steel structures. Figure 10 compares the base moment-column drift plot with the base moment-base rotation result for Test #2. The contribution of the column shear deflection is negligible and not considered in the calculations.
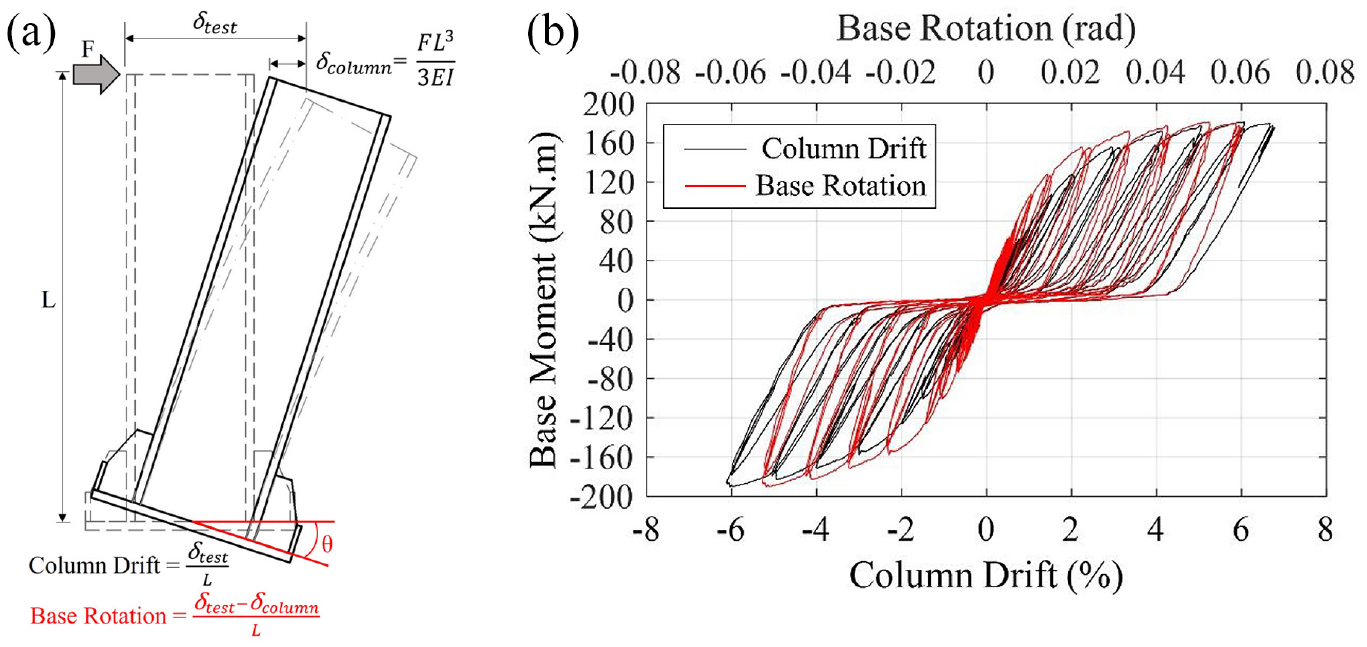
Difference between column drift and base rotation (a) schematic illustration and (b) base moment versus column drift/base rotation, Test #2.
Connection Stiffness
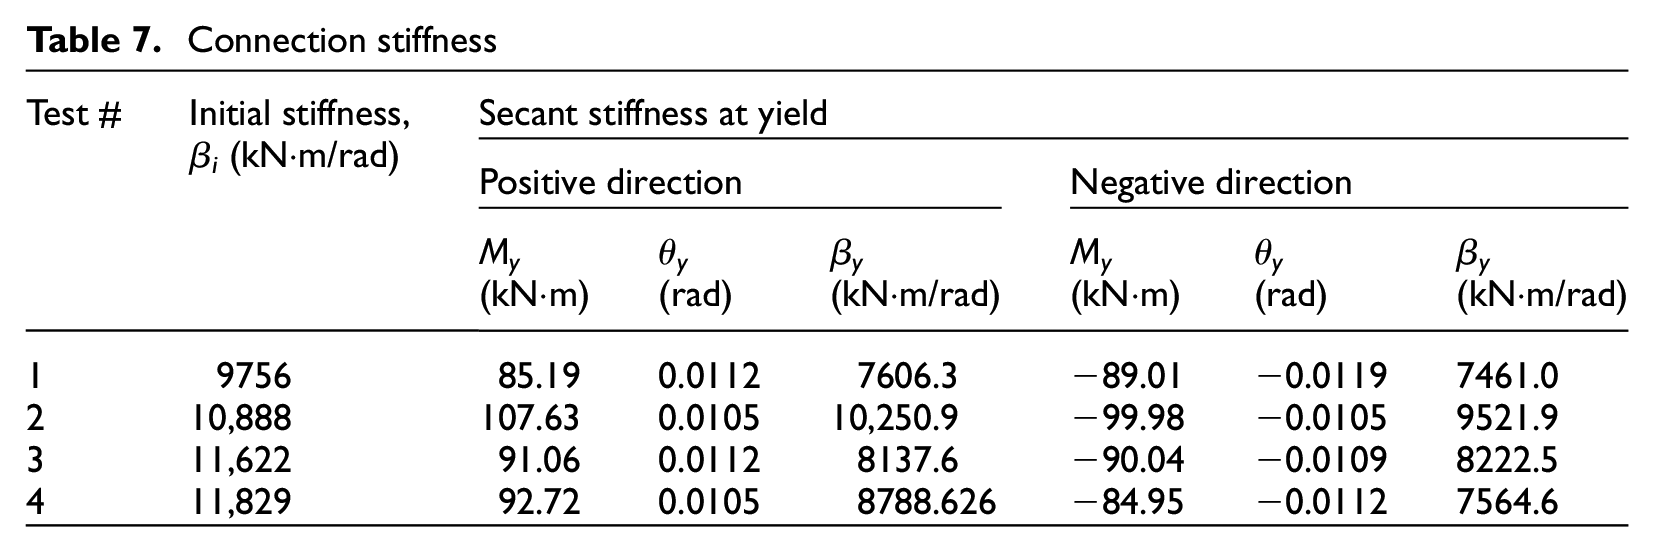
The connection stiffness is a needed parameter to investigate the impact of column bases on the performance of steel structures. The initial stiffness of the connection is acquired as the slope of linear regression of base moments on base rotations up to 0.005 radian cycles, shown as βi in Figure 11. The secant stiffness, βy, on this figure denotes the slope of the direct line to the base moment for the cycle representing the base rotation at which the first yield happened, Equation 1, where

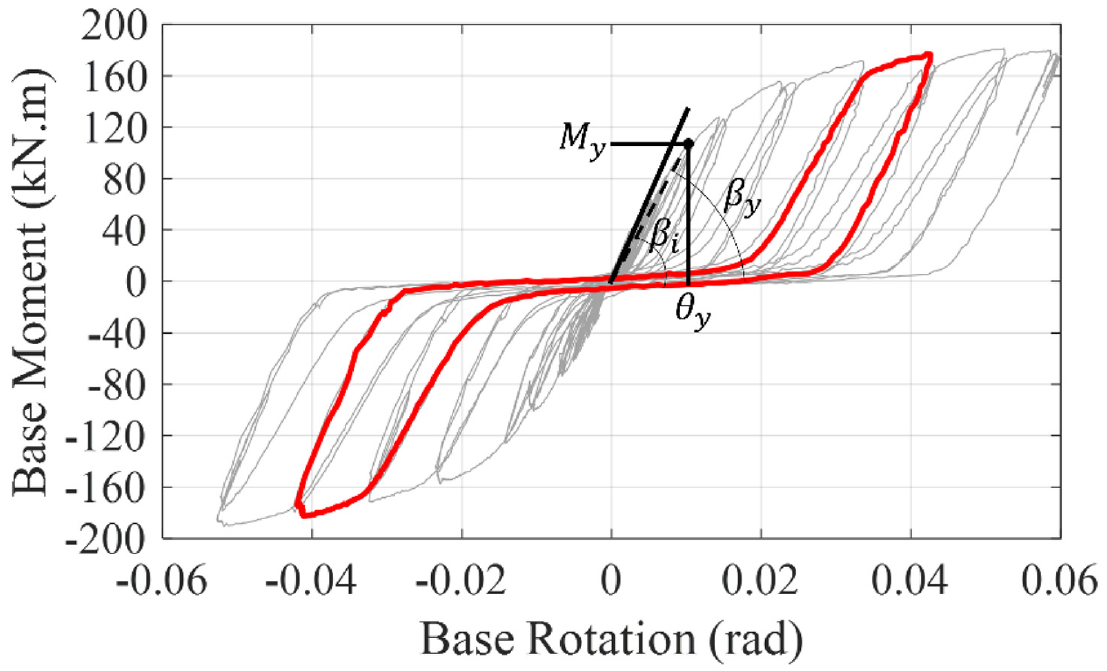
Connection stiffness, Test #2.
Connection stiffness
Energy dissipation capacity
The energy dissipation capacity is an index showing the general seismic performance of the connection. The dissipated energy by the stiffened column base is computed as the difference between the area under the loading and unloading phase of the obtained base moment-base rotation plot. The cumulative energy (Table 5) at the end of each excursion signifies the total hysteretic energy (HE) dissipated up to the desired excursion. The HE is then normalized with the elastic energy dissipation capacity, Equation 2 (Ibarra and Krawinkler, 2005), where

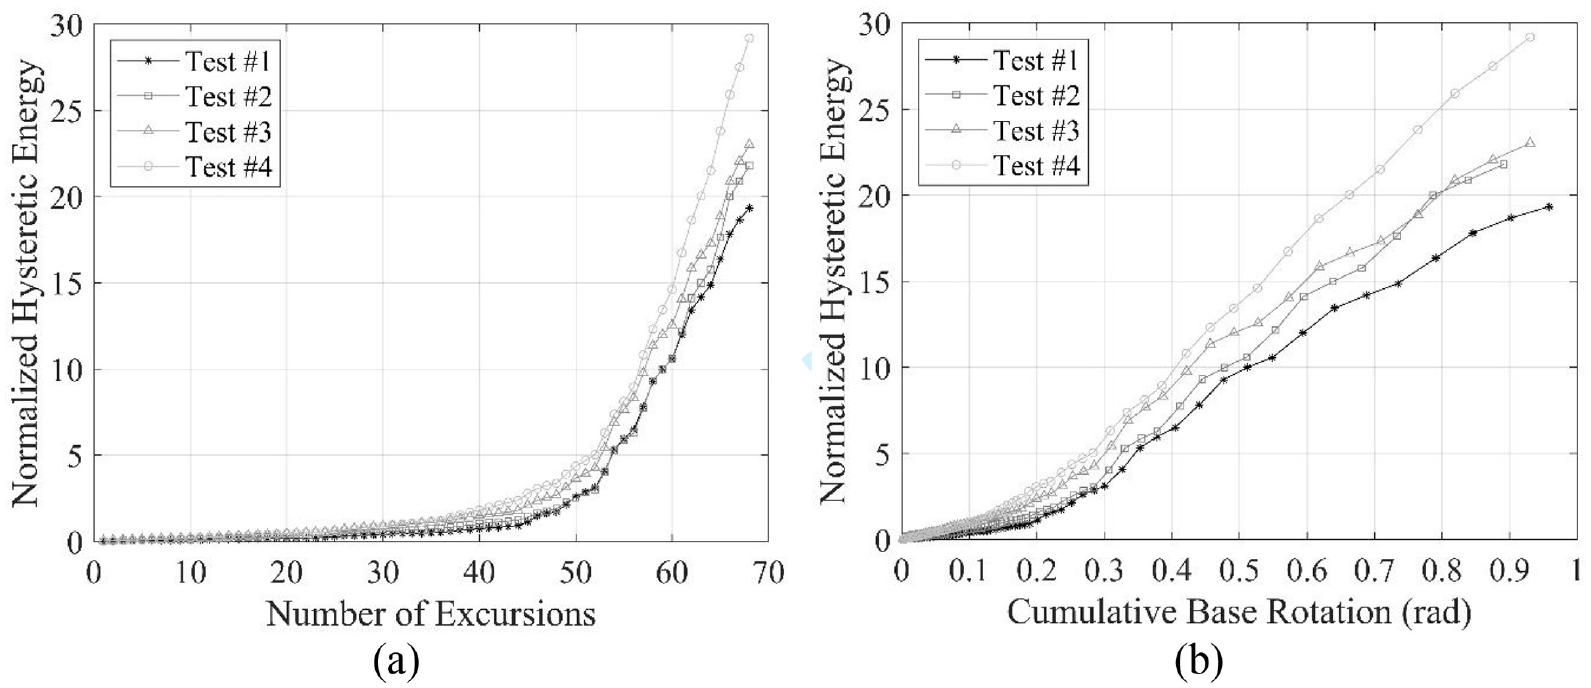
Normalized hysteretic energy versus (a) number of excursions and (b) cumulative base rotation.
The energy dissipation capacity is obtained from the base moment-base rotation plot, while the loading history is based on column top displacement (i.e. column drift). When the recorded column drift is converted to base rotation (Table 5), each specimen experiences an exclusive base rotation time history. Figure 12b demonstrates NHE versus cumulative base rotation for the testing program. In this plot, the maximum base rotation of each excursion is assigned to the reported NHE for that excursion. Plots assess the results up to cycles associated with 6% column drifts since the number of applied 7% column drift half cycles differs among the implemented tests.
Summary
This article documents the findings of a full-scale experimental campaign on stiffened column bases. Stiffened connections are the common design and construction practice in seismic areas of under-developed countries; however, no previous study had exclusively investigated their physical response to seismic excitation. Therefore, four tests are conducted in this experimental program to record the stiffened column bases’ hysteresis response to seismic excitations. Test variables are the number of anchor rod rows, construction method, and base plate thickness. Obtained data are publicly available for potential future use (DOI: 10.5281/zenodo.7058873).
While experimental findings enhanced the knowledge on stiffened column bases, extending the proposed findings is subjected to certain limitations. First, experiments were implemented under a pure bending situation, and the presence of axial load will inevitably affect the flexural strength and general behavior of the connection. Moreover, the foundation depth easily changes the test outcome. Although a deeper foundation might not preclude the undesirable transfer of compression force to anchor rods, its consequences, such as punched foundation, will not govern the results. Furthermore, extrapolation of the conclusions to larger connections needs further investigation since the responses are sensible to base plate thickness and connection rigidity; connection size does not necessarily correlate with the base plate thickness. Future trials should also evaluate the influence of stiffeners’ layout on the behavior. Stiffened column bases are designed with panels restrained in two, three, or four edges; stiffeners braced the panels on all edges in this study. Further research is needed to cover more possible conditions, either by experimental simulations or verified analytical models.
Footnotes
Acknowledgements
The experimental tests were conducted at the structural laboratory of the University of Tehran, Iran. The authors acknowledge the efforts and help of the laboratory staff. This project would have been impossible without the support of the Dada Sazeh Industrial Group because of provided steel parts for the study. The authors also thank the Iran Tohid Company for supporting the research by producing the anchor rod assemblies.
Declaration of conflicting interests
The author(s) declared no potential conflicts of interest with respect to the research, authorship, and/or publication of this article.
Funding
The author(s) received no financial support for the research, authorship, and/or publication of this article.