
Abstract
As the distance from an earthquake increases, the percentage of people who do not feel it also increases. The average transition distance between “felt” and “not felt” reports is mainly determined by the magnitude and depth of the earthquake, but it also depends on the observation floor and building height. Buildings act as resonators and can amplify the shaking at specific frequencies. We analyzed over 286,000 crowdsourced reports to study the effect of floor and building height on earthquake perception. We found that, compared to average values, there is an increase in the percentage of “felt” reports on the highest floors and a decrease in the lowest floors of buildings of all heights. We determined the range within which an observer is likely to feel an earthquake (perception boundary) and examined how it varies with magnitude. We found that as the building height increases, people on higher floors perceive medium to high magnitude earthquakes progressively better than lower magnitude ones. We compared the perception boundary with a model of seismic response spectra to estimate the vibration frequency perceived by observers on each floor/building height combination. Our results show that the value of the fundamental period increases with building height for the top floor, and that higher vibration modes become more evident for buildings with more than 6 stories. In addition, we observed that the height of the building also affects the vibration of the basement, with the frequency tending to decrease as the building height increases. Concerning macroseismic intensity estimation, we show that in tall buildings, observations made on both the upper and lower floors must be considered outside the normal range, and that earthquake perception also changes as a function of magnitude and distance, pointing out the importance of collecting an adequate number of observations to sample different locations of observers.
Introduction
Studies on understanding and modeling building damage under seismic input have shown the complexity of the topic, indicating the importance of the response of the building to ground motion. The response of the building, which also varies with the magnitude and distance of the earthquake, not only determines the damage (Çelebi, 2000; Martin et al., 2015), but also the minor effects typical of low intensities (Brownjohn and Pan, 2001; Drimmel, 1984; Du et al., 2017). In this context, Sbarra et al. (2015) found that the perception of the earthquake is influenced by building height in a magnitude-dependent way. They considered municipalities with Mercalli–Cancani–Sieberg (MCS) intensity = 3 and found that during medium-to-high magnitude earthquakes at large distances from the source, observers on the top floor of tall buildings experience more shaking than those in low-rise buildings. However, they observed the opposite behavior at close distances from small-magnitude events. The different source-radiated spectra, coupled with the frequency of the fundamental vibration mode of the building, may explain these results. High frequencies predominate in the spectrum of small-magnitude earthquakes, resulting in higher excitation of low-rise buildings. However, low frequencies in large magnitude earthquakes shake tall buildings characterized by lower resonant frequencies more intensely. Guéguen and Colombi (2016) conducted an interesting study that used both data obtained from ambient noise measurements and assessments of perceived microseismic intensity at various floors. They found that the vibrations felt depend not only on the building’s natural frequencies but also on the interaction with other buildings and the azimuth of the seismic source.
However, the macroseismic intensity may not be the most appropriate measure to investigate the phenomenon in more detail. This is because it includes a heterogeneous set of effects, ranging from people’s perceptions to the consequences of shaking on objects and buildings. These diagnostics have different characteristics (Brüstle et al., 2020; Lesueur et al., 2013; Oliveira, 2022; Sbarra et al., 2020), causing macroseismic intensity to be an average measure with little sensitivity to different aspects of ground motion. Instead, studying the distribution and intensity of a single effect provides more detailed information. For example, the distance attenuation analysis of individual effects suggested that each of them is an expression not only of the intensity but also of the specific frequency of vibration (Sbarra et al., 2021; Tosi et al., 2017). To obtain this result, Tosi et al. (2017) highlighted the differences between the attenuations through the magnitude–distance scaling ratio, that is, the ratio of the two coefficients of each attenuation model, namely that of the logarithm of the hypocentral distance and that of the magnitude. The comparison with the corresponding values obtained with a ground-motion model (GMM) of response spectra indicated a frequency range associated with each effect. This link explains some experimental observations, such as the frequent lack of oscillation of suspended objects in the case of small earthquakes, whose radiated spectrum is poor in low frequencies.
Therefore, studying a single diagnostic effect, as opposed to macroseismic intensity, may provide a better understanding of the influence of other parameters. For example, Lesueur et al. (2013) used the natural frequencies of the building to explain the correlation between specific macroseismic effects and seismic response spectrum in the frequency range of 1–10 Hz. Among the various effects, people’s perception of the earthquake allows for an in-depth analysis due to the possibility of studying the effect in different locations (higher or lower floors, outdoors) and situations (sleeping, at rest, in motion) of the observer (Sbarra et al., 2014). The study of perception in this level of detail could also quantify the well-known phenomenon of amplification occurring on the upper floors of buildings. Macroseismic scales (Grünthal, 1998; Sieberg, 1930; Wood and Neumann, 1931) generally mention the upper floors of buildings, but a systematic study of this effect (Sbarra et al., 2012) is rarely done due to the slight shaking involved.
A problem related to the detailed study of floor-building height is the reduction of data within the whole data set for each combination. For example, the magnitude–distance scaling ratio method (Tosi et al., 2017) required regression of an intensity prediction equation for each effect and was consequently applied only to cases where a large amount of data were available. Sbarra et al. (2021) proposed an alternative method based on discriminant analysis that proved suitable for application to a smaller data set, such as observations of those who did or did not feel an earthquake while in a stationary car. In this case, comparison with the GMM allowed them to identify the resonant frequency of the car-observer system.
Here, we apply the method by Sbarra et al. (2021) to earthquake perception crowdsourced data from observers at rest indoors to determine the resonant frequencies of 1- to 10-story buildings. The results, obtained from a considerable number of observers distributed throughout the territory after verifying their consistency with values derived by other authors from instruments, indicate the average seismic response of Italian buildings to small shaking.
Crowdsourced data
In recent years, seismology has benefited from collaboration with citizens who voluntarily share their experience after feeling an earthquake. These data, known as macroseismic data, are collected by many research institutes (some examples are Bossu et al., 2018; Goded et al., 2021; Quitoriano and Wald, 2020) such as the Italian service HSIT (Hai Sentito Il Terremoto; Tosi et al., 2007) of the Istituto Nazionale di Geofisica e Vulcanologia. HSIT includes an online questionnaire for volunteers or subscribers, which asks questions about the effect of the earthquake, the observer’s location (e.g. inside a building), and condition (e.g. at rest or moving). When an earthquake occurs, the automated procedure sends an email to subscribers who may have felt the shaking, chosen in a range depending on magnitude (Tosi et al., 2015), requesting information. This specific email call guarantees the presence of negative responses to the question: “Did you feel the earthquake?” Almost half of the questionnaires received are “not felt,” which allows for assigning the lowest degrees of macroseismic intensity (2 and 3), mainly based on the percentage of “felt,” and investigating the radius of the “felt” area. The number of subscribers increased significantly over time, with significant surges during major earthquakes, such as during the Northern Italy earthquake sequence in May 2012. At the beginning of 2013, there were about 12,700 subscribers, and since then, the increase has been minor and more stable, averaging four new subscribers per day.
For the analysis presented here, we used Italian earthquake data with a magnitude of 2 or greater that occurred between 2013 and 2020. We considered the Mw magnitude for each event, and when not provided, we converted ML or Md to Mw using the conversion equations of Gasperini et al. (2013). We then excluded earthquakes with fewer than six archived questionnaires as they are usually either small or deep or off-shore events that are not commonly felt, and the few questionnaires present are most likely unreliable. We also discarded some earthquakes at high risk of inaccuracy that occurred close to a major event, using an automatic procedure (Cameletti et al., 2017).
The data used in this analysis are based on indoor observers’“felt”–“not felt” reports about single earthquakes. We know that the perception of earthquakes can differ among observers depending on their condition (Sbarra et al., 2014). To prevent different conditions from affecting the results, we only selected observers who reported being at rest, which are those most sensitive to small oscillations. This resulted in a data set of over 286,000 observations.
While many factors can influence the shaking and the perception of an earthquake, such as the geometry of the building, the building material, and the soil class, the use of crowdsourced data precludes the availability of such detailed information. However, the large amount of data will provide a sampling of many different cases and the potential to delineate an average behavior for Italian buildings and soils.
It was possible to study how an observer perceives an earthquake as a function of floor and building heights because the questionnaire included two required-response items asking for the floor at the observer’s location and the total number of stories in the building. The range of heights investigated was from 1 to 10 stories, with an additional class for buildings with more than 10 stories. However, it is important to note that the labeling of building floors is not always consistent. Some confusion arises from the numbering of the street-level floor, which is counted by some as 0 and by others as 1, which changes the number assigned to the upper floors. The indication of the building height can also be ambiguous, as it may include the street-level floor or only the next floors. For example, an observer may have assessed the height of a building consisting of the street-level floor plus two other floors as either 3 or 2. In the multiple choice answer in the questionnaire and in this analysis, we adopted the numbering of floors that considers the street-level floor as 0 (ground floor) and the next floor as 1 (second floor). In addition, for the building height, all floors, including the ground floor, were counted. However, this uncertainty in the data provided by citizens may have resulted in some data being shifted to the next floor or the same floor of a lower building, causing data to be on a floor that is unrealistically higher than the total height of the building. Given the impossibility of resolving this uncertainty and the presence of different building geometries not covered by the questionnaire (basement, mezzanine floor, penthouse floor, street-level difference), we analyzed the data by accepting the answers given by citizens. Figure 1 shows the amount of data analyzed for each combination of building height and floor. Most data refer to buildings up to 4 stories high, which are the most common in Italy.
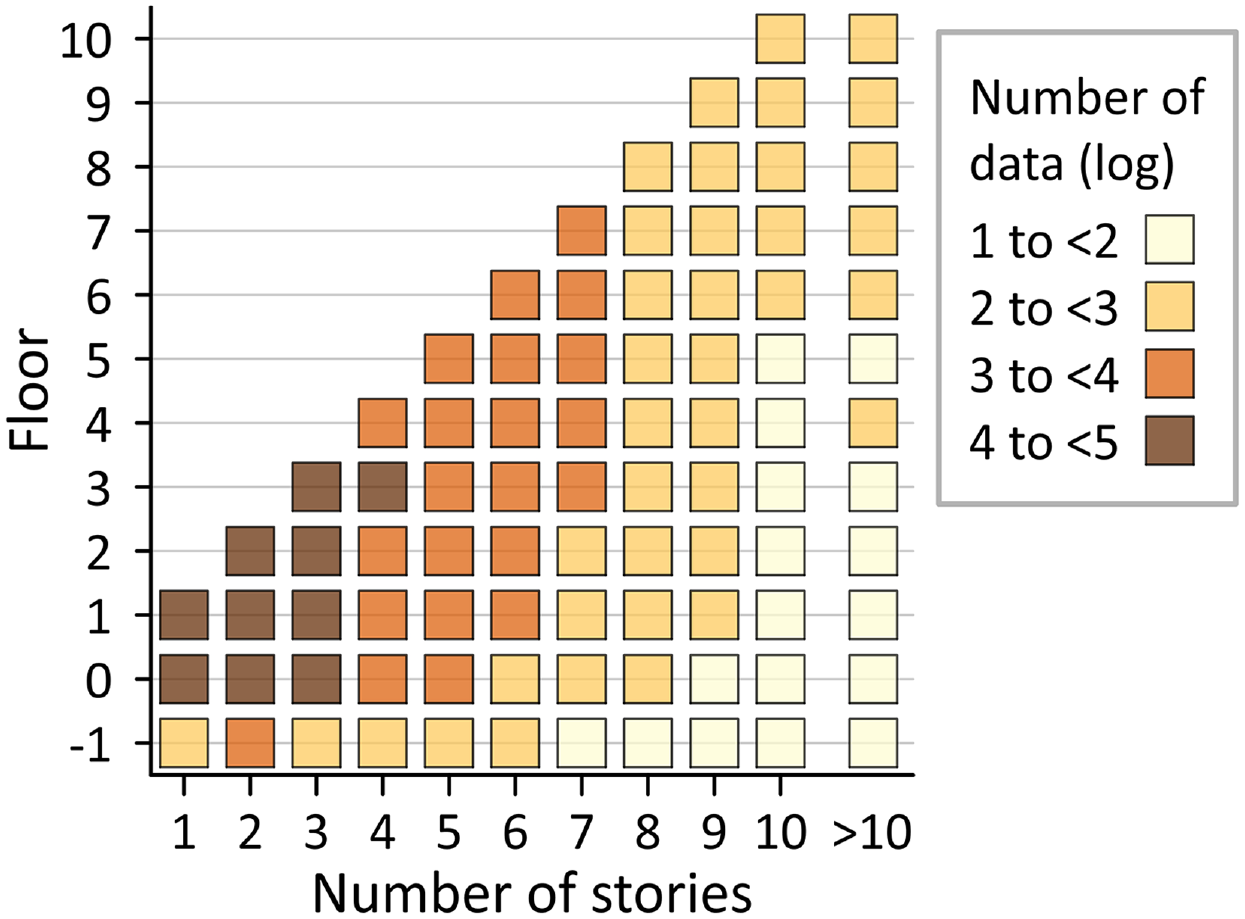
The number of data analyzed (decimal logarithm) for each combination of building height and floor.
Influence of floor and building height on “felt” percentage
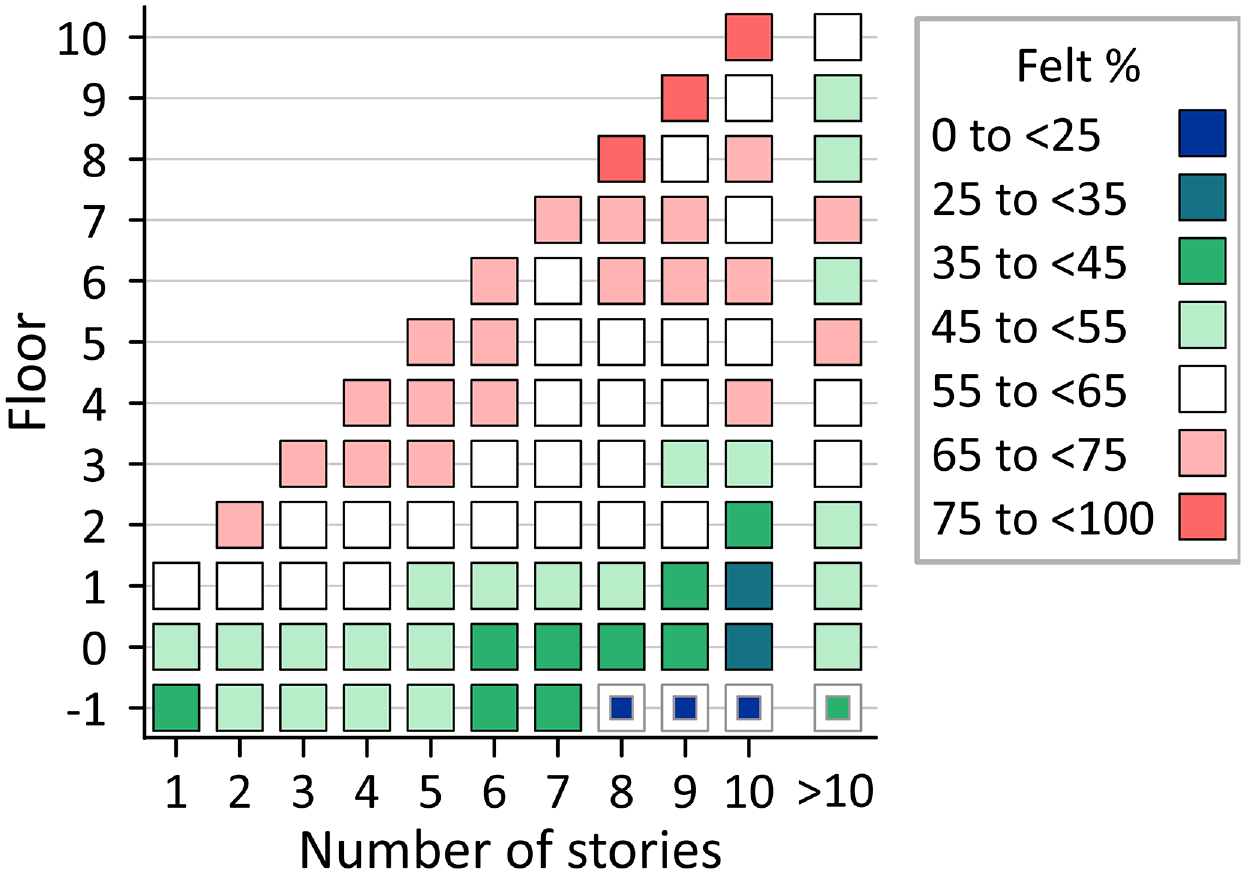
Percentage of “felt” reports by observers at rest for each combination of building height and floor. Reduced squares indicate less reliable values as calculated with few data (less than 50).
Figure 2 shows a trend of the earthquake perception that depends on the observer’s floor, indicating the validity of this analysis, even when the perception data include earthquakes of different magnitude and distance. Higher “felt” values are observed on the top floors of all buildings, as expected. This can be explained by viewing the building as a simple harmonic oscillator where the strength of the main mode increases upward, similar to a cantilever beam. On the contrary, the ground and basement floors always show a percentage of “felt” lower than the reference class, particularly in buildings taller than 5 stories. In addition, buildings 9 and 10 stories high exhibit a more irregular and alternating pattern, with cases falling within the reference class, likely due to the higher vibration modes (Guéguen and Colombi, 2016). The “felt” values for buildings over 10 stories, although consistent with the results of other cases, are approximate as they refer to a set of buildings with different heights.
In the context of macroseismic intensity estimation, these results not only confirm the higher “felt” percentage on the top floors but also provide evidence of a relatively reduced “felt” percentage on the lowest floors. Therefore, the usual recommendation to disregard information from observers located above the fifth floor appears simplistic, as even in the lowest buildings there is an increase in “felt” percentage on the top floors. In addition, there is a decrease in “felt” percentage on the ground and basement floors in all buildings that was never evidenced. We further examined the link between perception and the natural vibration frequency of buildings. To do this, we also considered the earthquake magnitude and the observer’s distance from the hypocenter, as detailed in the following section.
Earthquake perception boundary and vibration frequency
As the distance from the epicenter increases, more and more observers report that they did not feel the earthquake. The perception boundary between “felt” and “not felt” mainly depends on the magnitude and depth of the earthquake. Analysis of data from all observers who were indoors and at rest, plotted as a function of hypocentral distance and magnitude (Figure 3a), shows that the “felt” reports give way to the “not felt” reports, which are more prevalent on the right-hand side and bottom of the figure. In this area, there are also several likely erroneous “felt” reports, probably from observers who selected the wrong earthquake in the questionnaire. This problem is difficult to eliminate even with filters applied (see Crowdsourced data section). Similarly, although not easily visible due to the overlapping symbols, there are also several doubtful “not felt” reports in the main “felt” area. However, we observed that there are far fewer erroneous reports than reasonable ones, so we rely on statistical analysis to account for errors or real exceptions on both sides.
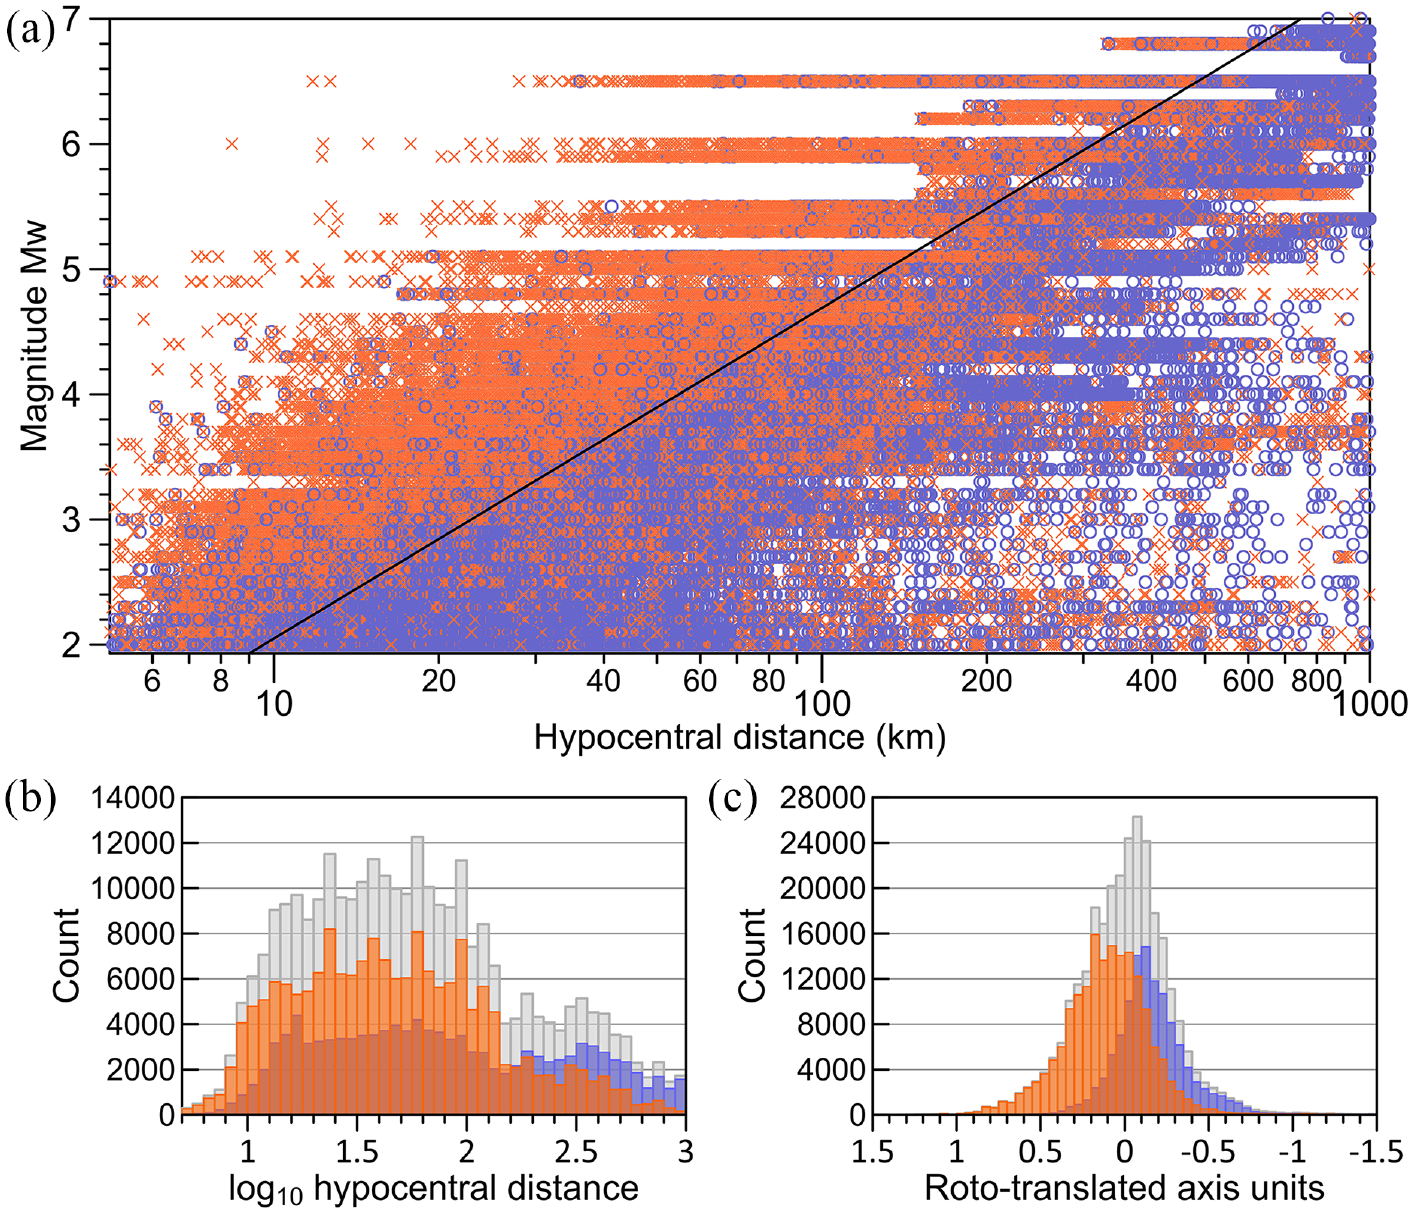
(a) Observers at rest inside a building (without distinction to floor and height of the building) who felt (orange crosses) or did not feel (blue circles) the earthquake, whose magnitude we show in ordinate, as a function of their distance from the hypocenter. We derived the earthquake perception boundary (black line, Equation 1) by discriminant analysis. (b) Histogram of total (gray line), “felt” (orange), and “not felt” (blue) data versus hypocentral distance. (c) Histogram of total (gray line), “felt” (orange), and “not felt” (blue) data versus distance from the discriminant line (Equation 1).
We used a method based on discriminant analysis applied to questionnaire data to find the line that best separates the observers who felt the earthquake from those who did not. The data were evaluated as a function of the decimal logarithm of hypocentral distance (logR) and magnitude (Mw) (Sbarra et al., 2021). For all data shown in Figure 3a, the discriminant analysis identifies, with a probability associated with F-test of less than 10−4, the following equation:

Table 1 shows the classification of “felt” and “not felt” data made according to Equation 1, compared with the observed “felt” and “not felt.” The table shows that classification by discriminant line is in agreement with observations for 74% of the data, with similar percentages in the two cases (77% for “felt” and 72% for “not felt,” respectively).
Classification summary of the discriminant analysis applied to the earthquake “felt”–“not felt” data (Figure 3)
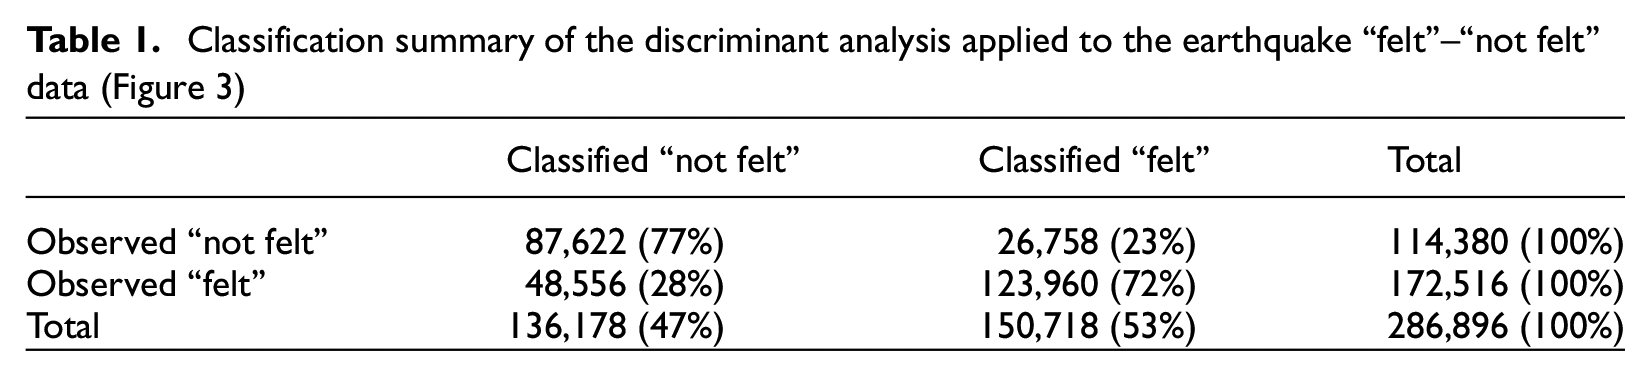
Figure 3 illustrates the principle of discriminant analysis in practice. The histogram of the number of “felt” and “not felt” reports is displayed as a function of both distance from the hypocenter (Figure 3b) and distance from the discriminant line (Figure 3c). In the latter case, the two distributions are separated at their best, making the discriminant line the boundary of earthquake perception. In this context, the slope of the boundary line highlights the mutual role of distance and magnitude in determining the shaking intensity. For this reason, we investigated in more detail the effect of the building on perception by subdividing data shown in Figure 3 and applying the discriminant analysis to the individual subsets corresponding to each floor/building-height combination.
The discriminant lines found were considered significant if both the number of data exceeded 50 and the probability associated with the F-test was less than 0.005. Among the different combinations, only four related to basement floors failed to meet the minimum data and F-test thresholds. In Figure 4, we show the slope values of the significant lines as a function of the number of stories of the building.
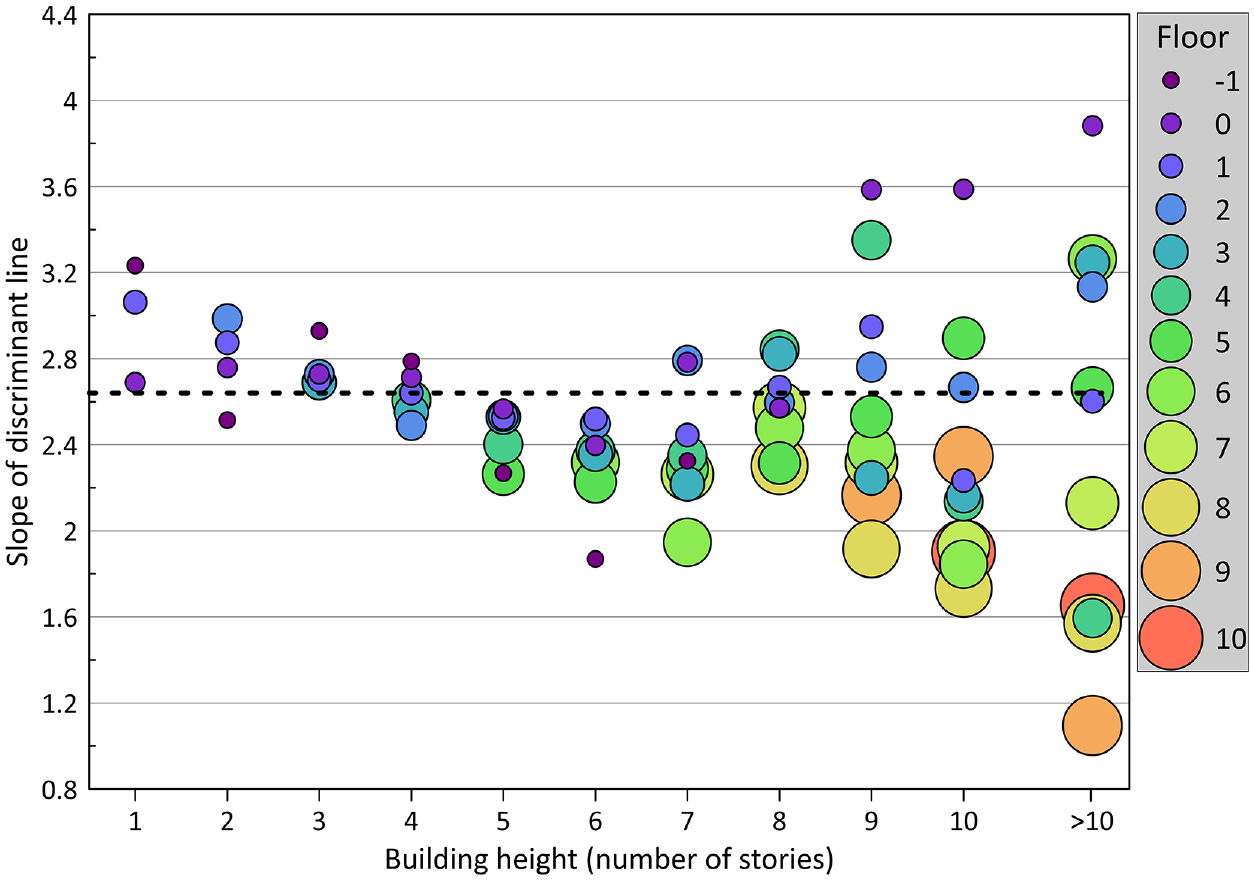
Slopes of the linear earthquake perception boundary for observers on different floors plotted as a function of the building height. The black dashed line marks the slope value (2.64) of the discriminant line calculated from the total data of observers at rest inside a building (Equation 1).
It is noteworthy that for buildings with 1–6 stories, the slope of the discriminant line generally decreases. In addition, for individual floors of buildings with more than 6 stories, the slope values become more varied as the height increases. It is important to remember that the slope of the boundary line of perception reflects the attenuation of shaking as the magnitude changes. Specifically, a decrease in slope indicated a significant difference in the perception for small and medium-to-high magnitude earthquakes.
As shown by Sbarra et al. (2021), the slope of the discriminant line represents the same concept as the scaling ratio defined by Tosi et al. (2017), that is, the ratio of the coefficient of the logarithm of the hypocentral distance to the coefficient of the magnitude in the equation that estimates the perception of shaking in the form of:

where PE represents the ratio between the number of “felt” and the total number of questionnaires (both “felt” and “not felt”). To verify this equivalence, we applied the method of Tosi et al. (2017) to the entire set of earthquake perception data (Figure 3a). The large amount of data allowed us to apply the Tosi et al. (2017) method, which involves regression of Equation 2 on the attenuation of the rate of people who perceived the earthquake. We calculated the rate PE, stacking data of all earthquakes with the same magnitude (with the accuracy of one decimal place) within a 0.02 logR-wide window. Through least squares regression, we estimated Equation 2 as:

leading to a scaling ratio value S = −a3/a2 = 2.68. In Tosi et al. (2017), the same method applied to perception data from all observers located within a building yielded a slightly lower value (S = 2.32). However, comparison with the case presented here is not straightforward because the databases analyzed differ in terms of temporal range and reference magnitude (Ml for the former). The major difference is likely due to the selection, in this case, of only those observers who were at rest, thus excluding moving and sleeping ones. The observer’s activity can significantly influence the perception of earthquakes (Sbarra et al., 2014). However, within confidence limits, the S-value calculated here (2.68) shows good agreement with the slope of the discriminant line (2.64) estimated on the same data set, thus supporting the possibility of comparing the values derived from the two methods.
We compared the slopes of the perception boundaries shown in Figure 4 to the S-values derived from a GMM. In particular, we chose the 5% damped horizontal response spectrum model of Cauzzi and Faccioli (2008) because it has the same functional form as Equation 2, which allowed us to obtain a value of S for each frequency considered (Figure 5). The variation of frequency (F) plotted as a function of S shows a simple trend highlighted by the second-degree least squares regression curve:

that interpolates the points, within the ranges of 0.9 ≤ S ≤ 3.5 and 0.1 ≤ F ≤ 10. The very high number of points at the left of the plot has been reduced and substituted with a moving average data set to obtain a stable regression. The sole purpose of Equation 4 was to make it easy to find the frequency of the response spectrum that corresponds to a particular value of S. For this reason, we considered frequency as the dependent variable in the regression. Each slope value of the discriminant line (Figure 4) was thus associated, through Equation 4, with the natural frequency of the harmonic oscillator whose oscillation amplitude attenuates with the corresponding scaling ratio S. The resulting Figure 6 shows that the general decrease of the discriminant slope, from 1- to 6-story buildings, corresponds to a frequency lowering. This experimental observation agrees with a simple model of an oscillating building where the frequency of the primary mode decreases with increasing height. The behavior is evident on the top floors of buildings (highlighted by bold circles in Figure 6) and is characterized by a relatively consistent decrease in frequency. In addition, taller buildings show a broader range of frequency, as the value of each floor deviates more from that of the top of the building. This observation may be related to the significant contribution of higher vibration modes to the motion of middle and lower floors. This effect was previously noted by Guéguen and Colombi (2016) in three 29-story buildings, where occupants reported higher macroseismic intensities on the middle floors (10th to 20th). The presence of higher vibration modes in tall buildings allows the observers to perceive both low frequencies, typically associated with distant major earthquakes, and high frequencies, which are present near small earthquakes.
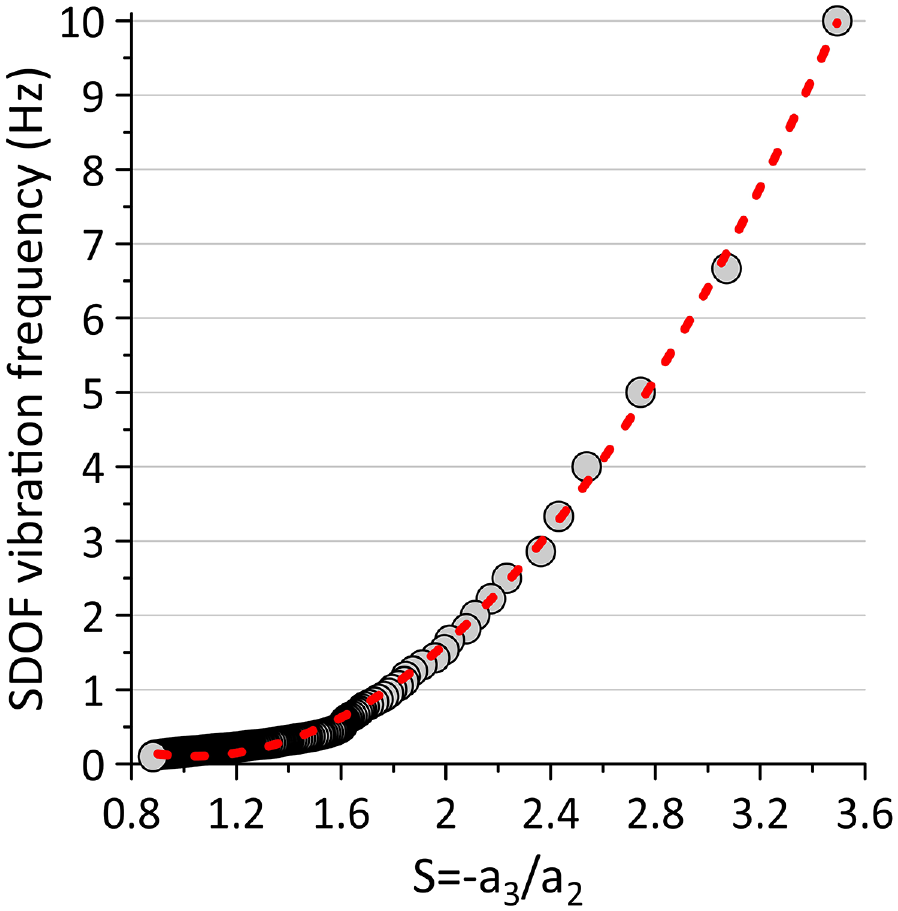
Scaling ratio values (S, ratio of the coefficients in Equation 2) and corresponding frequencies of the GMM by Cauzzi and Faccioli (2008). The red line represents the interpolation of the points by Equation 4.
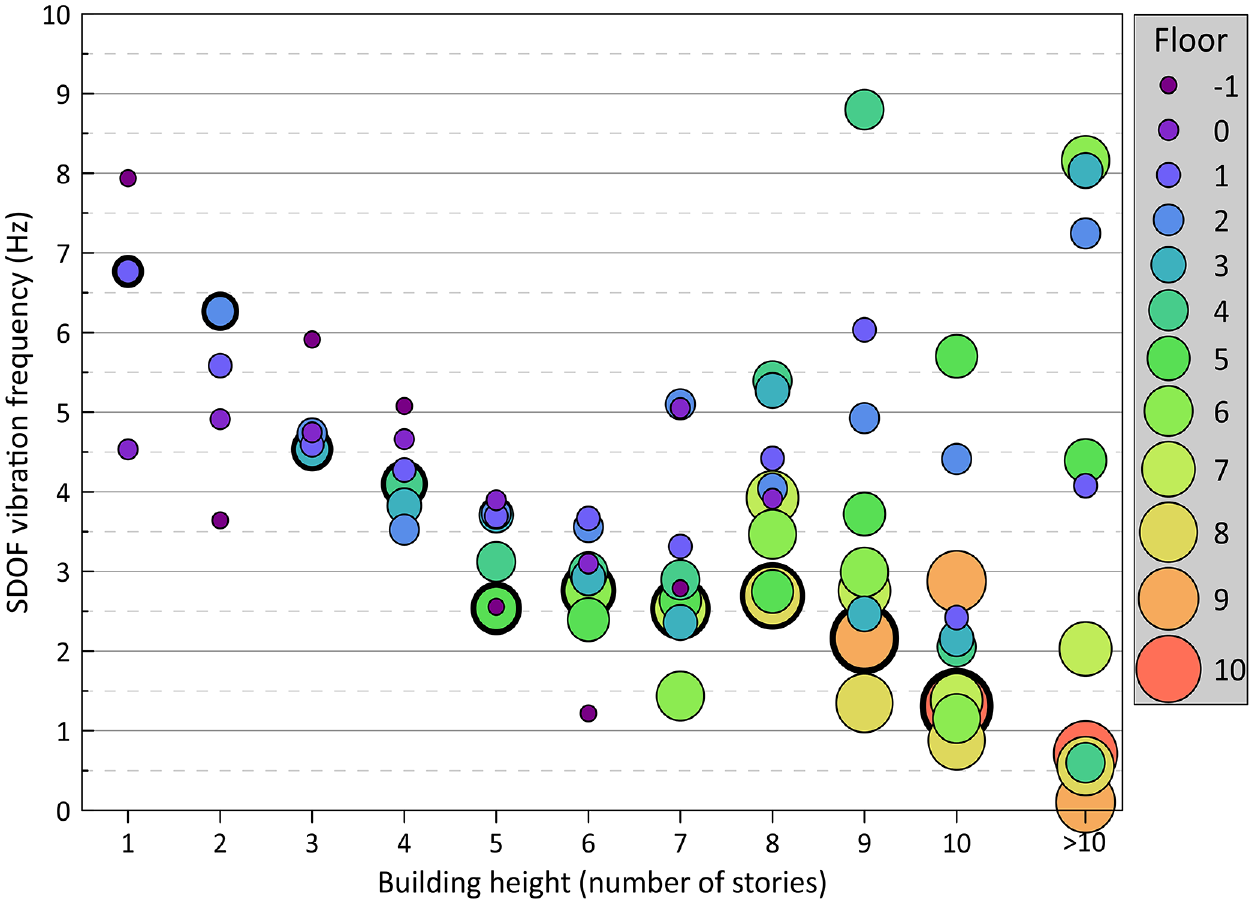
Natural frequencies corresponding to the slope of the linear earthquake perception boundary (Equation 4) for observers located on different floors, plotted as a function of building height. The data are limited to the values for which Equation 4 is defined (0.1–10 Hz); for this reason, some symbols representing the ground floor in tall buildings (3 violet points in Figure 4) are missing. The bold circles help to identify the top floors.
The natural frequency of a building is determined by mass and stiffness distribution, as well as by other factors such as height, building typology, and geometry. Both structural and non-structural components also affect natural frequencies. Due to the complexity of calculating the natural frequency directly, simplified models or experimental observations are often used. Sbarra et al. (2015), through the simulation of a three-dimensional model of a 2-story and a 10-story building, evidenced natural periods, respectively, of 0.10 and 0.57 s (frequencies of 10 and 1.8 Hz). These two values, which confirm that tall buildings have lower natural frequencies than short ones, are similar to those we found for the top floor, where fundamental mode reaches its maximum amplitude (6.3 and 1.3 Hz).
A collection of measurements made using horizontal-to-vertical noise spectral ratio on the top floor of 96 Italian buildings of various types and years of construction (Gallipoli et al., 2020) shows that the first vibrational frequency value decreases as the number of stories increases, which is in line with expectations. The values from the study are close to those we found for the top floors of buildings. Specifically, our values fall between the 25th and 75th percentiles of the natural frequency values distribution for each building height, ranging from 2 to 7 stories (Gallipoli et al., 2020). The only exception is for the 5-story building, where our value (2.5 Hz) is slightly lower than the corresponding measure (3 Hz).
With the aim of formulating an approximate regional prediction of natural frequencies as a function of height, we performed a regression of a linear relationship through the origin between the fundamental period (T) in seconds estimated at the top floor with our data and building height (h) in meters computed from the number of stories N (h = 3.5 N + 1). The line through the origin was obtained using least squares regression method:

The coefficient of proportionality found in this study is very similar to those found in other studies through ambient noise measurements. Specifically, a coefficient of 0.016 was found for a set of 244 1- to 10-story buildings in four European countries, including Italy (Gallipoli et al., 2010) and a coefficient of 0.0167 for a set of 96 2- to 8-story buildings in a city of southern Italy (Gallipoli et al., 2020).
Processing macroseismic data has many positive aspects such as the availability of a large amount of data and continuity with past earthquake results, but it can be challenging to make subjective, qualitative information quantitative. This study also highlighted the difficulties in identifying the floor and building height. However, the consistency of the results and the agreement with the values obtained by other methods suggest that the perception data provided by citizens are reliable, despite the usual problems associated with this type of data.
Other variables besides the observer’s state of stillness or motion should be considered when analyzing perception in more detail, such as position (standing, sitting, lying down) or alertness. However, asking people for such detailed information might discourage them from completing questionnaires, resulting in further data reduction. In previous studies (Sbarra et al., 2012, 2014, 2015, 2021) that used a smaller time interval, researchers analyzed the situation regardless of the location of the observer and vice versa. These analyses still showed variations as a function of magnitude and distance, which emphasizes the importance of the frequency content of the vibration for earthquake perception. This is also true for other macroseismic effects. Tosi et al. (2017) showed that diagnostic effects typical of low macroseismic scale degree occur at different resonant frequencies. For example, the oscillation of suspended objects occurs preferentially at low frequencies (<0.5 Hz), unlike the vibration of doors and windows (∼2.5 Hz). Therefore, the occurrence of effects depends on coupling between the natural frequency of objects and buildings, besides the frequency content of the ground motion. To correctly assess the macroseismic intensity, a large enough amount of data are essential to ensure a broad sampling of the various situations, location, and buildings, especially when estimating MCS degrees 2 through 5, based on the perceptions of people and effects on small objects.
Conclusion
In this study, we analyzed earthquake perception data from observers who were at rest, according to the floor and height of the building where the observer was located. We first calculated the overall “felt” percentages to highlight the relative variations. We then explored the topic further by analyzing the data as a function of earthquake magnitude and distance, highlighting the role of these two factors in determining perception, in connection with the floor and building height. In detail, we compared the variation in distance, within which observers placed on the floors of buildings of different heights perceived the earthquakes of different magnitude, with that given by a GMM. The comparison helped to indicate the vibration frequency responsible for the perception of earthquakes at each floor of buildings of different heights. Based on many observations, these approaches yielded results that would otherwise have been difficult to obtain with few instruments.
The main results of the study are as follows:
Higher than average “felt” percentages are observed on the top floors of buildings, with maximum values in tall buildings (8, 9, and 10 stories).
The estimated vibration periods of the top floor of buildings increase in proportion to building height, with a coefficient of proportionality (0.017) that is very similar to that estimated by other authors in Italian buildings by ambient noise.
In low buildings (1–6 stories), the first natural mode dominates, whereas in tall buildings (7 to >10 stories), other frequencies are also observed probably due to higher vibration modes, an explanation further supported by the alternation of different values of percentage of “felt” in the intermediate floors of tall buildings (9, 10, and >10 stories).
Lower than average “felt” percentages are observed on the low and basement floors of buildings, with the minimum values in tall buildings (6–10 stories).
Ground floors of different buildings have similar vibration frequencies (in the range of 3–5 Hz for buildings 1–8 stories).
Basement floors have different vibration frequencies (in the range of 1–8 Hz for buildings 1–7 stories) with a tendency to decrease as building height increases, indicating that whole-building vibrations affect the basement.
Some of the results are not surprising from an engineering perspective, but being able to obtain them with crowdsourced “felt”–“not felt” observations demonstrates the value and reliability of citizen data. One of the most interesting findings is the unexpected behavior of the lower floors of tall buildings, within which citizens felt earthquakes less than those on the same floors of lower buildings. The reason for this phenomenon could be related to the greater foundation depth of tall buildings, but we could not investigate this aspect further. In fact, since buildings with more than one basement floor are quite rare in Italy, in our data, all possible basement floors are grouped into a single class, thus limiting the possibility to investigate the basement effect in depth.
It is worth noting that the variation in vibration frequency of basement floors indicates the effect of the entire building’s shaking on its foundations. This highlights the importance of caution when evaluating a building’s response, as recordings from basement floors should not be assumed to represent pure free-field excitations.
As a final point, we stress the importance of knowing the position of the observer in order to correctly assign macroseismic intensity, since ground motion frequencies and building resonance can influence any diagnostic effect (Oliveira, 2022), including earthquake perception. To give an application example, we recall that EMS (Grünthal, 1998) recommends neglecting observer reports above the fifth floor (interpreted as fifth above the ground floor by Brüstle et al., 2020). Whereas, following our results, it would be more appropriate to apply two opposite correction factors to the observations made in the tall buildings at both the top and the bottom floors.
The role of building height is further complicated when vibration frequencies are also considered, which result in different behavior depending on the earthquake magnitude. This means that each floor of buildings of different heights may vibrate more or less as the magnitude and distance from the earthquake change. For example, an observer located at the top of a tall building will be able to feel, more easily than on intermediate floors, a large distant earthquake, but may not feel a small earthquake occurring nearby. Therefore, in order to assign a reliable macroseismic intensity independent of earthquake magnitude, we recommend calculating the percentage of “felt” over a large sampling of the different floors and heights of the buildings in which the observers are located.
Footnotes
Acknowledgements
The authors express their gratitude to all citizens who provided “felt”–“not felt” information and to Diego Sorrentino for maintaining the HSIT website. Without these contributions, this work would not have been possible.
Data and resources
The data used in this manuscript were taken from the database of the Hai Sentito Il Serremoto (HSIT) system (Tosi et al., 2007). These data are available in an open-access repository (Sbarra et al., 2022) for any researcher interested in using them for their own analysis.
Declaration of conflicting interests
The author(s) declared no potential conflicts of interest with respect to the research, authorship, and/or publication of this article.
Funding
The author(s) received no financial support for the research, authorship, and/or publication of this article.