
Abstract
A comprehensive database that has been used to develop ground motion models for induced earthquakes in the Groningen gas field is provided in a freely accessible online repository. The database includes more than 8500 processed ground motion recordings from 87 earthquakes of local magnitude ML between 1.8 and 3.6, obtained from a large network of surface accelerographs and borehole geophones placed at 50 m depth intervals to a depth of 200 m. The 5%-damped pseudo-acceleration spectra and Fourier amplitude spectra of the records are also provided. Measured shear-wave velocity (VS) profiles, obtained primarily from seismic Cone Penetration Tests (CPTs), are provided for 80 of the ∼100 recording stations. A model representing the regional dynamic soil properties is presented for the entire gas field plus a 5 km onshore buffer zone, specifying lithology, VS, and damping for all layers above the reference baserock horizon located at about 800 m depth. Transfer functions and frequency-dependent amplification factors from the reference rock horizon to the surface for the locations of the recording stations are also included. The database provides a valuable resource for further refinement of induced seismic hazard and risk modeling in Groningen as well as for generic research in site response of thick, soft soil deposits and the characteristics of ground motions from small-magnitude, shallow-focus induced earthquakes.
Keywords
Introduction
Induced earthquakes have occurred in the Groningen gas field in the Netherlands since 1991, almost three decades after production began in 1963 (van Thienen-Visser and Breunese, 2015). The largest earthquake occurred on 16 August 2012 with a local magnitude of ML 3.6 and a moment magnitude of
The work undertaken by the teams contracted by NAM to develop these GMMs is now completed, and the purpose of this article is to make the extensive databases developed in this work, which have always been openly shared on request, available to all interested parties. The ground motion database is introduced and discussed first, including the VS profiles at the recording stations, followed by a brief description of the field-wide VS model. The final section of the article presents the derivation of the zone- and station-specific Amplification Functions used to transfer pseudo-acceleration response spectra from the baserock horizon of the Groningen GMM to the surface.
A copy of the database is stored in and available to download from the OSF repository (Ntinalexis et al., 2022).
Ground motion database
Recording stations and events
The ground motion database contains records obtained by the KNMI B- and G-networks during 87 events of magnitude equal or larger than ML1.8 that occurred between 2006 and 2021 (Figure 1). The B-network is an accelerograph network that currently comprises 12 stations, with another seven having been decommissioned. The operation of the first stations began in the 1990s, with the network being upgraded and expanded in 2013 and 2014 in order to contribute to the large-scale data acquisition program carried out by the field operator, NAM, in collaboration with KNMI, which operates the networks, following the August 2012 Huizinge earthquake. The names of the stations were also modified during the upgrade. The accelerographs are located on the ground floor of small, lightweight buildings of the region, with the exception of (now decommissioned) stations BUHZ, WIN/BWIN, and ZAN1/BZN1, which were located in basements.
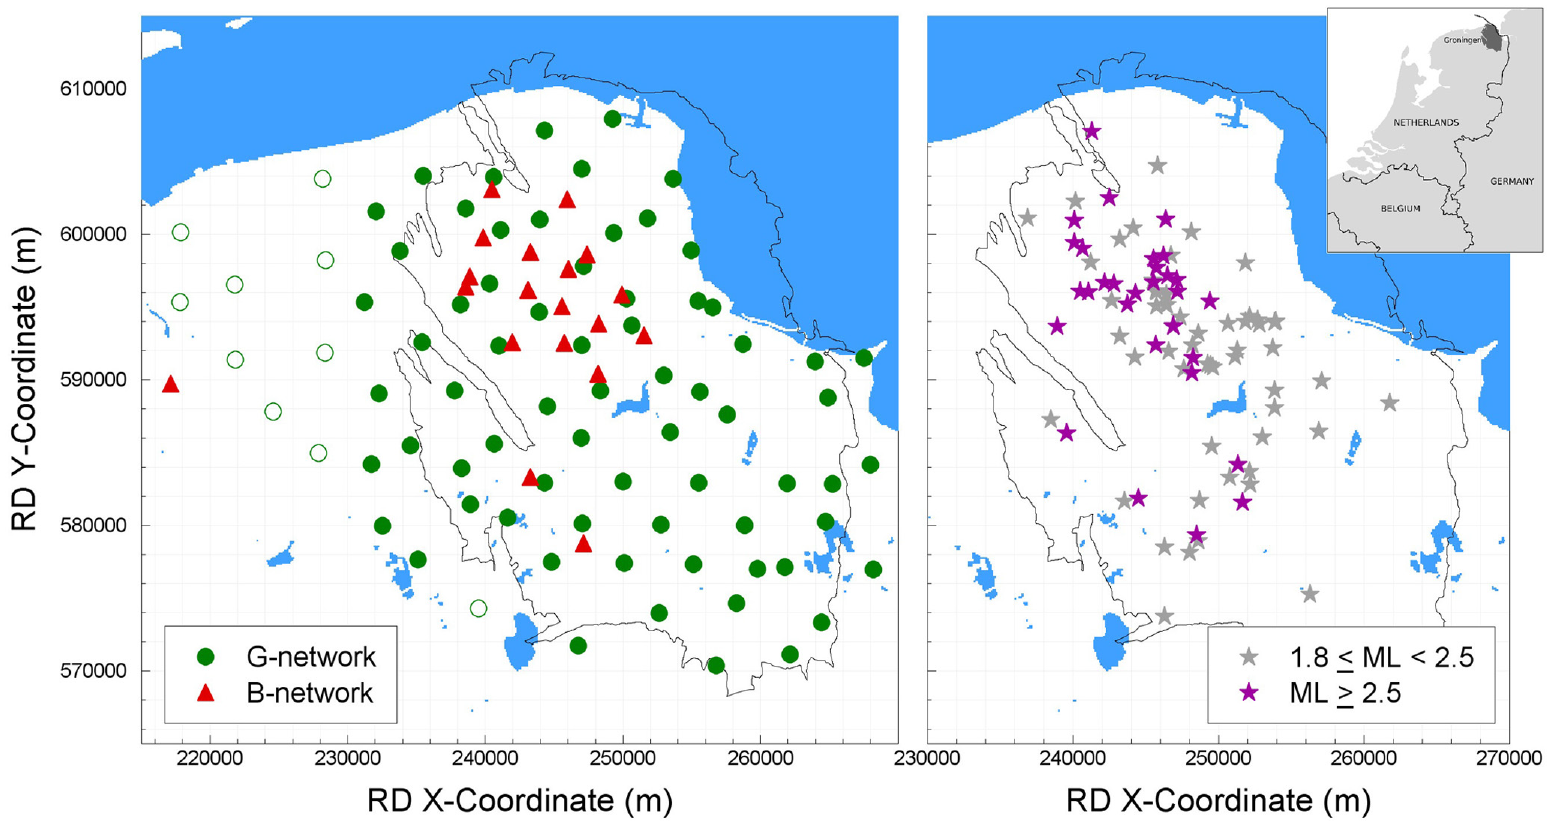
Locations of recording stations (left) and epicenters of events (right) in the Groningen field (black outline). G-stations without geophones are shown in open circles. The inset shows the location of the field in the north-east Netherlands.
The G-network was constructed between 2014 and 2017 as part of the same data acquisition program, with the objective to increase the coverage over the entire field and also to increase the sensitivity and accuracy in recording small-magnitude events and reduce the event location threshold (Dost et al., 2017; Spetzler and Dost, 2017). The network comprises a total of 80 stations, which were placed in remote locations to minimize the noise in the recordings. All stations contain an accelerograph at the ground surface, while 70 stations also contain four borehole geophones with a vertical spacing of 50 m, from a depth of 50 to a depth of 200 m.
The networks are discussed in greater detail by Dost et al. (2017), while Ntinalexis et al. (2019) describe quality assurance procedures that have been carried out to determine the usability of the recordings. The raw records of the database are downloadable from the KNMI website (KNMI, 1993). The metadata of the stations are provided in the database, including the location coordinates in the Rijks-Driehoek (RD; ESPG:28992) system.
Several other networks have operated periodically in the Groningen field, such as a tiltometer network (Bal et al., 2019), the Groningen “Household” accelerograph network, the NAM facilities accelerograph network, and NAM’s portable geophone network (Ntinalexis et al., 2019). Records from the latter were used to explore spatial correlation of ground motions (Stafford et al., 2019). Records from the NAM facilities accelerographs were not used because of their noise contamination by virtue of their close proximity to the operation of heavy machinery. While thousands of records have been obtained by the Household network and extensive work has been carried out to determine their usability (Ntinalexis et al., 2019), it is not possible to share these records publicly as the locations of the stations are locations of local houses and protected by privacy laws. Finally, records from the tiltometer network cannot be used as access to them has not been made openly available.
The earliest event included in the database is the 8 August 2006 ML3.5 Westeremden event, while the latest is the 16 November 2021 ML3.2 Garrelsweer event. The 2012 ML3.6 Huizinge earthquake is the largest magnitude event. As shown in Figure 2, the database is dominated by events of magnitudes smaller than ML2.5 (by approximately 64%), the reliable recording of which, however, was only made possible after the upgrade and expansion of the local recording networks. A discussion on the relationship between local and moment magnitude in Groningen is discussed by Dost et al. (2018, 2019).
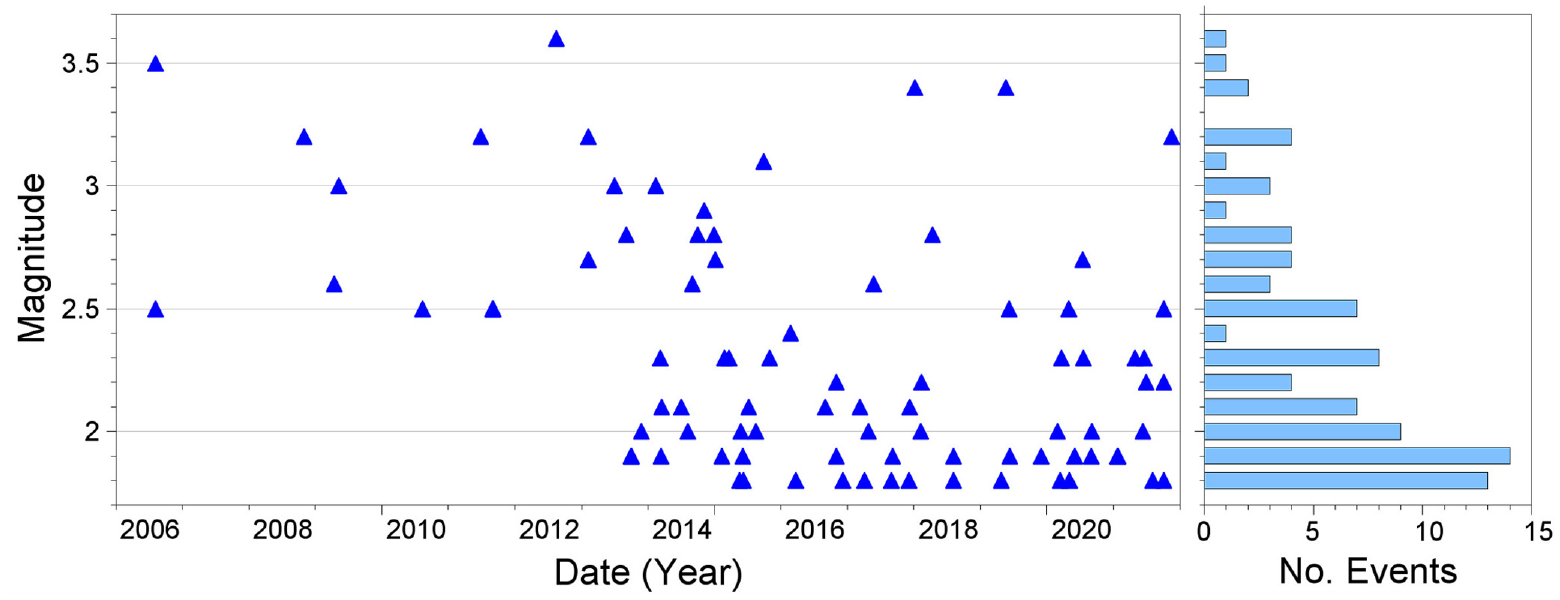
Dates of occurrence and magnitudes of the 87 events of the database (left) and breakdown of the number events by magnitude (right).
Earthquake magnitudes and epicentral locations are determined automatically by the SeisComp software (Helmholtz Centre Potsdam GFZ German Research Centre for Geosciences and gempa GmbH, 2008) at the KNMI shortly after event occurrence. The focal depth in this epicenter determination is fixed to 3 km, the average field-wide depth of the gas-bearing Rotliegend-Slochteren sandstone, where the earthquakes originate. This procedure allows for a fast determination of magnitude and location. After an automatic detection alert, a KNMI seismologist reviews the calculations, and the magnitude and location are published on the KNMI website (https://www.knmi.nl/nederland-nu/seismologie/aardbevingen). The full catalog of induced earthquake magnitudes and locations calculated based on this procedure is published on https://www.knmi.nl/kennis-en-datacentrum/dataset/aardbevingscatalogus. Parallel to this, the expansion of the recording networks allows for more advanced methods to be used to relocate the event hypocentres, such as the equal differential time (EDT) method (Spetzler and Dost, 2017) and moment tensor inversions (Dost et al., 2020; Kühn et al., 2020). These analyses generally take more time and result in revised hypocenter locations. EDT hypocentres are available for all events that occurred since 2015, as well as a small number of events that occurred in 2014 and are provided in the database, while the results from SeisComp are provided for all other events. The hypocentres published on the KNMI website correspond to the results of SeisComp; hence, there will be small differences when they are compared with any hypocentres used in this database that resulted from the EDT method. All event metadata are provided in the database, in the database flatfile as well as in a separate table. Similar to the station locations, epicenter coordinates are provided in the database in the RD coordinate system.
Processing and record usability
Stations G050, G530, G680, G062, G071, G084, G383, G441, G454, G494, G634, and G653 have been found to have permanent malfunctions (low data quality, amplitude transducer problems, and server connection issues) and their records have been excluded from the database. Some records from station BLOP have also been excluded due to a temporary malfunction. The total number of records in the database following these exclusions is 16,184. Prior to processing, the embedment and incoherence corrections proposed by National Institute of Standards and Technology (NIST, 2012) were applied to the records of the three basement stations of the B-network (BUHZ, WIN/BWIN, ZAN1/BZN1), as determined by Cavalieri et al. (2021) in order to remove the effects of the basements and the overlying structures.
The records were processed following the procedures presented in Edwards and Ntinalexis (2021) which are briefly summarized here. For each triaxial record of the database, the first step in processing the instrument response deconvolution is correcting the record by removing the response of the sensor in the Fourier domain. The next step was to ensure the synchronicity of the three components of each recording, by ensuring the same time window is used for all three components. The upper and lower limits of the usable frequency range of the Fourier Amplitude Spectra (FAS) were determined for each of component. The upper usable frequency (fU) is defined simply using a signal-to-noise ratio (SNR) limit of 3; the lower usable frequency (fL) is selected using an iterative procedure which ensures that, if the record is low-cut filtered at that frequency, the noise in the velocity and displacement traces will be limited to acceptable levels. An assessment of the usability of each component was then made: if fU is lower than 15 Hz, fL is larger than 2 Hz, or if the record has an overall SNR lower than 2 throughout the FAS frequencies, the component was considered unusable. If either horizontal component of a record was found to be unusable, the record was discarded. However, if the horizontal components were found to be usable while the vertical component was unusable, only the vertical component was removed, and the horizontal components retained. Geophone records were processed following their conversion from velocity to acceleration.
A total of 8699 records were found to be usable, 2007 of which are surface accelerograph records and 6692 are geophone records. The magnitude–distance distribution of the surface records, as well as a breakdown of the available records at each magnitude, is shown in Figure 3. For some magnitudes, there are relatively few usable records available because the corresponding events occurred before the expansion of the recording networks (Figure 2).
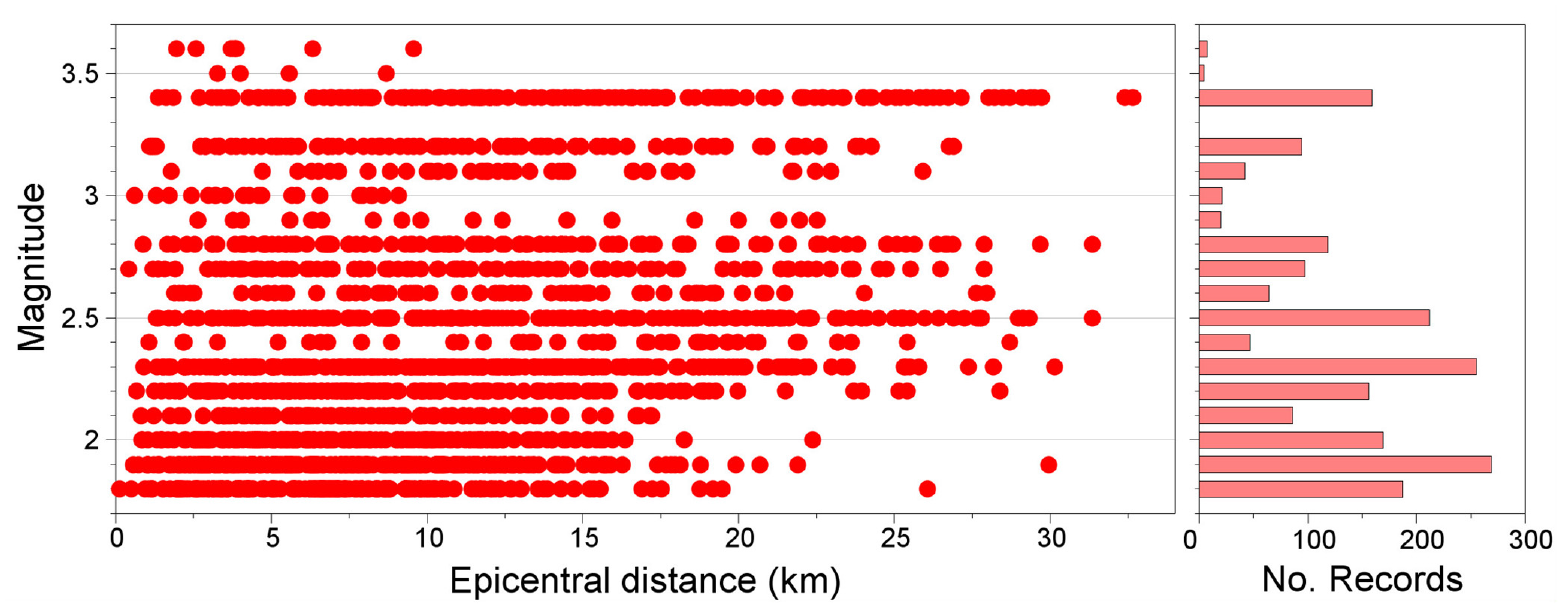
Magnitude–distance distribution of the usable surface records (left) and breakdown of the number of records available by magnitude (right).
All usable recordings were filtered with an eighth-order acausal Butterworth filter; the horizontal components of each record were filtered with identical filter parameters and a filter frequency equal to the larger of the lower usable frequencies (fL) of the two. Vertical components were filtered separately with a filter frequency equal to their individual fL value. This process requires the addition of zero pads in the beginning and end of the record (see Boore and Bommer, 2005). The number of zero pads depends on the filter frequency. Therefore, a different number is added to the vertical than to the pair of horizontal components. To maintain synchronicity in each triaxial recording following the addition of the zero pads, the lengths of the three components were equalized by adding more zero pads to the shorter components. For each of the ∼70 G-stations that contain more than one sensor, synchronization was implemented between all records obtained by the various sensors during the same earthquake.
The final step in the processing was to determine the usable period range of the response spectra of each component, which was also carried out as proposed by Edwards and Ntinalexis (2021). The upper usable period is selected simply by applying a factor of 0.7 to the reciprocal of the lower usable FAS frequency; due to the more complex relationship of Fourier spectra and response spectra at high frequencies, the process used for the selection of the lower usable period is significantly more elaborate, and the reader is referred to Edwards and Ntinalexis (2021), where it is described in detail. Figure 4 shows the number of horizontal component pairs that are usable at each period from 0.01 to 2.5 s, as well as a breakdown by magnitude of the surface horizontal component pairs usable at each period.
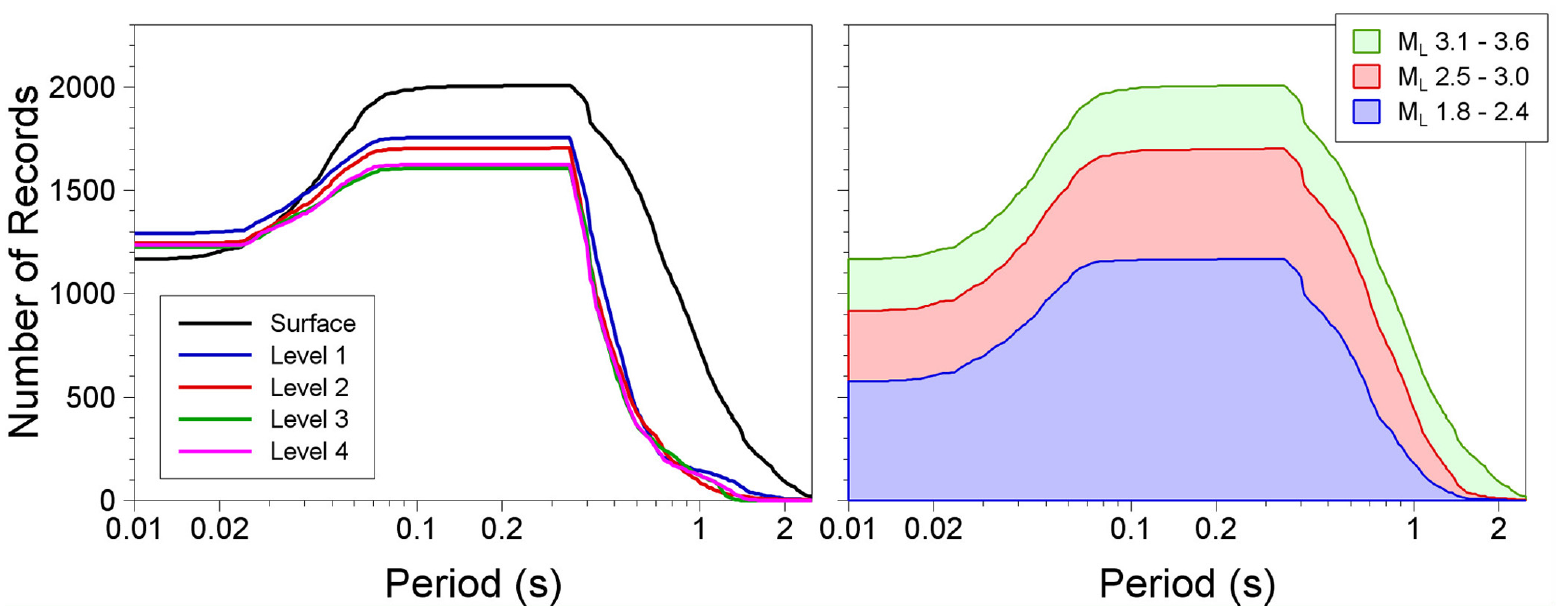
Number of horizontal component pairs usable at each period from 0.01 to 2.5 s, at each depth level (left) and only at the surface, broken down by magnitude range (right).
The database contains the raw records, FAS, and noise models used during the processing for all 16,184 records of the database, providing users with the opportunity to make their own usability assessments and re-process the records with different methods, if they desire. For the usable, filtered records, the filtered time histories and 5%-damped pseudo-acceleration (PSA) response spectra for periods up to 2.5 s are also provided. The spectral accelerations, durations, Arias Intensities, usable FAS frequency, and PSA period range limits of the usable as-recorded and geometric-mean horizontal components are provided in a flatfile, along with the metadata for all records, stations and events, which are also provided separately in .txt files. A table detailing the justification for removal of each unusable record or vertical component is also included in the flatfile. Each recording is identifiable via a unique code, which is the combination of the event ID and station ID. Event IDs are provided in the table containing the event metadata and were assigned for the purposes of the indexing of this database, while the station IDs used are those assigned by the KNMI (1993).
Site profiles and transfer functions at recording stations
In situ shear-wave velocity measurements (VS) have been carried out at 80 of the 99 stations of the combined B- and G-networks during four measurement campaigns. A combination of Seismic Cone Penetration Tests (SCPTs) and Multichannel Analysis of Surface Waves (MASW) was carried out at the B-stations by Deltares after several measurement methods were tested (Noorlandt et al., 2018), while Cone Penetration Tests (CPTs) and SCPTs were carried out at the G-stations by Fugro (2019, 2020), all of which were used to determine the shallow local lithology and VS to a maximum depth of 30 m. The full cone logs are provided in the database. A discussion of CPT measurements in Groningen is given by Kruiver et al. (2021).
For depths beyond the maximum penetration depth of the SCPTs, the mean VS profiles predicted for the locations of the stations by the model of Kruiver et al. (2017a), discussed later, have been appended. For the G-stations with geophones, the soil types between the depths of 30 and 200 m have been further adjusted using data from well logs gathered when the boreholes were drilled (Kruiver et al., 2018). The borehole well logs are also provided in the database.
Amplifications calculated following subsequent site response analyses were found to be very sensitive to the damping profiles of the uppermost 50 m of the soil column, for the soft soils encountered in Groningen. Hence, the derivation of a damping model became a crucial element of the site characterization. The damping model was derived from analysis of the borehole records, the process sometimes also leading to small adjustments of the shallowest part of the VS profiles, where the measurements may not be very reliable. The derivation of the damping model for the Groningen field is presented in Ruigrok et al. (2022),
For stations where no measurements took place, the VS profiles inferred from the model of Kruiver et al. (2017a) for the locations of the stations are provided instead. These stations are listed in a table contained in the database. The distribution of harmonic average VS over the top 30 m (VS30) values of all stations is shown in Figure 5.
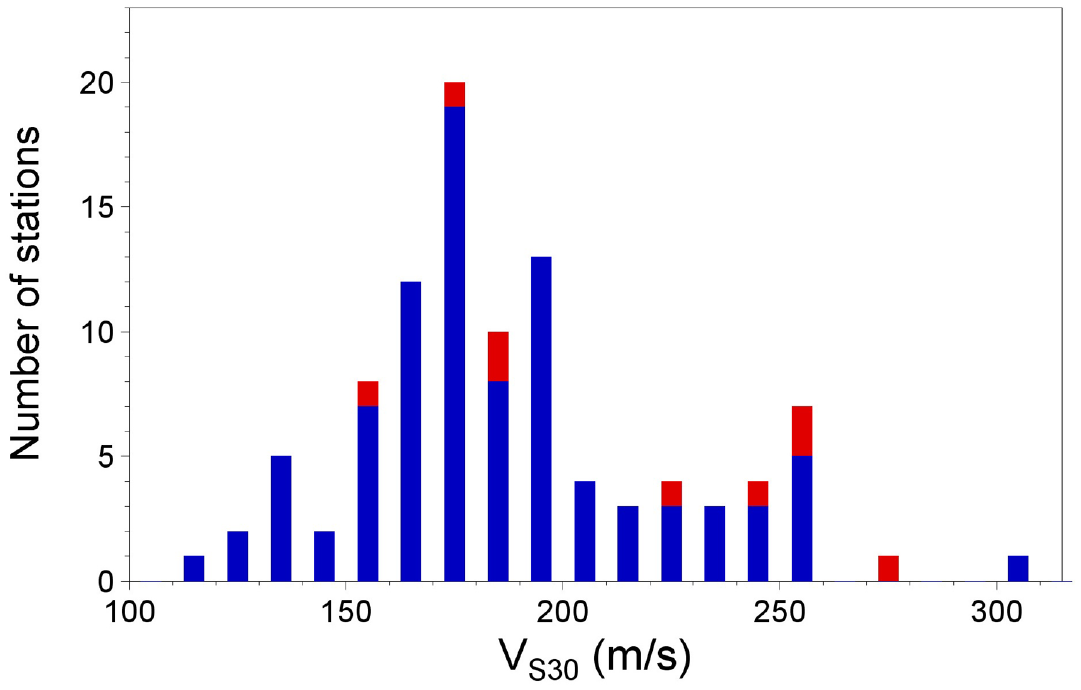
Distributions of recording stations with respect to VS30. Stations with inferred VS profiles are shown in red.
The ground motion database also contains a table with horizontal component pseudo-spectral accelerations after deconvolution from the surface to the reference baserock used in the Groningen GMMs (Bommer et al., 2022a), the base of the North Sea formation (NS_B) at a depth of ∼800 m. The site profiles at the recording stations were used to compute transfer functions (TFs) and amplification factors (AFs) to transfer the FAS and pseudo-acceleration response spectra, respectively, to the reference rock horizon.
The TFs and AFs are also contained in the database. In the case of the AFs, we also provide the functional form to calculate them, as well as the coefficients in a separate table in the database. Since all the recordings were for small-magnitude earthquakes, it was assumed that the induced strains on the soils were small; thus, only linear TFs and AFs were developed. The AFs are given by Equation 1 and are scenario-dependent (Stafford et al., 2017):
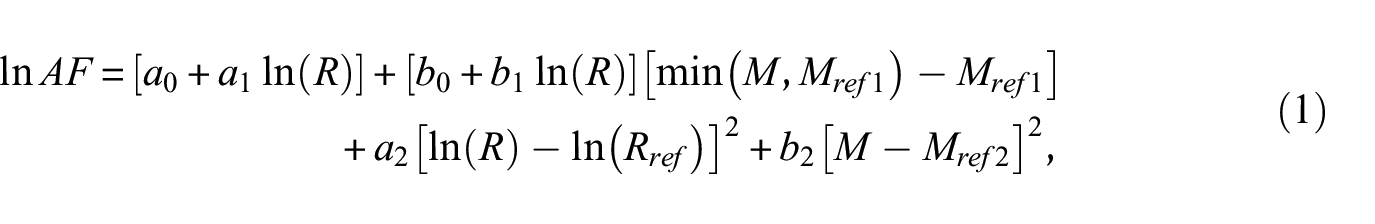
where AF is the amplification factor; M is magnitude; R is hypocentral distance;
Database features and characteristics
Figure 6 compares the horizontal geometric-mean spectral accelerations (SAs) at 0.01 and 0.3 s to the peak ground accelerations (PGAs) and peak ground velocities (PGVs), respectively. The equivalence of PGA and SA(0.01 s) can be observed, as can the strong correlation between PGV and SA(0.3 s). The equivalence of PGA and SA(0.01 s) suggests that, for each record, the usability or otherwise of SA(0.01 s) also applies to PGA.
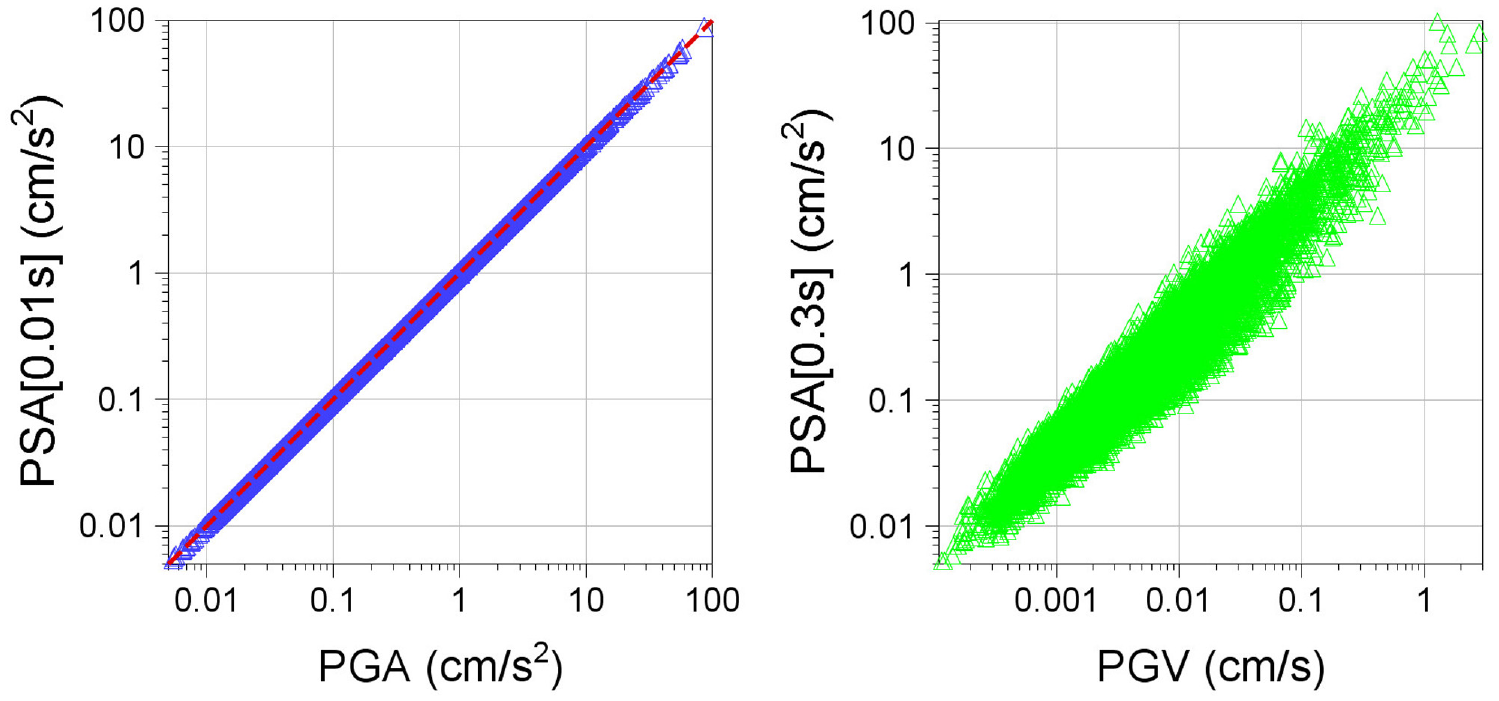
Equivalence of horizontal geometric-mean PGA and spectral accelerations at 0.01 s (left) and correlation of PGV and spectral accelerations at 0.3 s (right).
Figure 7 presents the as-recorded horizontal PGA values of the database plotted against epicentral distance, with distinction between magnitude ranges. The largest PGA and PGV values recorded during the 2012 ML3.6 Huizinge earthquake were 81.54 cm/s2 (0.08 g) and 3.46 cm/s and belong to the EW component of station MID1. This PGA value has only been exceeded once since, during the 2018 ML3.4 Zeerijp earthquake, with a PGA of 108.7 cm/s2 (0.11 g) recorded at the EW component of station BGAR. The PGV of the same recording (3.21 cm/s), however, did not exceed the earlier value. Many recordings obtained at short distances display strong vertical-to-horizontal ratios at short oscillator periods and are in many cases strongly polarized (Stafford et al., 2019).
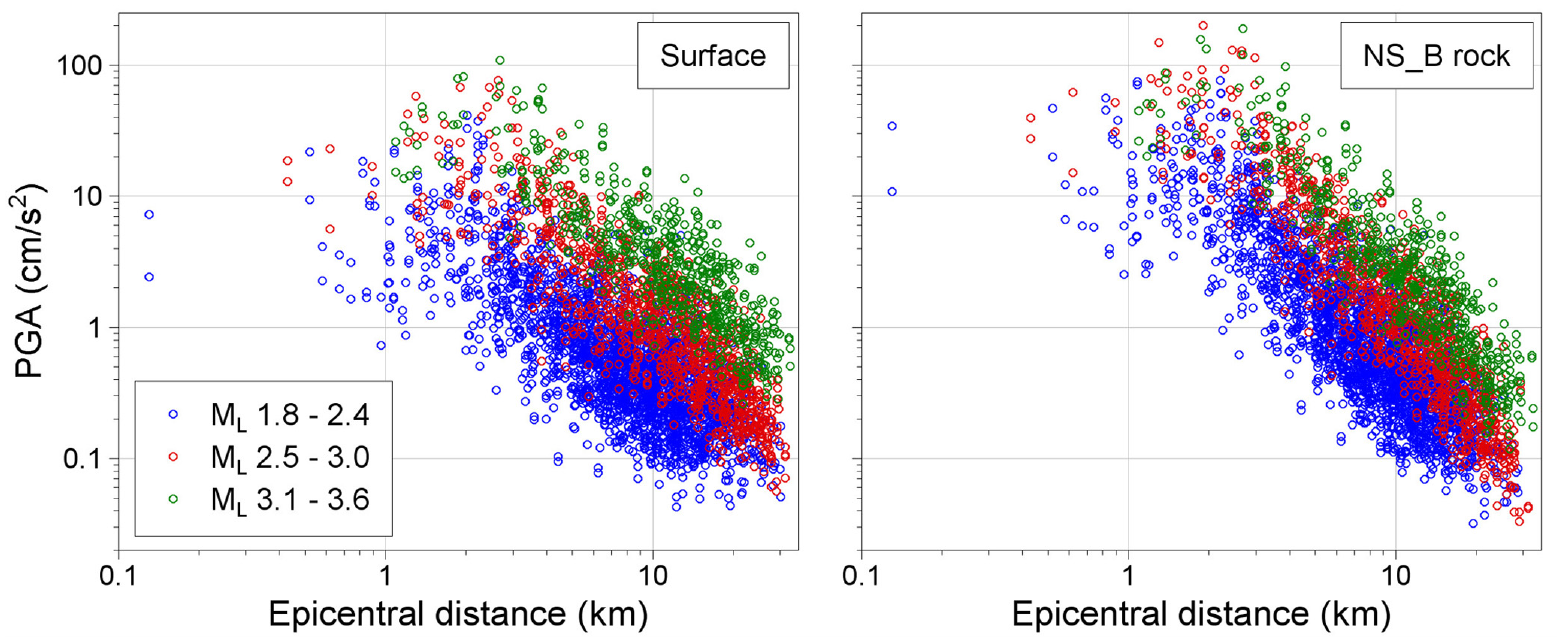
As-recorded horizontal PGA at the surface (left) and following deconvolution to the NS_B reference rock horizon (right) of the surface records of the database, plotted against epicentral distance.
The Rotliegend-Slochteren sandstone, where the earthquakes originate, is overlain by a thick layer of Zechstein evaporates (salt). The influence of the Zechstein on the seismic wave propagation is discussed by Kraaijpoel and Dost (2013) and is the source of distinct features in the ground motion database. Seismic waves at certain angles of incidence are reflected and refracted by the Zechstein; refracted waves then re-emerge at epicentral distances of 7–12 km, which leads to a local plateau or even reversal in the ground motion attenuation with distance (akin to Moho bounce but on a much smaller scale). The re-emergence of refracted waves at different distances also results in longer wave trains and therefore longer durations, when, in contrast, the durations of near-source recordings are very short, with the ML3.6 Huizinge MID1 and ML3.4 Zeerijp BGAR EW recordings discussed above being associated with 5%–75% significant durations of just 0.52 and 0.44 s, respectively. Figure 8 shows the as-recorded horizontal surface PGA values recorded during the 8 January 2018 ML3.4 Zeerijp earthquake, plotted against distance and 5%–75% significant durations. The re-emergence of the waves, as well as the very short durations recorded in the accelerograms with the highest PGAs, which then increase rapidly with decreasing PGA, can be observed.
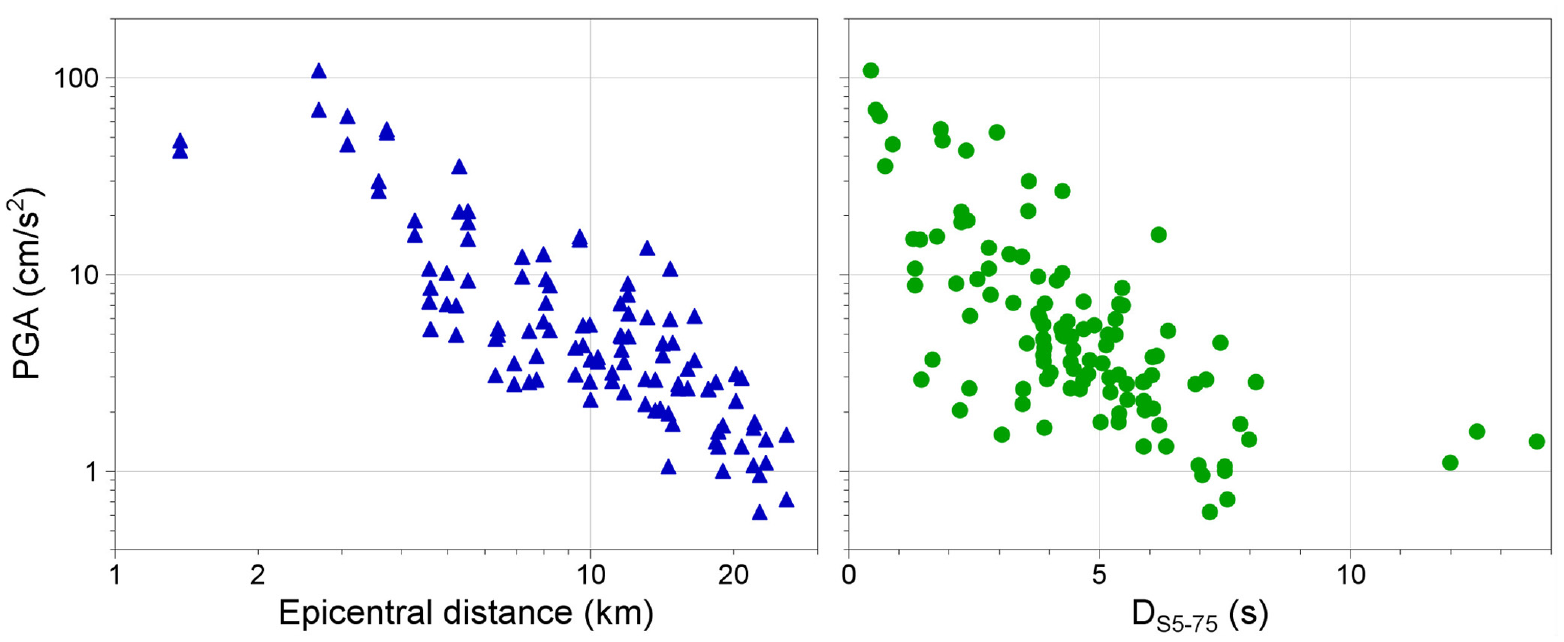
As-recorded horizontal PGA recorded by the surface accelerographs during the 8 January 2018 ML3.4 Zeerijp earthquake, plotted against distance (left) and durations (right).
Finally, a trend of short-period spectral accelerations recorded at the B-stations to be, on average, weaker than those recorded at the G-stations has been observed (see Bommer et al., 2021, 2022a). The exact cause of this effect, which is not systematic, has not been determined, although Cavalieri et al. (2021) have ruled out soil-structure interaction (SSI) in the buildings where the B-stations are located while highlighting the possible influence of a compacted soil layer below the foundations which is a common construction practice in the region.
Field-wide Vs and lithology model
For the purposes of conducting the site response analyses necessary for the Groningen GMMs (Bommer et al., 2022a, 2022b; Rodriguez-Marek et al., 2017), a geological model was developed by Kruiver et al. (2017a). This model was in turn based on the GeoTOP model, developed and updated at regular intervals by TNO (Bosch et al., 2014; Maljers et al., 2015; Stafleu and Dubelaar, 2016; Stafleu et al., 2011). GeoTOP discretizes the sub-surface of the Netherlands to voxels (volume pixels) of 100 m × 100 m width and length and 0.5 m thickness, and assigns to each a stratigraphy, a lithoclass distribution, and the most likely lithoclass. The Groningen VS model consists of a VS profile for each of the 100 m × 100 m grid cells in the GMM study area (which is defined by the outline of the gas field plus a 5 km buffer onshore). The profiles range from the ground surface to the reference rock horizon of the GMM-the base of the NS_B.
The model was composed by combining data from three sources of information, each valid over a different depth range (note that NAP is Normaal Amsterdams Peil or Amsterdam Ordnance Datum):
(a) The GeoTOP lithology for the depth range from the surface to 50 m below the NAP (50m-NAP), in conjunction with empirical conversions from lithology class to VS derived from data gathered at 88 SCPTs carried out in the field.
(b) Data inferred from recordings of surface waves (ground roll) obtained during seismic surveys of the reservoir carried out in the 1980s using the Modal Elastic Inversion method (MEI), valid for the depth range of 20m-NAP to ∼120m-NAP, but used only from 50m-NAP and below; in effect, MASW on a very large scale.
(c) Data obtained from a conversion of the Pre-Stack Depth Migration (PSDM) compressional wave velocity (VP) model to VS using relationships established from sonic logs of deep boreholes at the Groningen field (Romijn, 2017), used for the range of ∼70 m-NAP to ∼800m-NAP (NS_B).
The model construction is discussed in greater detail in Kruiver et al. (2017a); the VS, damping, and lithology profiles for each voxel are accessible for the first time through this database.
Summary and conclusion
This article presents a database that includes more than 8500 processed ground motion recordings from 87 earthquakes of local magnitude ML between 1.8 and 3.6, as well as VS profiles, transfer functions, and frequency-dependent amplification factors from the reference rock horizon to the surface, for the locations of the recording stations. This database has been used to develop ground motion models for induced earthquakes in the Groningen gas field and the primary motivation for this article is to encourage and facilitate additional work to refine and improve the Groningen GMM as well as providing datasets for the field that could be of great value to other aspects of quantifying and mitigating the seismic risk. At the same time, the datasets may also be of great value for generic research into site response of deep soft soil deposits and the characterization and prediction of ground motions from small-magnitude, shallow-focus induced earthquakes.
The database is provided in the OSF repository, which is freely accessible online (Ntinalexis et al., 2022). The data are stored in three distinct subfolders, visible in the lower left corner of the landing page, within the “Groningen complete database (November 2021)” folder: (a) ground motion database, (b) site characterization at recording stations, and (c) field-wide shear-wave velocity and lithology model. Each subfolder contains readme files which explain the structure and contents of each folder. In the case of the ground motion database, event, station, and record metadata are provided in tables in a separate subfolder, while they are also provided in the database flatfile, which also contains a range of intensity measures for each usable record. Upon the selection of each complete folder, subfolder, or file, the option to “Download as zip” appears, whereby the users can download a zipped file with the item. Alternative download instructions via Dropbox are also available in the repository, while the database is also downloadable via the Yoda/EPOS data publication platform of Utrecht University: https://bit.ly/3h1Qm19.
Footnotes
Acknowledgements
There are too many colleagues at Shell, ExxonMobil, Deltares, and KNMI who have contributed to this work in various ways to possibly thank in the space available herein, but special mention must be made to Peter Stafford, who is a member of the Groningen GMM team along with seven of the authors of this article, for discussions and astute advice that have always benefited the development of the work. In addition, for assistance at various stages of the work since 2014, we would like to thank Steve Oates, Tom Piesold, and Remco Romijn at Shell, Jordi Domingo Ballesta at KNMI, as well as Helen Crowley, António Araújo Correia and Francesco Graziotti. The geological zonation model was constructed by a large team of geologists from Deltares and TNO—Geological Survey of the Netherlands: Ane Wiersma, Pieter Doornenbal, Tommer Vermaas, Renée de Bruijn, Marc Hijma, Freek Busschers, Marcel Bakker, Ronald Harting, Roula Dambrink, Willem Dabekaussen, Wim Dubelaar, Eppie de Heer, and Jan Peeters. Veronique Marges provided numerous maps and Wim Dubelaar commented on the geological setting. We are very grateful to several individuals who have provided critical review and feedback on the geological model: Rien Herber, Tijn Berends, Joep Storms, Adriaan Janszen, Karel Maron, Clemens Visser, and Dirk Kraaijpoel. Finally, we wish to express particular gratitude to the members of an international panel of experts who provided very valuable feedback, suggestions and criticisms during various stages of the work, including at in-person and online workshops: Gail Atkinson, Norm Abrahamson, Hilmar Bungum, Fabrice Cotton, John Douglas, Jonathan Stewart, Ivan Wong and Bob Youngs.
Declaration of conflicting interests
The author(s) declared no potential conflicts of interest with respect to the research, authorship, and/or publication of this article.
Funding
The author(s) disclosed receipt of the following financial support for the research, authorship, and/or publication of this article: This work has been funded by the Nederlandse Aardolie Maatschappij (NAM).