
Abstract
Structural risk-mitigation measures have been shown to significantly reduce earthquake-induced physical damage and casualties in various regions worldwide. However, these benefits remain unknown or inadequately quantified for potential future events in some hazard-prone areas such as Kathmandu Valley, Nepal, which this article addresses. The analysis involves modeling an earthquake scenario similar to the 2015 Gorkha earthquake (moment magnitude 7.8) and using four exposure inventories representing the current (2021) urban system or near-future (2031) development trajectories that Kathmandu Valley could experience. The results predict substantial losses (€8.2 billion in repair/reconstruction costs and 89,199 fatalities) in 2021 if the building stock’s quality is assumed to have remained the same as in 2011 (Scenario A). However, a partial improvement of the building stock’s quality in the present (Scenario B) can decrease financial losses and fatalities by 17% and 44%, respectively. Moreover, under a “no change” pathway for 2031 (Scenario C), where the quality of the expanding building stock remains the same as in 2011, and the number of buildings is larger to reflect population growth, financial losses and fatalities will increase by 20% and 25% respectively over those of Scenario A. In contrast, further upgrades to the building stock’s quality by 2031 (Scenario D) would reduce financial and human losses by 14% and 54% respectively, relative to those of Scenario A. In addition, the largest financial and human losses computed in the four scenarios are consistently associated with the low- and middle-income population. The main findings of this article can be used to inform decision makers about the benefits of investing in forward-looking seismic risk-mitigation efforts.
Introduction
Nepal is situated in the Himalayan region, an area of high seismic hazard with the potential for large earthquakes that can reach a moment magnitude (Mw) above 9.0 (Stevens and Avouac, 2016). The primary source of earthquakes in Nepal and the overall Himalayan region is the subduction of the Indian plate underneath the Eurasian plate (Chaulagain et al., 2015a). As a result of its critical geographic location, Nepal is associated with a long history of devastating earthquakes, such as those reported in 1255, 1833, 1934, 1980, 1988, and 2015 (Bilham, 2004; Chaulagain et al., 2018). For instance, the 1934 Nepal–Bihar earthquake, which had a maximum “X” intensity on the Modified Mercalli Intensity (MMI) scale, caused extensive loss of life and property in Nepal and India (Rana and Lall, 2013). More recently, the 7.8 Mw earthquake of 25 April 2015 (also known as the Gorkha earthquake) and subsequent aftershocks affected an area of approximately 22,000 km2 across 14 districts. The earthquake sequence resulted in 8,790 deaths and 22,300 injuries, more than 880,000 damaged houses, and over US$7.1 billion in direct financial losses, of which 50% were associated with the housing sector (Government of Nepal (GoN) National Planning Commission, 2015).
The 2015 Gorkha earthquake and earlier destructive events highlighted the significant vulnerability of Nepal’s building stock to earthquake-induced shaking. This vulnerability is caused by a combination of low-quality building materials, poor compliance with building codes, and deficient construction practices (Bothara et al., 2018). While the use of modern construction materials (e.g. concrete, steel) is growing rapidly in urban areas, the use of traditional materials (e.g. stone, mud) is still preferred across the country (especially in rural areas) due to their local availability and low cost (Bothara et al., 2018). The Nepal Building Code (NBC) was drafted in 1994 but was not legally enforced until 2003 in some urban areas of Nepal. The code includes four levels of building practice: (1) international state-of-the-art design; (2) professionally engineered design; (3) standard templates of designs (addressed by the Mandatory Rules of Thumbs); and (4) guidelines for non-engineered construction. In 2004, the GoN issued an executive order for all municipalities to implement the NBC for new buildings. However, a lack of technical capacity and supporting resources has prevented most municipalities from strictly enforcing it (Arendt et al., 2017). In addition, more than 98% of buildings in Nepal are constructed by informally employed local workers whose knowledge of disaster risk reduction measures is generally limited (Chmutina and Rose, 2018).
After the 2015 earthquake, several post-earthquake reconnaissance missions were carried out to assess the type and extent of physical damage suffered by buildings (e.g. Bhagat et al., 2018; Goda et al., 2015; Varum et al., 2018). Most surveys reported that unreinforced masonry (URM) buildings sustained significant damage, mainly due to their lack of seismic-resistant features (e.g. seismic bands, through-thickness stones, floor diaphragm action). In contrast, reinforced concrete (RC) buildings suffered less damage. As reported by the GoN National Planning Commission (2015), 95% of the 458,025 recorded collapsed buildings were made of low-strength masonry (i.e. stone, fired brick, and adobe) with mud mortar, 3.7% were made of cement-mortared masonry, and only 1.7% were RC frames. The estimated proportions of these different building typologies in the 31 affected districts were 58% low-strength masonry, 21% cement-mortared masonry, 15% RC frames, and 6% wood/bamboo houses. Given the significant damage and losses observed, the post-earthquake reconstruction process in Nepal represented a unique opportunity to improve the overall seismic resilience of the buildings in the affected area and increase public awareness of seismic risk in the country (Giordano et al., 2021). Accordingly, the GoN offered financial and technical assistance to homeowners to rebuild their properties following “Building Back Better” principles. As of April 2021, 96% of the 811,754 beneficiaries of this assistance have either rebuilt or are in the process of rebuilding their houses (National Reconstruction Authority, 2021). However, several rebuilt houses have recognized issues around the use of poor-quality materials, poor workmanship, or other non-compliant practices (Hendriks and Opdyke, 2021; Shrestha et al., 2021).
Thus, despite the reconstruction endeavors after the 2015 Gorkha earthquake, most existing buildings in Nepal remain highly vulnerable to earthquake-induced ground motions (Bothara et al., 2018). In addition, many disaster risk reduction activities in the country are supported by international organizations that only operate within a limited time frame, making the long-term sustainability of their actions challenging (Bothara et al., 2018). Furthermore, Nepal is experiencing rapid population growth that, if not properly managed, could create densely populated and poorly designed urban areas that lead to significantly increased exposure and vulnerability. These facts underline an urgent need to promote and enforce risk-sensitive urban planning, building codes, and region-wide seismic retrofitting programs to prevent disproportionate economic losses and casualties in the case of a future major earthquake.
The past decades have seen an increase in funding programs for seismic retrofitting in different regions worldwide, particularly in high-income countries. Examples include the California Residential Mitigation Program (Federal Emergency Management Agency (FEMA), 2020b) in the United States, the Sismabonus in Italy (Ministero delle infrastrutture e della mobilità sostenibili, 2017), and the Building Amendment Act 2016 in New Zealand (Filippova and Noy, 2020). These governmental initiatives promote the allocation of limited available earthquake risk-mitigation resources over many assets, to homogeneously reduce the seismic vulnerability—and hence the seismic risk—of the building stock. Some other retrofitting schemes that are not funded but still government-mandated/incentivized, such as the city of Los Angeles’ Retrofit Ordinances 183893 and 184081 (Mandatory Retrofit Programs, n.d.), also contribute to reducing the seismic vulnerability of the building stock.
Recent studies have formally investigated the potential benefits of adopting hazard-resistant building codes and enhancing the seismic performance of building portfolios. For instance, the “Natural Hazard Mitigation Saves: 2019 Report” (National Institute of Building Sciences, Multi-Hazard Mitigation Council, 2019), developed in the United States, found that adopting the 2018 International Residential Code and International Building Code (also known as the I-codes) save US$11 for every dollar invested, compared with the use of 1990-era codes. This report examined four natural hazards (i.e. flooding, hurricanes, earthquakes, and fires at the wildland-urban interface) and considered the benefits from reductions in many types of consequences, including deaths, injuries, and post-traumatic stress disorder, repair costs for damaged buildings and contents, and direct and indirect business interruption. Similarly, the “Building Codes Save: A Nationwide Study” (FEMA, 2020a) conducted in the United States estimated that the use of I-codes over the 2000–2040 period could result in an aggregated reduction of US$132 billion in property losses (from earthquakes, flooding, and strong wind), although future buildings count was calculated based on the average growth rate over the 2009–2016 period. Yi et al. (2020) presented a cost–benefit analysis of the Los Angeles ordinance for retrofitting approximately 12,000 soft-story wood-frame residential buildings. They estimated that it takes an average of 4–5 years to recoup the initial investment of the retrofits and that the probability of achieving a desirable cost–benefit ratio (between 0 and 1) within a 50-year period is approximately 0.9.
Outside of the United States, Zanini et al. (2019) explored the economic benefits of a hypothetical complete seismic retrofit program for the Italian national residential building stock. They showed that a retrofit of all masonry buildings and gravity-designed structures could produce a 31% reduction in the Unitary Municipal Expected Annual Loss (i.e. the yearly monetary amount required to cover direct seismic losses per 1 m2 built area of exposed assets in each municipality). In Portugal, Blyth et al. (2020) analyzed the effects of seismic retrofitting interventions for unreinforced stone masonry buildings in the historical center of Leira. They demonstrated that adopting various retrofitting techniques (e.g. wall-to-wall and wall-to-floor connection improvement, masonry consolidation, and strengthening) could decrease the number of collapsed buildings and casualties by 35% for an earthquake scenario with intensity “X” on the European Macroseismic Scale (Grünthal, 1998). All of these findings support the premise that “adopting and enforcing building codes is among the most efficient ways to build a resilient society” (FEMA, 2020a).
In recent years, some researchers (Adhikari et al., 2019; Chaulagain et al., 2015b; Dumaru et al., 2019; Giordano et al., 2021) have analyzed the suitability of various retrofit strategies (e.g. RC column jacketing, steel bracing, splint and bandage) for strengthening the seismic capacity of existing buildings in Nepal. Yet, the advantages of such strategies have been mainly quantified at a building level rather than for building portfolios. Also, past earthquake loss assessments for Nepal (Chaulagain et al., 2015a, 2016) have not estimated fatalities or assessed social vulnerability, lacking a people-centered approach (Scolobig et al., 2015). In addition, these previous efforts do not have an inherent focus on the future, a need that is increasingly recognized (Cremen et al., 2022; Galasso et al., 2021) and formally remarked in international agreements such as the Sendai Framework for Disaster Risk Reduction (United Nations Office for Disaster Risk Reduction, 2015) and the 2030 Agenda for Sustainable Development (United Nations, 2015). These methodological shortcomings are addressed in this article.
This study contributes to the efforts required to quantify the benefits of appropriate mitigation actions on growing seismic risk in urban areas, for informing and promoting risk-sensitive decision-making. This work explicitly investigates the effect of “hard” (or structural) risk-mitigation strategies (i.e. that influence physical vulnerability) on financial losses and casualties in Kathmandu Valley, Nepal. The methodology considers a scenario-based seismic loss estimation, using a 7.8 Mw earthquake scenario and four potential present (2021) and future (2031) exposure and vulnerability scenarios, focusing on residential buildings. The results are relevant to various stakeholders, providing a clear quantitative description of the potential seismic risk in Kathmandu Valley that can be leveraged for decision-making on investments in risk-reduction programs.
Materials and methods
We employ a scenario-based seismic risk approach computing structural and human losses using the OpenQuake engine (Silva et al., 2014) developed by the Global Earthquake Model. We use a scenario-based approach instead of probabilistic hazard analysis, since the former is particularly beneficial for communicating risk to policymakers and the general public, who may lack an intuitive sense of probabilities and the dynamic discounting of financial assets e.g. Bonstrom et al., 2012; Cremen et al., 2022). We model an earthquake scenario similar to the 2015 Gorkha earthquake (e.g. same magnitude, epicenter location, hypocentral depth), considering its significant impact on the economic core of Nepal and its recent occurrence. However, the exact shaking intensities caused by the Gorkha event are not strictly of interest in this study. We simply aim to generate a set of appropriate ground motion fields (GMFs) to investigate how the risk changes in a relative sense across the various exposure scenarios. Note that we do not account for the effects of liquefaction or other cascading hazards (e.g. landslides) in this study; our analysis focuses exclusively on risks directly associated with the earthquake-induced ground shaking.
Study area: Kathmandu Valley
Geographically, Kathmandu Valley is surrounded by the Himalayan Mountains and lies within the Bagmati River watershed. The valley extends from 27°49′4″ to 27°31′42″ latitude and from 85°11′19″ to 85°33′57″ longitude, accounting for a total extent of 721 km2 (Kathmandu Valley Development Authority, 2016). Administratively, Kathmandu Valley encloses the entire Bhaktapur and Kathmandu districts and approximately 50% of the Lalitpur district. In addition, the valley contains five municipal areas and several municipalities and rural municipalities (formerly named village development committees, or VDCs), Figure 1.
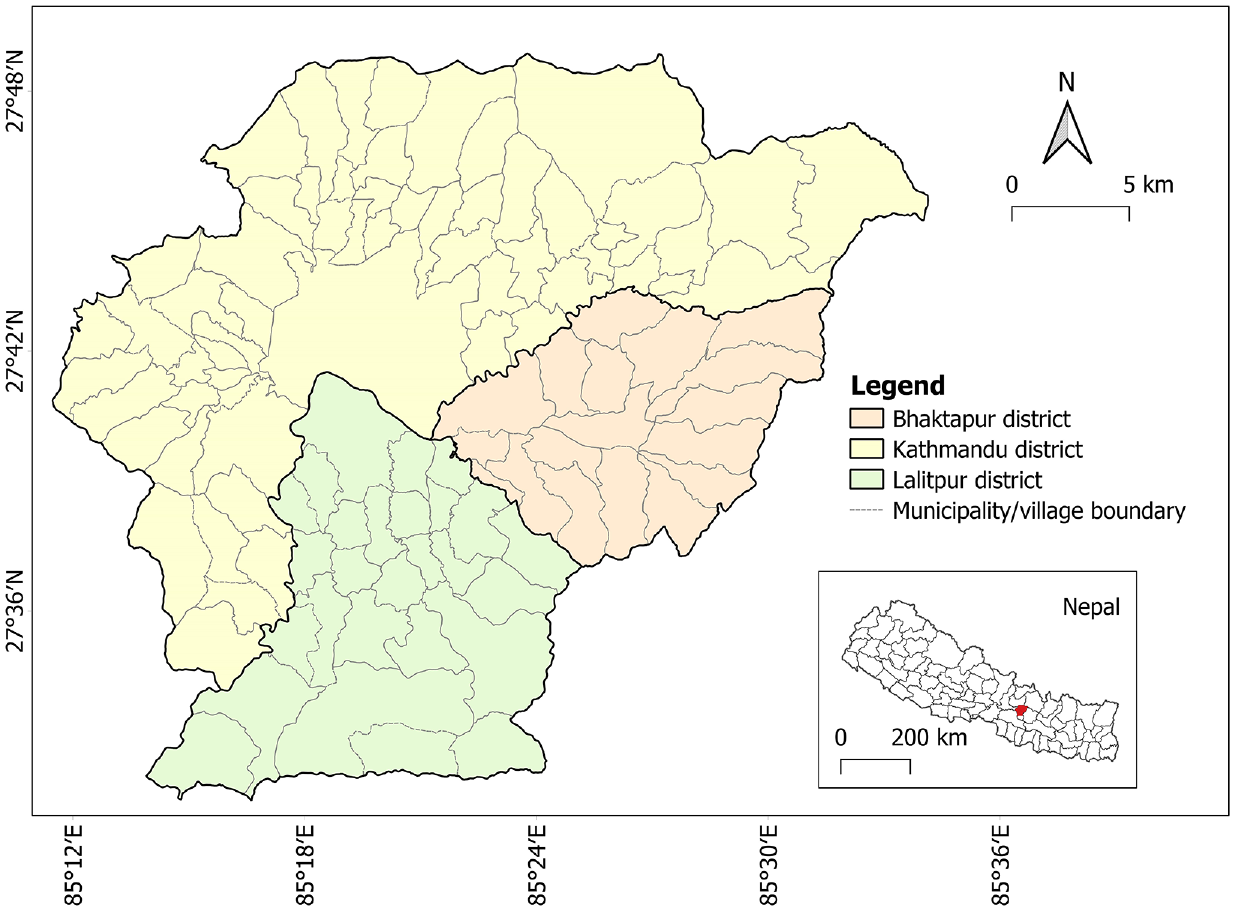
Administrative map of Kathmandu Valley (with inset showing its geographical location within Nepal). The valley is divided into three districts (distinguished by colors), which together contain 104 village development committees.
Considered earthquake scenario
The selected hazard scenario is similar to the 7.8 Mw earthquake that struck central Nepal on 25 April 2015. The earthquake occurred due to thrust faulting on the main thrust interface between the subducting India plate and the overriding Eurasia plate to the north (US Geological Survey (USGS), 2015). The epicenter was located 80 km to the west-northwest of Kathmandu, within a well-known zone of clustered seismicity that runs beneath the front of the high Himalaya (Avouac et al., 2015). We model the rupture of the earthquake scenario as a complex fault rupture that is based on the US Geological Survey (USGS, 2015) representation for the 2015 Gorkha Earthquake. Table S1 (see Supplementary Information) summarizes the relevant rupture modeling parameters used in this study. The vertical projection of the earthquake rupture on the Nepalese territory is shown in Figure 2.
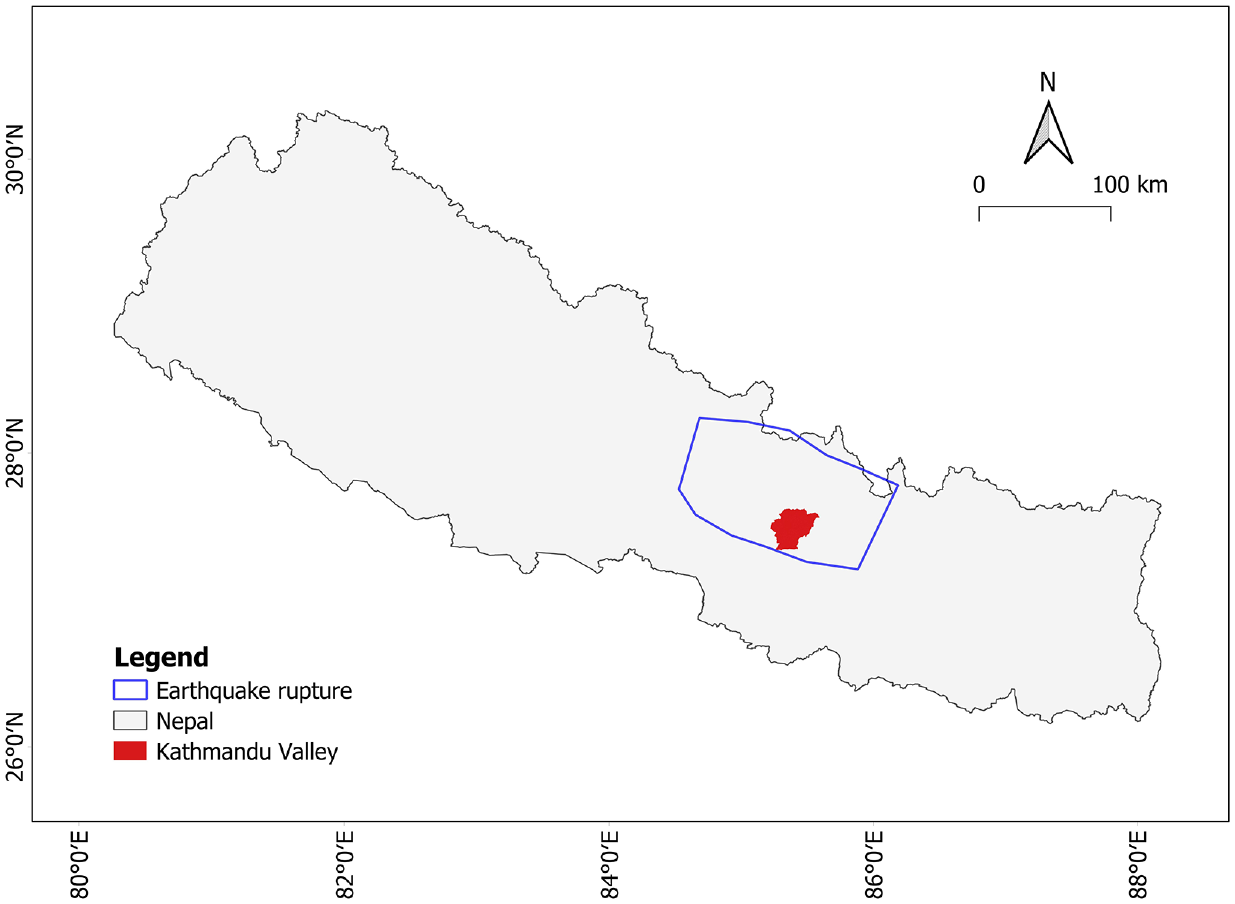
Vertical projection of the 2015 Gorkha Earthquake rupture (USGS, 2015) and the rupture considered in this analysis.
There is limited availability of recorded ground motions for Central Nepal (Goda et al., 2015), which means that existing regional ground-motion models (GMMs) for Nepal are either based on “limited and unusual data, with very near-source recordings” (Singh et al., 2017), or aftershock sequences exclusively (Mori et al., 2020). Thus, the ground-motion estimations for this study are instead derived from GMMs designed for geologically similar regions. We use two GMMs—Atkinson and Boore (2003), and Boore et al. (2014)—to simulate GMFs for the study area in an equally weighted logic-tree approach. These GMMs have been previously employed to characterize subduction interfaces and active shallow crustal events in Nepal (Rahman and Bai, 2018; Stevens et al., 2018).
It is essential to mention that the 2015 Gorkha earthquake resulted in an unusual ground-shaking pattern (Adhikari et al., 2017; Asimaki et al., 2017), generating lower intensities in central Kathmandu Valley (on soft soils) compared with its periphery (on hard rock), which is opposite to what most GMMs would predict. While it is uncertain whether or not the next earthquake in Nepal will show this unusual behavior again, we consider an earthquake scenario with a more “normal” ground shaking pattern (i.e. consistent with that predicted by a GMM). To account for the aleatory uncertainty of the GMFs, we simulate 500 realizations of each of the three required intensity measures (see section “Modeling seismic vulnerability” for more context) with a truncation level (i.e., the number of standard deviations used, leading to truncation of the Gaussian distribution of the logarithm of ground-motion intensity) of 2. We use the ground-motion correlation model proposed by Jayaram and Baker (2009) to account for spatially correlated intra-event residuals in each realization; cross-intensity-measure correlation is neglected in our analysis.
We characterize the local site conditions by mainly using recent Vs30 (time-averaged shear-wave velocity to 30 m depth) findings from De Risi et al. (2021), which combined coarse slope-based Vs30 estimates from the USGS (Wald and Allen, 2007) (used as prior data) with 15 direct geophysical measurements, to provide a refined estimation of Vs30 across Kathmandu Valley. However, as the geographical extent of our study is slightly larger than that considered by De Risi et al., we employ the relevant Vs30 values from the USGS global mosaic (Heath et al., 2020) in the few areas not covered by it. The final Vs30 map used in this study is provided in Figure 3.
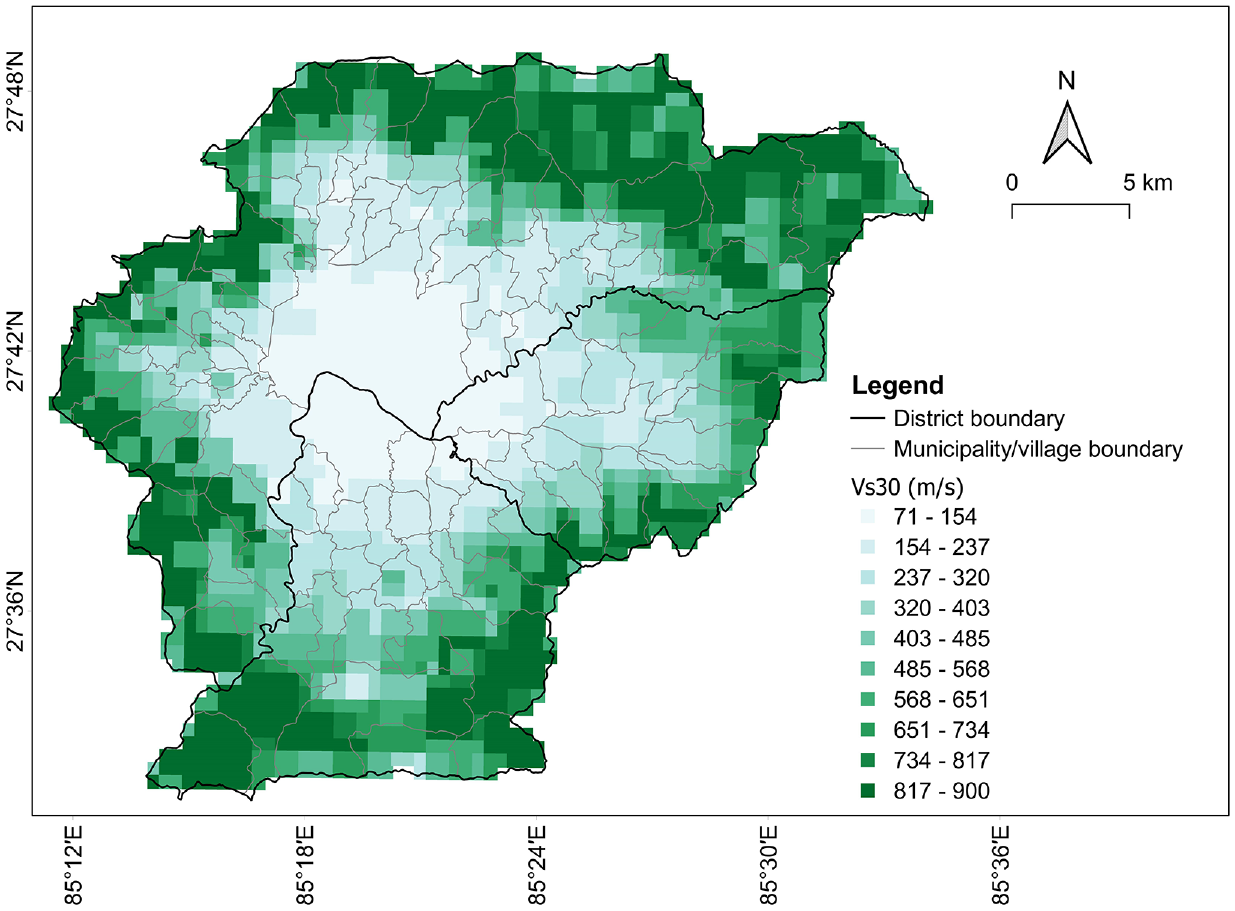
Map of Vs30 values employed in this study (De Risi et al., 2021; Heath et al., 2020).
Modeling present and future exposure
We develop four different residential exposure scenarios based on the National Population and Housing Census 2011 (Central Bureau of Statistics (CBS), 2012, 2014) and various assumptions on the estimated population and number of households for 2021 and 2031. Note that the 2021 urban development (i.e., the estimated population and number of households in 2021) is based on 10-year-old data since the GoN postponed the census planned for 2021 due to the COVID-19 pandemic. The proposed scenarios represent different situations for the valley in terms of urban growth, building code compliance for new buildings, seismic retrofitting efforts, and the prevalence of varying building typologies. Seven building typologies feature in the exposure scenarios: adobe (A), brick/stone masonry with mud mortar (BSM), brick/stone masonry with cement mortar (BSC), wooden frame (W), current-construction-practice reinforced concrete (RC-CCP), well-designed reinforced concrete (RC-WDS), and reinforced masonry (RM). The aforementioned building typologies (except for RM) have been previously used by Chaulagain et al. to estimate seismic financial losses in Kathmandu Valley (Chaulagain et al., 2016) and Nepal (Chaulagain et al., 2015a). A, BSM, and BSC buildings constitute URM structures; A and BSM are particularly highly vulnerable due to the use of mud mortar and flexible floors. W have shown good seismic performance in the past due to their lightweight and adequate ductility. RC-CCP refers to RC frame structures constructed without technical supervision. In contrast, RC-WDS are RC structures with ductile detailing that are designed according to seismic provisions. RM corresponds with the RM1 (reinforced masonry bearing walls with wood or metal deck diaphragms) building typology from the HAZUS Earthquake Model (FEMA, 2020c) (see section “Modeling seismic vulnerability”). All building typologies are assumed to belong to a low-rise category (from one to three stories), based on surveys conducted by various authors (e.g. Chaulagain et al., 2013; O’Hara and Thapa, 2019; Varum et al., 2018).
Development of Scenarios A and B (population and buildings for 2021)
We develop the building inventory for Scenario A as follows. First, we derive the 2021 population per VDC from the 2011 census population (CBS, 2012) (per VDC) and the 2021 medium-variant population projections (per district) reported by the national authorities (CBS, 2014). We assume that the population in VDCs of the same district grew at a constant rate over the 2011–2021 period. This rate was 2.1% for Bhaktapur District, 2.8% for Kathmandu District, and 2.2% for Lalitpur District (CBS, 2014). Second, we divide the estimated population per VDC by their respective 2011 average household size to obtain the number of households in 2021. Herein, we assume that the average household size did not vary between 2011 and 2021 (and will remain unchanged in 2031, for Scenarios C and D), which is supported by observed trends in the average household size in Nepal’s urban areas (4.32 in 2011 (CBS, 2012), 4.2 in 2016 (CBS, 2016), and 4.3 in 2017 (CBS, 2017)). We also assume that each household lives in a separate building since the census does not directly provide the number of housing units. The predominantly low-rise building stock in Kathmandu Valley (as mentioned previously) supports this assumption.
Third, we determine the proportions of different building typologies per VDC based on the 2011 census data for the type of outer wall and the type of foundation. In particular, we directly (and somewhat conservatively) assign the A typology to households with walls made of “unbaked brick,”“others,” and “not stated” materials; the BSM typology to households with walls made of “mud bonded bricks/stone”; and the W typology to households with walls made of “wood/planks” and “bamboo.” To assign the BSC and RC typologies, we multiply the number of households with walls made of “cement bonded bricks/stone” by the fraction of households with foundations made of “cement bonded bricks/stone” and “RCC with pillar,” respectively. In addition, we further disaggregate the total number of RC buildings across RC-CCP and RC-WDS using the proportions suggested by Chaulagain et al. (2016) (76% and 24%, respectively). Although Chaulagain et al. considered four RC building typologies (76% CCP, 8% NBC, 8% NBC+, 8% WDS), we group the three building typologies representing engineered RC structures (i.e. NBC, NBC+, WDS) under only one building typology (i.e. WDS) for simplicity, given their relatively similar characteristics. Finally, we multiply the 2011 proportions of building typologies by the 2021 number of buildings to estimate their current presence per VDC.
We construct the building inventory for Scenario B following the same steps as Scenario A but considering a more seismically resistant building stock. The most vulnerable URM structures (i.e. A and BSM) are replaced by RM, while RC-WDS replace RC-CCP buildings. W structures are not selected to be retrofitted (in Scenario B or D), given their acceptable seismic performance (Gautam and Chaulagain, 2016; Varum et al., 2018).
Development of Scenarios C and D (population and buildings for 2031)
We develop the building inventory for Scenarios C and D as follows. First, we derive the 2031 population per VDC from the 2031 medium-variant population projections (CBS, 2014) (per district) and the 2031 built-up areas per VDC forecasted with an urban growth model developed by some of the authors (Mesta et al., 2022). The considered urban growth model, named SLEUTH (Slope, Land-cover, Excluded regions, Urban extent, Transportation, and Hillshade) (Chaudhuri and Clarke, 2013), uses previous maps of historical growth containing the features of its acronym to probabilistically determine future land use. SLEUTH operates with relatively simple transition rules that are based on spatial autocorrelation and neighborhood effects. SLEUTH was employed by Mesta et al. (2022) to simulate future urban built-up areas in Kathmandu Valley, considering 2018 as the seed year (when the last urban-extent map was available). Therefore, we estimate the 2031 population for each VDC of the same district as the contribution of its past population in 2018 (calculated in a similar way to the 2021 population, considering a constant growth rate over the 2011–2018 period) and its future population between 2018 and 2031 (proportional to its expected increase in built-up area), as follows:
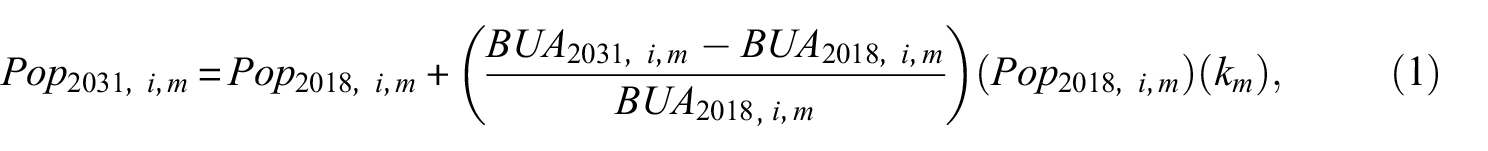
where
This way, Scenarios C and D account for the expected spatial differences in urban growth across the valley (i.e. the fact that some VDCs are likely to grow faster than others). Second, we compute the number of buildings per VDC similarly to Scenario A. For Scenario C, we use the same VDC-specific proportions of each building typology from Scenario A and estimate the number of buildings per building typology using the approach described in section “Development of Scenarios A and B (population and buildings for 2021).” Scenario D assumes that, over the 2021–2031 period, all URM buildings (i.e. A, BSM, and BSC) would be replaced by RM structures and that all RC-CCP buildings would be converted to RC-WDS. These transitions represent potential mitigation/seismic retrofitting policies that could be implemented to produce a more earthquake-resistant building stock. Finally, we calculate the aggregated replacement value for all the scenarios, using estimates of building area and construction costs for Kathmandu Valley from Chaulagain et al. (2015a) or based on engineering judgment (see Table 1). The construction costs include both structural and non-structural costs, based on 2015 values. The specifications of each scenario are summarized in Table 2.
Building areas and construction costs for Kathmandu Valley (Chaulagain et al., 2015a)
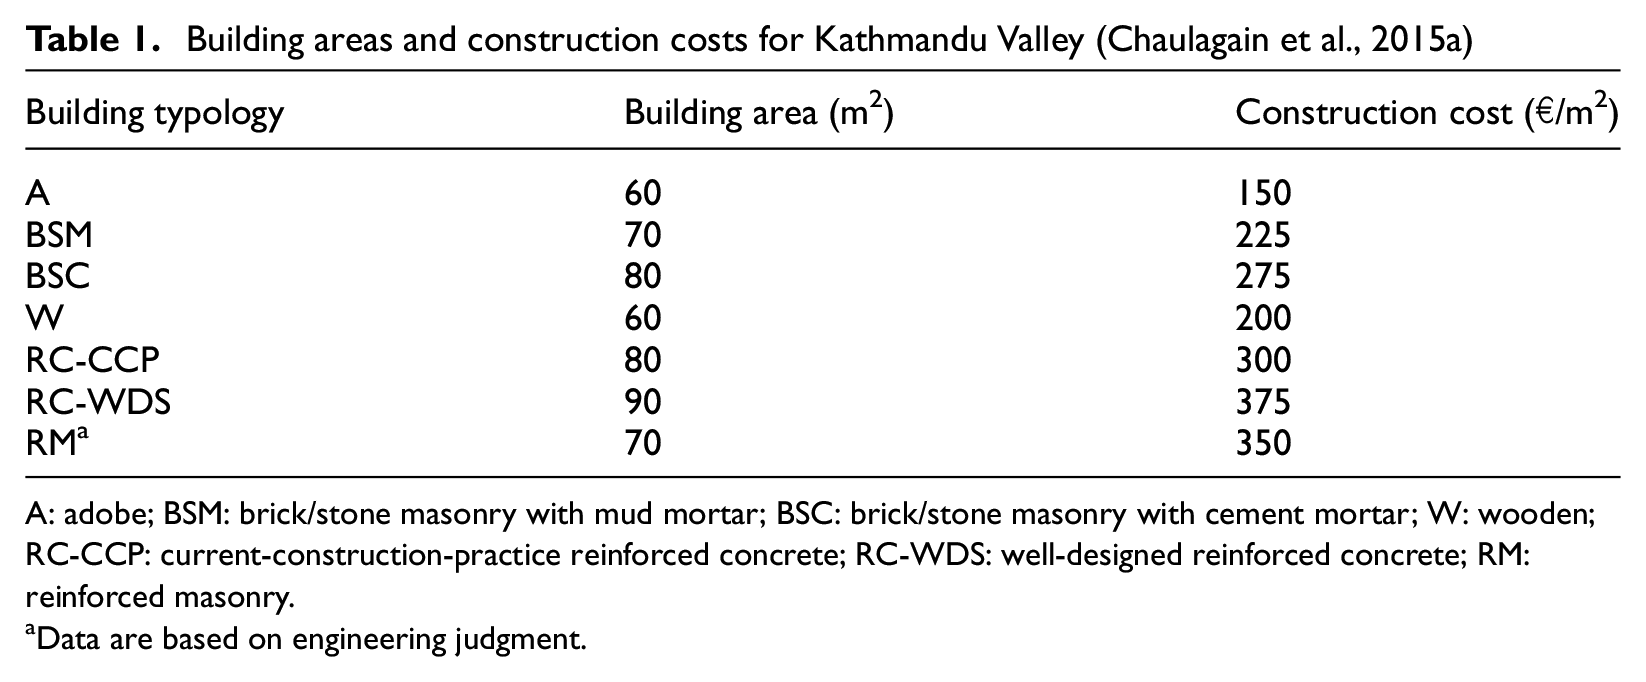
A: adobe; BSM: brick/stone masonry with mud mortar; BSC: brick/stone masonry with cement mortar; W: wooden; RC-CCP: current-construction-practice reinforced concrete; RC-WDS: well-designed reinforced concrete; RM: reinforced masonry.
Data are based on engineering judgment.
Summary of considered exposure scenarios for Kathmandu Valley
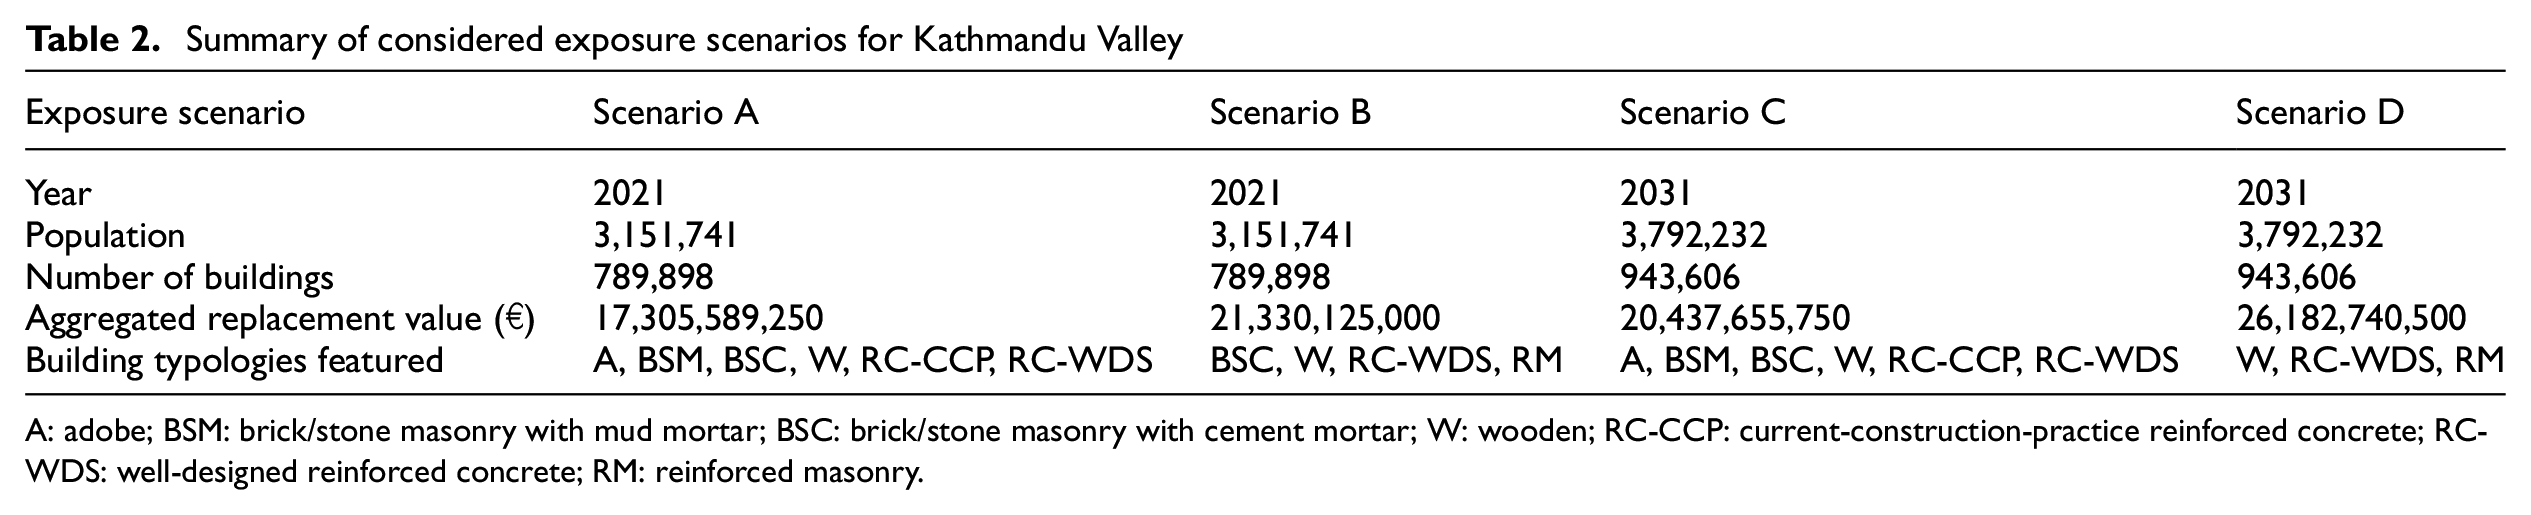
A: adobe; BSM: brick/stone masonry with mud mortar; BSC: brick/stone masonry with cement mortar; W: wooden; RC-CCP: current-construction-practice reinforced concrete; RC-WDS: well-designed reinforced concrete; RM: reinforced masonry.
Modeling seismic vulnerability
We employ pre-existing fragility functions to characterize the probability of damage to the building stock. In this study, we use fragility functions that depend on three different intensity measures, which are peak ground acceleration, or PGA; and two spectral accelerations at the yielding/fundamental period, or Sa(T1): Sa(0.18 s) and Sa(0.29 s). The fragility functions for A, BSM, BSC, and W are those commonly applied by the National Society for Earthquake Technology of Nepal (Chaulagain et al., 2015a); the fragility functions for RC-CCP and RC-WDS are acquired from Chaulagain et al. (2016). The fragility function for RM is obtained from HAZUS (FEMA, 2020c). This last fragility function was selected from HAZUS because (1) there are no available fragility functions for RM in Nepal; and (2) many countries around the world, including Nepal, adopt seismic provisions that are consistent with the recommendations of the Uniform Building Code (used as a benchmark to define the four HAZUS design levels) or similar international standards; the updated version of the NBC 2019 refers to the International Building Code 2015 as one of its related publications. In addition, as RM replaces the highly vulnerable URM structures with low ductility in the retrofitted scenarios, we consider that it may be not very realistic (technically feasible) to assign the retrofitted structures a “high” HAZUS design level (i.e. high strength and high ductility approximately). Instead, we consider it more appropriate to use a “moderate” design-level fragility function for RM, which approximately corresponds to buildings with moderate strength and moderate ductility. This assumption is consistent with findings on mapping HAZUS fragility functions to local building types in other areas close to Nepal (Sevieri et al., 2020). In most cases, the available fragility functions describe three damage states (i.e. moderate, extensive, and collapse). Thus, we exclude the RM “slight damage state” fragility function and assume all RM buildings in the “complete damage state” to collapse for general consistency across all building typologies. Moreover, we do not include the effects of structural capacity degradation over time, given the short analysis period (2021–2031) and assuming ordinary maintenance/repairs of the considered assets. In addition, we assume that a given building typology has the same vulnerability level whether constructed on flat ground or on a slope. Although in line with conventional earthquake loss assessment exercises, this assumption is simplistic for the following reason. Buildings on hilly topography, particularly in the active Indian Himalayan region, are often constructed with foundations at multiple levels requiring varying height columns to accommodate the ground slope (e.g. Patil and Raghunandan, 2021). This feature introduces vertical irregularities over the height of these structures, making them more susceptible to seismic damage than regular buildings on flat ground (e.g. Patil and Raghunandan, 2021). Nevertheless, as we include the site characteristics of the valley in the hazard analysis (as described in section “Considered earthquake scenario”), we account for differences in the amplitudes of ground motion experienced by building on flat ground versus on slopes. Table 3 describes the parameters of the lognormal fragility functions for each building typology, including the considered ground-motion intensity measure for each model and the median (θ) and dispersion (β) per damage state. For illustrative purposes, the fragility functions for the BSC and RC-CCP building typologies are shown in Figure 4a and d.
Considered ground-motion intensity measure and corresponding median (θ) and dispersion (β) of the fragility functions for each building typology (Chaulagain et al., 2015a, 2016; FEMA, 2020c)
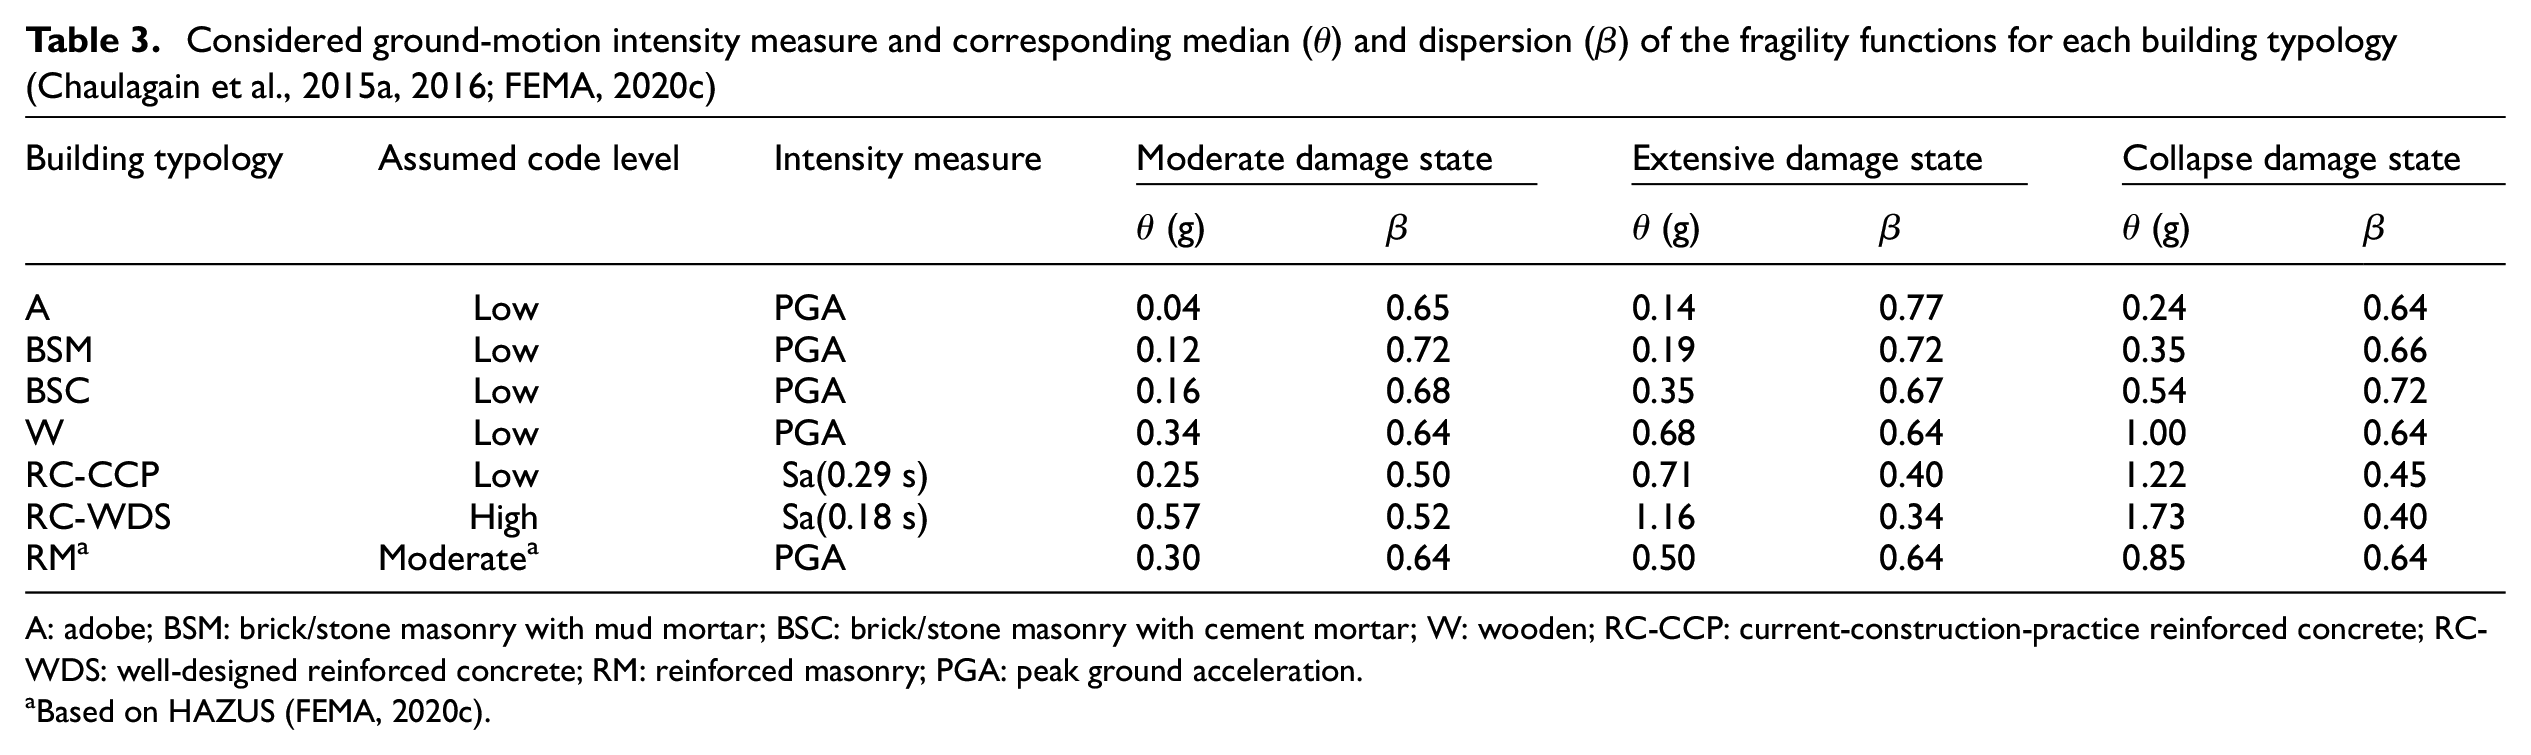
A: adobe; BSM: brick/stone masonry with mud mortar; BSC: brick/stone masonry with cement mortar; W: wooden; RC-CCP: current-construction-practice reinforced concrete; RC-WDS: well-designed reinforced concrete; RM: reinforced masonry; PGA: peak ground acceleration.
Based on HAZUS (FEMA, 2020c).
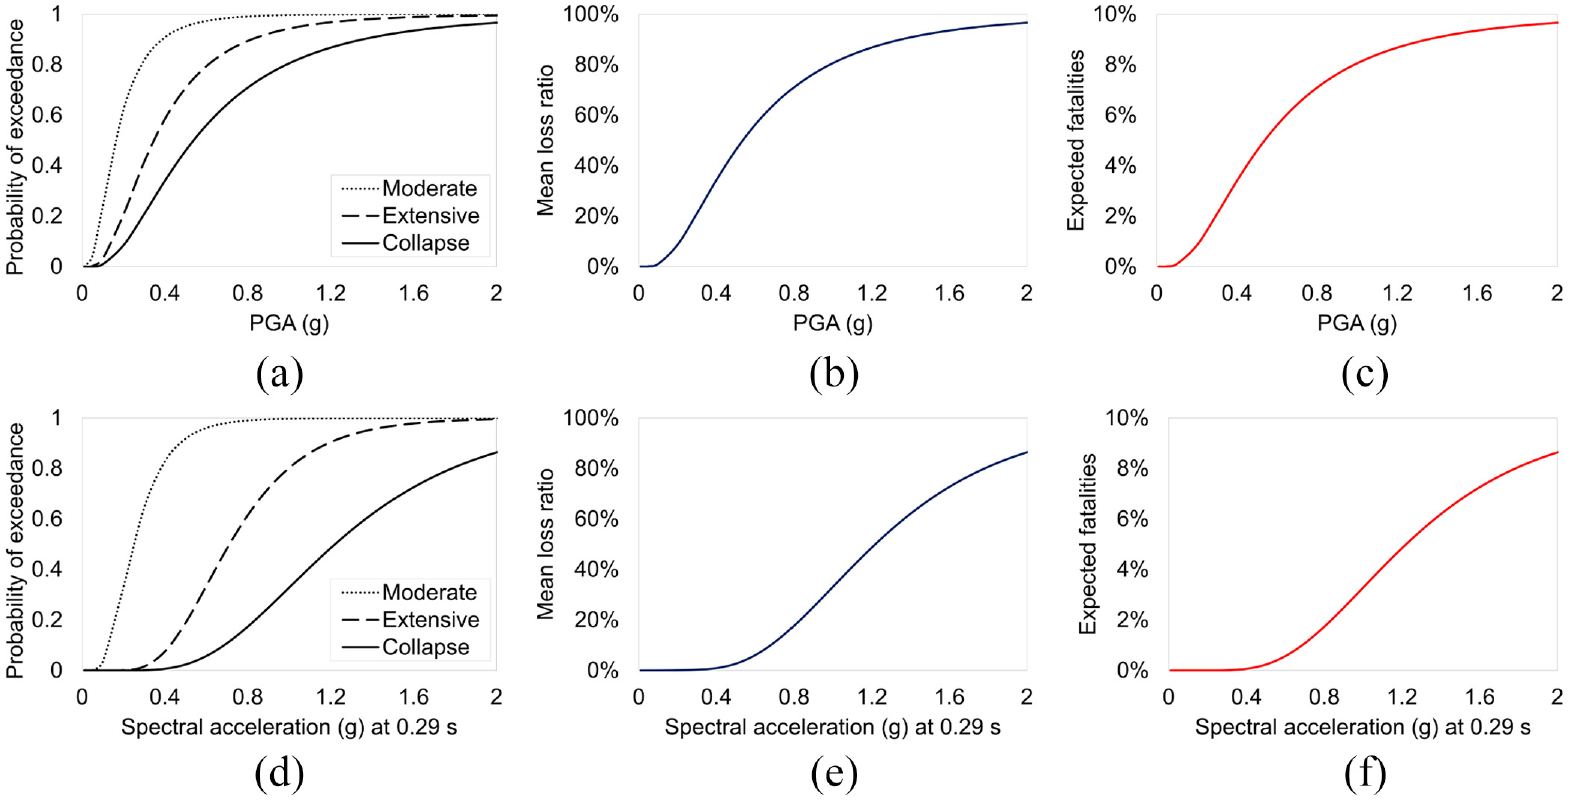
(a) Fragility and (b, c) vulnerability functions for the BSC building typology. (d) Fragility and (e, f) vulnerability functions for the RC-CCP building typology.
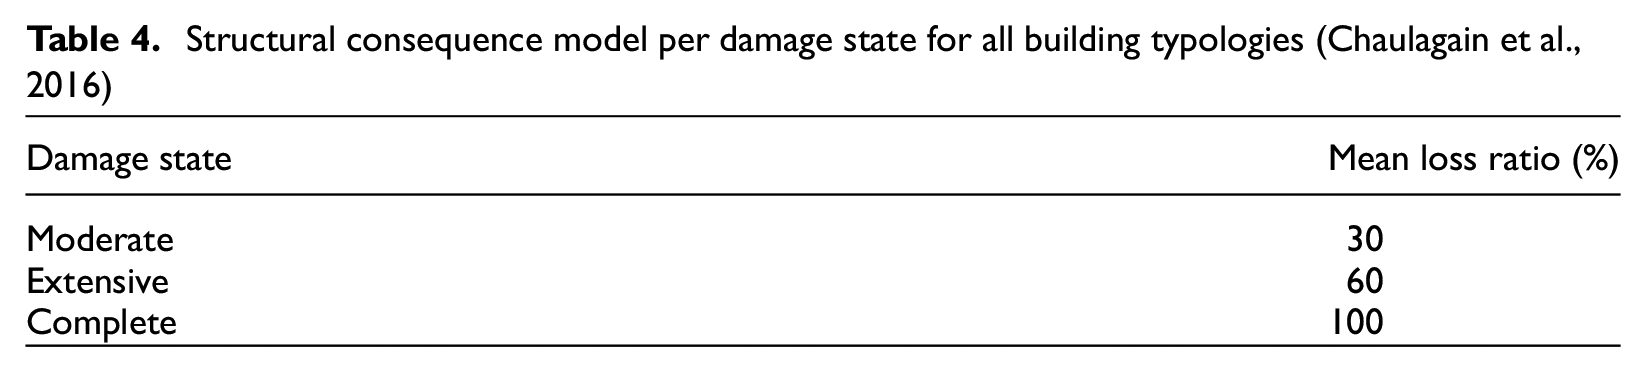
We combine the fragility functions with a structural consequence model (Chaulagain et al., 2016) (shown in Table 4) and a fatality consequence model (FEMA, 2020c) (shown in Table 5) to generate vulnerability functions for estimating financial and human losses. We only consider mean losses in both cases. In the structural consequence model, the mean loss ratio is obtained by expressing the expected repair cost as a percentage of the replacement cost. In the fatality consequence model, the losses are expressed as the expected percentage of fatalities among occupants and are based on the Indoor Casualty Rates associated with Injury Severity Level 4 (instantaneously killed or mortally injured) in HAZUS (FEMA, 2020c). To apply the fatality consequence model, we map the considered building typologies to those provided in HAZUS (FEMA, 2020c) based on similarities in structural characteristics, as follows: A, BSM, BSC are mapped to URM Bearing Walls (URML); W is mapped to Wood, Light Frame (W1); RC-CCP and RC-WDS are assumed to correspond with Concrete Frame with URM Infill Walls (C3L); and RM is mapped to Reinforced Masonry Bearing Walls with Wood or Metal Deck Diaphragms (RM1L). The resulting vulnerability functions for the BSC and RC-CCP building typologies are shown in Figure 4b, c, e, and f.
Structural consequence model per damage state for all building typologies (Chaulagain et al., 2016)
Fatality consequence model per damage state for each building typology (adapted from FEMA, 2020c)
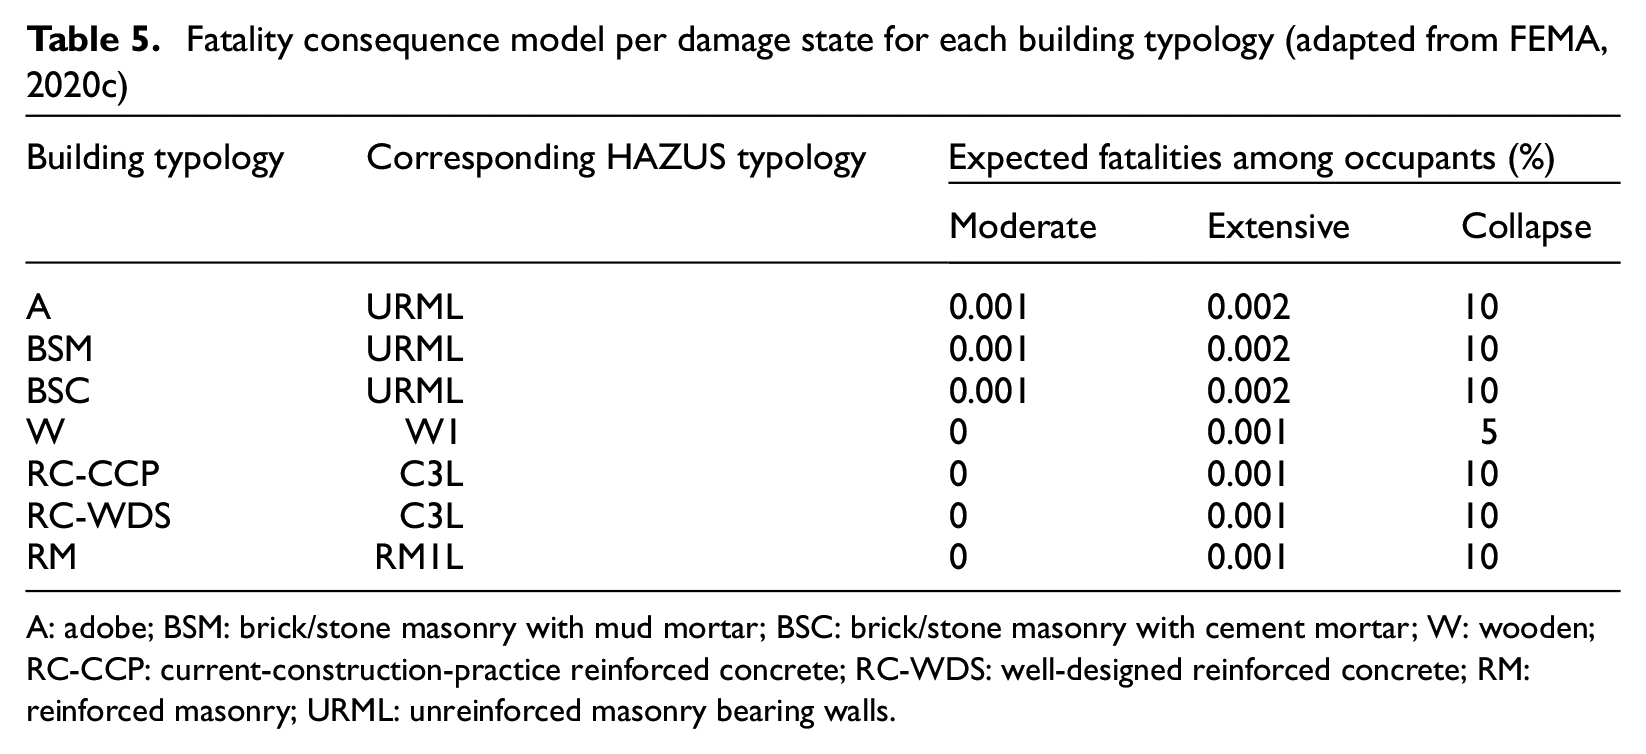
A: adobe; BSM: brick/stone masonry with mud mortar; BSC: brick/stone masonry with cement mortar; W: wooden; RC-CCP: current-construction-practice reinforced concrete; RC-WDS: well-designed reinforced concrete; RM: reinforced masonry; URML: unreinforced masonry bearing walls.
Moreover, we compute the fatalities considering a nighttime scenario, assuming that 100% of the occupants are indoors during the earthquake event. This differs from the actual 2015 Gorkha Earthquake, which occurred at 11:56 a.m. local time; thereby, we consider a worse scenario (at least in the context of residential buildings). In addition, we classify populations per VDC as low, middle, and high-income to facilitate related disaggregation of financial and human losses. This classification is done according to Mesta et al. (2022), where three variables (i.e. access to mobile/telephone services, mass media communication, and means of transportation) provided by the 2011 Census were selected as proxies for economic wealth. The proposed classification is based on aggregated census data reported at VDC level. Therefore, any variability in the population’s income level within each VDC (i.e. between households of the same VDC) is not (and cannot be) assessed. The three income categories correspond with a quantile classification (i.e. each category contains an equal number of VDCs). We assume that the population’s income level did not vary between 2011 and 2021 and would remain unchanged in 2031, given the lack of available data to make alternative confident projections. This assumption is at least partially supported by previous work from Cutter and Finch (2008), who suggested that the social vulnerability of a community, which is influenced by its underlying socioeconomic and demographic characteristics (e.g. income level, gender, age), is not expected to vary significantly over timeframes similar to those considered in this study. A map of income-level classification across the study area is provided in Figure 5.
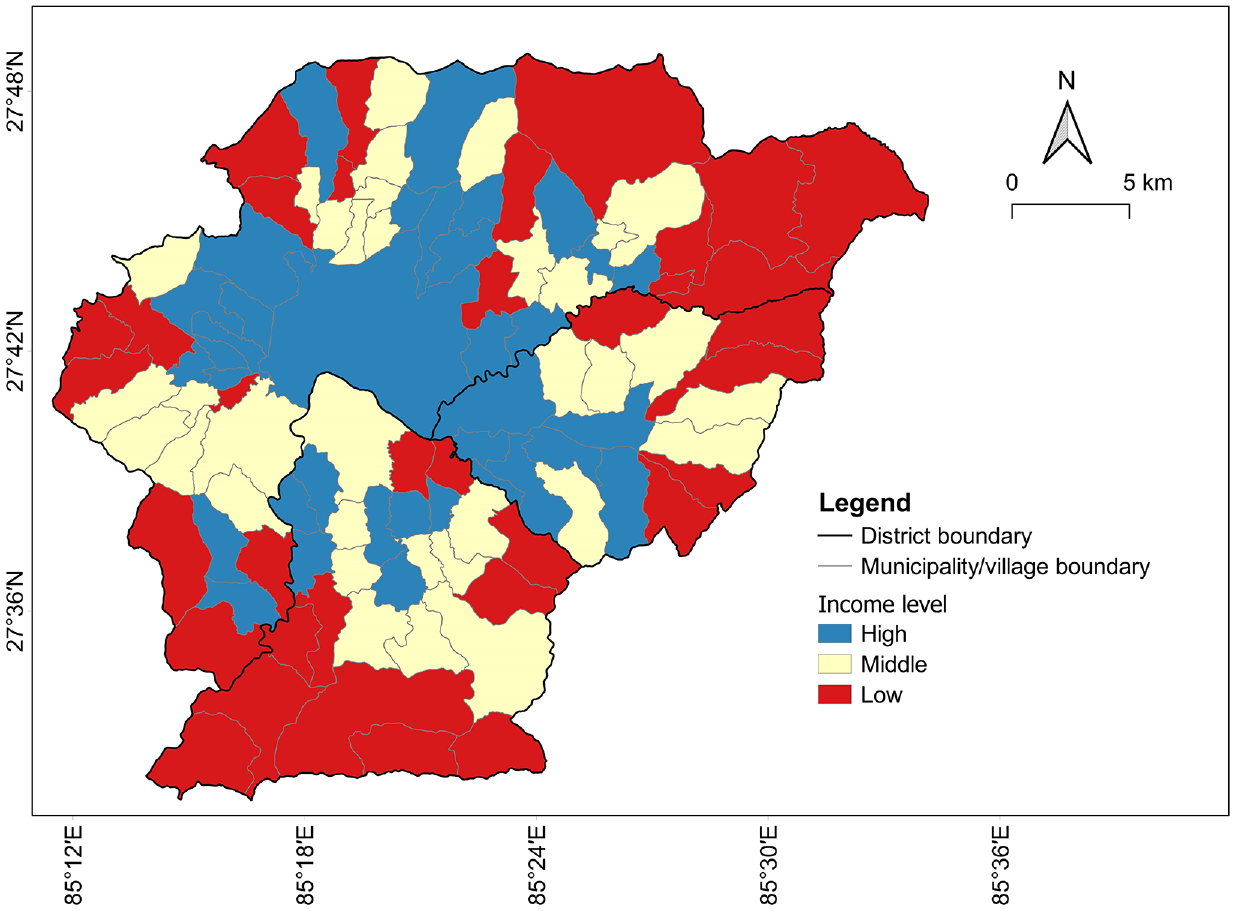
Income-level classification across the study area.
Results and discussion
GMFs
We generate a total of 3,000 GMFs (500 realizations per GMM, for each of the three considered intensity measures) that account for the site characteristics of the valley (i.e. spatially varying Vs30 values). As ground-shaking intensities do not vary significantly across the small area of a VDC, we only calculate the intensity values (and subsequent losses) at the centroid of each VDC. Figure 6a to c displays the mean estimates (across all the GMF realizations) for each intensity measure using the GMM of Atkinson and Boore (2003). Driven by the site characteristics of the valley (see Figure 3), the mean estimates of the GMM of Atkinson and Boore (2003) lead to stronger ground motion in central Kathmandu Valley (where soft soils are dominant) compared with the valley’s edges (on hard soil/rock). The mean estimates of PGA using the GMM of Atkinson and Boore (2003) range between 0.18 and 0.29 g for the different VDCs across the valley. We predict a more severe ground shaking using the GMM of Boore et al. (2014) (e.g. mean estimates of PGA range between 0.37 and 0.72 g).
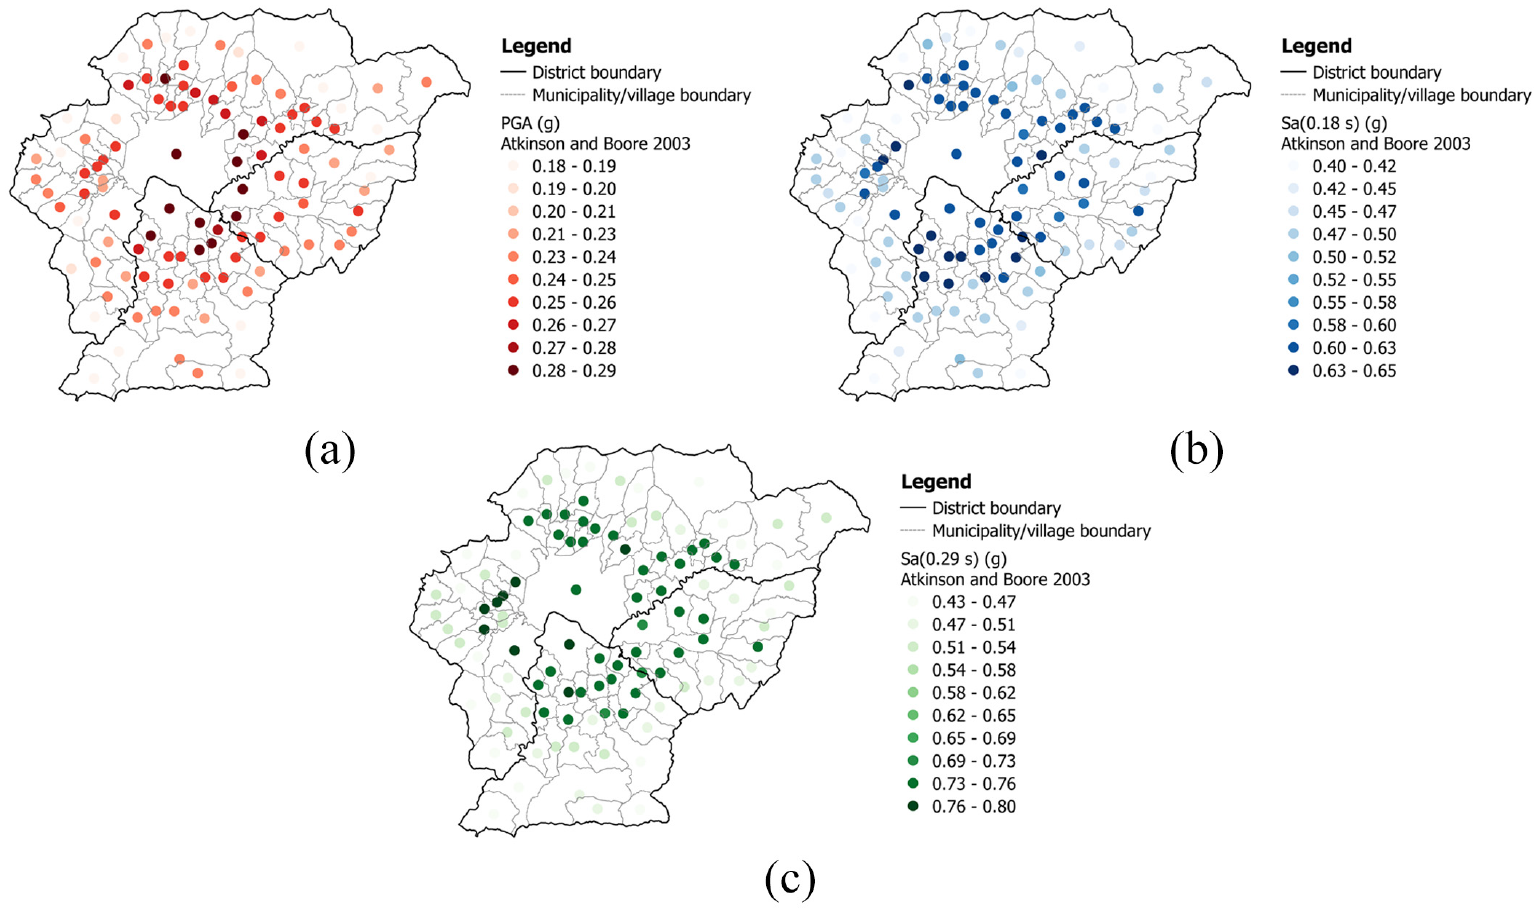
Mean estimates of ground motion for (a) PGA, (b) Sa (0.18 s), and (c) Sa (0.29 s) using the GMM of Atkinson and Boore (2003).
Damage distribution
Table 6 presents the mean statistics on damage distribution per building typology for the four exposure scenarios. Comparing the mean collapse rates (i.e. the expected percentage of the total number of buildings in a given typology that collapse, estimated from Table 6) helps to understand potential changes to the overall seismic vulnerability in Kathmandu Valley. Scenarios A and C describe a “no change” pathway, where the building stock’s quality remains the same in 2021 and 2031 as in 2011. We notice high respective mean collapse rates of 62% and 45% for A and BSM in these scenarios. In addition, the mean collapse rates are 27% for BSC, 21% for RC-CCP, and limited to only 8% for W and RC-WDS. In Scenarios B and D (which are associated with partial improvements in the building stock’s quality in 2021 and 2031), we observe that RM, introduced to replace A, BSM (in Scenarios B and D), and BSC (in Scenario D), are associated with a minor mean collapse rate of 13%, indicating a significant reduction in the seismic vulnerability. The other building typologies show similar mean collapse rates as corresponding previous scenarios, due to the use of the same fragility functions. Furthermore, we note that the overall expected percentages of buildings with moderate damage, extensive damage, and that collapse respectively decrease from 32%, 21%, and 28% in Scenarios A/C to 31%, 14%, and 16% in Scenario B, and to 27%, 14%, and 11% in Scenario D. The expected percentage of buildings that do not suffer damage increases from 20% in Scenarios A/C to 39% in Scenario B and 48% in Scenario D.
Building damage distribution: the expected number of buildings in a given damage state, per building typology and scenario
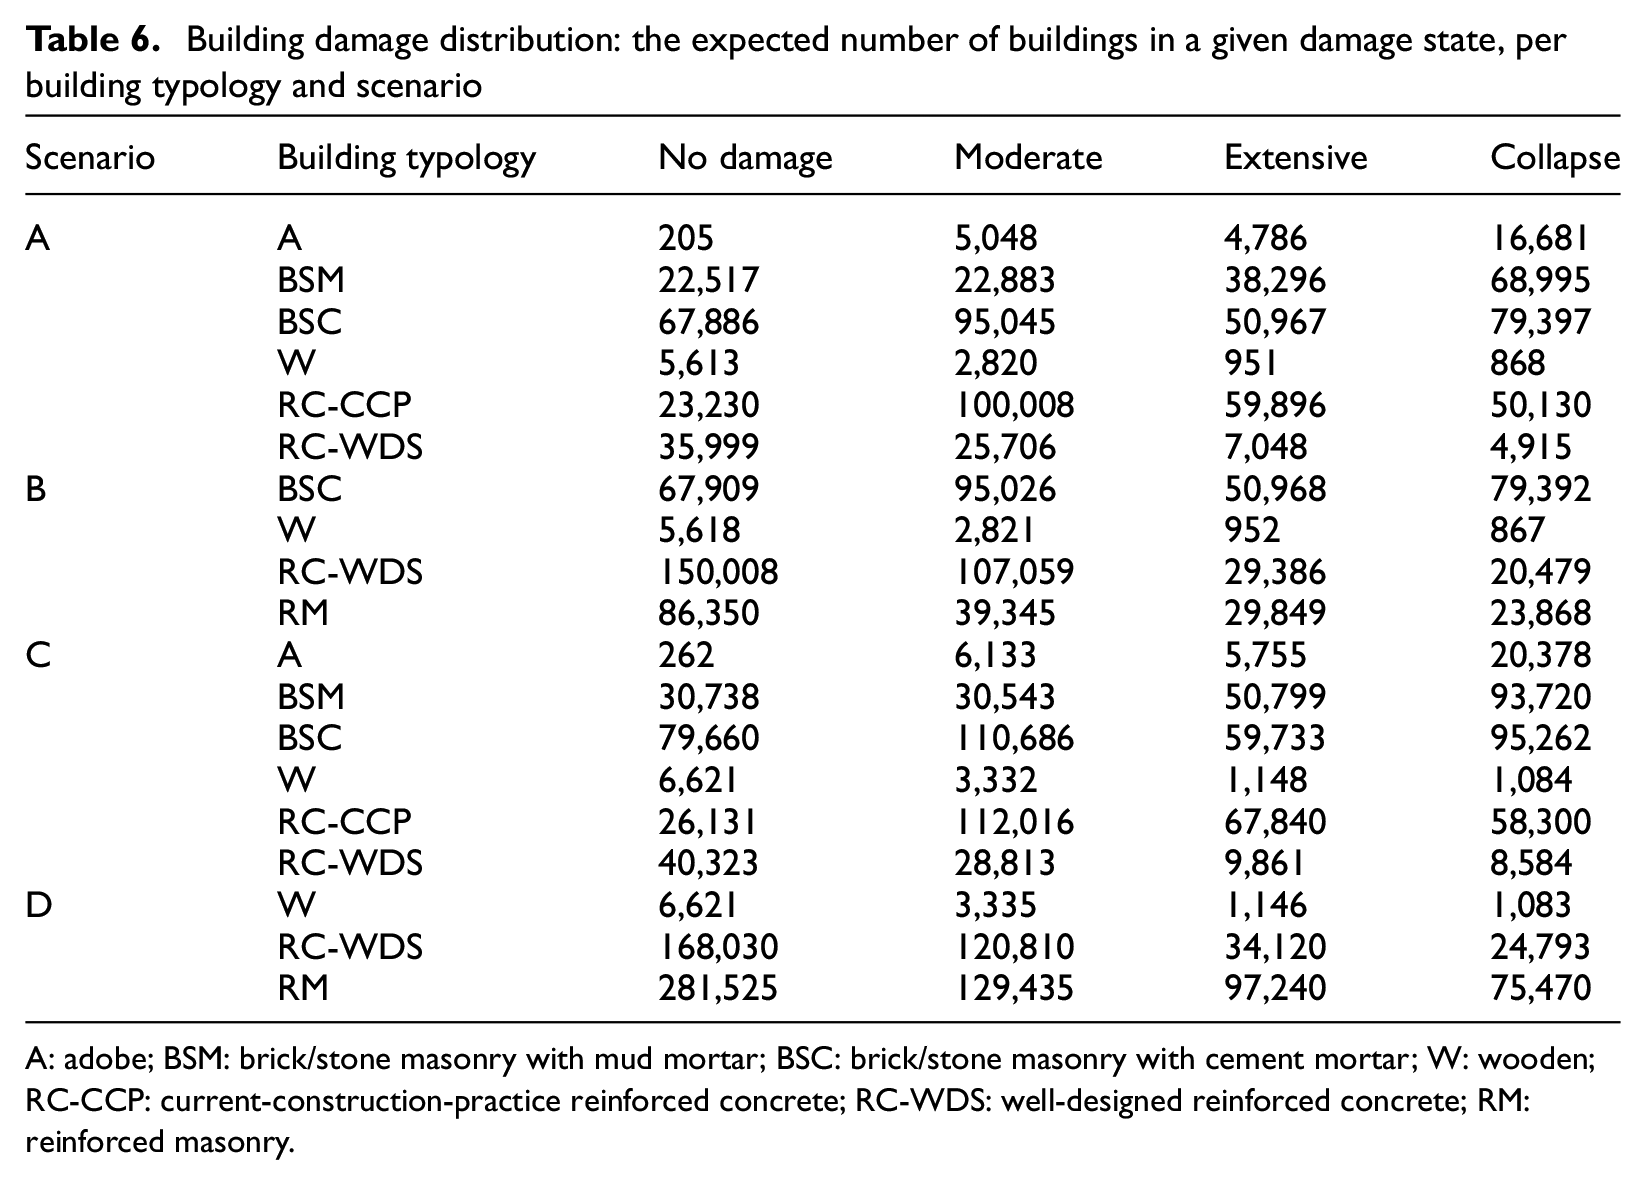
A: adobe; BSM: brick/stone masonry with mud mortar; BSC: brick/stone masonry with cement mortar; W: wooden; RC-CCP: current-construction-practice reinforced concrete; RC-WDS: well-designed reinforced concrete; RM: reinforced masonry.
Financial and human losses
Figure 7 presents the mean loss ratios and expected fatalities, disaggregated by district and income level. From Figure 7a and b, we only observe a minor variability in both mean loss ratio metrics by district. Kathmandu district contains the highest number of buildings and population. It thus accumulates the largest absolute losses (approximately 74% of the total expected financial losses and 71% of the total expected fatalities) for all scenarios. The three districts have similar mean loss ratio metrics due to experiencing almost the same range of ground-motion intensities and having relatively small differences in the prevalence of different building typologies. For instance, in Scenario A, the mean values of PGA (computed with the GMM of Atkinson and Boore, 2003) vary between 0.18 and 0.28 g in Bhaktapur, and between 0.18 and 0.29 g in Kathmandu and Lalitpur. Also, in Scenario A, the total share of A, BSM, and BSC (the typologies with the highest mean collapse rates, as shown in section “Damage distribution”) is 68% in Bhaktapur, 57% in Kathmandu, and 65% in Lalitpur; the proportion of RC (RC-CCP, RC-WDS) is 31% in Bhaktapur, 41% in Kathmandu, and 34% in Lalitpur; and the W typology represents only 1% of the building stock in the three districts. Bhaktapur is associated with the largest prevalence of the URM typologies, which explains why it exhibits mean loss ratio metrics slightly higher than those of Lalitpur and Kathmandu in Scenario A. Similar observations apply for Scenario C. In addition, the more homogeneous building stocks that exist in Scenarios B and D (due to the proposed retrofitting strategies) further reduce differences in the mean loss ratio metrics of the three districts. From Figure 7c and d, we also identify a small variability in the mean loss ratio metrics by income level. All scenarios produce the highest mean loss ratio metrics for the low-income population and/or the medium-income population. These trends are mainly explained by variations in building typologies; low-income VDCs are associated with higher proportions of the most vulnerable buildings than wealthier areas. For instance, in Scenario A, the highly vulnerable URM typologies comprise 73% of all buildings in low-income VDCs, 61% in middle-income VDCs, and 57% in high-income VDCs. In addition, the benefits resulting from the retrofitting plan proposed in Scenario B (relative to Scenario A) are slightly larger for the low-income population (low-income mean loss ratios and expected fatalities respectively decrease by 18% and 1.6%) than for the other income groups. The retrofitting strategy proposed in Scenario D also results in the largest benefits for the low-income population (mean loss ratios and expected fatalities for this income level respectively drop by 23% and 2.2%, compared with Scenario C). These observations reveal an implicit correlation between the population’s income level and their associated building typologies: the low-income population typically lives in highly vulnerable buildings (e.g. A, BSM), such that retrofitting initiatives disproportionally benefit poorer people.
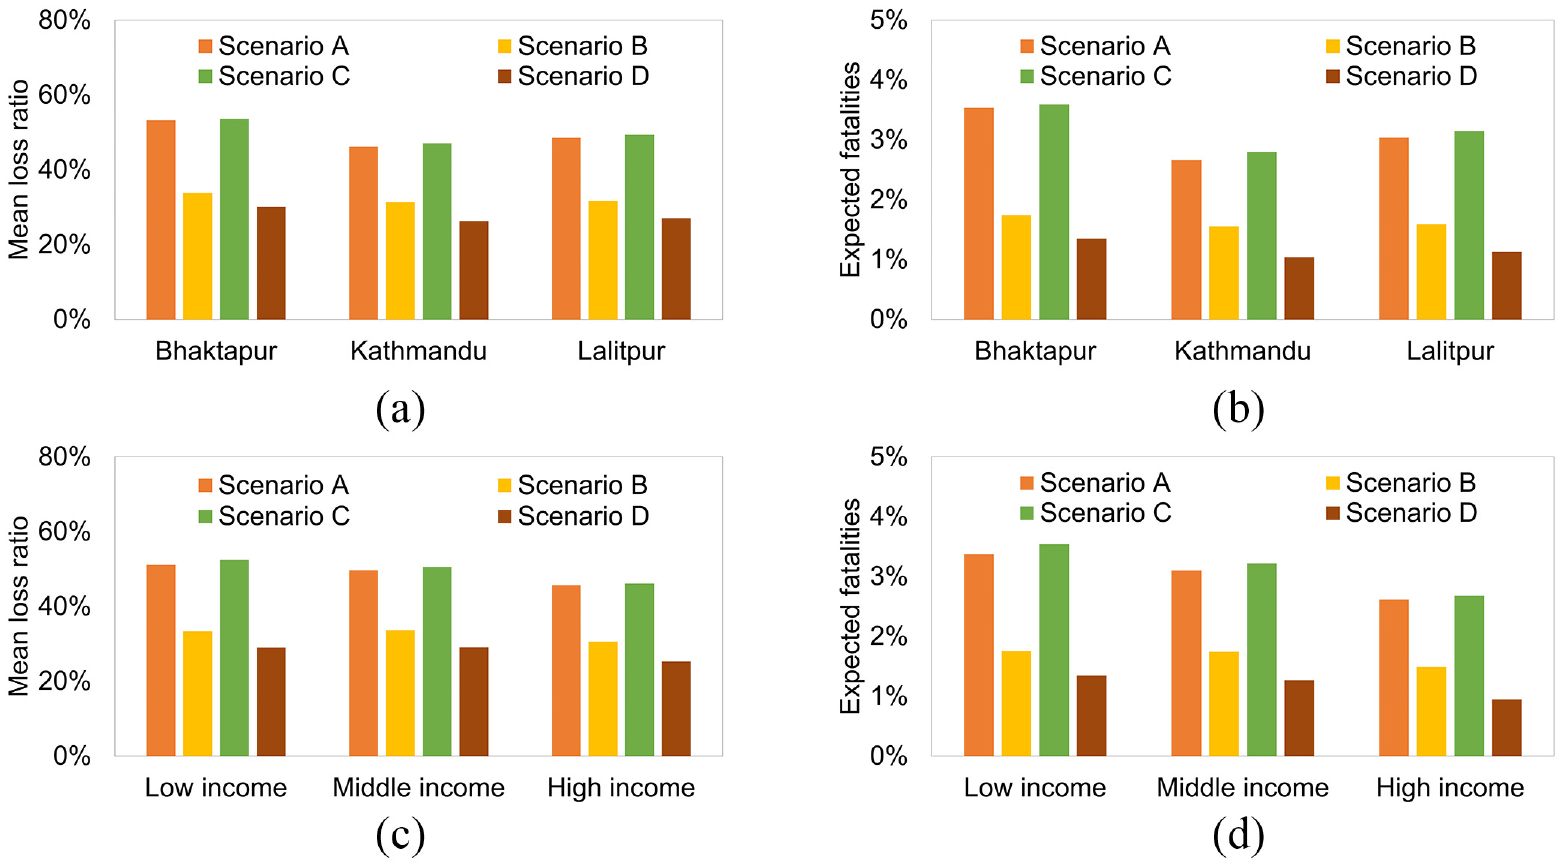
(a, b) Mean statistics on financial and human losses disaggregated by district and (c, d) income level.
Table 7 summarizes changes across various mean loss metrics, considering Scenario A as a baseline. The analyzed scenarios effectively highlight how “no action” and “partial improvement” of the building stock could affect seismic risk in Kathmandu Valley. In the 2021 scenarios, 3,151,741 people live in 789,898 buildings, with a total replacement value of €17.3 billion in Scenario A and € 21.3 billion in Scenario B. The losses estimated in Scenario A are considerable: nearly € 8.2 billion in reconstruction costs (mean loss ratio of 47%) and 89,199 fatalities (expected fatalities of 2.8%). In Scenario B, where a partial retrofitting scheme is proposed, the economic losses decrease by more than € 1.4 billion (−17%), and there are 39,272 fewer fatalities (−44%). In the 2031 scenarios, 3,792,232 people are allocated across 943,606 buildings, which have a total replacement value of € 20.4 billion in Scenario C and € 26.2 billion in Scenario D. Scenario C reveals that a larger population can easily lead to greater earthquake-induced losses when risk mitigation is neglected. In this Scenario, reconstruction costs increase by more than €1.6 billion (+20%), and human losses increase by 22,622 (+25%), compared with Scenario A. On the contrary, Scenario D demonstrates that, despite a growing population, better building codes and seismic retrofitting can significantly reduce losses. There are around €1.2 billion fewer economic losses (−14%) and 47,896 fewer fatalities (−54%) in Scenario D than in Scenario A.
Mean loss metrics for Scenario A, and changes to these metrics in Scenarios B, C, and D
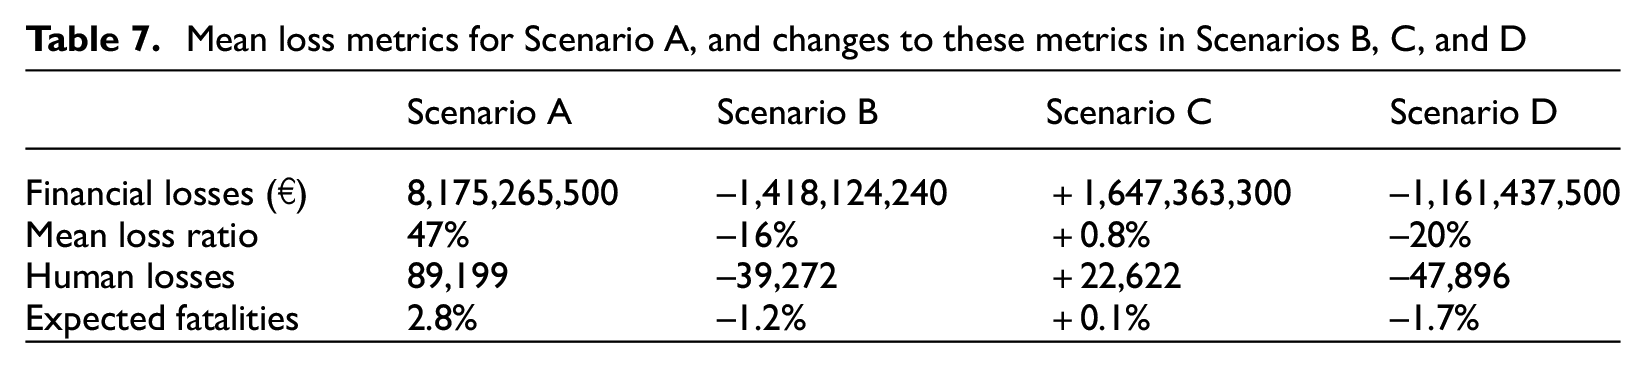
Changes to the mean loss ratio provide additional interesting findings. In Scenario A, the mean loss ratio is 47%, which remains virtually the same in Scenario C since there is no change in the building stock’s quality. However, as the building stock’s quality increases slightly in Scenario B and to a greater extent in Scenario D due to seismic retrofitting, this ratio drops to 31% and 27%, respectively. This means that the relative financial losses decrease substantially due to lower seismic vulnerability. Similar inter-scenario changes are observed for the expected fatalities metric.
Figure 8 presents additional insights into the spatial distribution of the mean loss ratio at the VDC level. No change to the building stock’s quality results in virtually the same mean loss ratios for Scenarios A and C. Although there is no clear pattern, we recognize that many VDCs with the largest mean loss ratios are located within the valley’s borders. These VDCs have a high prevalence of URM structures (>81%) in their building stock. In contrast, many VDCs with the lowest mean loss ratios are situated in the central part of the valley, even though soft soils are dominant in this area (see Figure 3), and thus ground-motion intensities are higher than in the valley’s borders (see Figure 6). The building stock of these VDCs is characterized by a relatively low proportion of URM structures (<57%). Similar observations arise for the spatial distribution of expected fatalities at the VDC level, depicted in Figure 9. The effects of the partial retrofitting scheme proposed in Scenario B, relative to Scenario A, are the following: mean loss ratios decrease in seven VDCs by 30% or more, in 41 VDCs by 20%–30%, and in 56 VDCs by 10%–20%. Also, the expected fatalities decrease in four VDCs by 3% or more, in 43 VDCs by 2%–3%, in 49 VDCs by 1%–2%, and in 8 VDCs by less than 1%. Moreover, the additional benefits of the retrofitting plan proposed in Scenario D, relative to Scenario C, are as follows: mean loss ratios decrease in eight VDCs by 30% or more, in 81 VDCs by 20%–30%, and in 15 VDCs by 10%–20%. At the same time, expected fatalities reduce in six VDCs by 3% or more, in 64 VDCs by 2%–3%, and in 34 VDCs by 1%–2%.
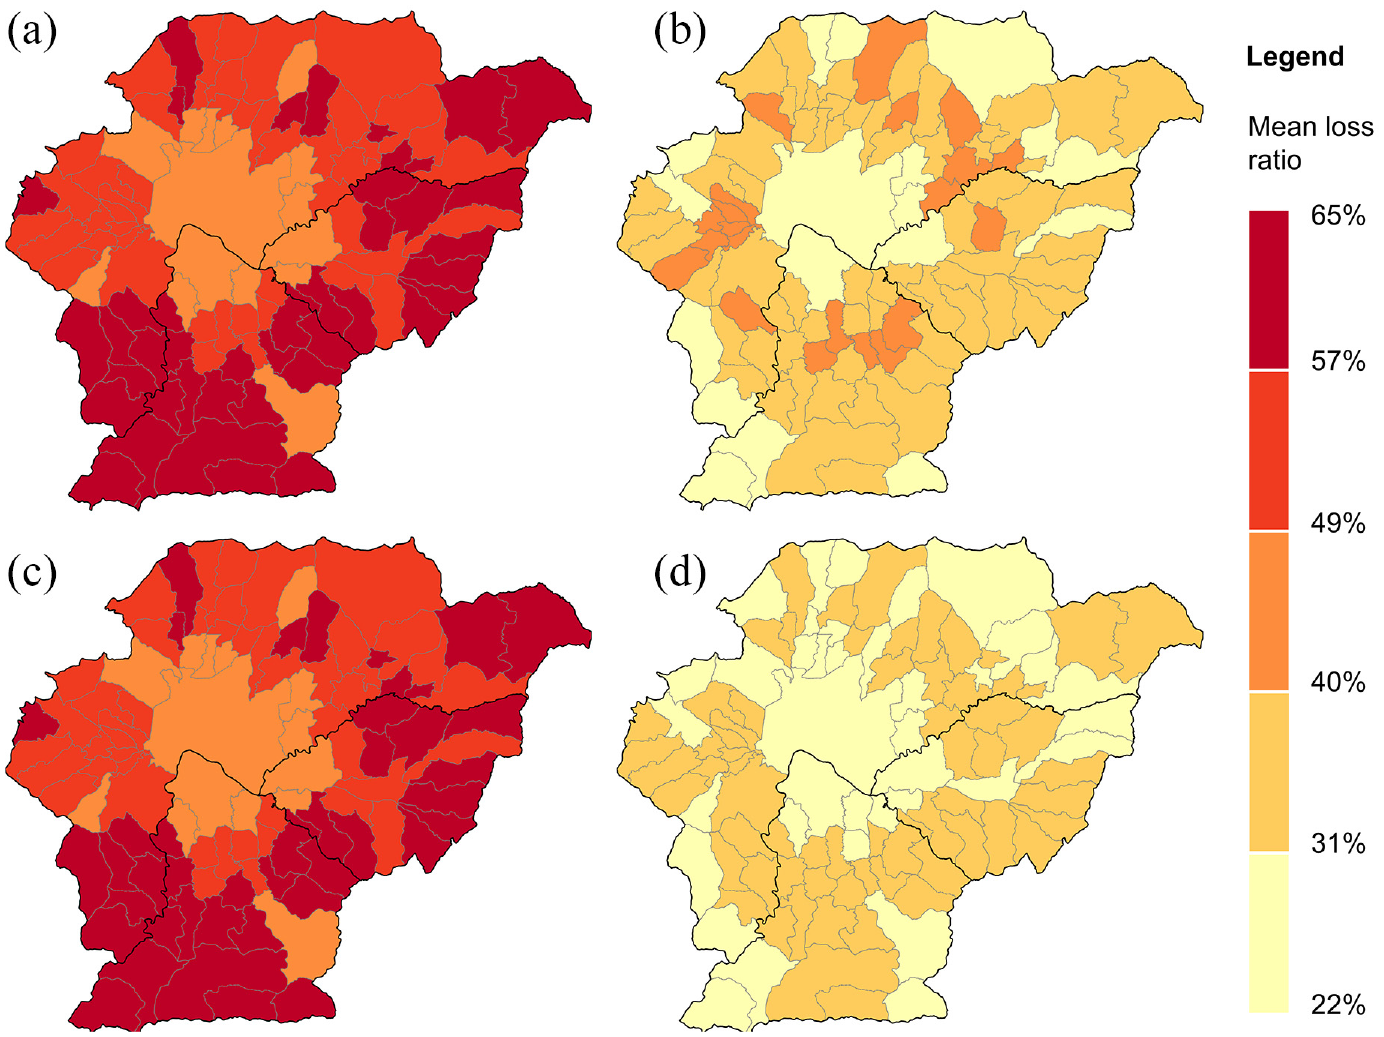
Spatial distribution of the mean loss ratio for Scenarios (a) A, (b) B, (c) C, and (d) D.
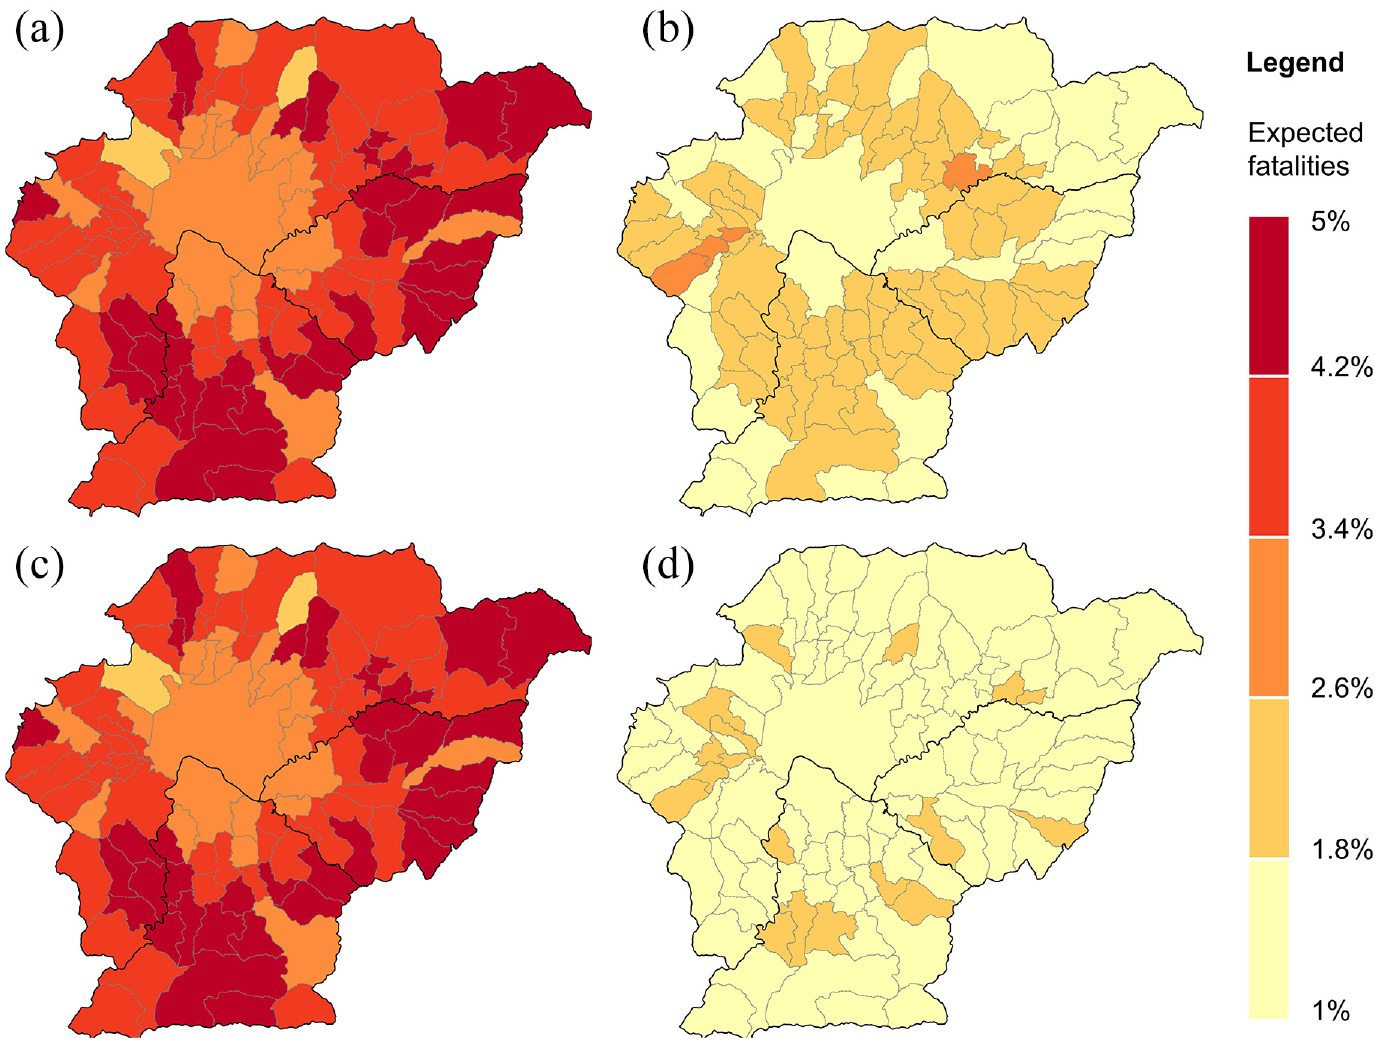
Spatial distribution of expected fatalities for Scenarios (a) A, (b) B, (c) C, and (d) D.
Conclusions
This study has examined the present (2021) and future (2031) seismic risk in Kathmandu Valley, considering a single-event scenario similar to the 2015 Gorkha Earthquake. Different assumptions on the estimated population, number of households, and building stock quality have been made to construct four plausible current and near-future urban development states for the valley.
Results reveal that a current building stock with the same prevalence of building typologies as in 2011 is highly vulnerable to earthquake-induced ground shaking and may lead to substantial losses. However, building code enforcement and seismic retrofitting plans can significantly reduce building damage, and corresponding financial and human losses in the present and future relative to equivalent current levels. In addition, future losses are substantially lower than those that would result in the future if hard mitigation measures were not introduced. Past events have shown that poor people disproportionally suffer the effects of natural-hazard disasters due to lower socioeconomic resilience (Hallegatte et al., 2020). This study shows that retrofitting initiatives that aim to uniformly reduce the seismic vulnerability of the building stock can benefit low-income populations the most. These findings are relevant because the benefits of seismic mitigation measures are currently not well understood/quantified by various stakeholders in Nepal. Accordingly, this article addresses the essential need to quantitatively communicate the growing seismic risk and potentially encourage local (or even country-wide) earthquake risk-mitigation efforts.
It is important to note that the successful practical implementation of the risk-reduction interventions proposed in this study would depend on several factors, such as the availability of financial and technical resources, the willingness to transition away from traditional building practices, governance and institutional capacity, and public appetite for change, which may not yet be sufficient (Arendt et al., 2017). If a complete upgrade of the building stock’s quality is not feasible, a risk-based prioritization of buildings could be carried out to determine the optimal allocation of limited resources for retrofitting. Moreover, encouraging risk-sensitive land-use planning would help reduce seismic risk in the future (e.g. by prohibiting future urbanization in zones with the softest soils).
Finally, while this article is focused on a single hazard scenario, future research could investigate other possible events in Kathmandu Valley to provide more robust results. Nonetheless, we do not expect the general trend identified in the relative variation of loss to significantly differ for other events in the valley. 3D physics-based ground-motion simulations may be a viable alternative to empirical GMMs outputs for more accurately quantifying earthquake hazards (and the associated risk) (Freddi et al., 2021). Moreover, updated census information and data improvements can be employed to adjust present and future exposure estimations. In addition, the accuracy and uncertainty involved in the characterization of physical vulnerability can be improved and reduced respectively, through appropriate context-specific modifications to the selection fragility functions (e.g. employing a fragility function for the RM typology adjusted to the local construction practices). Finally, while the benefits of building code enforcement and seismic retrofitting plans have been discussed in this article without a proper analysis of costs, various methods such as cost–benefit evaluations (Giordano et al., 2021; Liel and Deierlein, 2013; Yi et al., 2020; Zanini et al., 2019), or multi-criteria decision-making (Gallo et al., 2022; Gentile and Galasso, 2021), can help in selecting optimal solutions.
Supplemental Material
sj-docx-1-eqs-10.1177_87552930221134950 – Supplemental material for Quantifying the potential benefits of risk-mitigation strategies on present and future seismic losses in Kathmandu Valley, Nepal
Supplemental material, sj-docx-1-eqs-10.1177_87552930221134950 for Quantifying the potential benefits of risk-mitigation strategies on present and future seismic losses in Kathmandu Valley, Nepal by Carlos Mesta, David Kerschbaum, Gemma Cremen and Carmine Galasso in Earthquake Spectra
Footnotes
Acknowledgements
We thank the associate editor and two anonymous reviewers for the insightful comments, which helped improve the quality of this manuscript.
Declaration of conflicting interests
The author(s) declared no potential conflicts of interest with respect to the research, authorship, and/or publication of this article.
Funding
The author(s) disclosed receipt of the following financial support for the research, authorship, and/or publication of this article: C.M. was supported by a Research Scholarship from the European Centre for Training and Research in Earthquake Engineering (EUCENTRE). C.G. and G.C. acknowledge funding from UKRI GCRF under grant NE/S009000/1, Tomorrow’s Cities Hub.
Supplemental material
Supplemental material for this article is available online.
References
Supplementary Material
Please find the following supplemental material available below.
For Open Access articles published under a Creative Commons License, all supplemental material carries the same license as the article it is associated with.
For non-Open Access articles published, all supplemental material carries a non-exclusive license, and permission requests for re-use of supplemental material or any part of supplemental material shall be sent directly to the copyright owner as specified in the copyright notice associated with the article.