
Abstract
This article presents geotechnical reconnaissance data that characterize the formation of 122 new and 49 historical cover-collapse sinkholes within 1.13 km2 area in 12 months following the MW 6.4 earthquake that occurred on 29 December 2020, in Petrinja, Croatia. Data include a geological background, seismic sequence information, sinkhole geometric characteristics, rainfall data, and results of detailed geotechnical subsurface investigation. The sinkhole geometrical features were collected using aerial and satellite imagery, terrestrial lidar, and manual measurements. Soil properties and groundwater levels were obtained from four geotechnical boreholes, accompanied by in situ geotechnical characterization and standard penetration tests (SPTs). Soil parameters were obtained from consolidated undrained conventional triaxial compression, oedometer, soil water retention, and index tests performed on 31 soil samples. Clayey cover, 4–10 m thick, with sporadic gravel lenses overlying cavernous, intensely karstified carbonate rocks, characterizes the sinkhole area. Clays are mostly overconsolidated, with varying degrees of saturation ranging from very small to fully saturated. Seasonal and climate-induced variations in the groundwater table interact with artesian/subartesian karst aquifer, thus affecting the suction and the shear strength. Soil water retention curves (SWRCs) indicate that desaturation is possible for deeper groundwater tables, thus further affecting the effective stress, shear strength, and interparticle tensile forces. Finally, the observed vertical walls that accompanied sinkholes opening can occur in the overconsolidated cohesive cover clay layer with varying degree of saturation. The presented data provide essential geomechanical information necessary to understand the associated sinkhole failure mechanism. This article will help future investigators to perform detailed analyses and provide a background for complementing future sinkhole precursor research. Geotechnical, geological, seismic, and precipitation data generally indicate that the formation of cover-collapse sinkholes in the study area is a consequence of a specific local geological setting but is significantly expedited by earthquake-induced dynamic loading and complemented by multiple hydro-mechanical factors.
Keywords
Introduction
The Geotechnical Extreme Events Reconnaissance (GEER) investigation of the Petrinja MW 6.4 earthquake and numerous aftershocks during the next 3 months identified 91 new cover-collapse sinkholes in addition to 45 historical sinkholes, formed before the Petrinja 2020–2021 earthquake sequence (Tomac et al., 2021). Continuous investigation of the study area until the end of 2021 resulted with a total of 122 new and 49 historical cover-collapse sinkholes within 1.13 km2 area, as documented in this article. An earthquake having a moment magnitude of MW 6.4 occurred in the Sisak–Moslavina county in Central Croatia on 29 December 2020, at 12:19 PM local time (11:19 AM UTC; US Geological Survey (USGS), 2020). According to the USGS, the earthquake hypocenter was at 45.422°N 16.255°E, at a depth of 10 km (USGS, 2020), and occurred within the central portion of the shallow Petrinja strike-slip fault in the marginal part of the Internal Dinarides (NE part of the Adria Microplate; Figure 1a and b). Three foreshocks preceded the earthquake for 1 day, the strongest of which had a magnitude of MW 5.2, followed by numerous earthquakes (including 85 aftershocks with a local magnitude ML ≥ 3.1 until 22 February 2021).
(a) Map of Croatia with the earthquake epicentral region; (b) epicenters of earthquakes recorded within first 2 weeks of 2020–2021 Petrinja earthquake sequence (Herak and Herak, 2021, personal communication) and the fault trace (Tomac et al., 2021); and (c) detail of geological map (Šikić, 2014) showing locations of new and historical cover-collapse sinkholes and study area covered by UAV surveys of 31 March 2021 (full black line) and 8 December 2021 (dotted black line).
The appearance of as many as 122 sinkholes during the 2020–2021 Petrinja earthquake sequence is considered a surprising and relatively rare geotechnical earthquake effect, and it deserves a careful geomechanical and geological investigation. The sinkholes collapsed in the vicinity of Mečenčani and Borojevići villages between Petrinja and Hrvatska Kostajnica, about 20 km SE from the epicenter (Figure 1b and c). Observed sinkholes can be classified as cover-collapse sinkholes (also known as cover-collapse doline or dropout sinkholes—see Gutiérrez et al., 2014; Parise, 2019; Waltham et al., 2005; Williams, 2004 and references therein). The area with cover-collapse sinkholes is characterized by a 4- to 10-m-thick variably saturated clayey soil overlying karstified Middle Miocene carbonates. Two distinct aquifers, which can act as isolated from each other but may interact during certain seasons, characterize the hydrogeological setting of the area. The sinkhole diameters vary from less than 1 m up to 25 m, with a depth ranging from 0.2 m to more than 11 m. Cover-collapse sinkholes occurred in the area in the past, although they were considered relatively rare events: along with 122 new sinkholes, 49 historical sinkholes collapsed before the Petrinja 2020 earthquake. A qualitative review of historical publicly available aerial and satellite imagery of the terrain, interviews with local people, and our field research confirms that described new sinkholes are not reactivated pre-existing features.
A short literature overview points to the worldwide occurrence of post-seismic sinkholes (Caramanna et al., 2008; Chiaro et al., 2015; Del Prete et al., 2010a, 2010b, 2010c; Gutiérrez et al., 2014; Kawashima et al., 2010; Parise et al., 2010; Porfido et al., 2002; Santo et al., 2011, 2019; Santo and Tuccimei, 1997), and justifies the importance of publishing detailed data sets on geologic, geomechanic, seismic, geophysic, and precipitation information. The recorded earthquake-triggered sinkhole collapses are often temporally and spatially sparse (Memarian and Mahdavifar, 2012). Sinkholes can be related to subsurface discontinuities, such as coal mines and faults (Esaki et al., 1989; Fiore et al., 2018; Gongyu and Zhou, 1999; Gutiérrez et al., 2014; Singh and Dhar, 1997). Earthquakes can enhance sinkhole occurrences due to different mechanisms: increased pore pressures (Meng et al., 2020), especially in rainy seasons (Del Prete et al., 2010c; Esaki et al., 1989; Fazio et al., 2017; Lollino et al., 2013; Parise, 2015; Singh and Dhar, 1997; Tharp, 1997, 1999; Wildanger et al., 1980), dewatering (Singh and Dhar, 1997), location within discharge zone of the aquifer (Salvati and Sasowsky, 2002), or increase of the horizontal shear stresses in soil over the cavity (Ben-Hassine et al., 1995).
This article documents and quantifies geotechnical, geological, and hydrological conditions that led to sinkhole occurrences during the 2020–2021 Petrinja earthquake sequence. The article combines detailed field and laboratory investigations of soil near the largest and several smaller sinkholes, including hydrological data and geological overview. In addition, this work categorizes distinct cover-collapse sinkhole features observed during reconnaissance based on specific geological settings. Contributions of this investigation are in that it will aid in understanding complex coupled phenomena and precursors that govern cover-collapse sinkhole development associated with the seismic sequence and can be extended toward dynamic loading induced by tunneling, ground vibrations, and excavation.
Cover-collapse sinkholes setting and properties
From the Petrinja MW 6.4 earthquake of 29 December 2020 to March 2021, GEER reconnaissance team registered 91 new cover-collapse sinkholes and 45 historical cover-collapse sinkholes, opened before the Petrinja earthquake (Tomac et al., 2021). As of December 2021, the number of reported new sinkholes increased to 122 and historical sinkholes to 49, all appearing near Mečenčani and Borojevići villages 20 km SE of the epicentral area of the mainshock. Historical sinkholes are scattered, more concentrated only in the central part around Pašino vrelo spring. In contrast, all new sinkholes are within two small areas, 1.13 km2 combined: 74 in the NW area close to the Borojevići village over approximately 0.753 km2 and 48 in the SE area around Mečenčani village over approximately 0.375 km2 (Figure 2). The uniqueness of the sinkhole region is that this is the only region where karstified limestones with several metres thick clayey cover were close to the epicenter. Thus, the sinkhole phenomena did not occur outside of the mapped area.
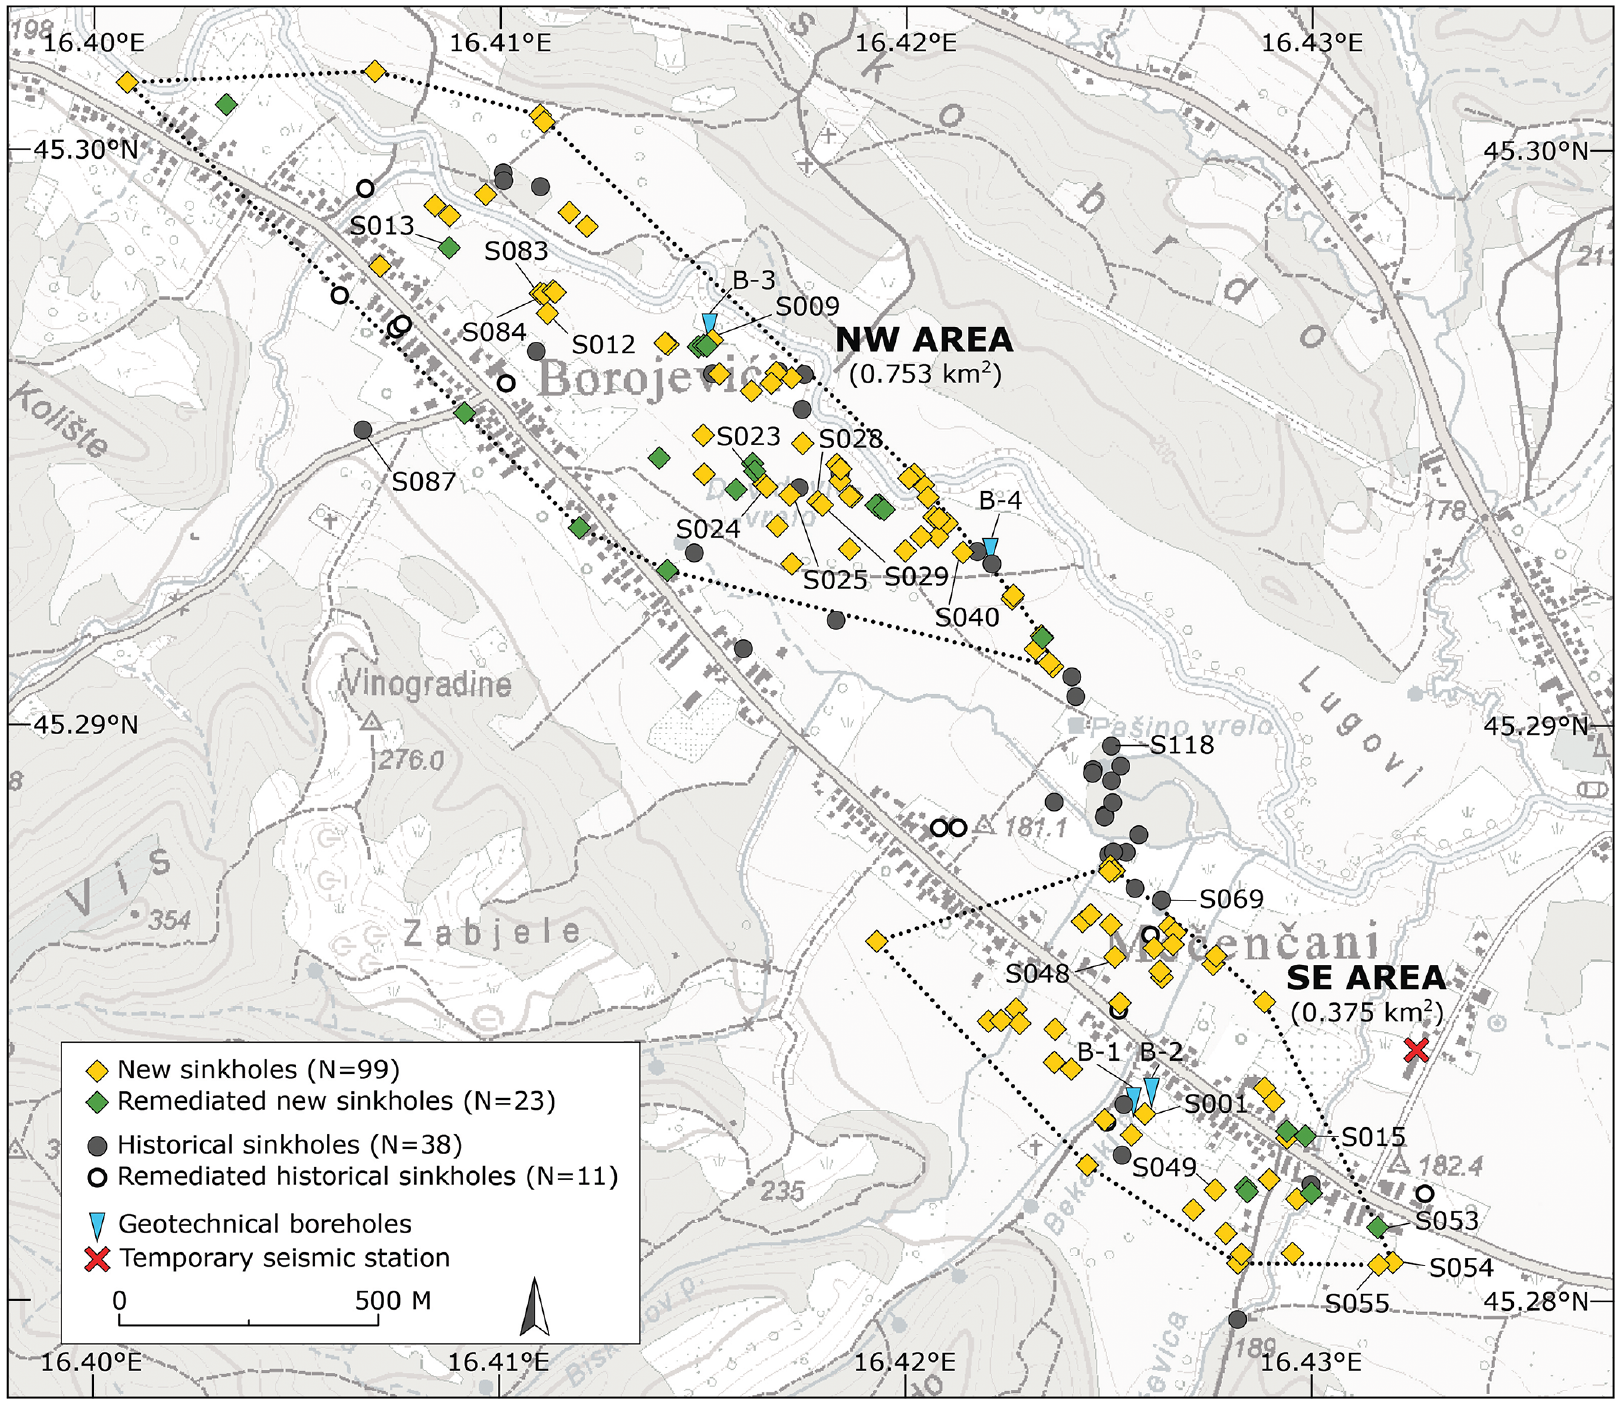
Plan view of new cover-collapse sinkholes (yellow diamonds), remediated new sinkholes (green diamonds), historical cover-collapse sinkholes (black circles), and remediated historical sinkholes (white circles) in the area of Mečenčani and Borojevići, location of geotechnical boreholes B-1 to B-4 and temporary seismic station PN06 installed on 4 January 2021. The entire map is included within the survey area.
It is important to note that according to all available data, none of the new cover-collapse sinkholes opened during the main earthquake or any of stronger foreshocks or aftershocks. According to the interview with property owners who later evacuated, the gradual opening of the first documented collapse sinkhole S015 started on the afternoon of 29 December, some 6 h after the main shock. The largest sinkhole S001 was first observed on 5 January 2021, a week after the main earthquake and 1 day before the strongest aftershock. According to all the data available from different sources such as interviews, media, field observations, and aerial and satellite imagery, cover-collapse sinkholes opened due to the 2020–2021 Petrinja earthquake sequence may be considered as post-seismic features.
Geological and hydrological setting
The specific geology of the area prone to sinkhole collapsing is a combination of highly karstified limestones directly covered by relatively thick clayey soil. Middle Miocene carbonates (Badenian, M4 in Figure 1c) are composed of alternating highly porous Lithothamnion limestones and calcarenites, both very susceptible to karstification, as visible in the hills SW of the studied area (Šikić, 2014). Karstified carbonates are directly overlain by a 4- to 15-m-thick sequence of Holocene deluvial–proluvial deposits (weathered material transported from neighboring hills by occasional torrents; dpr in Figure 1c) composed predominantly of clays with interlayers and lenses of gravel and sand in lateral and vertical alternations (Tomac et al., 2021). In other areas, where karstified Middle Miocene carbonates are conformably overlain by impermeable Middle Miocene marls, or where Holocene deluvial–proluvial deposits cover any other lithological unit, there are no recorded historical or post-seismic cover-collapse sinkholes. There are relatively few outcrops of karstic rocks in the area (out of a total of 1079 km2 area of the Bosanski Novi sheet of the Basic Geological Map (Šikić, 2014), only a bit more than 60 km2 is covered by Middle Miocene Lithothamnion limestones, that is, only between 5% and 6% of the area), and the outcrops are mostly covered by dense vegetation. However, during our field reconnaissance work in the direct hinterland of the study area, we found several typical funnel-shaped dissolution sinkholes, indicating typical karstification processes. There is only one cave documented in a Croatian Speleological Cadastre within Middle Miocene Lithothamnion limestones close to the study area: 4 km north of Borojevići and Mečenčani a 436-m-long and 11-m-deep “Cave in Graduša” (Mesec et al., 2018).
The Sunja river valley in the studied area represents a flat terrain covered with Holocene deluvial–proluvial deposits of low permeability containing a certain amount of water and therefore forming an aquitard. Most households in Mečenčani and Borojevići still use water from shallow dug wells, with an average depth of about 8 m. The fluctuation of groundwater level in the aquitard between dry and wet periods is about 2 m. The aquitard is underlain by a permeable confined karst aquifer, in which the water pressure during wet periods becomes subartesian to artesian (Tomac et al., 2021). According to Larva et al. (2010), the groundwater-level fluctuation in the karst aquifer is slightly smaller than in the aquitard, except near the Pašino vrelo pumping station, where levels are strongly influenced by the well operation regime, that is, the pumping rate (38 l/s on average). Continuous removal of sediment gradually eroded in the subsurface by groundwater flow through heavily karstified systems in underlying carbonates created and gradually expanded cavernous spaces above the limestone/clay contact.
Underlying karst aquifer and overlying low-permeability aquitard are hydraulically connected, and pressure changes in one layer cause changes in hydraulic conditions within the other. The karst aquifer is almost exclusively recharged through precipitation on the nearby hills, SW of the study area, where the Middle Miocene carbonate unit crops out (Badenian, M4 in Figure 1c). Discharge of the karst aquifer takes place in the Pašino vrelo spring, a historical cover-collapse sinkhole, which at its bottom is directly connected with the underlying karst aquifer (Larva et al., 2010). Close to the Pašino vrelo spring, several other springs representing historical sinkholes also act as discharge points. During periods of high waters, especially when the pressure rapidly rises in the karst aquifer, the piezometric level in the karst aquifer is higher than the groundwater level in the overlying aquitard, while during dry periods, the groundwater levels in both layers are equalized.
To assess the hydrological conditions in Mečenčani and Borojevići area, the time series of stage data on the Sava River from 1949–2019 were analyzed (Figure 3a). The gauging station is located approximately 17 km to the north of the investigated area. The high values of stage in Sava River appeared due to heavy rainfall in the second half of December (Figure 3b). Analysis of the stage data on the Sava River shows that the earthquake occurred during high waters, and at a time of rapidly increasing water levels (Figure 3a), the water level in the aquitard was very close to the surface, and in the underlying karst aquifer, artesian conditions prevailed (Tomac et al., 2021). In Figure 3c, blue lines represent maximum precipitation and red lines minimum precipitation in the 2000–2020 period. However, the monthly value of precipitation in December 2020 does not deviate from the average precipitation in December recorded in the 2000–2020 period (Figure 3c).
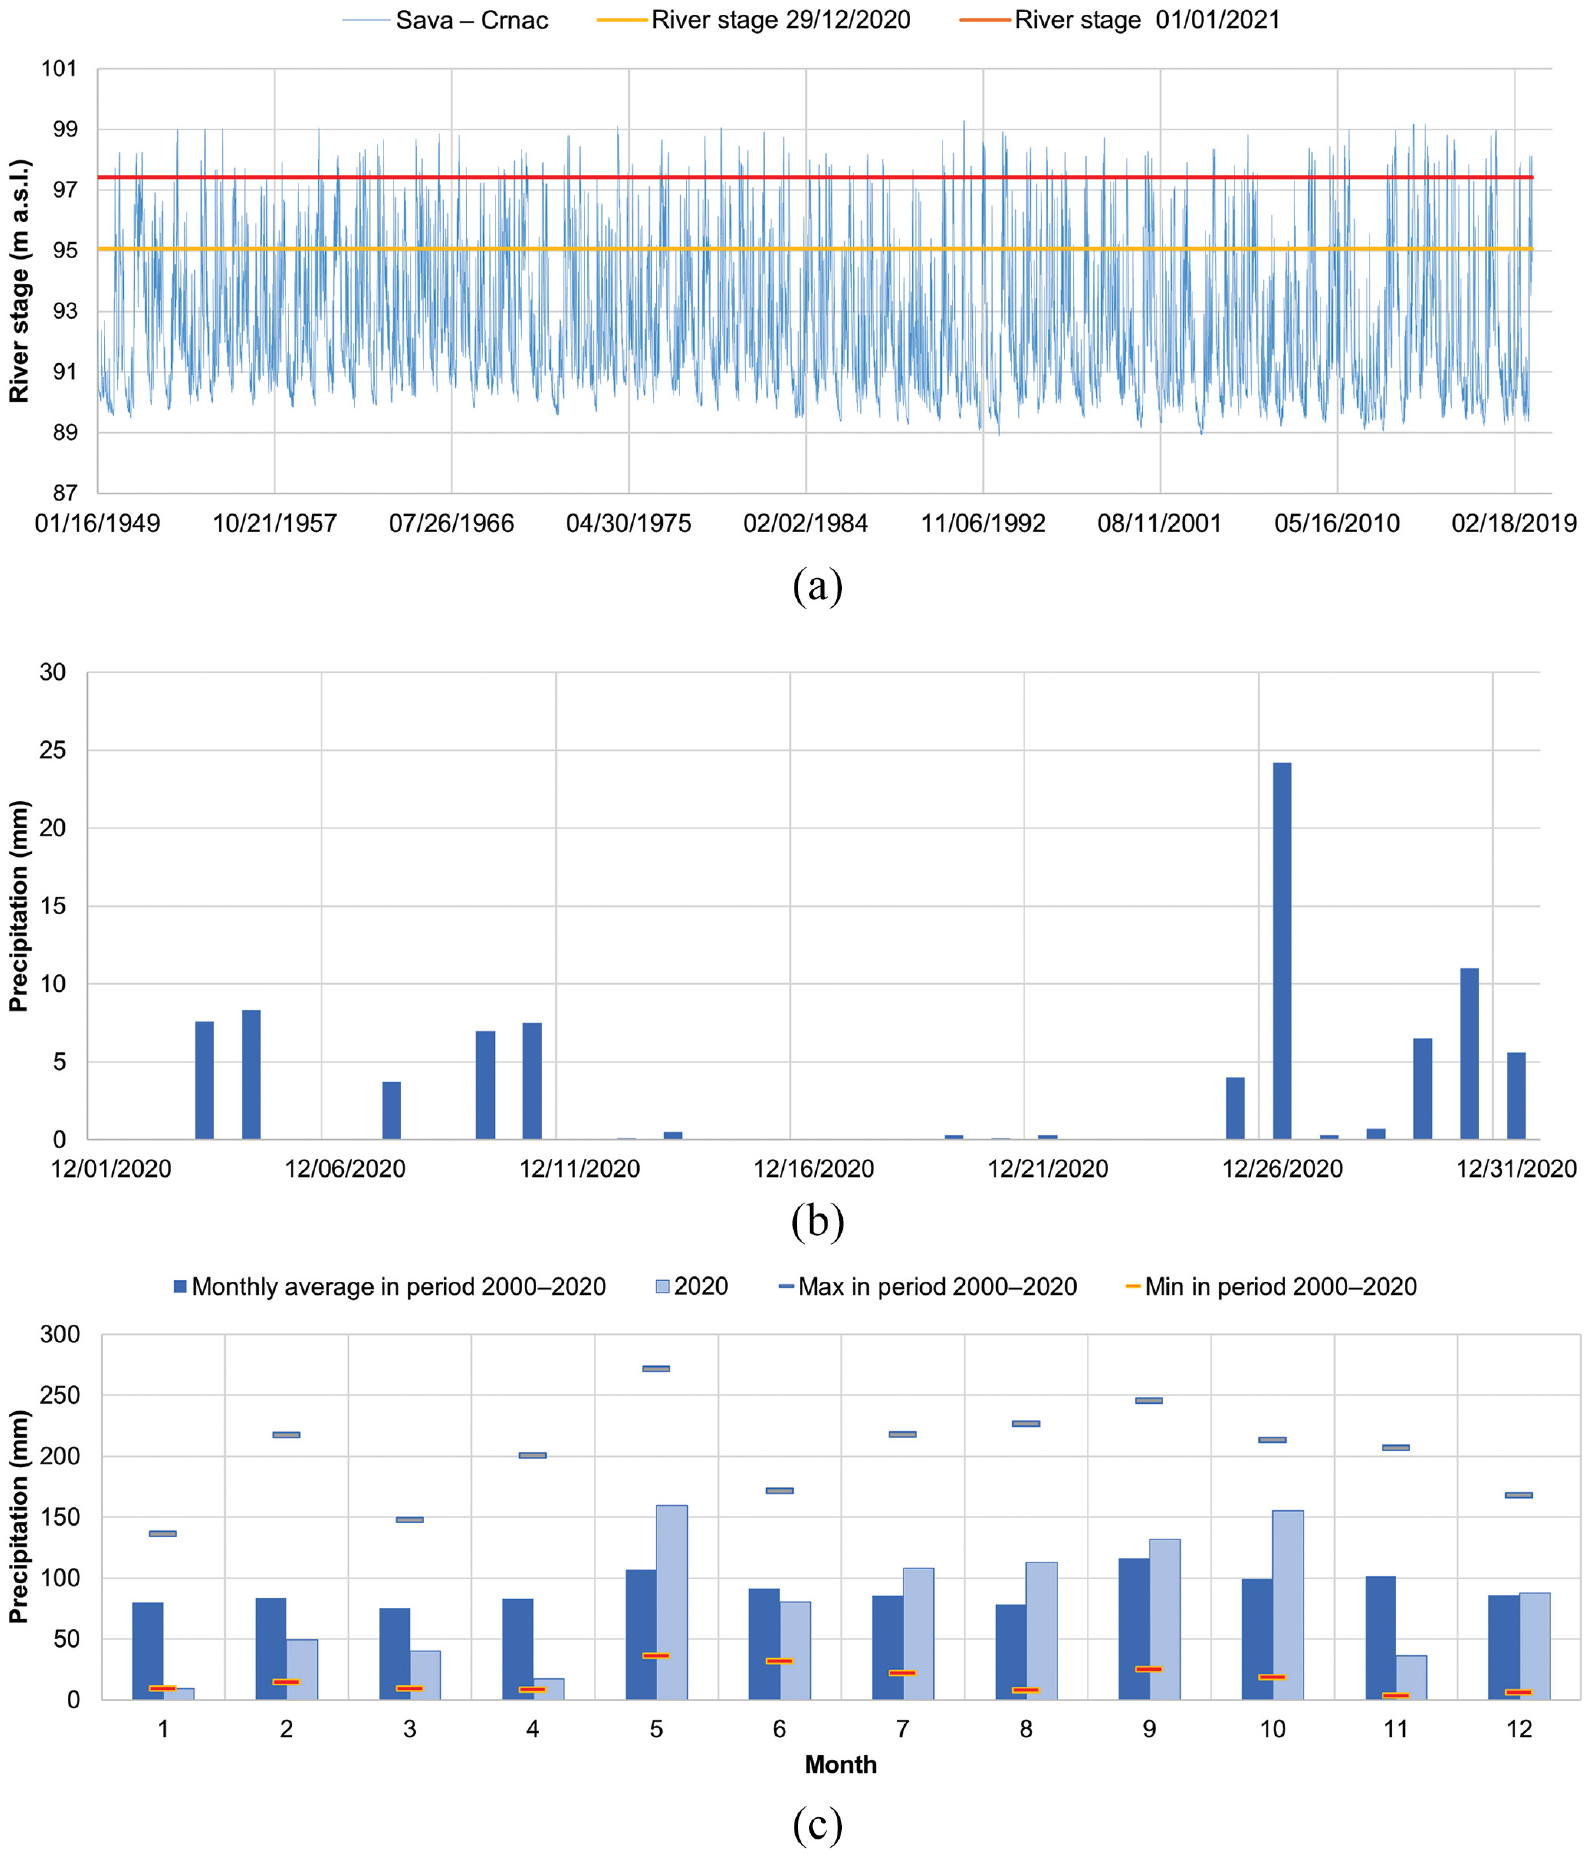
(a) Sava river stages during the 1949–2019 period at the gauging station in Crnac with stages on 29 December 2020 (yellow line) and 1 January 2021 (red line), (b) daily precipitation at the Mečenčani rainfall station during December 2020, and (c) average, maximum, and minimum precipitation per month in 2000–2020 period in Mečenčani.
Seismic sequence
The Petrinja earthquake sequence started with two strong foreshocks on 28 December 2020, with the first occurring at 05:28 UTC with ML 5.1 (MW 5.2; Figure 4b) and the second one at 6:49 UTC with ML 4.7. This was followed by the mainshock a day later (29 December 2020, 11:19 AM UTC, MW 6.4, ML 6.2; Figure 4a). The earthquake caused widespread damage in Petrinja and the surrounding villages, and seven people lost their lives. According to the Croatian Seismological Survey data, the epicentral intensity was estimated to be VIII–IX EMS.
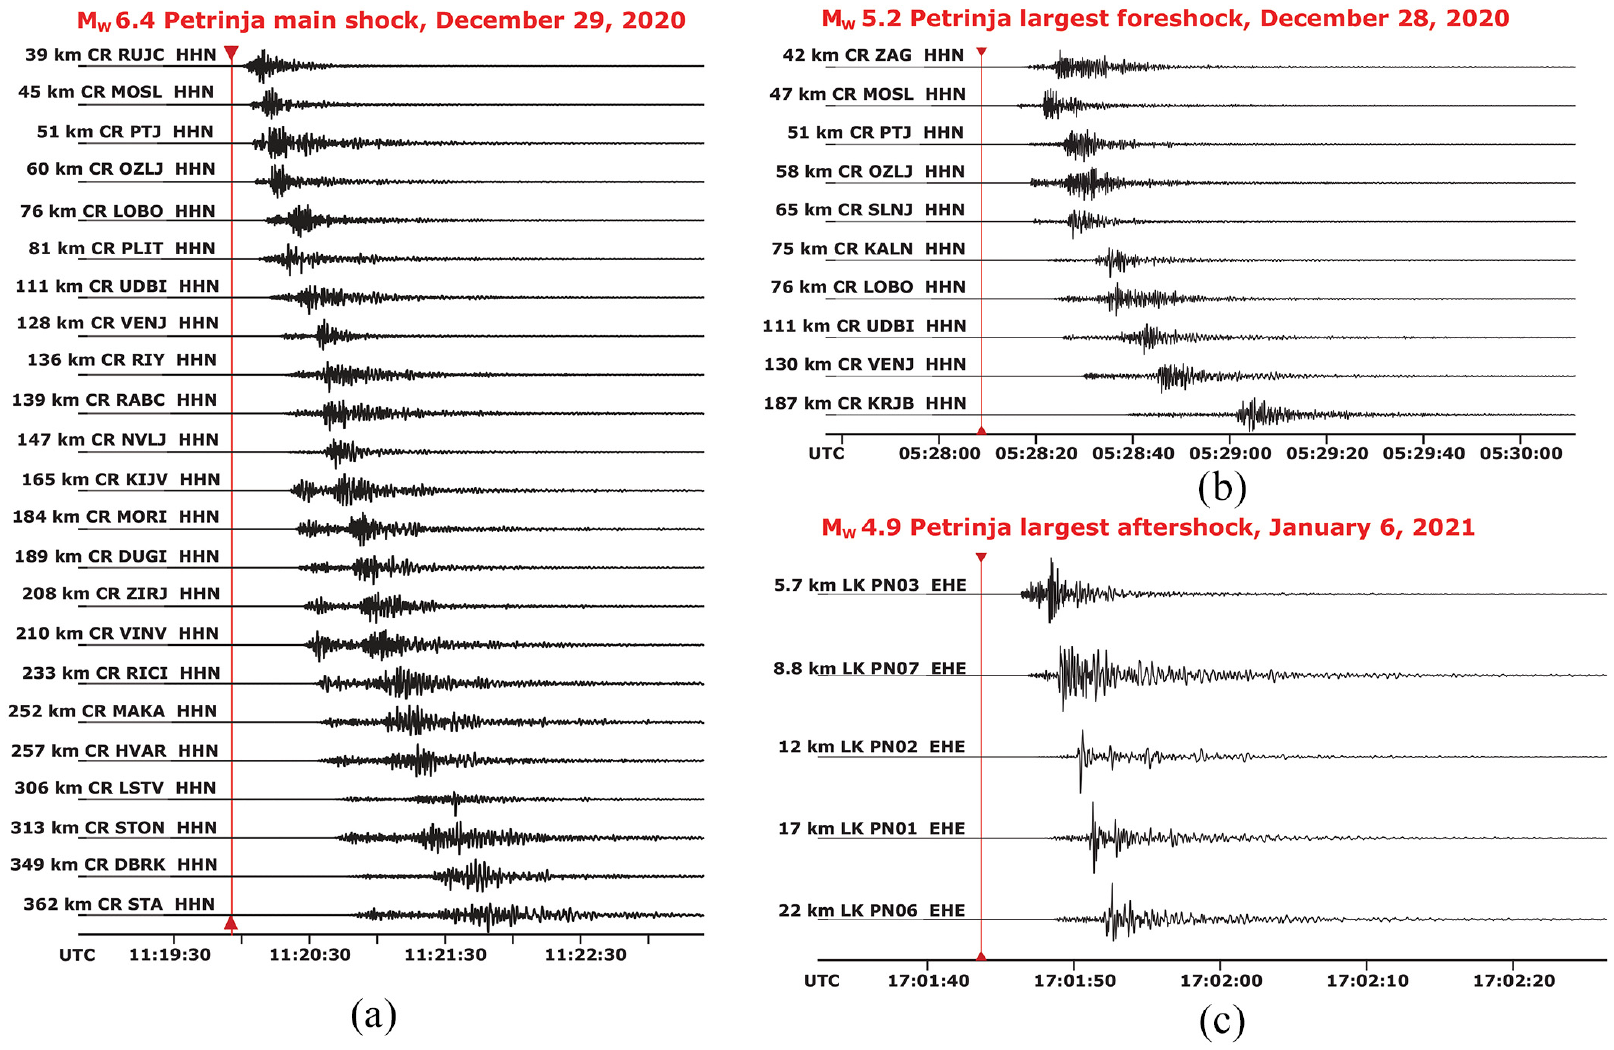
Petrinja earthquake seismograms showing (a) main shock and (b) largest foreshock recorded on permanent seismic stations, and (c) aftershock recorded on temporary stations installed on 5 January 2021 (temporary seismic station LK PN06 was in Mečenčani, for location, see Figure 2).
At the onset of the Petrinja sequence, the closest seismic station was located more than 30 km away from the epicentral area. After 4 January 2021, additional six stations were installed in the epicentral area. Still, about 25% of all recorded events of the first week were located using only data from the permanent seismic networks resulting in relatively poor detection of smaller earthquakes and significant location uncertainties, especially for the focal depth. Nevertheless, in the first 60 days of the sequence, 4430 events were located within 50 km from the mainshock. The catalog for the earliest sequence, up to 4 January 2021, is complete only up to about ML 2.0. The magnitude distribution shows a high concentration of low magnitude events, with only the strongest foreshock in the ML 5.0–6.0 range, as well as four aftershocks and one foreshock in the ML 4.5–5.0 range (Figure 1b). Figure 4 shows the seismograms of the main event together with the largest foreshock and aftershock. For the largest aftershock (Figure 4c), five seismograms from the small temporary network that were installed several days after the mainshock are shown, and the closest station was located 5.7 km from the epicenter with the maximum recorded acceleration of 0.177g. Temporary seismic station PN06 was located in the village of Mečenčani (red cross in Figure 2), but no detectable signal during the opening of any cover-collapse sinkhole or widening of the largest sinkhole S001 (from 3 m in diameter when observed for the first time by landowners couple of hours before the station installation to 25 m in December 2021) was recorded.
The bulk of the Petrinja sequence epicenters are elongated in the NW–SE direction across roughly 20 km in length and 2–4 km in width (Figure 1b), within the Hrastovica Hill between the Kupa and Petrinjčica rivers. The main cluster is slightly asymmetric, with aftershocks protruding to the SW, especially in the central zone. A distinct NW–SE oriented sub-cluster of events in the length of about 9 km, separated from the main Hrastovica Hill cluster, is observed to the NE between Petrinja and Sisak. The mainshock is positioned in the central cluster part and has a hypocentral depth of about 8 km. The strongest foreshock of 28 December 2020 (ML 5.1) occurred within the main cluster, about 2 km easterly from the mainshock.
Most aftershocks in the main cluster are distributed between 13 and 17 km depth. Maximum depths below 25 km are observed only in the central cluster part, while the first 5 km of the crust hosted a small number of events through the entire cluster. Within the main cluster, the event distribution delineates a subvertical fault containing the mainshock.
Historical and new cover-collapse sinkhole occurrence
Initial information on new sinkhole collapses was provided by local people and by Croatian Mountain Rescue Service and the Ministry of Internal Affairs of the Republic of Croatia. The GEER team used aerial data from four detailed UAV surveys of 3.27 to 4.43 km2 area around Mečenčani and Borojevići (from 19 January to 31 March 2021; Figure 1c), which are for purpose of this article supplemented by the study of two Google Earth images (26 May and 19 August 2021) and detailed UAV survey of a wider, 9.44 km2 area of 8 December 2021, provided by the State Geodetic Administration of the Republic of Croatia (Figure 1c). Each potential location was visited in the field by team members between 5 January 2021 and 13 January 2022, and each sinkhole found was located by iPad and hand-held GPS device (all positions were subsequently slightly corrected to the center of each sinkhole based on the high-resolution digital orthophoto images), measured, described, and photographed. In addition, all the 49 potential locations determined outside of the area covered by previous surveys on the high-resolution digital orthophoto map of a wider area based on UAV survey of 8 December 2021 (Figure 1c) were checked, but no historical or new cover-collapse sinkholes were found. The GEER team used terrestrial LiDAR Leica RTC360 to scan 56 sinkholes in the period between 15 and 26 March 2021. Each sinkhole was scanned from two to four sides, and sites with 2 nearby sinkholes were scanned with four to six scans. The largest sinkhole S001 was scanned as a bundle with 13 setups and 35 links. Data processing included cross-section, depth, and volume measurements from point clouds, and processed data and point clouds are placed in the DesignSafe repository. DesignSafe repository includes a data sheet comprising basic information on each documented sinkhole—its ID, date of acquisition, geographic coordinates, largest diameter, depth, whether it is new or historical, dry or filled by water and whether it was remediated or not until February 2022. In this article, the term “historical cover-collapse sinkholes” is used for sinkholes recorded in the study area which were formed before the Petrinja 2020–2021 earthquake sequence, and “new cover-collapse sinkholes” for those collapsed after 29 December 2020 earthquake. Historical sinkholes are generally morphologically like new ones, including common steep to subvertical walls. Nevertheless, in addition to the fact that some larger ones were already located on older maps and their existence confirmed by local people, three significant characteristics enabled the recognition of historical sinkholes: (1) lack of freshly opened collapsed margins and irregular cover of fresh soil and grass at their bottoms; (2) growth of common old trees with bushes, sometimes including old trash found at sinkholes bottoms; (3) in the case of sinkholes filled with water, historical sinkholes are characterized by often abundant freshwater macrophytic vegetation, while newly formed sinkholes have no freshwater plants.
The GEER team identified 49 pre-existing, historical sinkholes (Tomac et al., 2021), marked in Figure 2 as circles (gray circles for not remediated and white ones for remediated historical sinkholes). Historical cover-collapse sinkholes vary widely in diameter—from 1 to 22.6 m, and depth—from completely filled up to more than 4 m deep and are dry or contain still water. Most have vegetation already growing from the bottom, while a few are filled up by soil or hold trash, old building material, and cans. Figure 2 shows that historic sinkholes scatter across the area but are most frequent in its central part, between NW and SE areas with common post-seismic sinkholes. Times of occurrence of the historical sinkhole collapse are mainly unknown.
One local farmer (J. P., 53) filled up 3 smaller sinkholes opened in his land during the last 25 years and a total of 11 historical sinkholes were filled up before December 2021 earthquake. It should be noted that none of the historical sinkholes reactivated during the studied earthquake series, except for subtle subsidence recorded in 5 of remediated ones (between 5 and 30 cm). Eight out of 10 largest sinkholes found in the area are historical ones, having the largest diameter between 10 and 22.6 m.
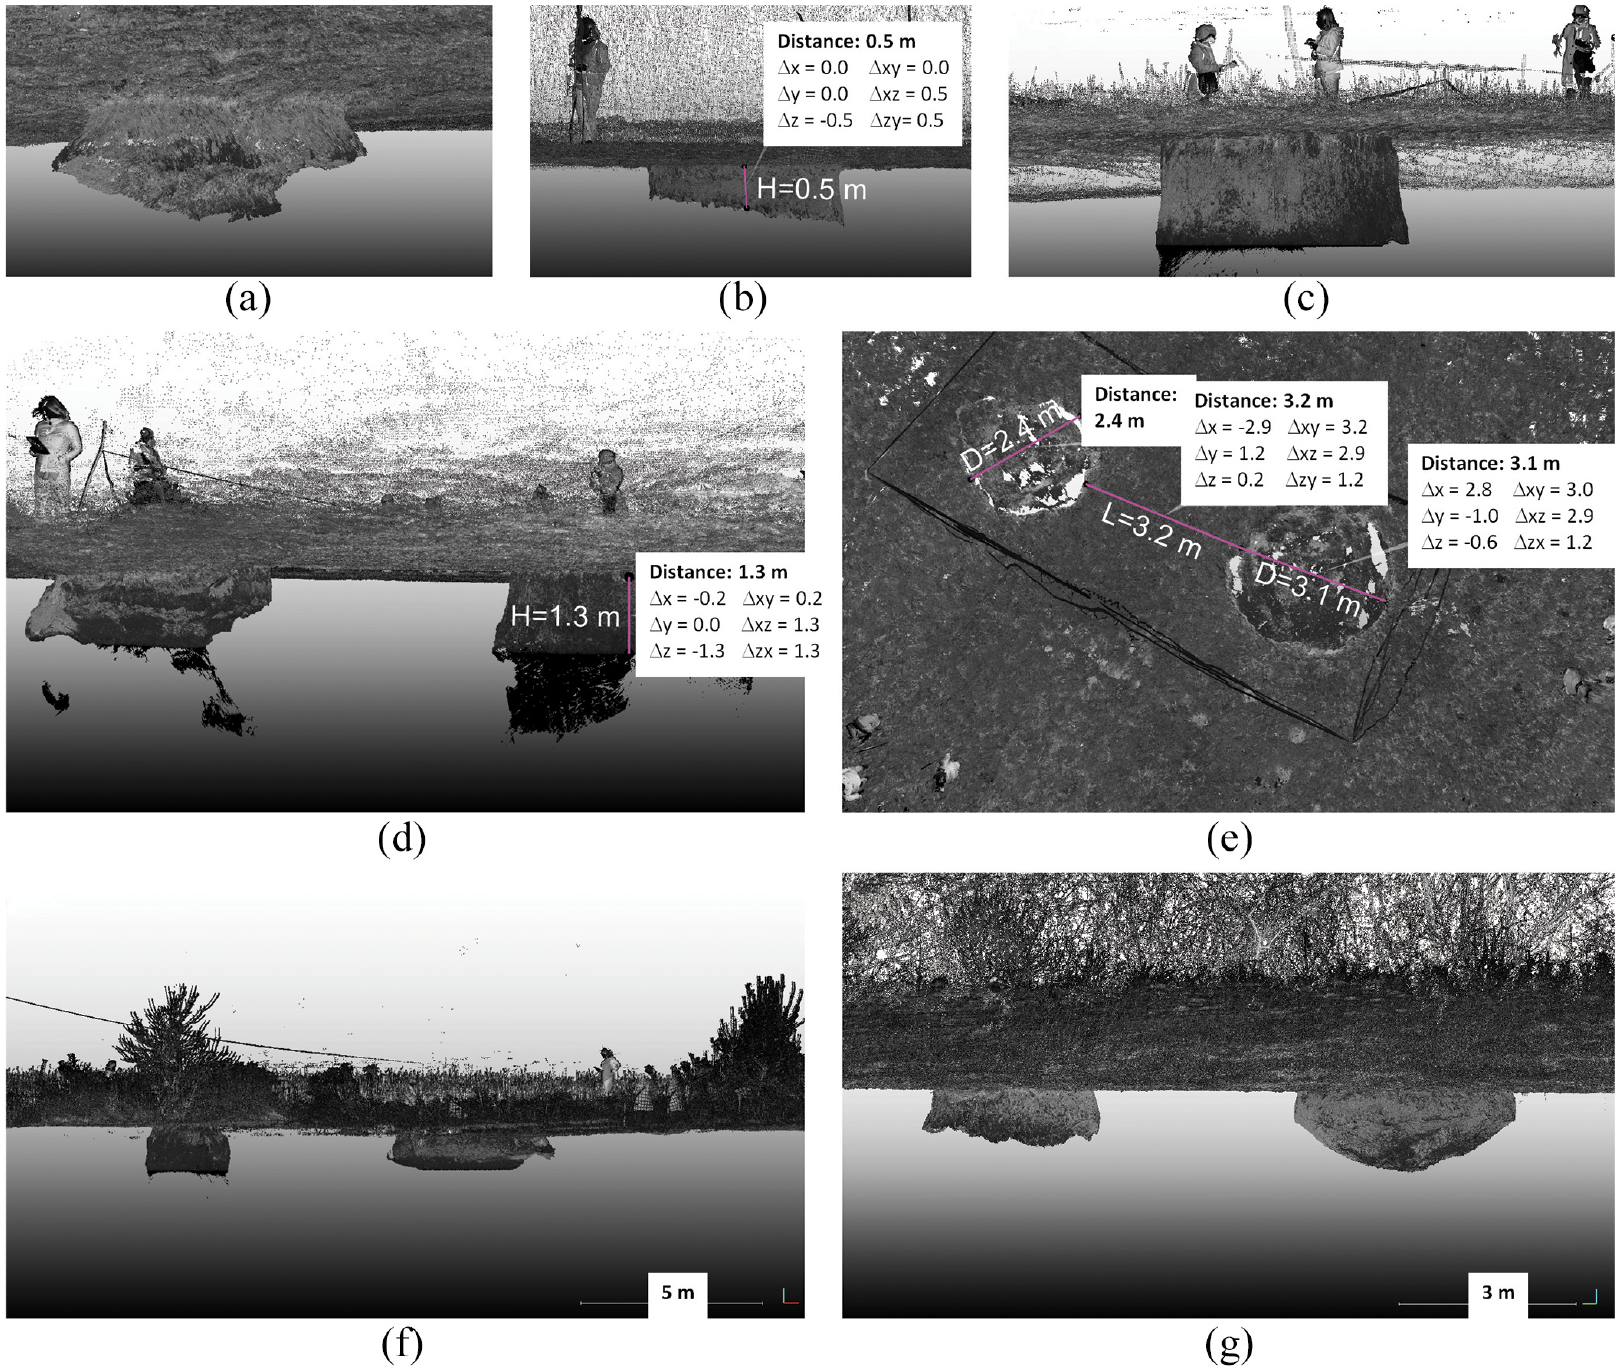
A few larger historical sinkholes appear as small ponds in the area. For example, the S118 sinkhole with a diameter of 22.6 m is located within the protected area of potable water wells Pašino vrelo (Figure 2). A 25,000 m2 area around Pašino vrelo groups 10 historical sinkholes, with diameters ranging from 1 to 22.6 m, most filled with water. Figure 5 shows examples of historical sinkholes that were positioned in Figure 2.
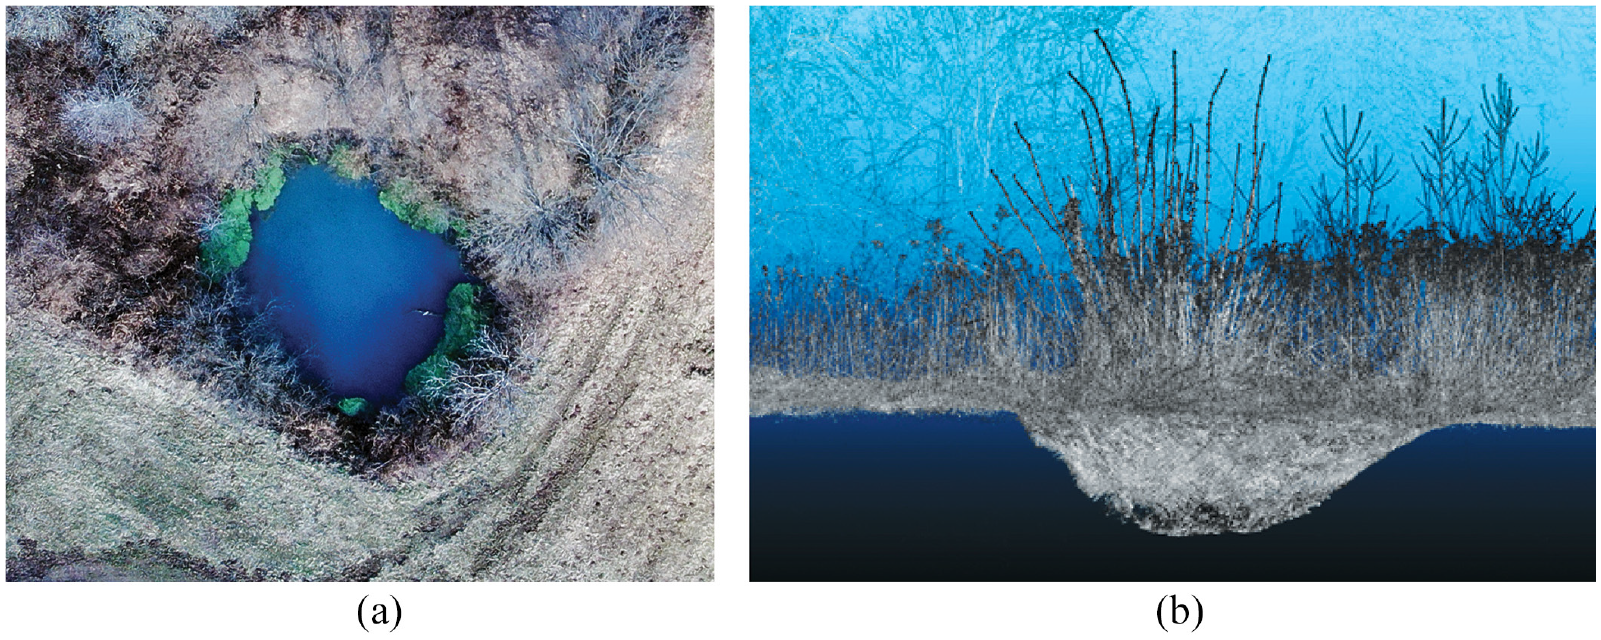
Examples of historical cover-collapse sinkholes, for location, see Figure 2. (a) Top view photogrammetry of sinkhole S069 (19.9 m in diameter), filled with fresh water, and (b) lidar scan of 1.5 m deep dry sinkhole S087 (5.0 m in diameter) with bushes growing out of it and filled with trash.
In the SE part of the studied area (Figure 2) among 48 new sinkholes most of largest and deepest opened (red symbols in Figure 6), including the largest S001 (Figure 7), S048 and S049 (Figure 8). Their collapses occurred at different times, and most sinkholes opened in predominantly clayey soil, with lenses of clayey gravel, except for S015 that is mostly in gravel. The largest sinkhole, S001, is characterized by steep walls in brown clay, with sparse 30–60 cm thick lenses of gravel. The sinkhole is nearly circular, with a depth of 11.7 m and diameter of 24.5 m as measured in March 2021 (diameter increased slightly to 25 m by December 2021). Landowners noticed the first subtle subsidence of the area on the afternoon of 4 January, which was a week after the main earthquake of 29 December 2021 (MW 6.4). S001 collapsed between the afternoon of 4 January 2021, and 1:00 PM local time on 5 January, a week after the main MW 6.4 earthquake of 29 December 2020 and more than 24 hours before the strongest MW 4.9 aftershock that took place at 6:01 PM local time on 6 January. When it was first observed, the sinkhole was about 3 m in diameter and then gradually widened to 15 m in diameter 24 hours later due to failed walls, which remained subvertical. Figure 8 shows 2 other relatively large sinkholes (S048 and S049), in Mečenčani with a diameter of about 7 to 8 m each. S048 walls are not vertical as measured above the water level, unlike most sinkholes in the area. Its walls overhang and indicate an inclined tubular collapse of the cover with a nearly constant diameter.
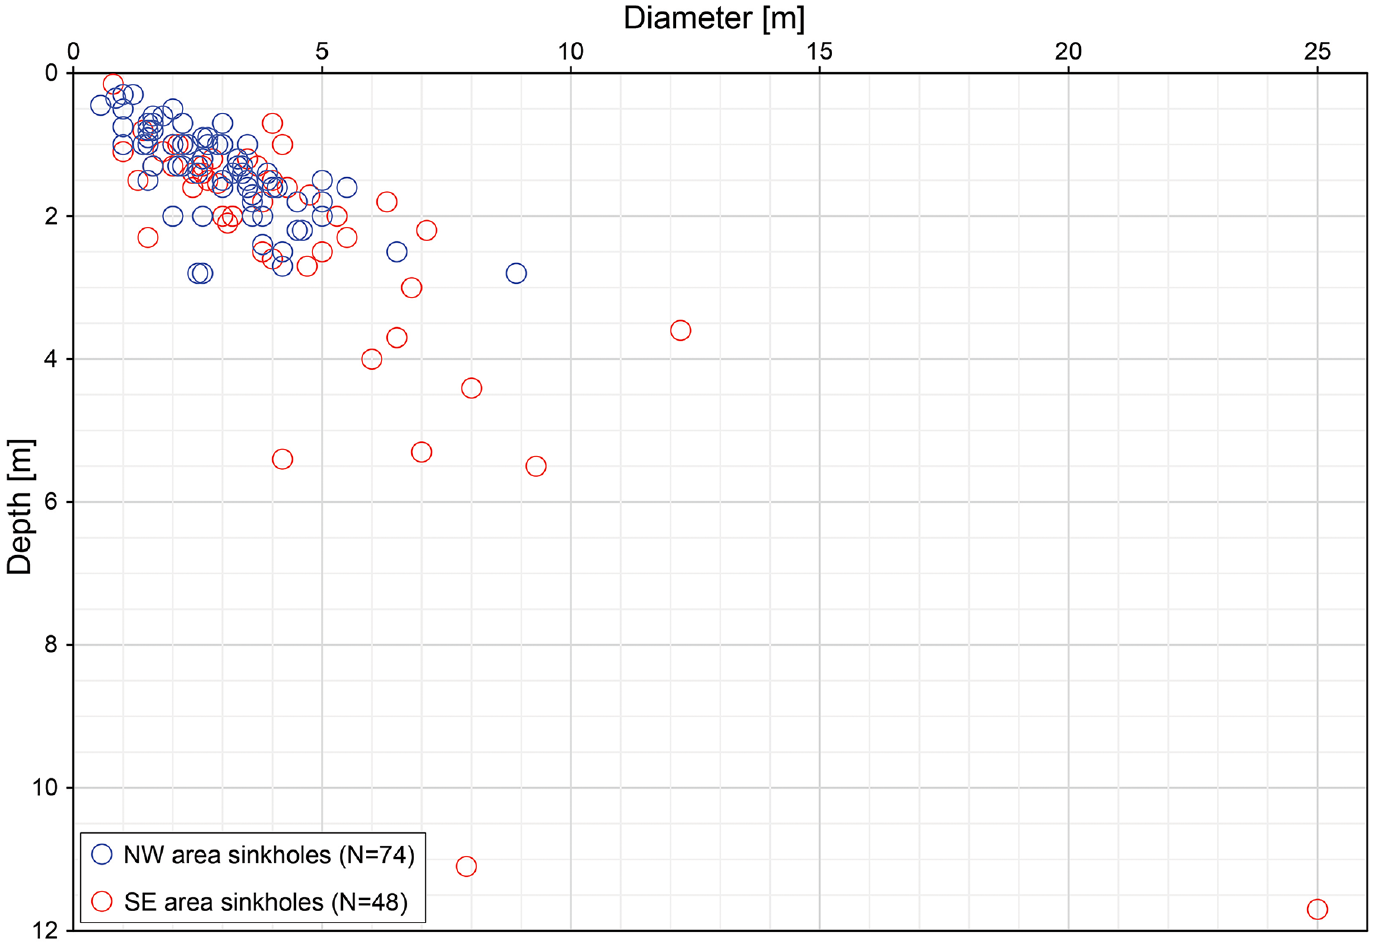
The largest diameter and depth of new cover-collapse sinkholes opened after 29 December 2020, Petrinja earthquake in the NW area around Borojevići (blue circles) and SE area around Mečenčani (red circles), for location, see Figure 2.
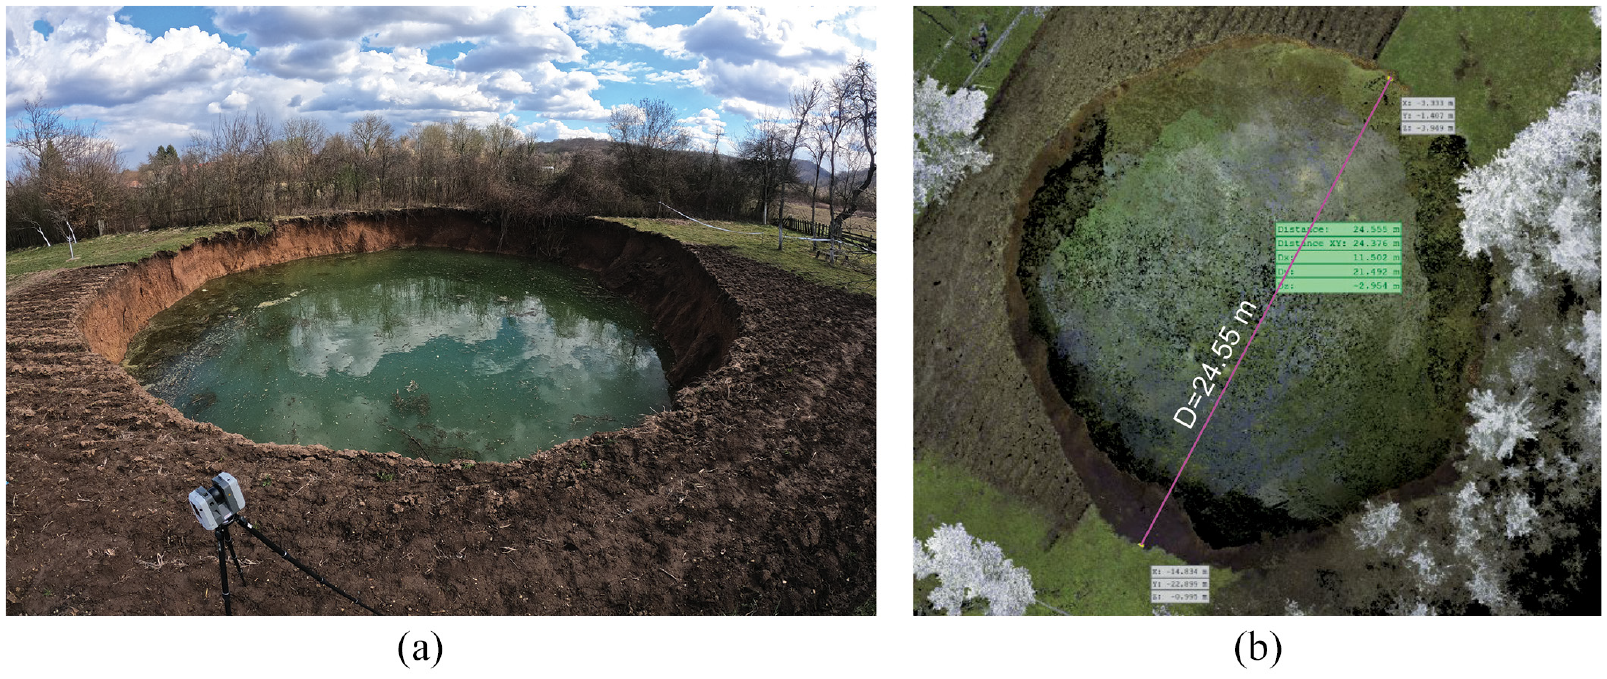
The largest sinkhole S001 in Mečenčani village, for location see Figure 2, (a) photograph by Ivica Pavičić and (b) lidar scan.
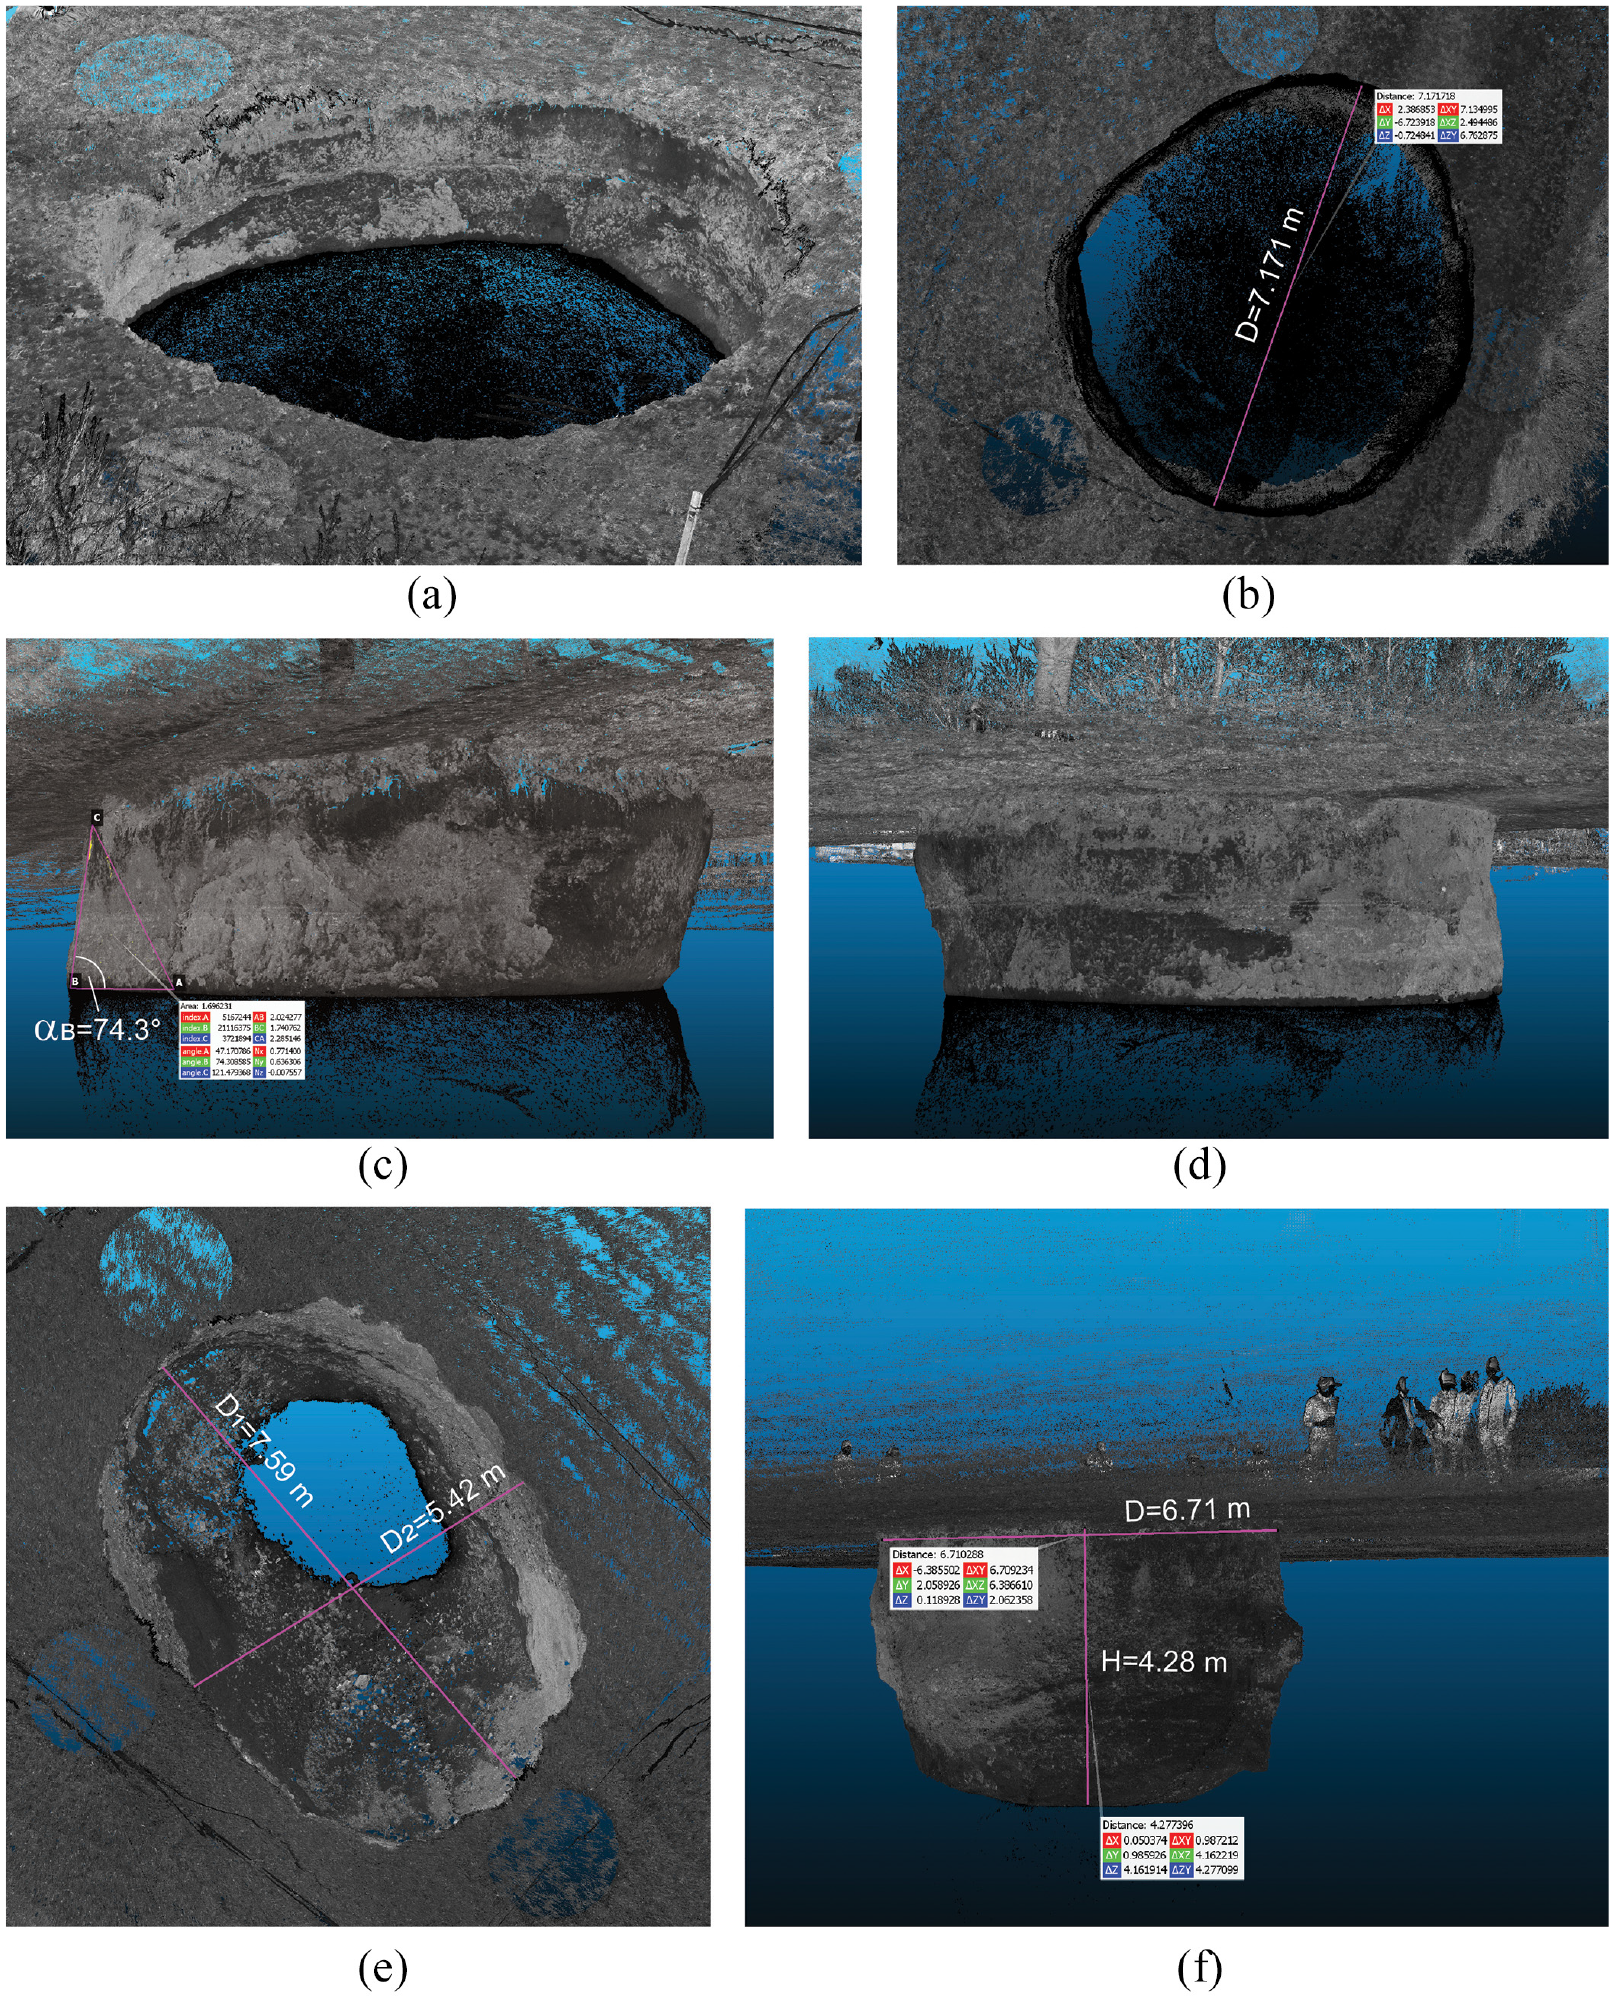
Examples of point cloud imagery of large sinkholes S048 ((a) to (d); 7.2 m in diameter) and S049 ((e) and (f); 7.6 m in diameter in March 2021, 8 m in December 2021; 4.28 m to water, total depth 5.6 m) in SE part of the study area in Mečenčani village, for location, see Figure 2.
Smaller sinkholes, like the ones illustrated in Figure 9, dry or filled with standing water, are most common among 74 new cover-collapse sinkholes located in the NW part of the study area (Figure 2; blue symbols in Figure 6). Diameters of sinkholes in the NW part of the area vary between 0.55 m to 8.9 m, with depths between 0.3 m and 2.8 m. Figure 9 shows point cloud imagery of smaller sinkholes positioned more closely to each other than larger sinkholes from the first group. Sinkholes S012 and S013 have similar small diameters and are filled with collapsed soil and no water. While walls of S013 are nearly vertical through uniform clay, the walls of S012 show significant overhang in clayey gravel. S025 is another example of a smaller, nearly cylindrical sinkhole in clayey and fine-grained soil filled with water. Examples of double sinkholes, collapsed in close proximity, are shown in Figure 8 for the S023 and S024, S028 and S029, as well as S083 and S084 pairs.
Examples of point cloud imagery of smaller sinkholes in NW part of the study area, NE of Borojevići village (for location, see Figure 2): (a) S012 (2.2 m in diameter), (b) S013 (2.6 m in diameter), (c) S025 (3.8 m in diameter), (d) S003 (left, largest diameter 2.9 m) and S002 (right, 3.1 m in diameter), (e) S023 (2.4 m in diameter) and S024 (3.1 m in diameter), (f) S029 (left, 2.2 m in diameter) and S028 (right, 3.9 m in diameter), and (g) S083 (left, 2.7 in diameter) and S084 (right, 3.9 m in diameter).
While most of the sinkholes opened within the agricultural land, some sinkholes are closely related to infrastructure damage (Figure 10). Large cover-collapse sinkhole S015 collapsed between two houses on 29 December 2021 following the main shock earlier the same day. The tenant of the house next to which the S015 collapsed noted 2 smaller sinkholes, each approximately 1 m in diameter and 1 m deep, opened 6 h after the main earthquake, and subsequently combined into a large sinkhole, 7 m in diameter, within the next 12 h. S015 is the only documented case of sinkhole coalescence phenomenon in the study area, which commonly occur in karst (Delle Rose and Parise, 2002; Margiotta et al., 2021). After approximately 2 weeks, the sinkhole reached its final shape and dimensions (diameter of 12.3 m, 3.6 m depth) that were retained for the following 10 months. S015 was the largest among several sinkholes remediated by filling with gravel, geosynthetics, and soil in November 2021.
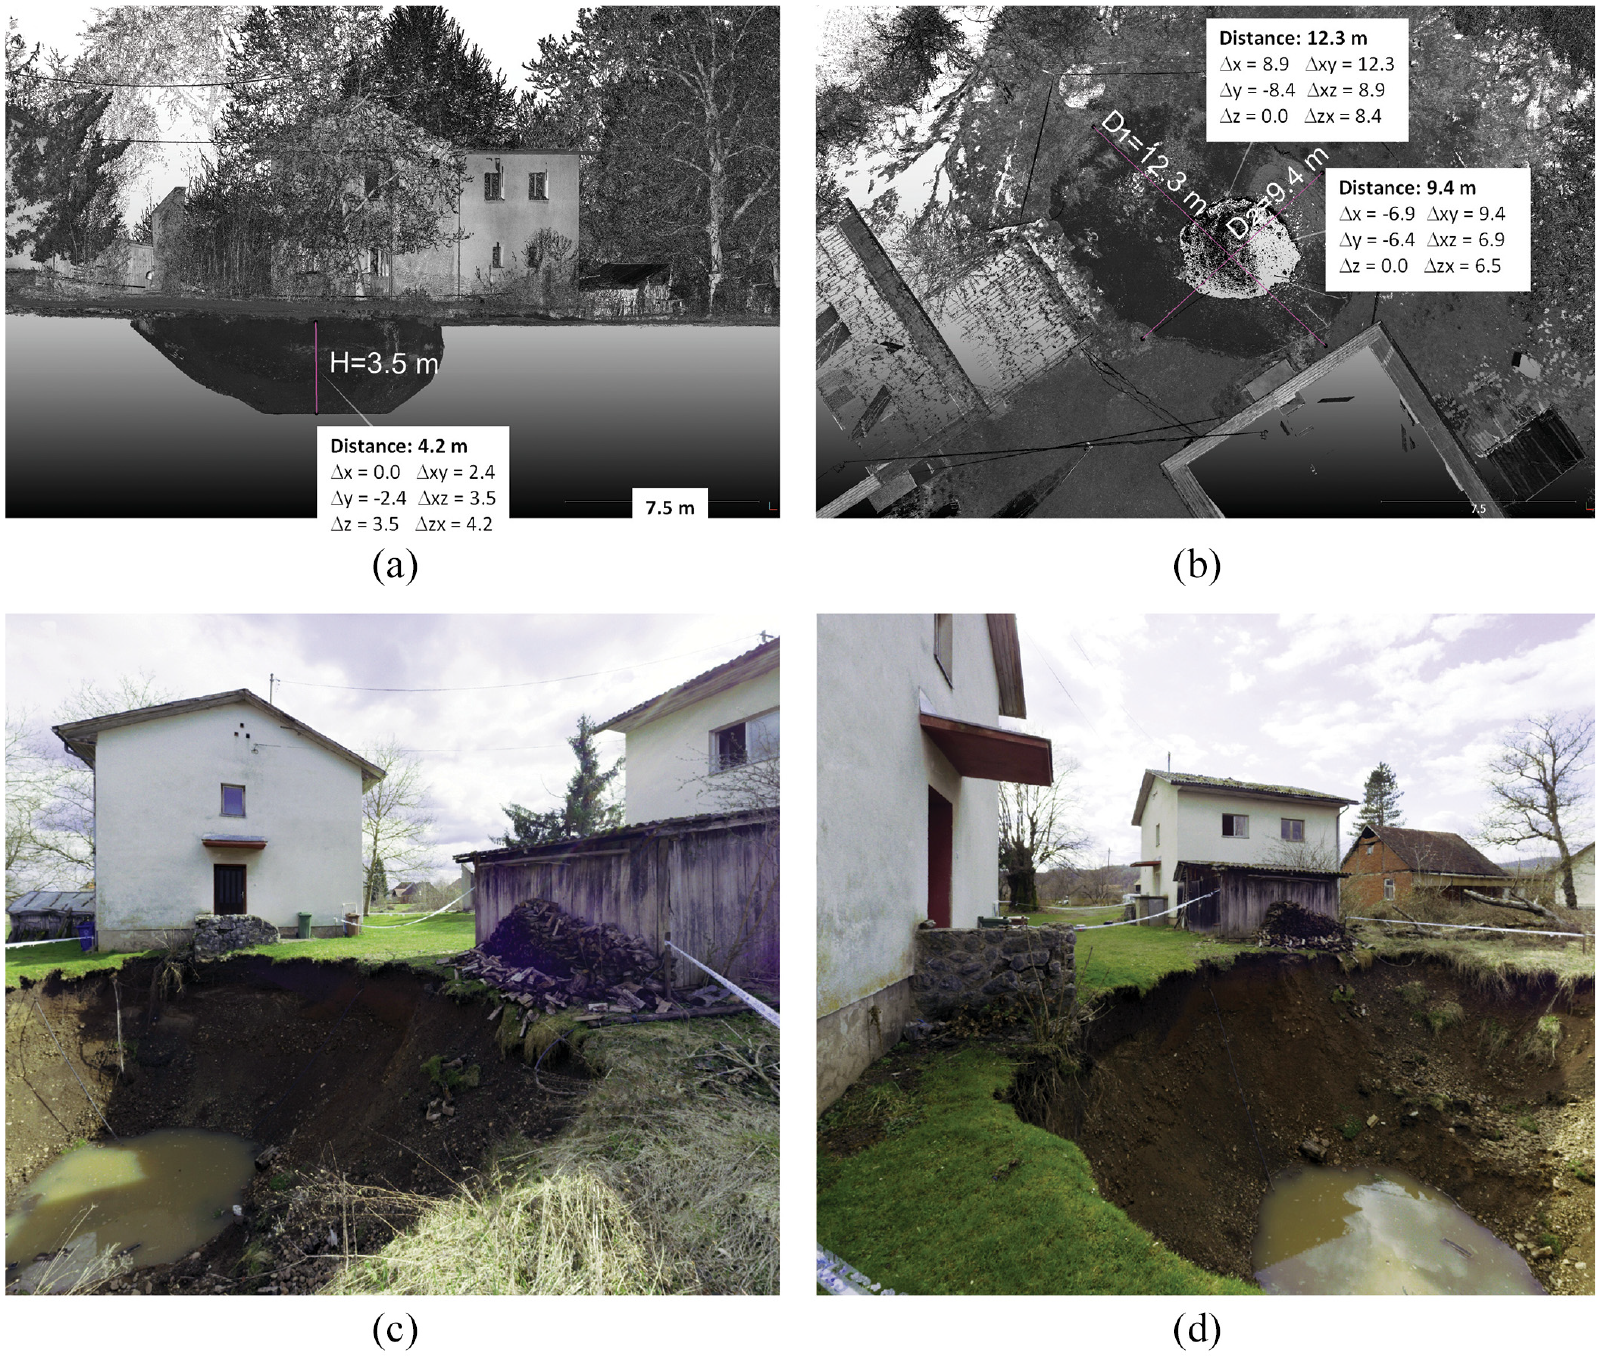
Sinkhole S015 near houses and infrastructure in Mečenčani (for location, see Figure 2): (a) and (b) lidar scans, (c) and (d) photographs.
Furthermore, 3 sinkholes collapsed in a nearby family farm in Mečenčani (Figure 11), S053, S054, and S055 (S054 and S055 are circular sinkholes with a small diameter, quite deep and have vertical walls).
Lidar images of sinkholes S053 ((a) and (b), 3.2 m in diameter), S054 ((c) and (d), 2.0 m in diameter), and S055 ((e) and (f), 1.5 m in diameter) on Mečenčani family farmland (for location, see Figure 2).
Geotechnical investigation
Geotechnical subsurface investigations around Mečenčani and Borojevići villages were conducted to help in the understanding of complex deformation and water flow phenomena that govern the formation of cover-collapse sinkholes associated with a seismic sequence. To this end, four boreholes were drilled by a manually operated solid stem auger. Boreholes B-1 and B-2 were located in the vicinity of the largest cover-collapse sinkhole S001 in Mečenčani (Tomac et al., 2021) and were drilled in mostly clayey soil to a depth of 8.0 and 7.6 m, respectively. Below these depths, further advancement was no longer possible either because of the presence of very stiff marly clay or the increased content of gravel-size particles (Figure 12). Boreholes B-3 and B-4 were drilled close to the sinkholes S009 and S040 in the NW part of the study area, closer to Sunja river. Drilling ended at depths of only 4.0 and 2.5 m, respectively. Below these depths, further advancement was no longer possible as the content of gravel-size particles increased (Figure 12).
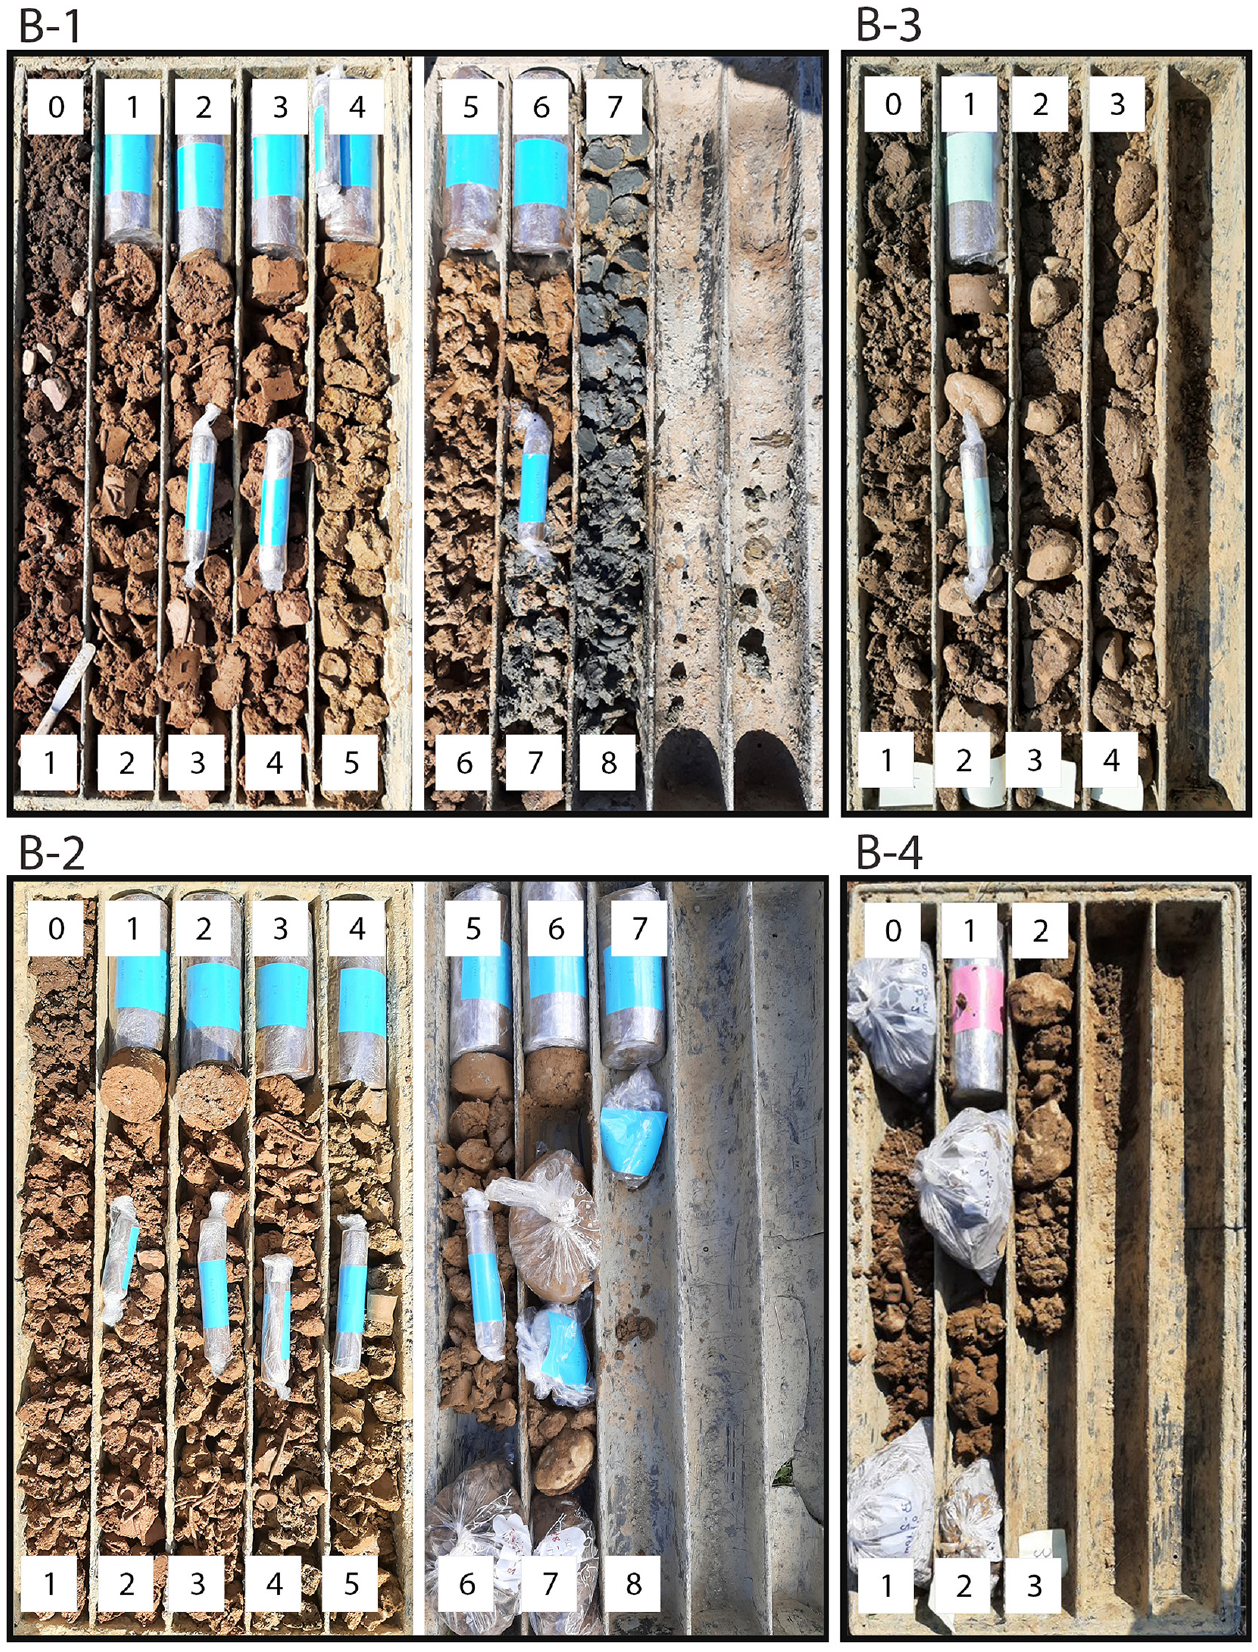
Soil core and sampling locations from boreholes B-1 to B-4 (photo by Evelina Oršulić). Numbers indicate depth in meters.
SPTs were performed in all boreholes at approximately 1.0 m intervals by using a mechanical drive-weight unit with a standard donut-type hammer according to ASTM standard (ASTM D1586-11, 2011)—weight 63.5 kg, hammer travel distance 760 mm. The split-spoon sampler with a length of 482 mm, inside diameter of 34.93 mm, and outside diameter of 50.8 mm was connected to the drive unit by “A” size rods (outside diameter 41.2 mm and inside diameter 28.5 mm). The sampler was driven to the bottom of the borehole with hammer blows. The number of blows applied were counted for three 150 mm increments (450 mm of total advance). The sum of the number of blows required for the second and third 150 mm increment of penetration is denoted by NSPT (raw data without any correction). The same procedure was used for conical probing. A conical tip (60.0°, diameter 50.8 mm) was used instead of the split-spoon sampler. It was driven with the same energy as SPT. In this case, the sum of the number of blows required for the second and third 150 mm increments of penetration is denoted by NSPT CONE. A conical probe was used in boreholes B-3 and B-4 below the depths of 4.0 or 2.5 m, respectively. Further penetration below the depths of 5.8 and 6.5 m was not possible even with the use of the conical probe (Figure 13). Groundwater tables (GWTs) in boreholes B-1 and B-2 were initially detected at 4.7 and 4.0 m below the ground level, respectively. GWTs rose shortly after the drilling was completed, whereby the subsequent GWTs in both boreholes closely corresponded to the GWT inside the sinkhole S001.
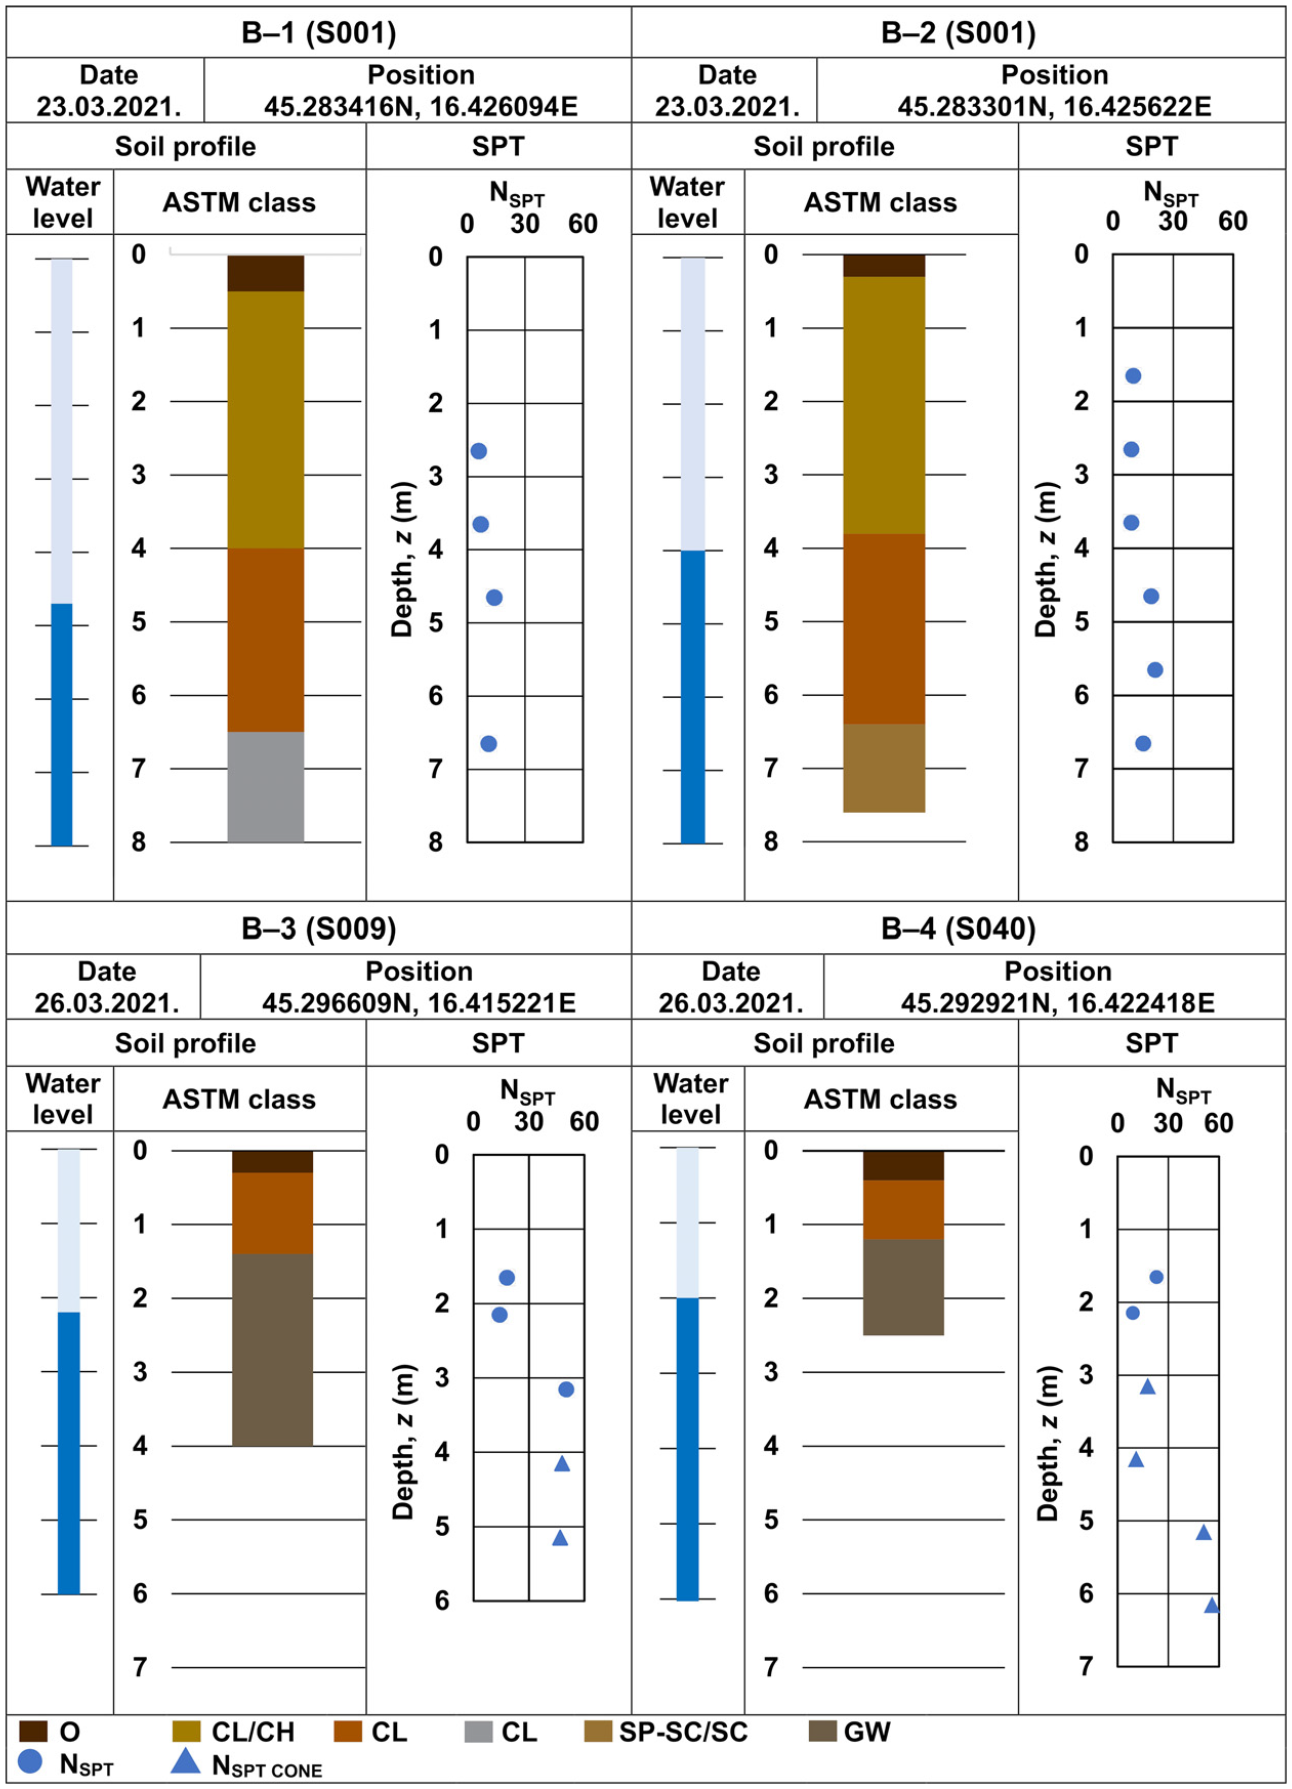
Boring logs for boreholes B-1 through B-4.
Disturbed soil samples were withdrawn from the auger flights. They are denoted by D-A herein. Additional disturbed soil samples, which were obtained from SPT sampler at intervals of about 1 m, are denoted by D-SPT. Undisturbed samples (U-TWS) were obtained by using a thin-walled push tube sampler with inner diameter of 90 mm, outer diameter of 98 mm, and length of 457 mm. Samples approximately 300 mm long (from the middle of 457-mm-long cores) were taken immediately upon the recovery to the surface, labeled, wrapped with adhesive cling foil and placed into the transport box. Upon arrival to the laboratory until testing, samples were stored in the storage room with constant temperature and humidity. Various geotechnical laboratory tests were performed, including specific gravity, in situ gravimetric water content, grain size distributions, Atterberg limits, oedometer, and undrained conventional triaxial compression tests on saturated specimens. In addition, soil water retention tests were conducted including both drying and wetting paths.
Based on the field description and identification, and laboratory test results, soil samples were classified according to visual and manual procedures (ASTM D2488-17, 2017) and the Unified Soil Classification System (USCS) (ASTM D2487-17, 2017). Figure 13 shows boring logs for boreholes B-1 through B-4, while a cross-section through sinkhole S001 is depicted in Figure 14.
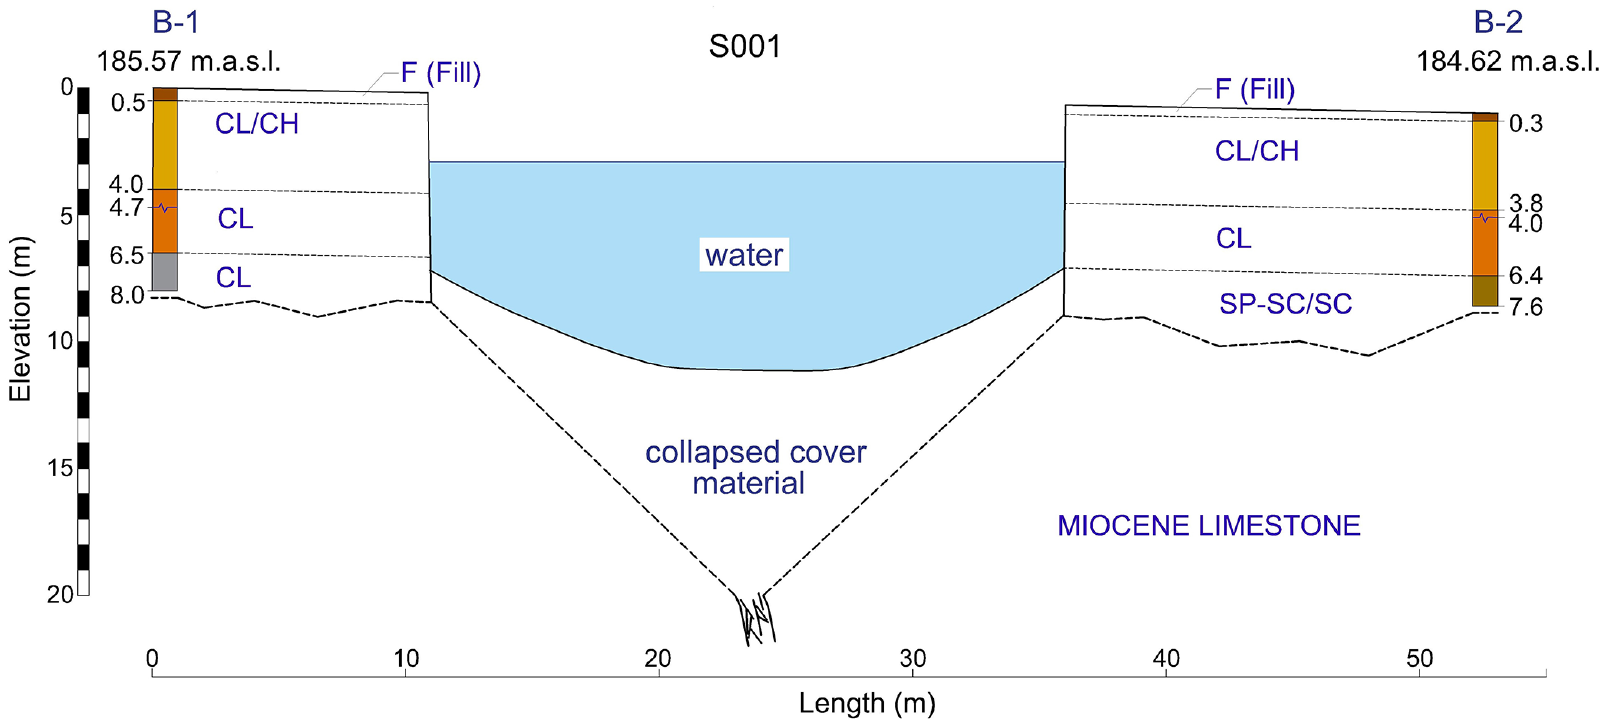
Vertical cross-section through sinkhole S001 and boreholes B-1 and B-2.
Soil profiles of boreholes B-1 and B-2 (Figure 13) indicate that approximately top 0.5 m consists of fill with organic content (denoted by O), followed by approximately 3.5 m of sandy lean and fat clay that is firm to stiff and contains sparse traces of limestone particles with sharp edges up to 20 mm in diameter in borehole B-1 and up to 50 mm in diameter in borehole B-2, and is classified as CL/CH. The third layer consists of stiff to very stiff lean clay and lean clay with sand that is classified as CL. At the bottom of boreholes, either gray lean (marly) clay (CL in borehole B-1) or a very moist clayey sand with gravel (SP-SC/SC in borehole B-2) was found (Figures 13 and 14).
Soil profiles of boreholes B-3 and B-4 (Figure 13) indicate top 0.2 to 0.3 m of fill with organic content (denoted by O). This is followed by about 1 m of lean clay (CL) that is underlain by 2.5 m of well-graded gravel (GW) in borehole B-3, and about 1 m of well-graded gravel (GW) in borehole B-4.
Summary of in situ gravimetric water content (w0), specific gravity (Gs), mass density (ρ), dry mass density (ρd), percent of fines, Atterberg limits along with USCS symbol, depth, sampler type, and sample number is provided in Table 1, for samples obtained from boreholes B-1 to B-4. In addition, vertical effective preconsolidation stresses
Geotechnical properties of soil samples collected from boreholes B-1 through B-4
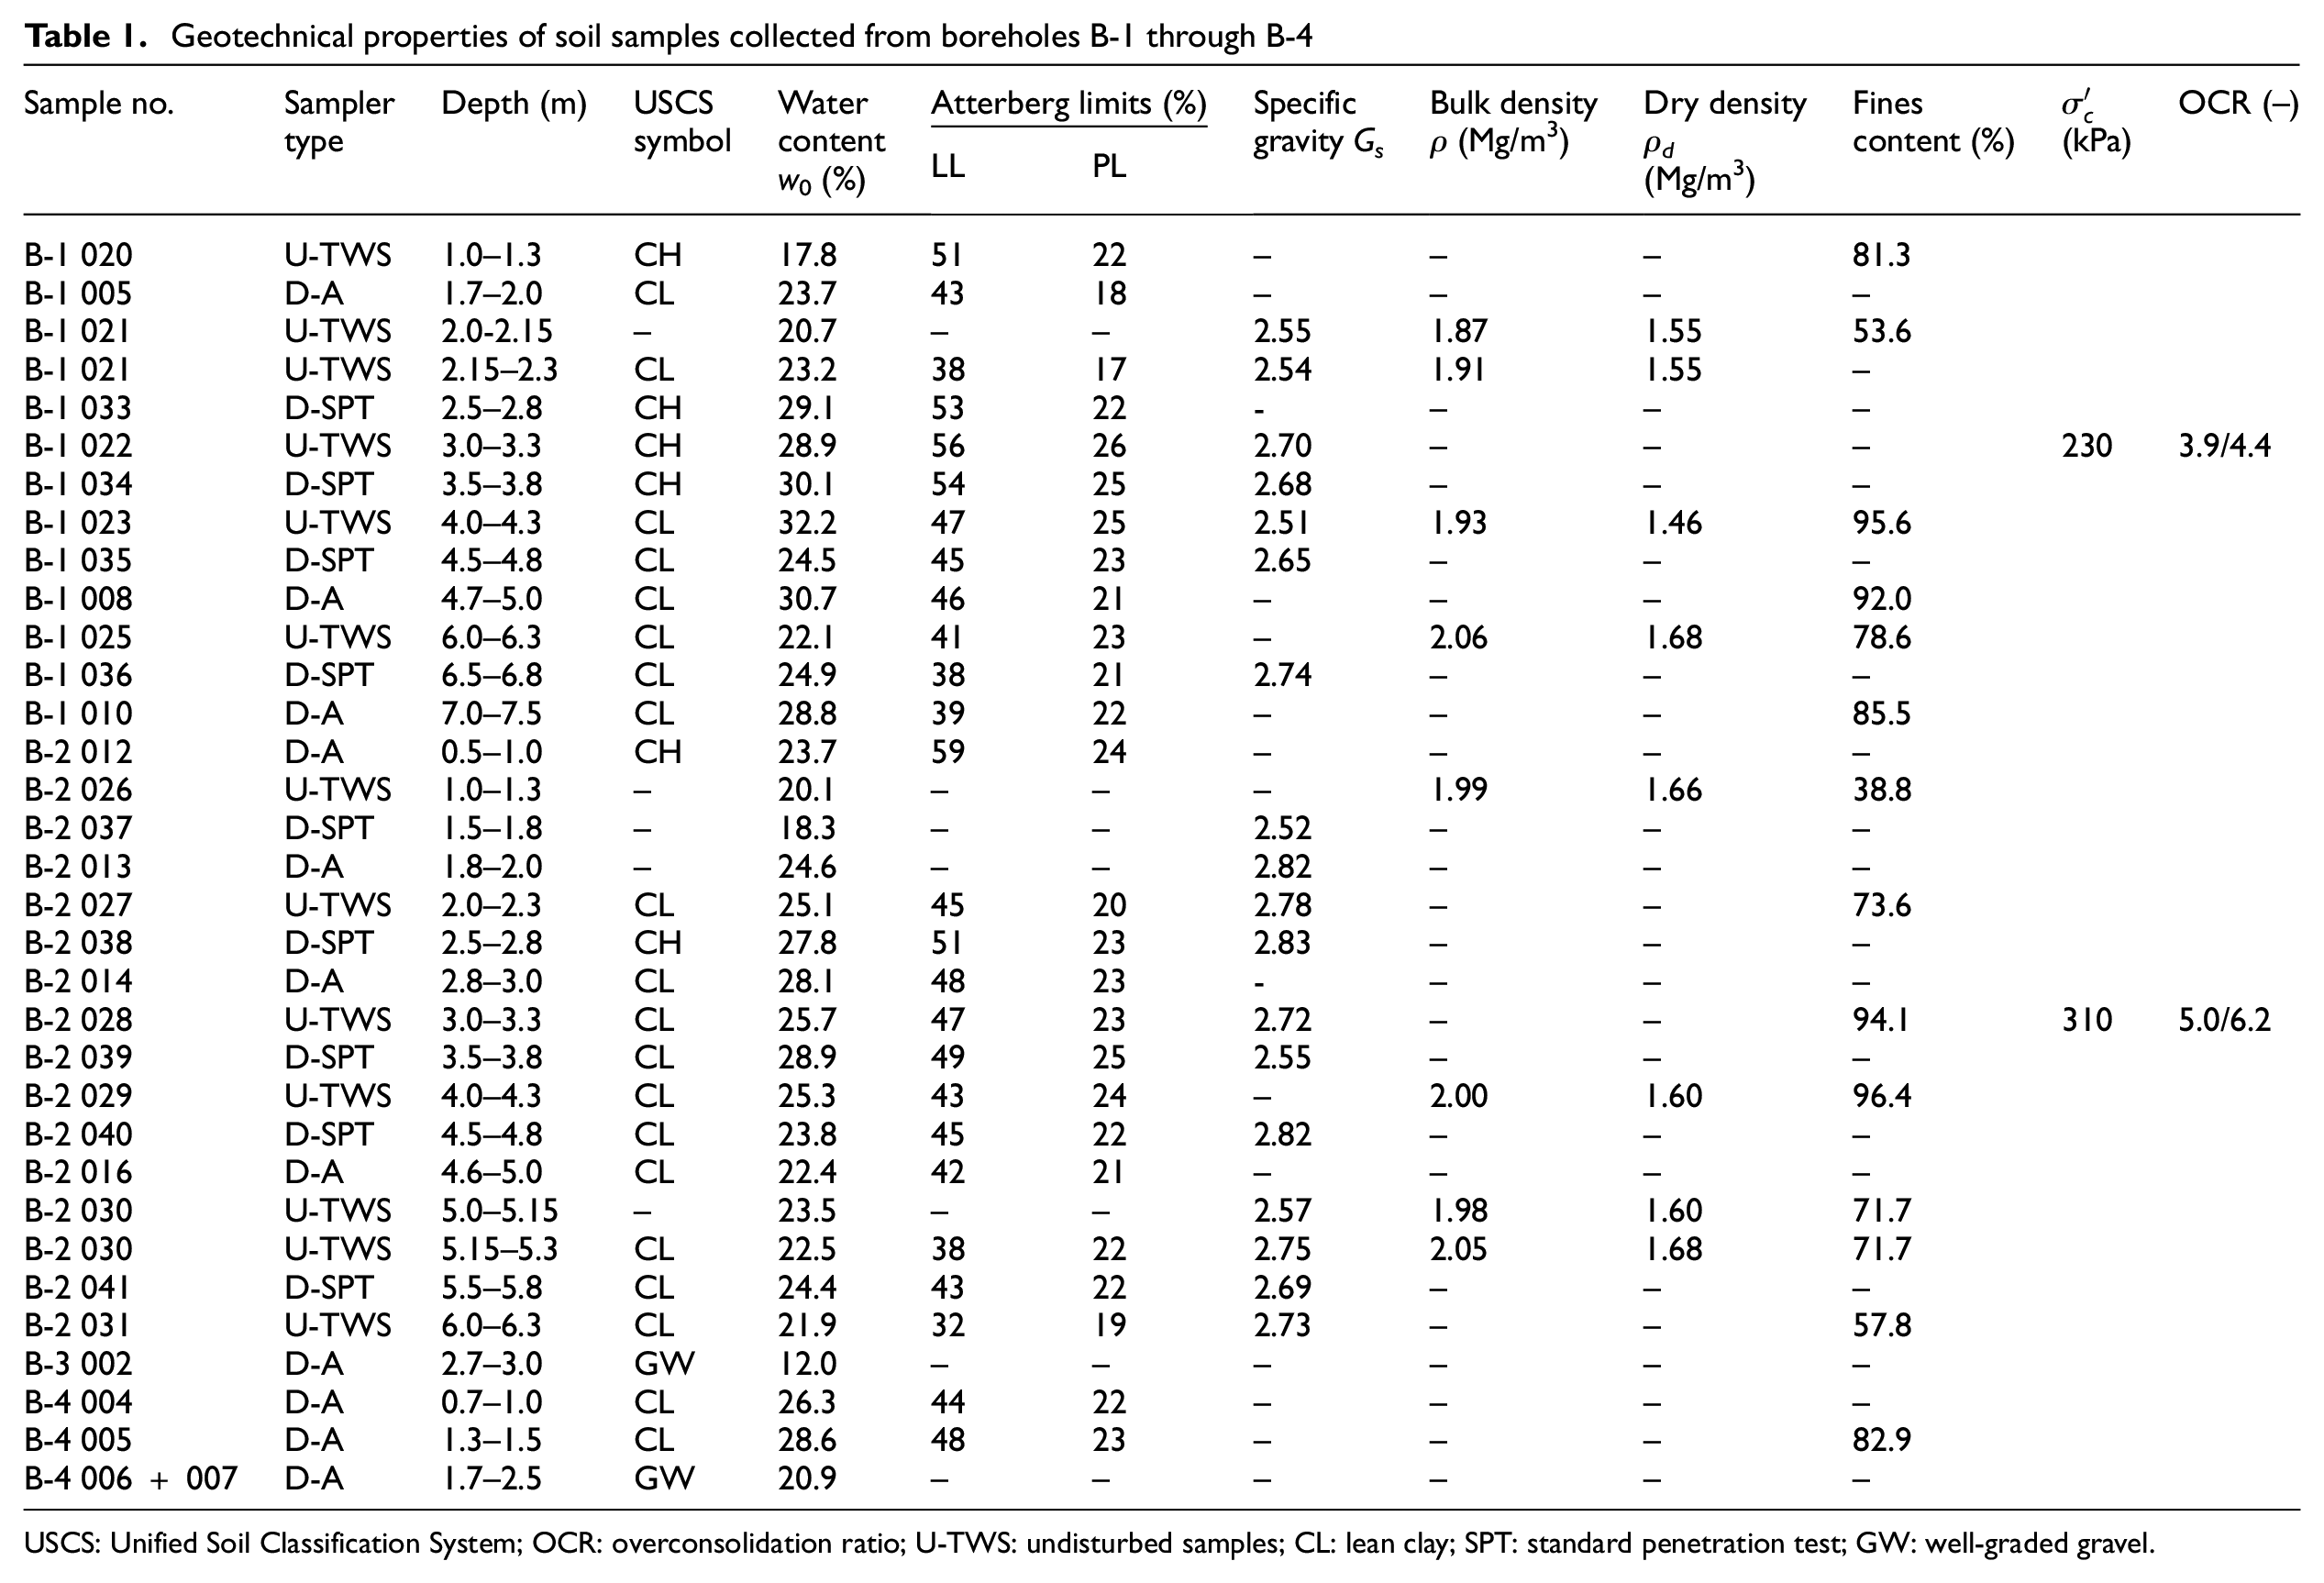
USCS: Unified Soil Classification System; OCR: overconsolidation ratio; U-TWS: undisturbed samples; CL: lean clay; SPT: standard penetration test; GW: well-graded gravel.
Figure 15 depicts variation of Atterberg limits and natural water contents versus depth, while Figure 16 shows grain size distribution curves for soils collected from boreholes B-1 to B-4.
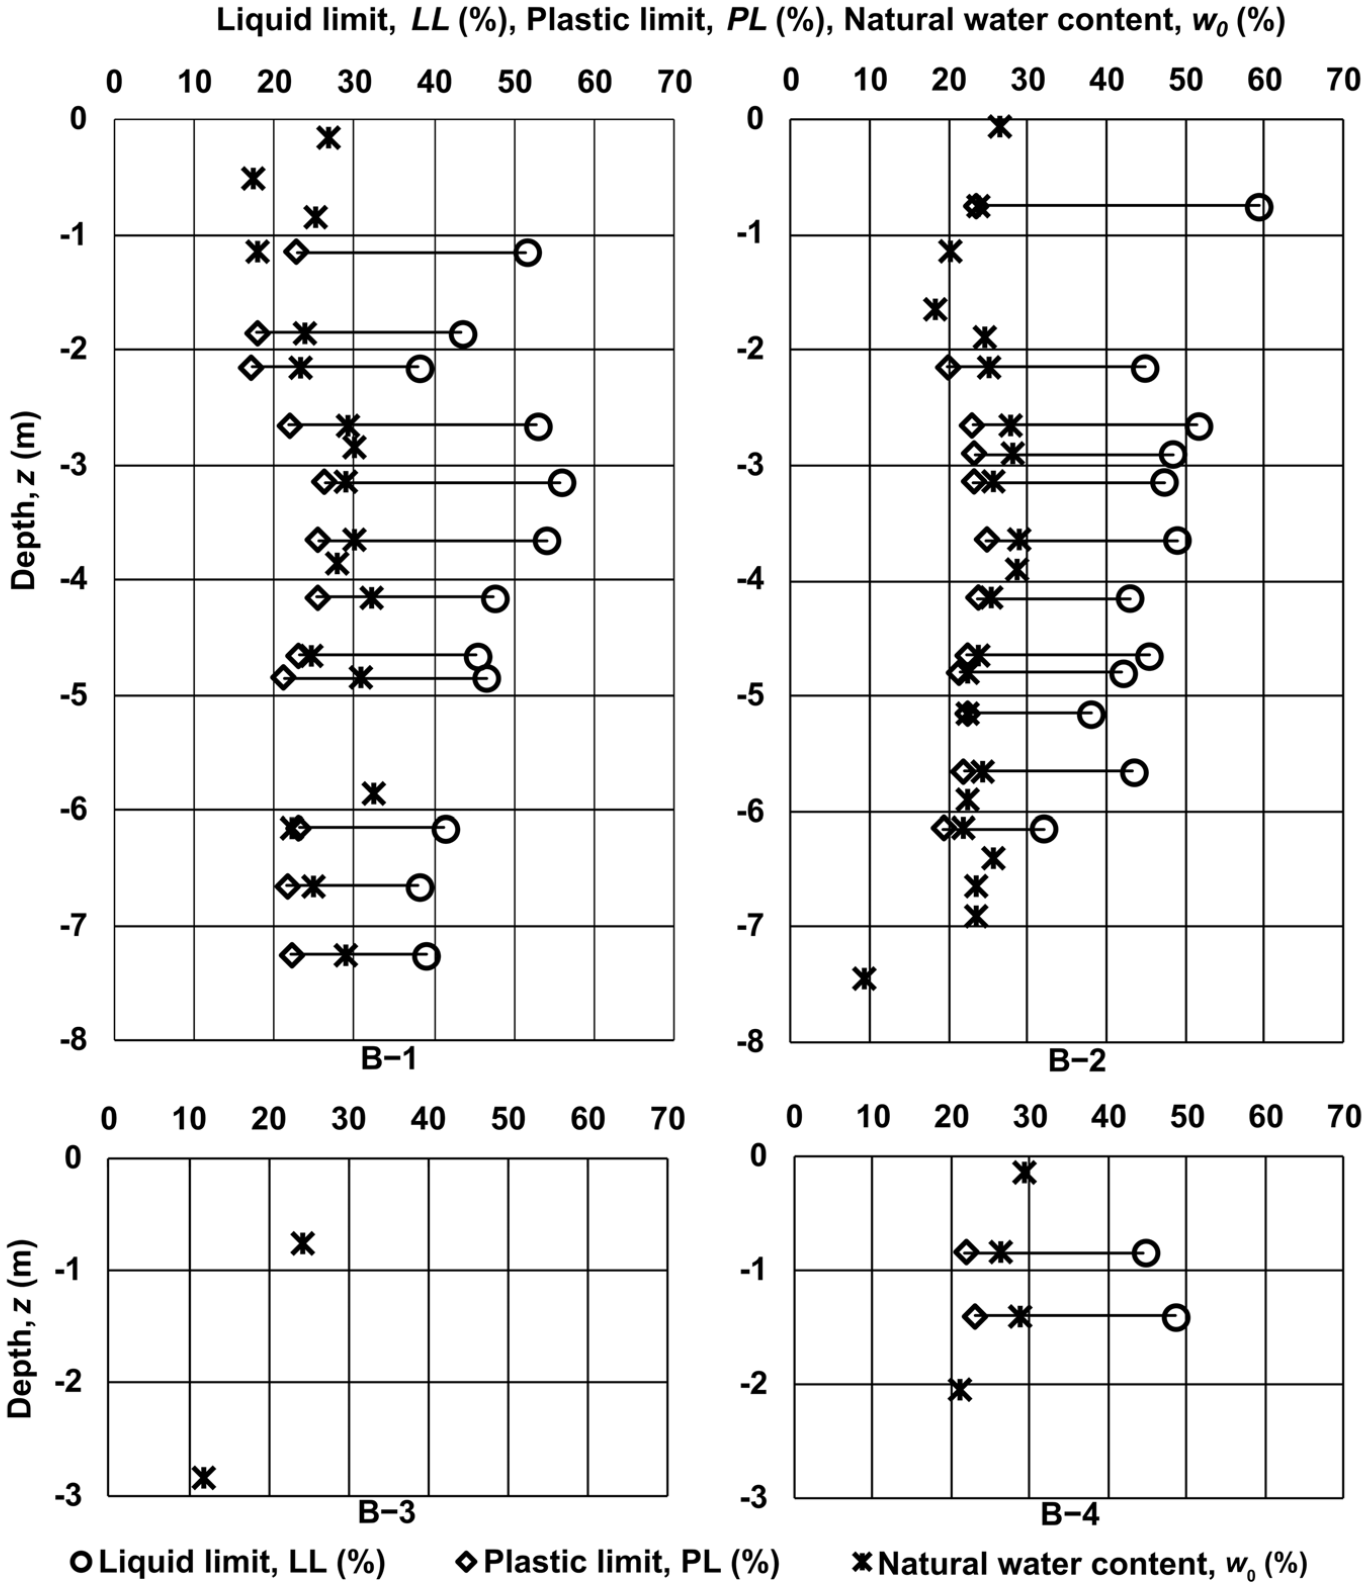
Atterberg limits and natural water content versus depth for boreholes B-1 to B-4.
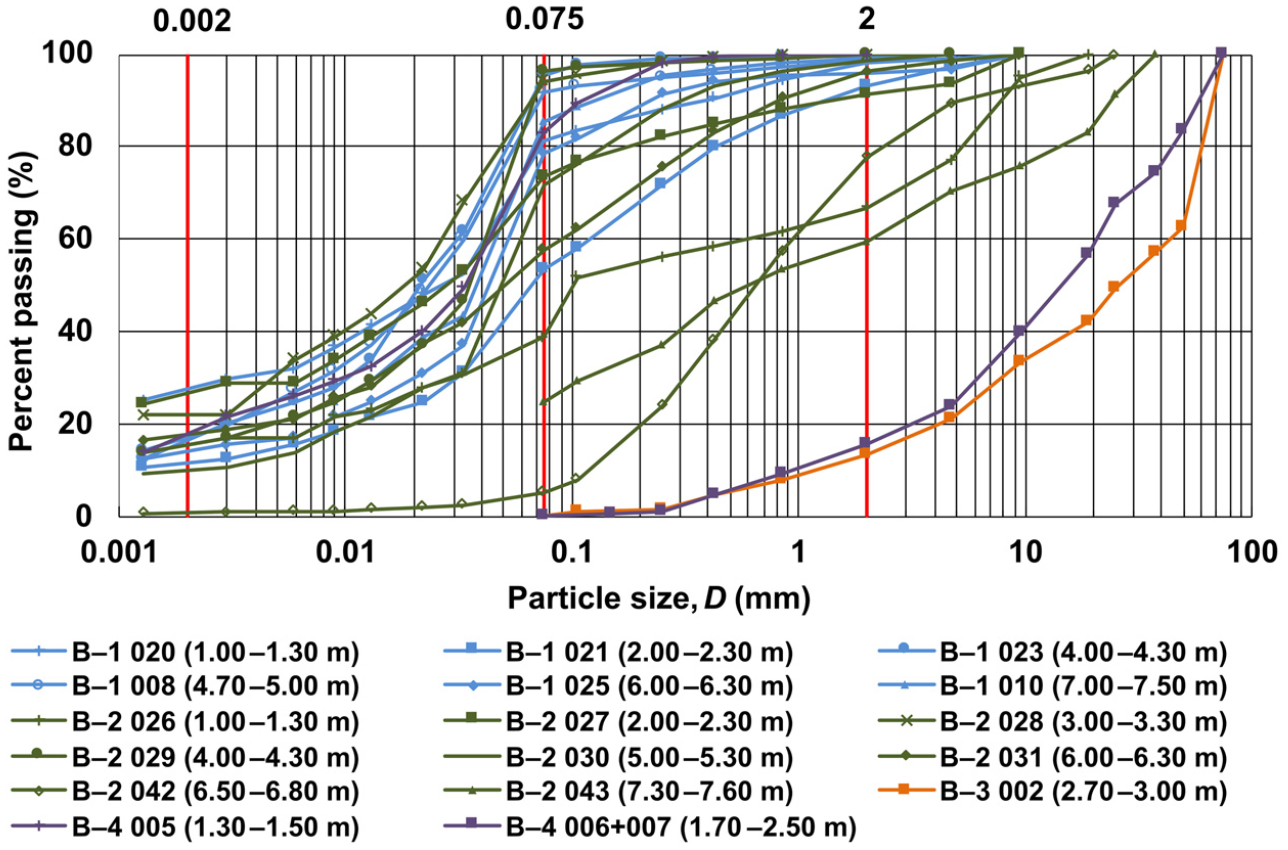
Grain size distribution curves for soils collected from boreholes B-1 to B-4.
Furthermore, plasticity indices and liquid limits for various soil samples collected from boreholes B-1, B-2, B-3, and B-4 are depicted in the Casagrande plasticity chart shown in Figure 17, thus indicating that most of the soil samples are in the area of low-plasticity clays with few exceptions that fall into the range of high-plasticity clays.
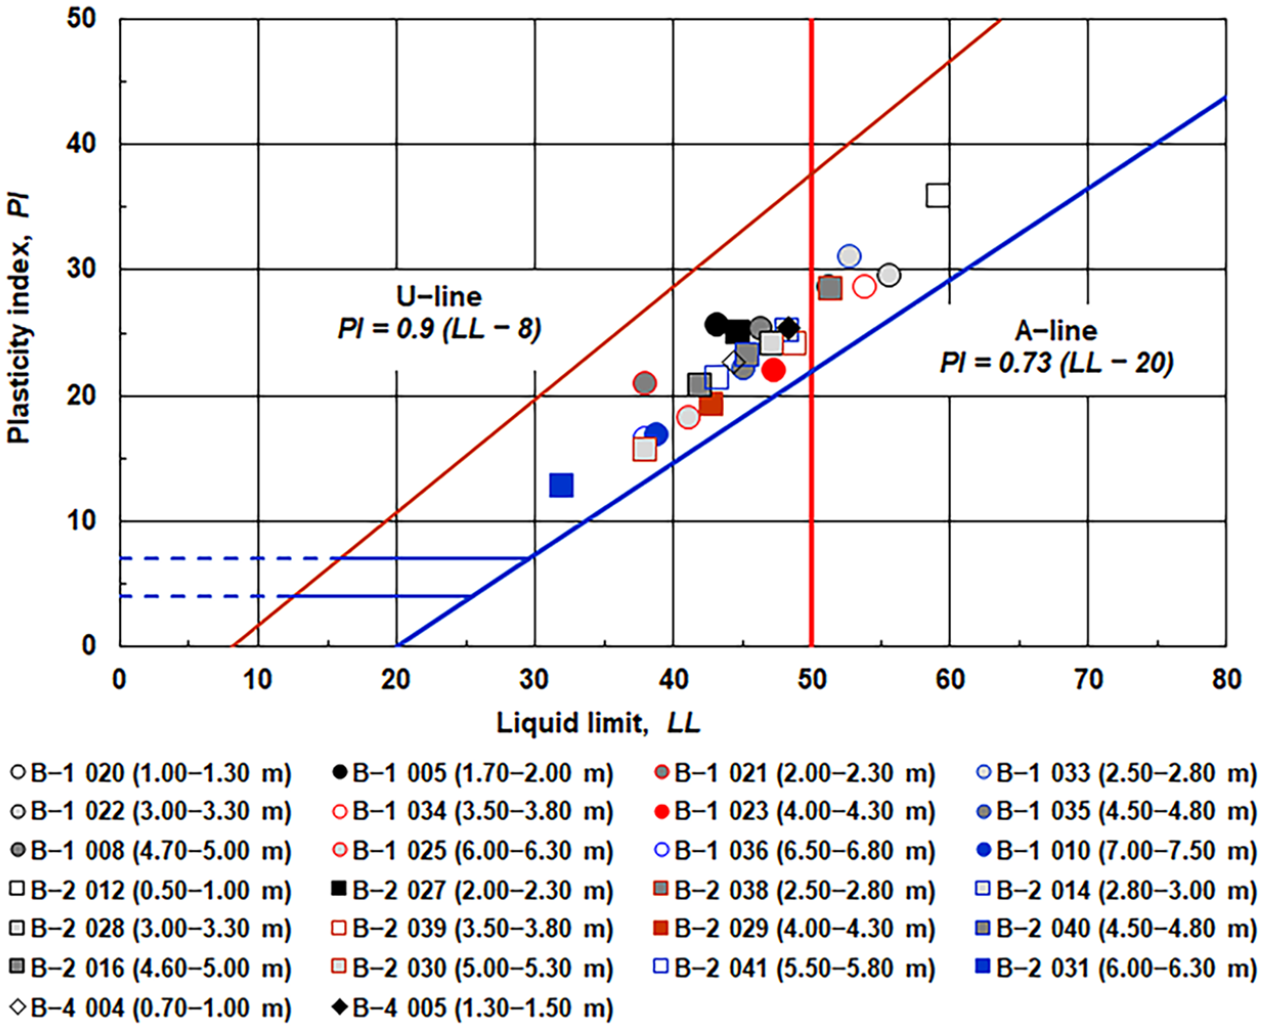
Casagrande plasticity chart for soils collected from boreholes B-1 (circles), B-2 (squares), and B4 (diamonds).
Oedometer tests
Oedometer tests were performed on saturated samples. Figure 18 shows the results obtained from the sample nos 022 (B-1) and 028 (B-2). The tests were performed in accordance with the ASTM standard (ASTM D2435-11, 2011). Assessment of sample disturbance according to the procedure suggested by Lunne et al. (1997) indicated that both samples are of very good to excellent quality. Consequently, vertical effective preconsolidation stresses
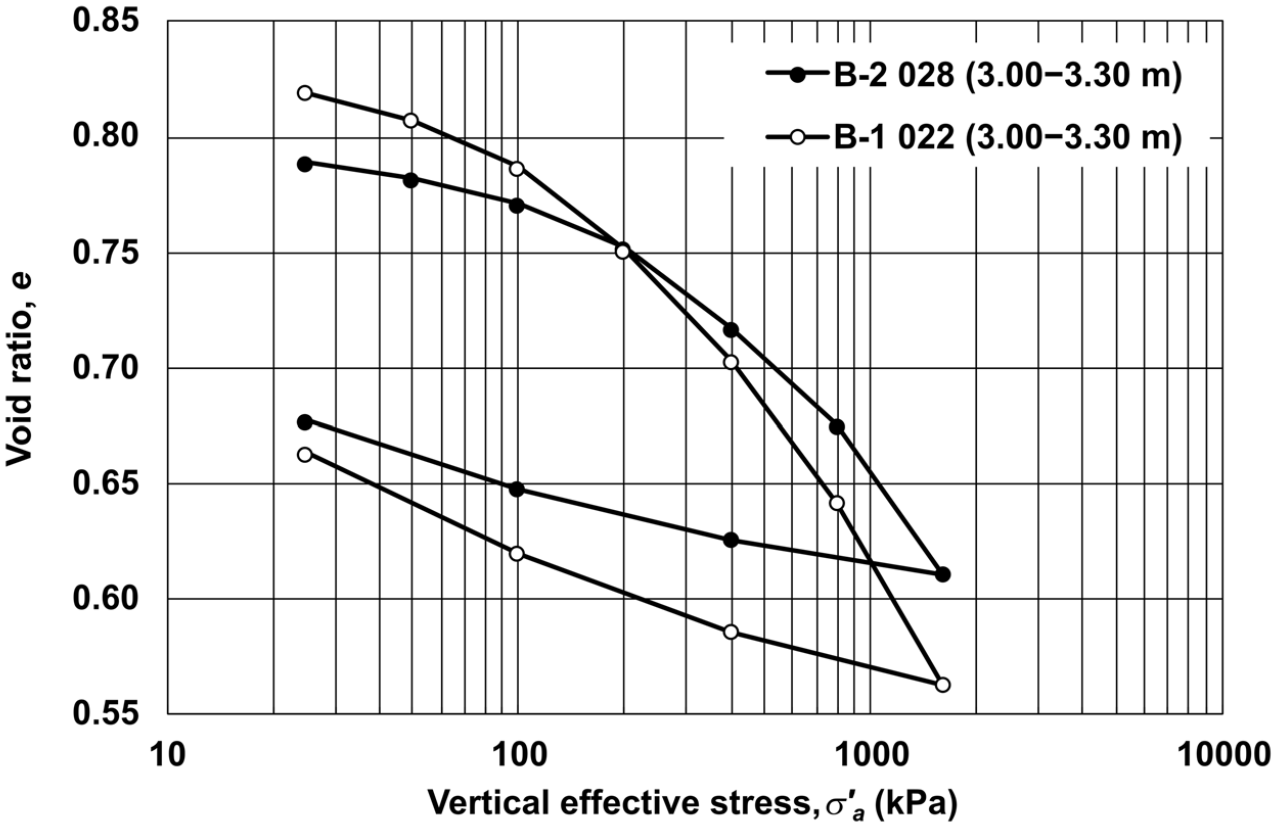
Results of oedometer tests performed on sample nos 022 and 028 that were collected from depths ranging between 3.0 and 3.3 m (boreholes B-1 and B-2).
Conventional triaxial tests
Undrained conventional triaxial compression tests were carried out on saturated samples in accordance with ASTM standard (ASTM D4767-11, 2020). Three series of consolidated isotropically undrained compression (CIUC) tests were conducted, whereby each series comprised tests at three different cell pressures (σr) of 230, 260, and 300 kPa. The corresponding effective stresses
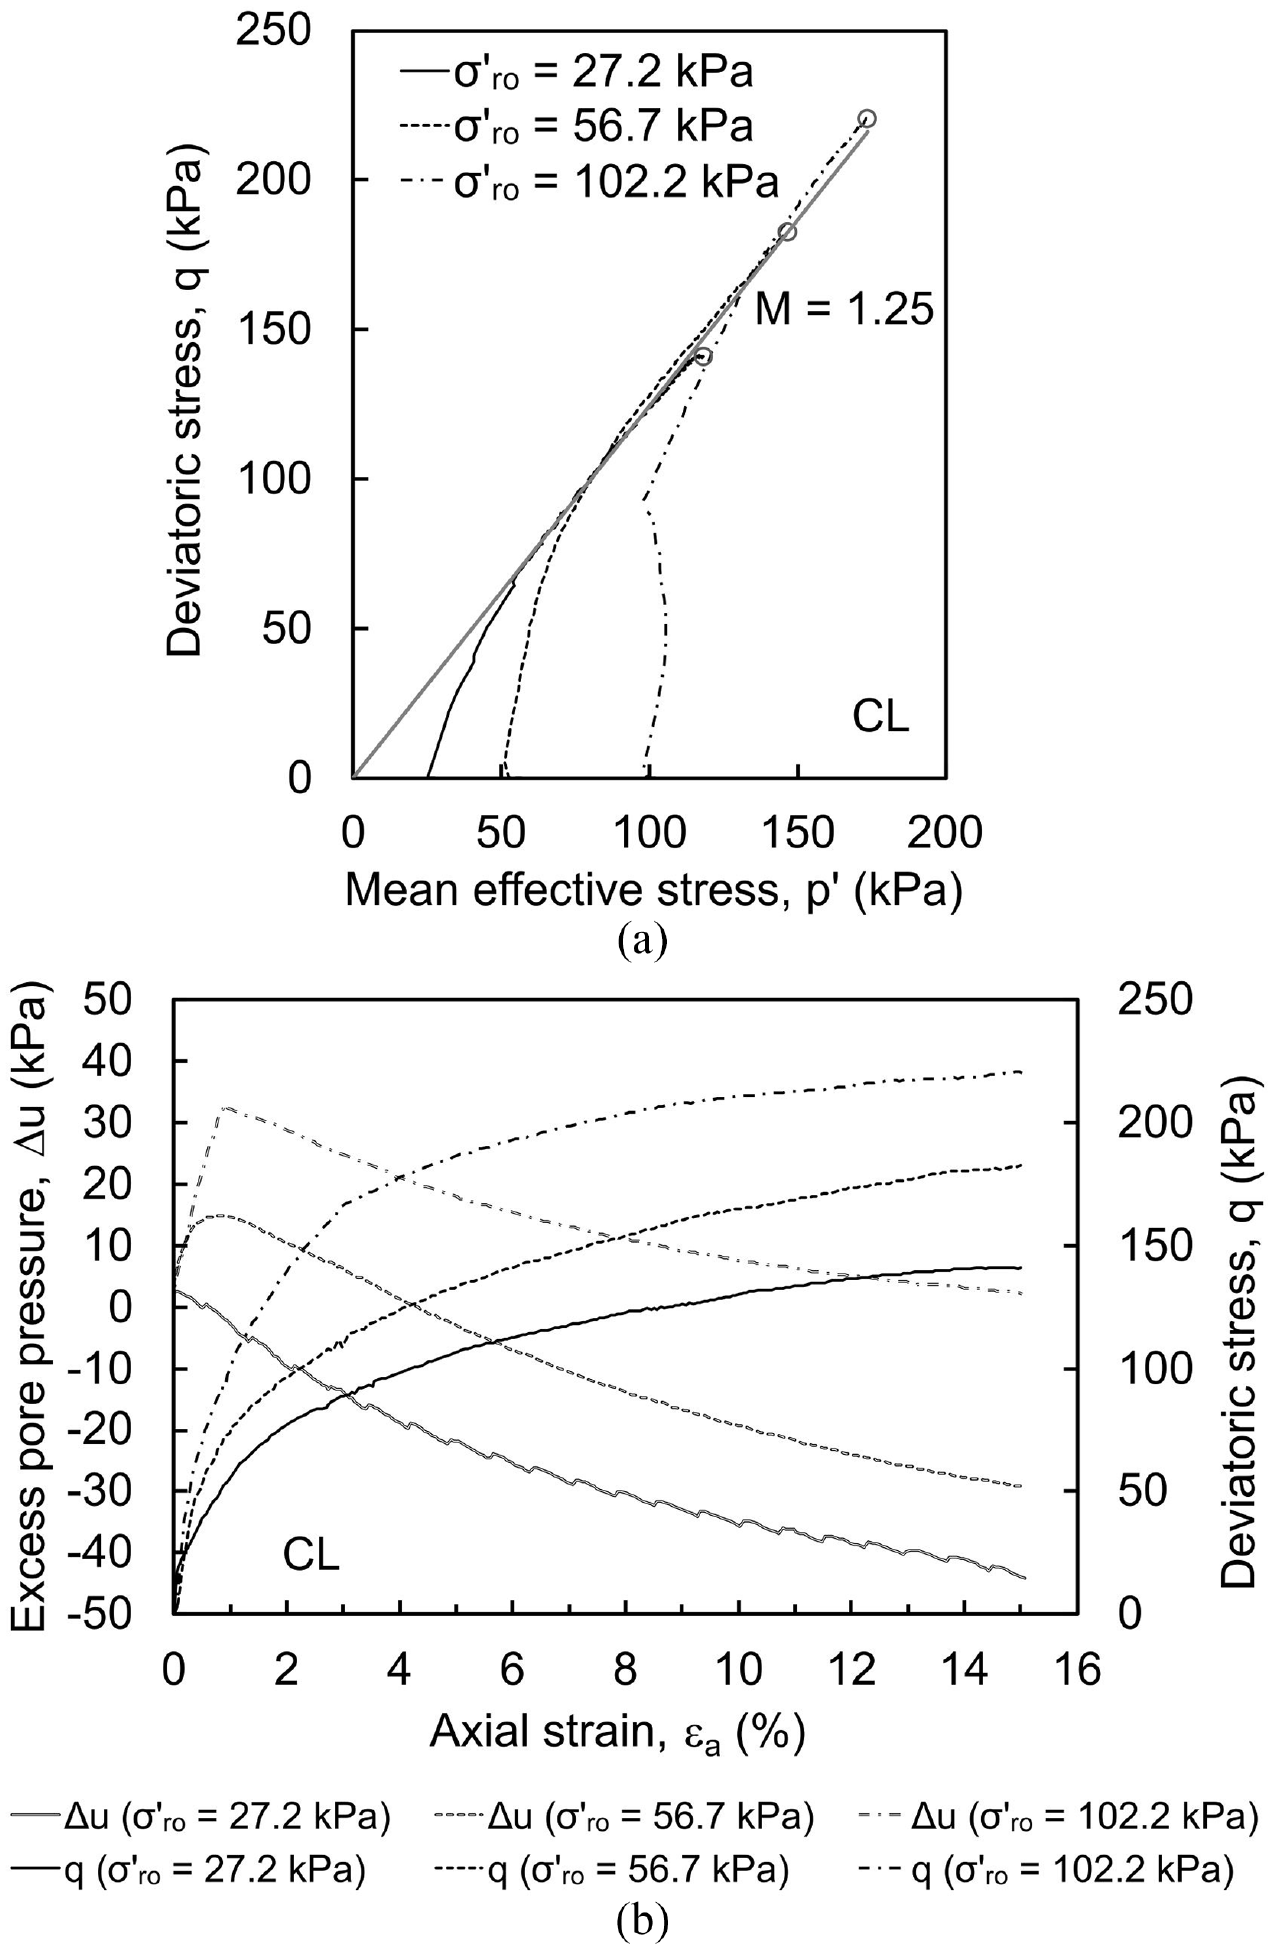
Additional information about CIUC tests conducted on sample nos 023, 027, and 028
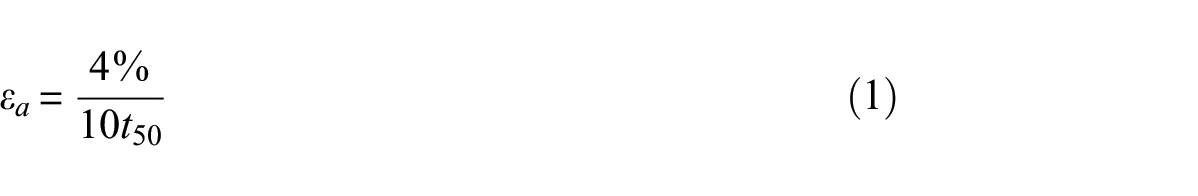
Application of Equation 1 resulted in corresponding displacement rates ranging from 0.015 to 0.036 mm/min. To avoid automatic stopping of the apparatus during the night, a slightly lower rate of displacement rate of 0.01 mm/min, which corresponds to the axial strain rate of about 0.013%/min, was selected for testing.
Results are depicted in Figures 19 to 21 whereby deviatoric and mean effective stresses are denoted by q and p′, respectively.
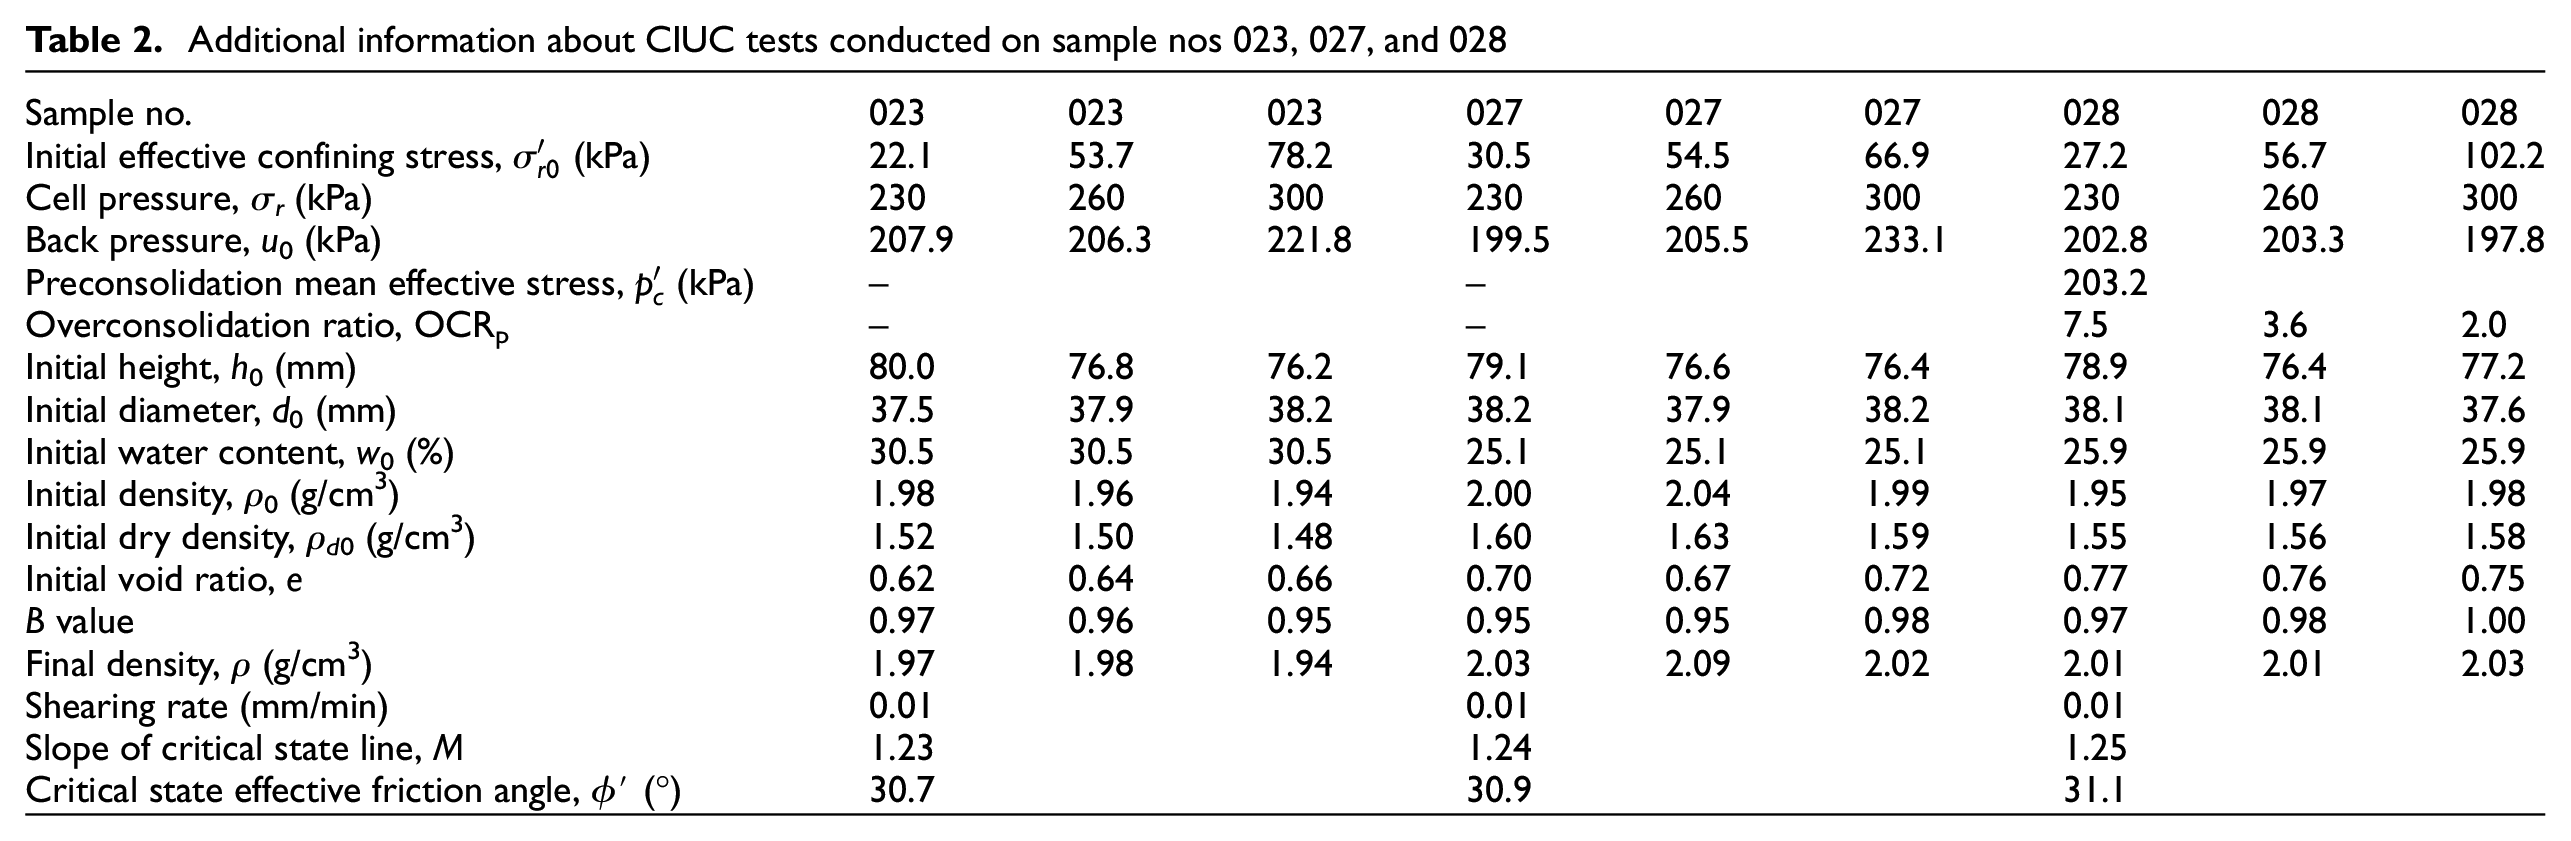
Results of CIUC tests performed on sample no. 023 (4.0–4.3 m, borehole B-1): (a) excess pore pressure and deviatoric stress versus axial strain and (b) effective stress paths.
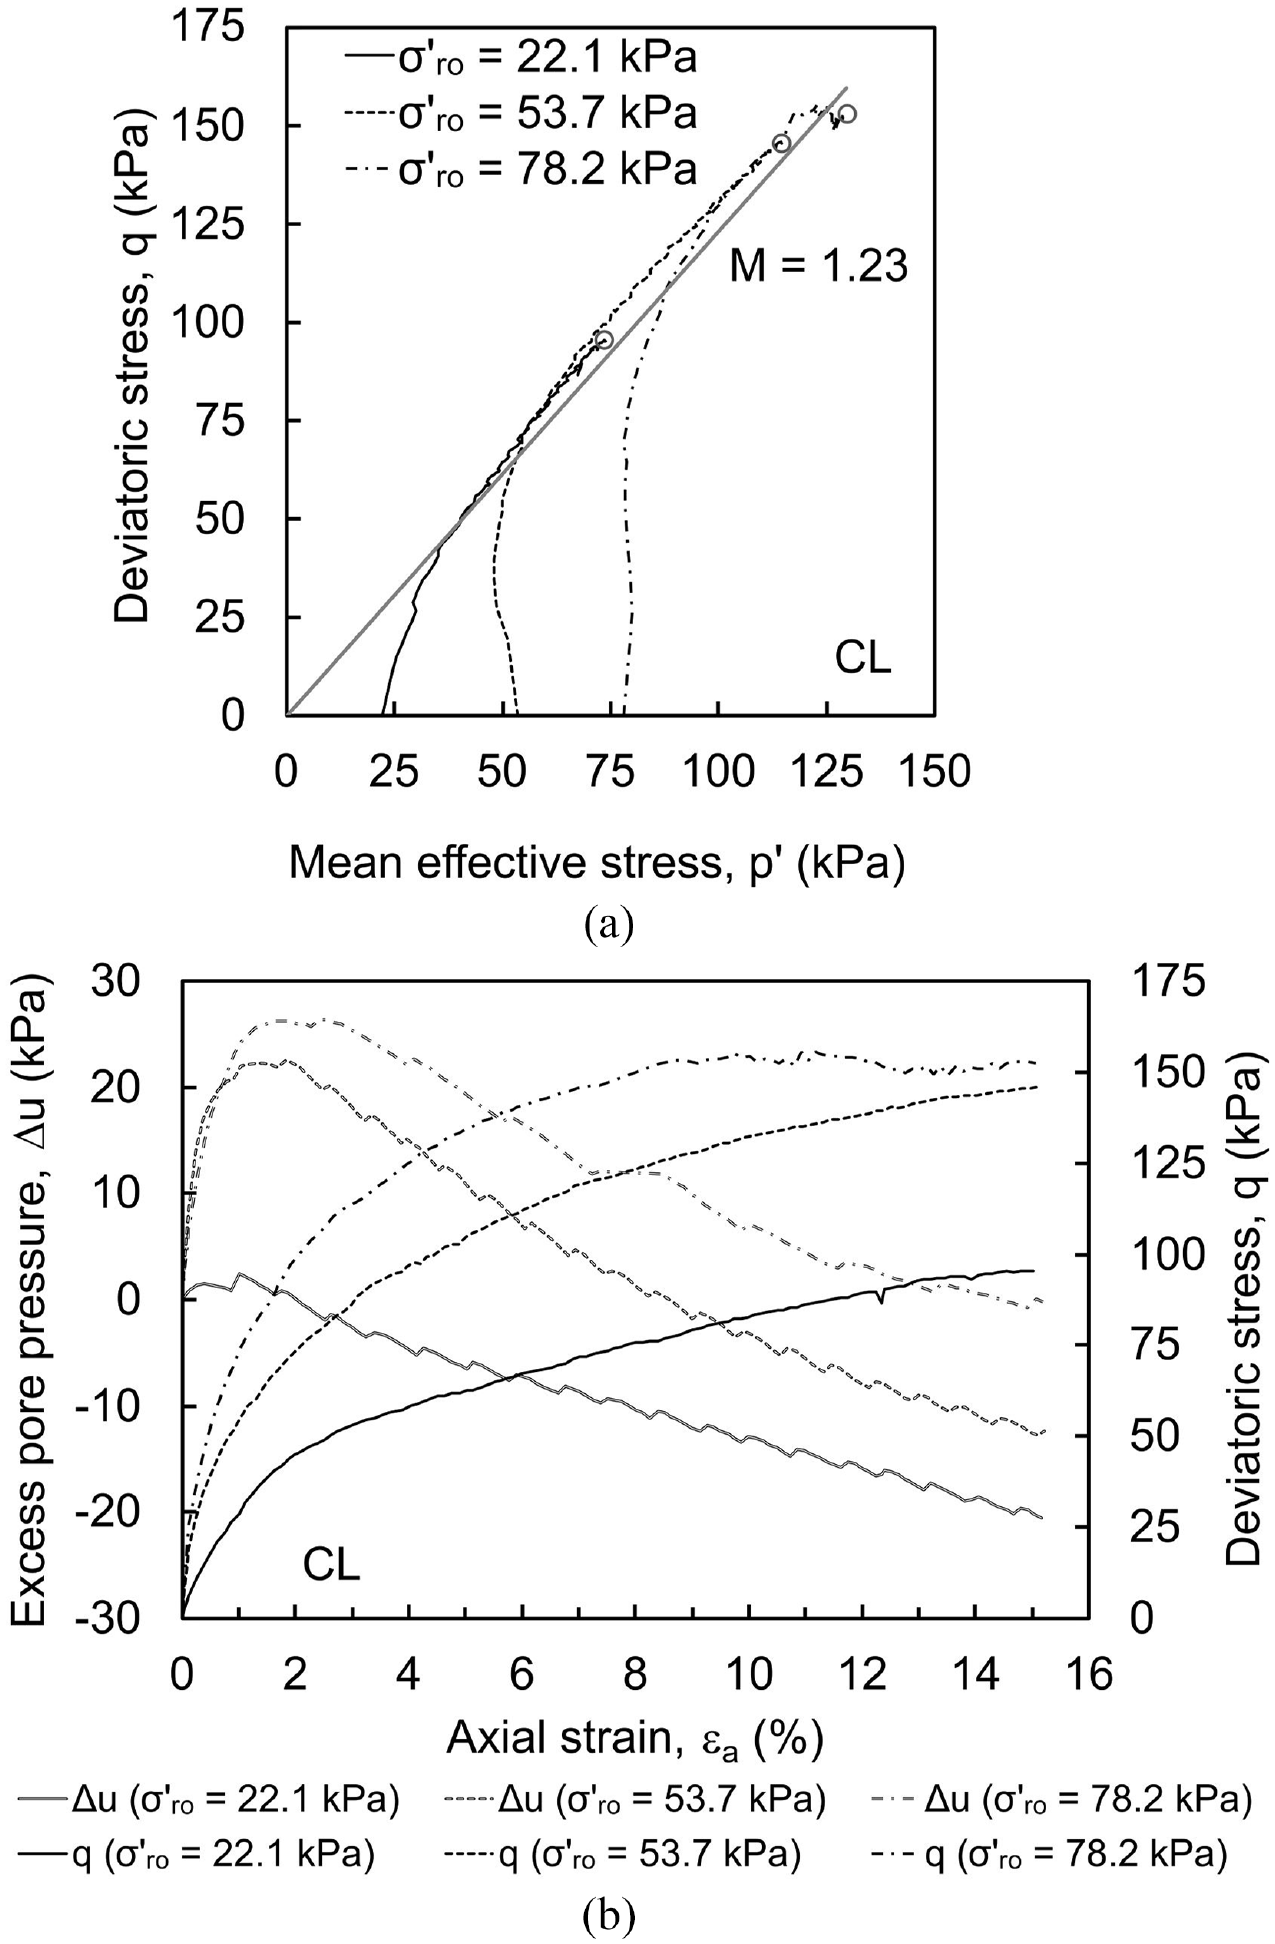
Results of CIUC tests performed on sample no. 027 (2.0–2.3 m, borehole B-2): (a) excess pore pressure and deviatoric stress versus axial strain and (b) effective stress paths.
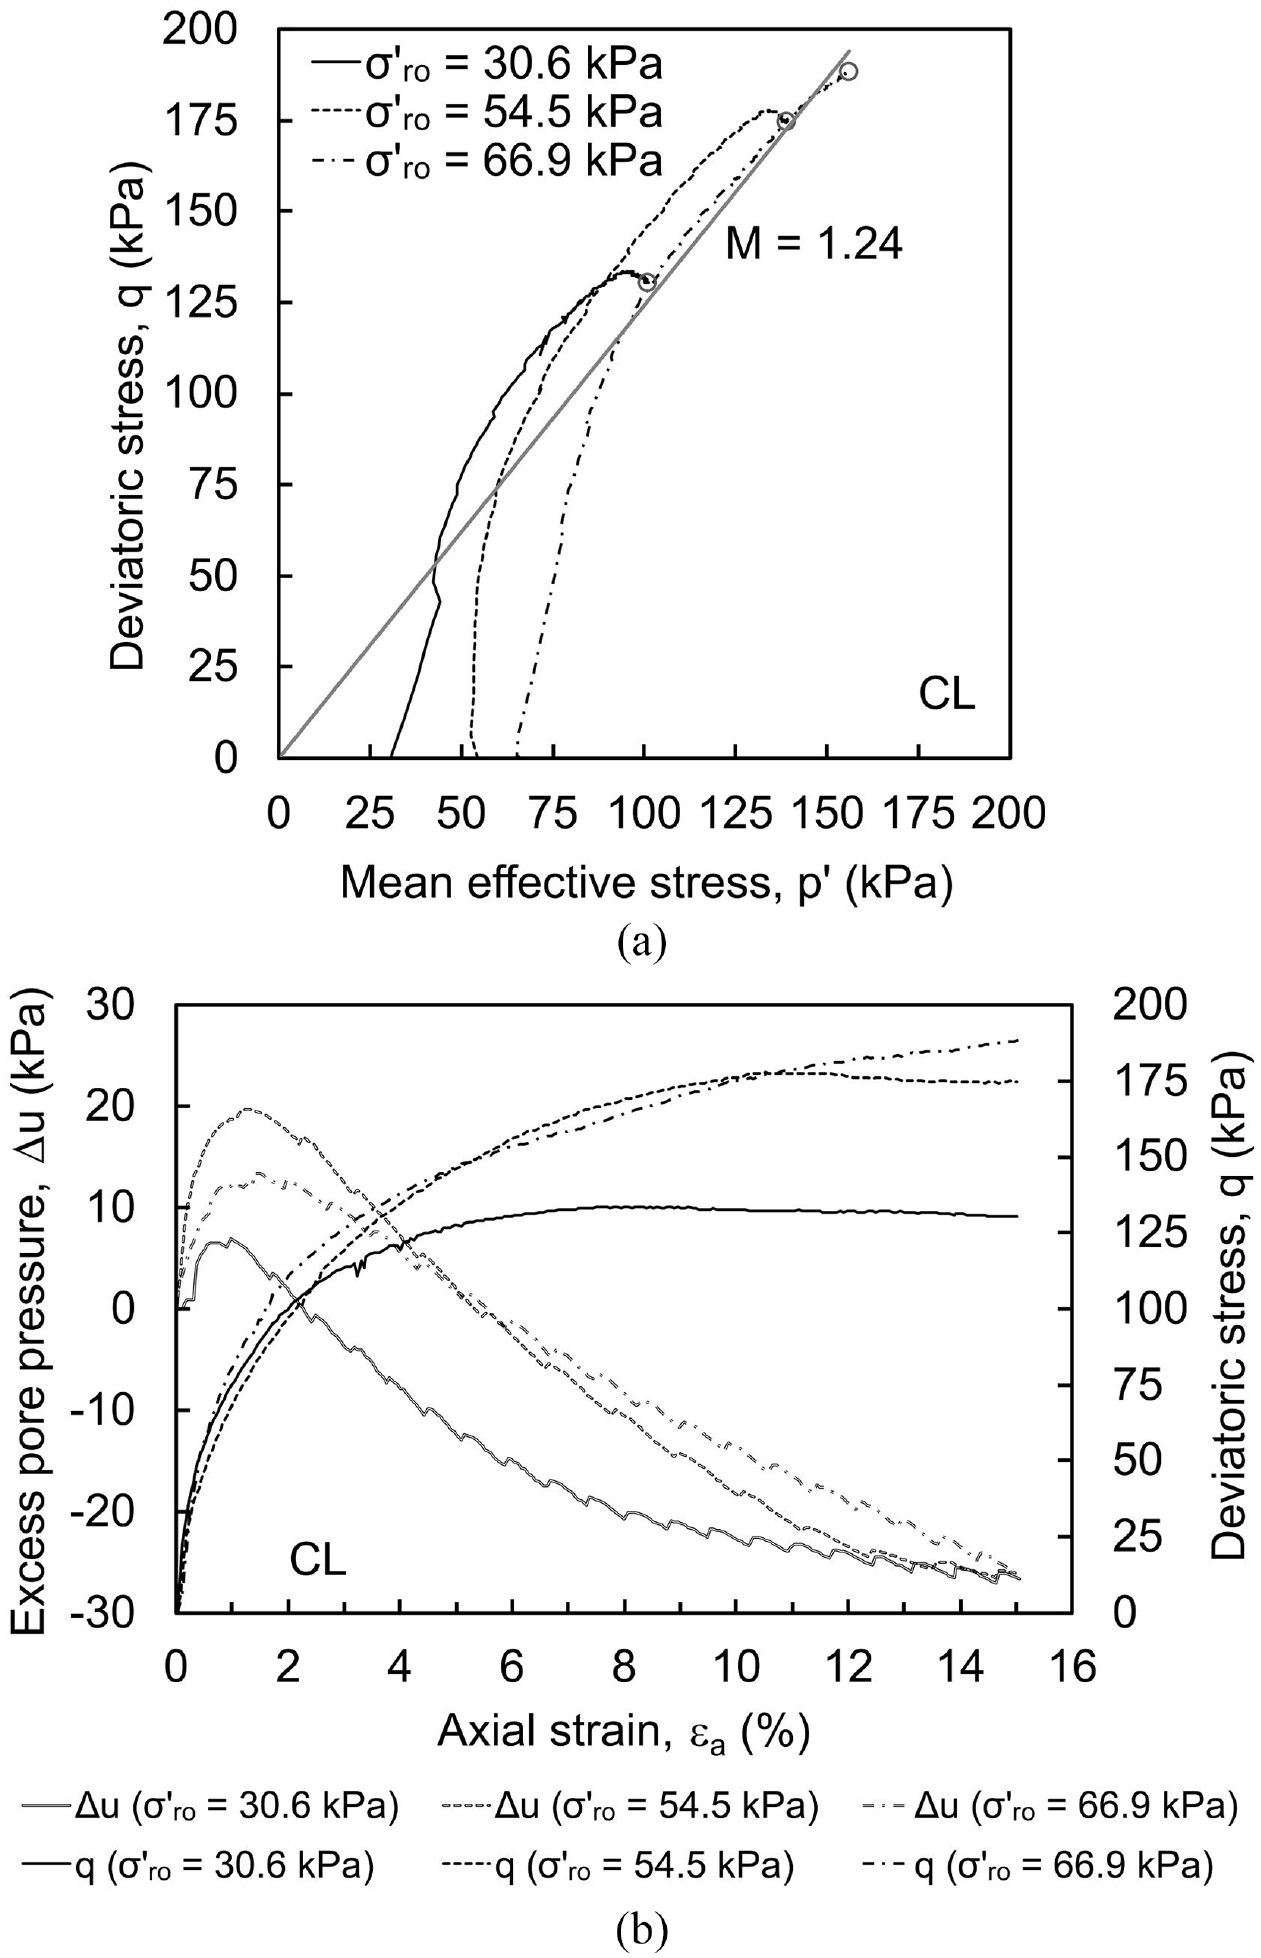
Results of CIUC tests performed on sample no. 028 (3.0–3.3 m, borehole B-2): (a) excess pore pressure and deviatoric stress versus axial strain and (b) effective stress paths.
For more complete interpretation of test results, the mean effective preconsolidation stress
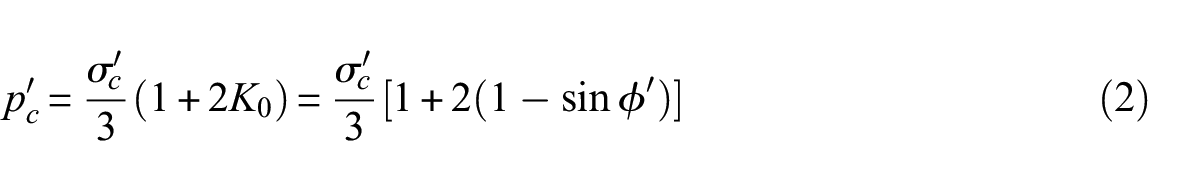
These values are reported in Table 2 for both GWTs that were used to interpret
Results of triaxial tests indicate that all samples were overconsolidated, thus in agreement with oedometer test results. Furthermore, the samples tested at the lowest effective confining stress exhibited the largest decrease in the excess pore pressure generated during the shear phase. For example, in case of sample no. 028, the excess pore pressures at the end shearing phase are negative for the samples having initial OCRp of 7.5 and 3.6, whereby in the case of the former, the excess pore pressure becomes negative nearly from the onset of shearing phase. For the sample with the initial OCRp of 2.0, the excess pore pressure remains positive at the end of shearing phase.
Slopes of critical state lines (M) for samples nos 023, 027, and 028 are very close to each other. They are depicted in Figures 19 to 21 and included in Table 2 along with the corresponding critical state friction angles.
Measurement of soil water retention curves
Wetting front migration in previously unsaturated soil reduces suction, thus leading to a decrease in shear and tensile strengths that can directly contribute to sinkhole collapse. Accordingly, repeated cycles of saturation and desaturation may play a role in the effective stress distribution within the clay cover layer. To this end, soil water retention curves (SWRCs) were measured in this investigation. The SWRC is the relationship between water content and suction and is one of the most fundamental relationships in unsaturated soil mechanics. The SWRC is used not only in computation of effective stress, but also in the analysis and modeling of deformation and failure, phase flow and transport, and water retention and drainage in unsaturated soils.
Within the scope of this study, SWRCs were measured in accordance with ASTM D6836-16 (2016) Method D by using the “chilled mirror hygrometer” or chilled mirror dew point method. WP4C potentiometer (METER, 2021), which is suitable for making suction measurements in the range of 0.1 to 300 MPa, was used. WP4C potentiometer determines the relative humidity of the air above a sample in a sealed chamber. The amount of water present in the soil for the purpose of drawing SWRC can be expressed in terms of a gravimetric water content w, volumetric water content θ, or degree of saturation S. The corresponding SWRCs are often designated as SWRC-w, SWRC-θ, and SWRC-S, respectively. SWRC in terms of total suction, which is sum of matric and osmotic suctions, is obtained from Method D whereby total suction is computed using the Kelvin equation (ASTM D6836-16, 2016). The suction for the SWRC can be expressed as a pressure ψ or as a pressure head hψ.
Undisturbed samples no. 021 (B-1) and 030 (B-2) were transported and delivered to the laboratory for further testing. Tube samples were carefully stored and handled in compliance with principles of good laboratory practice. The specimens were trimmed from the undisturbed samples to form right cylinders that fit inside the specimen retaining dishes. During the preparation of the test specimens and their placement into the WP4C test chamber, the greatest attention was paid to the preservation of the in situ properties and minimization of the amount of disturbance. The presence of limestone particles of sand and gravel sizes within the clayey soil created difficulties related to minimizing the sample disturbance.
Prior to testing in the WP4C device-specific gravity of solids, initial gravimetric water content, mass density, and dry mass density were measured from sub-samples of both samples. Furthermore, after preparation of the moist soil in retaining dish and suction measurement in WP4C device, basic geotechnical properties of each specimen were calculated based on mass and dimension measurements. This includes gravimetric and volumetric water contents at corresponding suction, volume of the specimen, mass density, and dry mass density. All calculations, including degree of saturation, saturated gravimetric and volumetric water contents, are described in ASTM D6836-16 (2016).
Specimens for testing in the WP4C device were prepared for both single-specimen (“ss”) and multiple-specimen (“ms”) methods (Figure 22). For the single-specimen method, one and the same specimen is dried from the initial (natural) water content and re-wetted until both drying and wetting branches of the SWRC are obtained. Suction in WP4C apparatus was measured at each step, that is, target water content point. Furthermore, an additional multiple-specimen method was used as well, whereby about ten test specimens with different water contents were prepared at the same time, either by oven drying and wetting to the target water content for wetting curve or by air drying from the initial water content for drying curve. In other words, in “ms” method, a set of specimens that are almost identical, but have different water contents are prepared. Selected water contents span the range of water contents that are used to define SWRC. After a series of specimens is prepared at different gravimetric water contents, total suction is measured using WP4C device for each specimen. The data points were systematically obtained by following the aforementioned procedures during the SWRC testing. Volume change of the specimens during the test was also measured to the best ability by registering the dimensions and volume of each specimen, which was then used in the further calculations. All experimental data for “ss” and “ms” methods in the form of measured suction values and calculated corresponding water contents, as well as degrees of saturation, are available in the DesignSafe data depot (GEER-Croatia Field Research, DOI:10.17603/ds2-dybk-ap06).
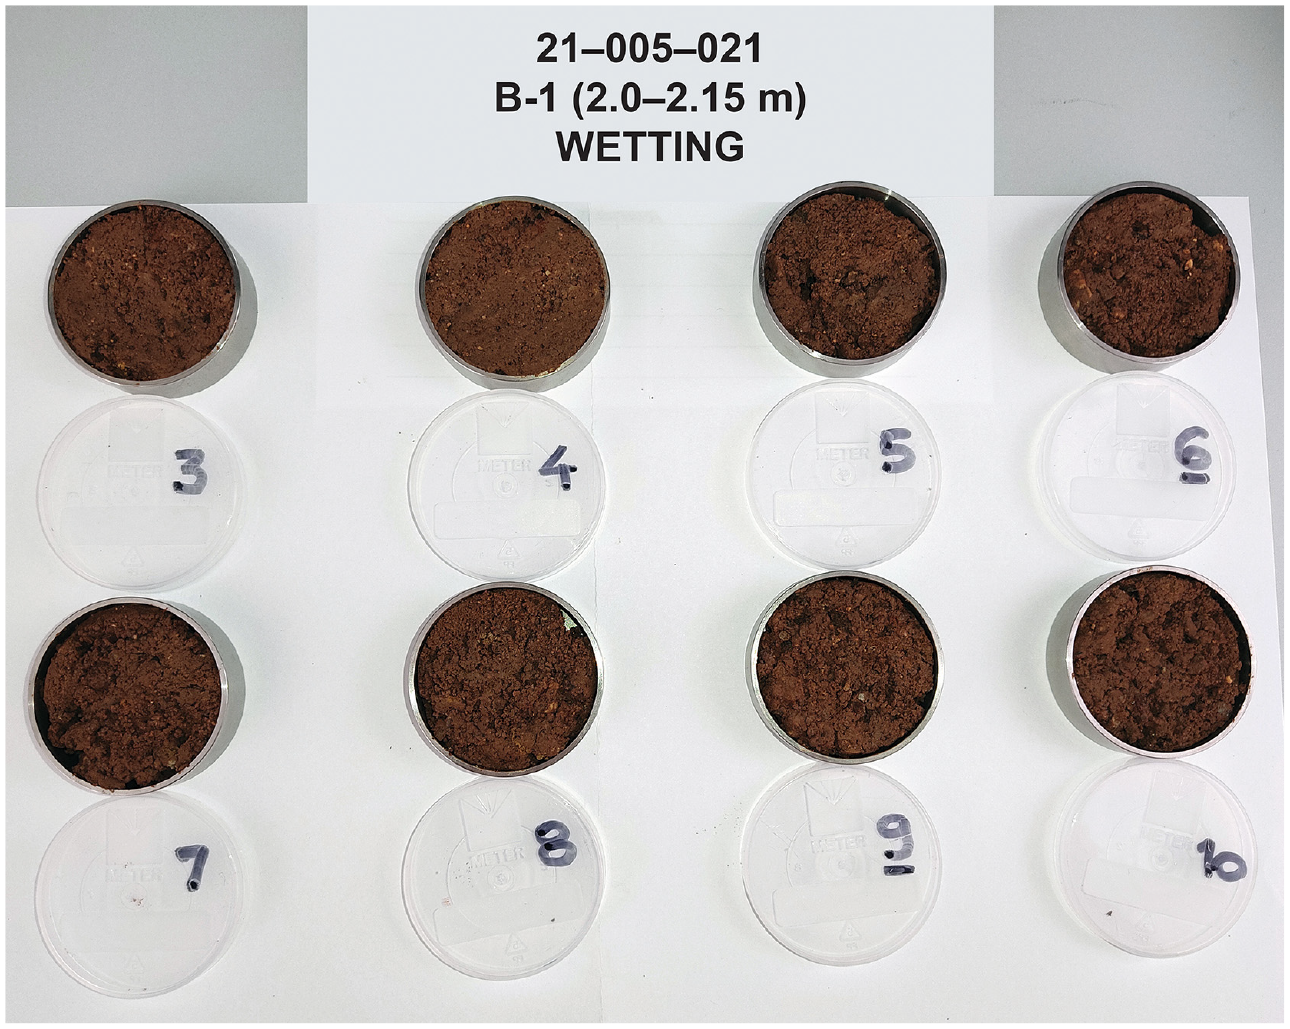
Specimens prepared for measurement of SWRC in a WP4C device: wetting branch of the SWRC, multiple-specimen method.
Results for samples no. 021 (B-1) and 030 (B-2), including drying and wetting paths, are depicted in Figures 23 and 24. In Figure 23, data are plotted in the gravimetric water content versus logarithm of suction coordinate system, while in Figure 24, the same data are plotted in the degree of saturation (S) versus logarithm of suction coordinate system.
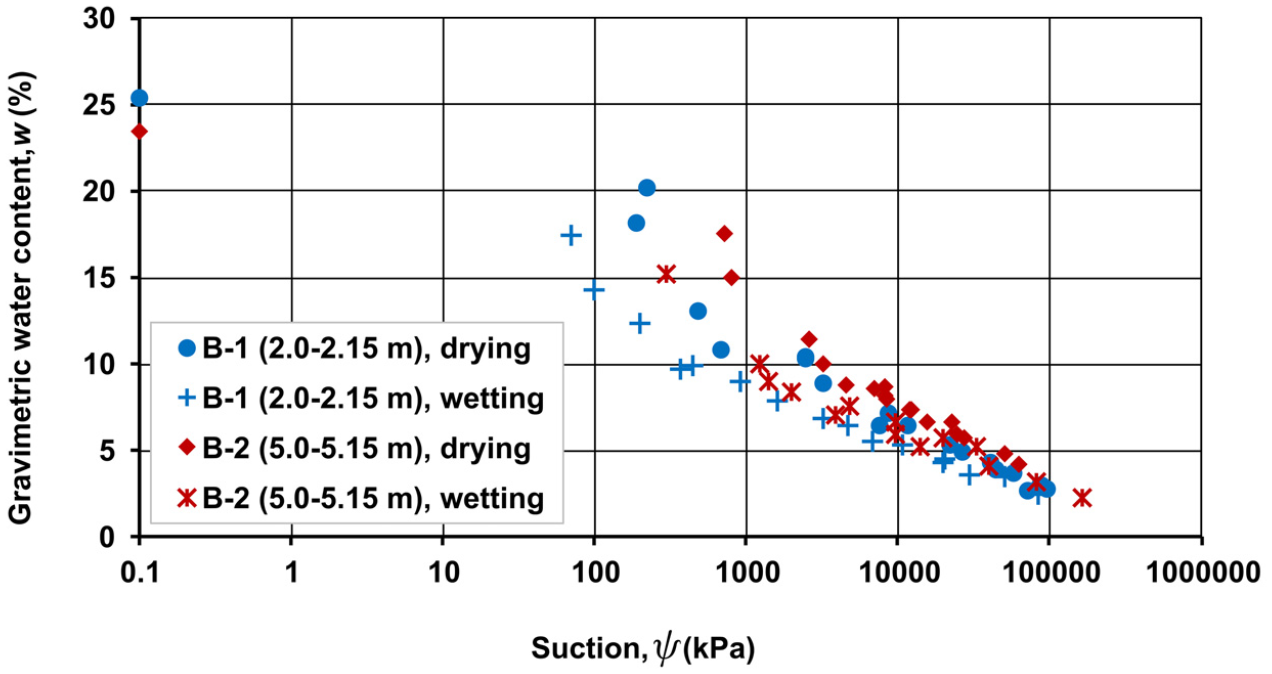
Results of SWRC measurements including drying and wetting paths plotted in the gravimetric water content versus the logarithm of the suction coordinate system (SWRC-w).
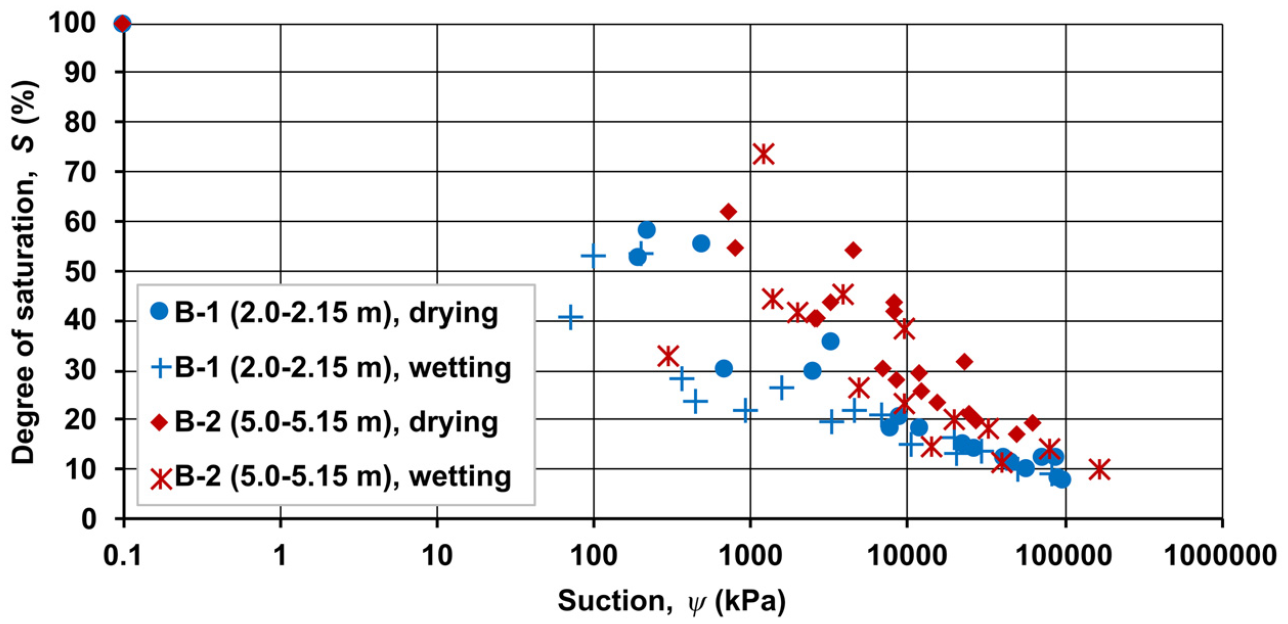
Results of SWRC measurements including drying and wetting paths plotted in the degree of saturation versus the logarithm of the suction coordinate system (SWRC-S).
The differences in SWRCs for samples obtained from boreholes B-1 and B-2 are consistent with differences in their grain size distributions. The sample from borehole B-2 contains 71.7% fines, 28.3% sand-sized particles, and no gravel-sized particles. The sample from borehole B-1 contains 53.6% fines, 43.8% of sand-sized particles, and 2.6% of gravel-sized particles. Thus, the SWRC of the latter is located to the left of the SWRC of the former. In comparison with SWRCs for clays reported in the literature, the curves obtained herein reflect the presence of sand- and gravel-sized particles. The experimental SWRC data presented herein (Figures 23 and 24) can be further interpreted based on the combination of theory and different models, which is beyond the scope of this data paper.
Discussion and conclusion
This article addresses an extensive formation of numerous cover-collapse sinkholes that occurred in the aftermath of the 29 December 2020, MW 6.4 earthquake, and its 2020–2021 sequence in Petrinja, Croatia. The reconnaissance field and laboratory investigations were led by the GEER team, composed of local and international members, along with many volunteers, and in close collaboration with the University of Zagreb, Faculty of Mining, Geology and Petroleum Engineering. The magnitude MW 6.4 earthquake hit Sisak–Moslavina County in Central Croatia on 29 December 2020, at about 12:19 PM local time (11:19 AM UTC). Three foreshocks preceded the earthquake, the strongest of which had a magnitude of MW 5.2 and was followed by numerous aftershocks (85 of them with a local magnitude ML ≥ 3.1 until 22 February 2021). The earthquake hypocenter was at 45.422°N 16.255°E, at a depth of 10 km (USGS, 2020). The location and depth of the hypocenter suggest that the earthquake occurred within the central portion of the shallow Petrinja strike-slip fault in the NE marginal part of the Adria Microplate. The total number of registered new sinkholes increased to 122, as of December 2021, appearing within two small areas of 1.13 km2 combined, surrounding Mečenčani and Borojevići villages, 20 km SE of the mainshock epicenter. Additional 49 sinkholes that already existed in the area prior to the earthquake sequence were also registered. Data collected from different sources, such as interviews, media, field observations, satellite, and aerial imagery, indicate that all cover-collapse sinkholes opened after the 2020–2021 Petrinja earthquake sequence may be considered post-seismic features. Sinkholes collapsed in clayey soil with sporadic gravel lenses covering cavernous, intensely karstified Middle Miocene carbonates. Furthermore, clayey soil is 4–10 m thick, normally consolidated to overconsolidated and exhibiting varying degrees of saturation ranging from very small value to fully saturated. This data paper presents extensive geotechnical investigation works in the area, complemented with geological and hydrological data. The investigations were undertaken to develop a basis for future models that will lead to the improved understanding of sinkhole collapse mechanisms, precursors, and the role of seismic loading.
Although the survey area was much larger than the area of mapped sinkholes, specific and unique geology was identified and related to the extensive sinkhole phenomena. The appearance of numerous sinkholes uniquely occurred only where karstic features under clayey cover exists in the vicinity of the epicenter.
Oedometer tests, conventional triaxial CIUC tests, and measurements of SWRCs were conducted on soil samples collected in the vicinity of the largest sinkhole (S001) that opened a week after the main shock. These tests were conducted on samples of sandy low and high plasticity, firm to stiff clay (CL/CH) collected from boreholes B-1 and B-2, and on samples of lean stiff to very stiff clay with sand (CL) from boreholes B-1 and B-2. The vertical effective preconsolidation stresses of 230 and 310 kPa, which were determined from oedometer tests performed on samples from boreholes B-1 and B-2, respectively, along with the results of CIUC tests indicate that CL/CH layer is overconsolidated. Furthermore, the negative excess pore pressure generated during CIUC tests conducted on sample no. 023, extracted from borehole B-1, from 4.0 to 4.3 m depth indicates that the CL layer is also overconsolidated. The GWT and thus the amount of suction present in the cover clay layers is highly dependent on the interaction of the clay aquitard and the underlying karst aquifer, as well as on the oscillation of the GWT within the clay aquitard. These processes lead to repeated drying and wetting cycles that affect the amount of suction, and thus the effective stress in the clay cover. SWRC curves contain crucial information, which in conjunction with results of CIUC tests that were performed on saturated samples can help in quantifying variation in the amount of apparent cohesion, and shear and tensile strengths. This information is vitally important for advancing the knowledge about the cover-collapse sinkhole formation mechanism. It is also noted that formation of the vertical walls that accompanied the opening of the sinkholes is expected to occur in soils exhibiting cohesion and suction-induced apparent cohesion.
It is impossible to pinpoint the exact sinkhole formation mechanism without performing the quantitative analyses. However, in addition to the crucial importance of specific geology of the area exposed to the intense earthquake sequence, the wetting and drying cycles of the cover clay layer could have played a role in the extensive formation of cover-collapse sinkholes. The geotechnical data archived in this article can be used in related future computational studies. Thus, the next step is to develop computational models of the arch-like structures of underground caverns formed in such specific environments and carry out analyses to assess the effect of the interplay of the several key factors on the formation of the cover-collapse sinkholes. Finally, it should be noted that the catastrophic formation of sinkholes in this case occurred mostly within the agricultural land with some minor damage to the residential housing. If similar events were to occur in a densely populated area, the damage to the infrastructure would have been significantly larger and it could result in the loss of human lives.
Footnotes
Acknowledgements
The authors would like to acknowledge individuals who helped tremendously with laboratory and field data collection and interpretation: Ana Duhović (University of Split, Faculty of Civil Engineering, Architecture and Geodesy), and Mirela BurečićŠafran, Evelina Oršulić, and Petar Hrženjak (University of Zagreb, Faculty of Mining, Geology and Petroleum Engineering). The authors are grateful to Davorka and Marijan Herak (University of Zagreb, Faculty of Science) for providing database of earthquakes recorded within first 2 weeks of 2020–2021 Petrinja earthquake sequence and to Igor Vilus and Ivan Landek (State Geodetic Administration of the Republic of Croatia) for providing high-resolution digital orthophoto map of the wider area.
Declaration of conflicting interests
The author(s) declared no potential conflicts of interest with respect to the research, authorship, and/or publication of this article.
Funding
The author(s) disclosed receipt of the following financial support for the research, authorship, and/or publication of this article: The work has been supported by the GEER Association that is based in part on work supported by the National Science Foundation through the Engineering for Civil Infrastructure Program under US NSF Grant No. CMMI-1266418. Any opinions, findings, and conclusions, or recommendations expressed in this material are those of the authors and do not necessarily reflect the views of the NSF. Furthermore, this work has been supported in part by the Croatian Science Foundation under the project “Experimental and numerical investigations of mechanisms in unsaturated geomaterials” (UIP-2017-05-3429). It has also been partially supported through project KK.01.1.1.02.0027, a project co-financed by the Croatian Government and the European Union through the European Regional Development Fund—the Competitiveness and Cohesion Operational Programme, and field work was partly funded by the Ministry of Physical Planning, Construction and State Assets of the Republic of Croatia. Laboratory testing was conducted at the Faculty of Mining, Geology and Petroleum Engineering at the University of Zagreb and at the Faculty of Civil Engineering, Architecture and Geodesy at the University of Split.
Data availability
GEER-Croatia Field Research, DOI: 10.17603/ds2-dybk-ap06.