
Abstract
Urban disaster risk management and reduction requires the development and periodic updating of regional building inventories. However, the development of such inventories can be very cost-intensive and time-consuming, making this a challenging task, particularly for low- and middle-income countries. This article discusses a mixed-mode building inventory data collection framework using a rapid and cost-effective remote survey technique that can be deployed in various geographic contexts. A key component of the proposed approach is an inter-rater reliability analysis of data collected from traditional sidewalk surveys and remote surveys for a small subset of buildings in the considered building portfolio, which is used to assess the suitability of the remote survey for the location(s) considered. The framework is demonstrated by developing a regional database of school buildings in the Central Sulawesi region of Indonesia. The database consists of 2536 school buildings from 454 elementary and high schools in the Palu, Sigi, and Donggala regions, susceptible to earthquake-induced ground shaking, tsunami, liquefaction, and landslides. The developed database can be used in pre-event/long-term risk analysis and management, post-event/near-real-time loss estimation, and regional-level decision-making on school assets and related policies. The database has been made available for public use and can be readily harmonized with similar databases for other regions.
Background
Modeling, quantifying, and reducing the devastating effects of natural hazards on global societies is a significant research and practical challenge. In the last two decades, disasters from natural hazards have resulted in over $2.8 trillion worth of damages globally (EM-DAT, 2021). Specifically, 20% of damage losses to natural hazards are directly related to earthquakes, and six of the ten deadliest disasters in the last 20 years are earthquake related (EM-DAT, 2021). In fact, even though earthquakes are not the most frequent natural-hazard events, moderate-to-strong earthquake events typically result in significant economic and fatal losses, post-event traumas, and distress.
One of the priority areas of the Sendai Framework for Disaster Risk Reduction (2015–2030) (UNISDR, 2015) is the investment in disaster risk reduction (DRR) for resilience through cost-effective risk reduction measures with the potential to save lives, prevent and reduce direct/indirect economic losses, and ensure rapid functional recovery and rehabilitation of the built environment. Effective DRR and management strategies are based on adequate understanding and quantification of hazard characteristics, exposure characteristics, and physical and social vulnerability features of the assets/infrastructure systems and communities at risk. Data on hazard characteristics include information on the location, likelihood, “magnitude,” and resulting local intensities of a given hazardous event, as well as the likelihood and intensity of secondary hazards triggerable by the primary hazard (i.e. in multi-hazard vulnerable regions). Data on exposure involves information on the physical assets exposed to hazards, including the structural and non-structural characteristics, use, value, and occupancy features of buildings. Physical vulnerability models use the exposure and hazard data as input and provide estimates of the likely damage, fatalities, and economic losses for given intensities of single—or multi-hazard scenarios. This article specifically focuses on the exposure component of risk. It addresses the need for regional risk studies to efficiently develop building inventories with relevant and appropriate information for their use in physical vulnerability assessments under various hazards.
Globally, various studies have developed region- and building-specific exposure data for residential, commercial, industrial, and public facilities (e.g. Anagnos et al., 2008; Chatelain et al., 1999; Crowley et al., 2012; Dabbeek and Silva, 2020; Grant et al., 2007; Paul et al., 2022; Puranam et al., 2019; Yathon et al., 2017; Yepes-Estrada et al., 2017). Building inventory developments generally rely on data collected from local government and public services, local census data, expert knowledge, remote sensing, windshield, and sidewalk survey. However, most of these data sources are typically developed for purposes other than exposure modeling. This means that inventories are typically incomplete and often require an undesirably significant amount of assumptions to perform building-specific vulnerability analysis/loss estimation exercises. Moreover, limited time, human and financial resources are the critical constraints to developing adequate building-specific exposure data for large portfolios through traditional sidewalk surveys. Hence, the development of rapid and cost-effective data collection frameworks is still of high importance to the disaster resilience community, especially given the high urbanization rate in the developing world.
This article proposes a rapid and cost-effective mixed-mode data collection framework for building inventory development using traditional sidewalk surveys and remote surveys. Before presenting the proposed framework, a summary of the relevant literature on existing exposure data collection strategies is discussed. In the proposed framework, the reliability of the remote survey is quantified through an inter-rater reliability analysis of data collected from an initial comparative survey (i.e. traditional sidewalk surveys and remote surveys for a small subset of buildings in the inventory). Decision-makers can choose to deploy the remote survey to a proportion or the entirety of the building portfolio based on the results of the inter-rater reliability analysis or considering other conflicting criteria (e.g. Opabola and Galasso, 2022). The traditional survey technique is advised when relevant data cannot be collected using the deployed remote survey. It is noteworthy that the inter-rater reliability analysis results can be used to quantify the epistemic uncertainty of the remote survey in physical vulnerability assessments. This approach (i.e. carrying out the inter-rater reliability analysis) is more informative than simply deploying a remote survey without an initial comparative survey.
The proposed mixed-mode survey approach is first described and then demonstrated through an application to develop an inventory of schools in areas affected by the 28 September 2018 Palu earthquake in Central Sulawesi, Indonesia. The moment magnitude (Mw) 7.5 earthquake caused intense ground shaking in the epicentral area, triggering liquefaction, tsunami, and major landslides, leading to over 4000 fatalities and 165,000 displaced people (UNICEF, 2018). At least 1299 schools were reported to have been damaged or collapsed, affecting about 184,000 students. Over a year after the event, 67% of the schools were still damaged and inhabitable, forcing students to attend schools in shifts due to limited temporary shelters (STC, 2019). This study has been developed as part of the ongoing “The Resilient School Hubs” project aiming to assess the multi-hazard vulnerability of school infrastructure in Central Sulawesi, looking to improve community and education resilience. Indeed, school buildings constructed before adequate building codes share structural deficiencies common to other buildings of the same structural types in the same setting, but several considerations set school buildings apart from their peers in terms of priority for assessment and retrofit. A safer and more resilient school can save valuable lives of children; serve as a temporary shelter; and help bring normalcy back to society in times of disaster, thus increasing community resilience. The collapse of a school building is particularly devastating to communities, as schools can hold an entire generation (i.e. all children of a certain age range in the society), a community’s future.
The developed inventory includes information on location, number of stories, occupancy characteristics (building use and population), age, type of lateral load-resisting systems, building materials, structural vulnerabilities, and structural conditions following the 2018 earthquake. The inventory has been made available for public use and can be readily harmonized with similar databases for different regions for global-level studies.
Existing exposure data collection strategies
Over the last two decades, several initiatives have been adopted in building inventory data collection for exposure modeling purposes. Each initiative is characterized by its own trade-off between expended resources and data completeness (or reliability). This section provides an overview of typically adopted strategies.
The data resolution (i.e. level of detail) of a building inventory is dependent on its potential use (e.g. policy development, emergency response planning, enforcement of a retrofit ordinance, damage assessment, loss estimation, recovery planning), size of the study area, time constraints and available human and financial resources (Dell’Acqua et al., 2013). Table 1 presents a list of main attributes required in building inventory development for typical practical uses. These attributes are based on widely adopted taxonomies such as the Global Earthquake Model GED4ALL building taxonomy (Silva et al., 2022), RiskScape (GNS, 2010), Applied Technology Council (ATC)-13 (ATC, 1985), the European Macroseismic Scale 1998 (EMS-98; Grünthal, 1998), HAZUS (FEMA, 2003), and the Prompt Assessment of Global Earthquakes for Response (PAGER) structural taxonomy (Jaiswal et al., 2010). The attributes presented in Table 1 have been split into three primary groups—hazard-, damage-, and loss-related. However, it is noted that some attributes classified to be primarily damage-related can also be loss-related and vice versa. For example, the building height and age are also key input for loss analysis.
Building attributes and potential use
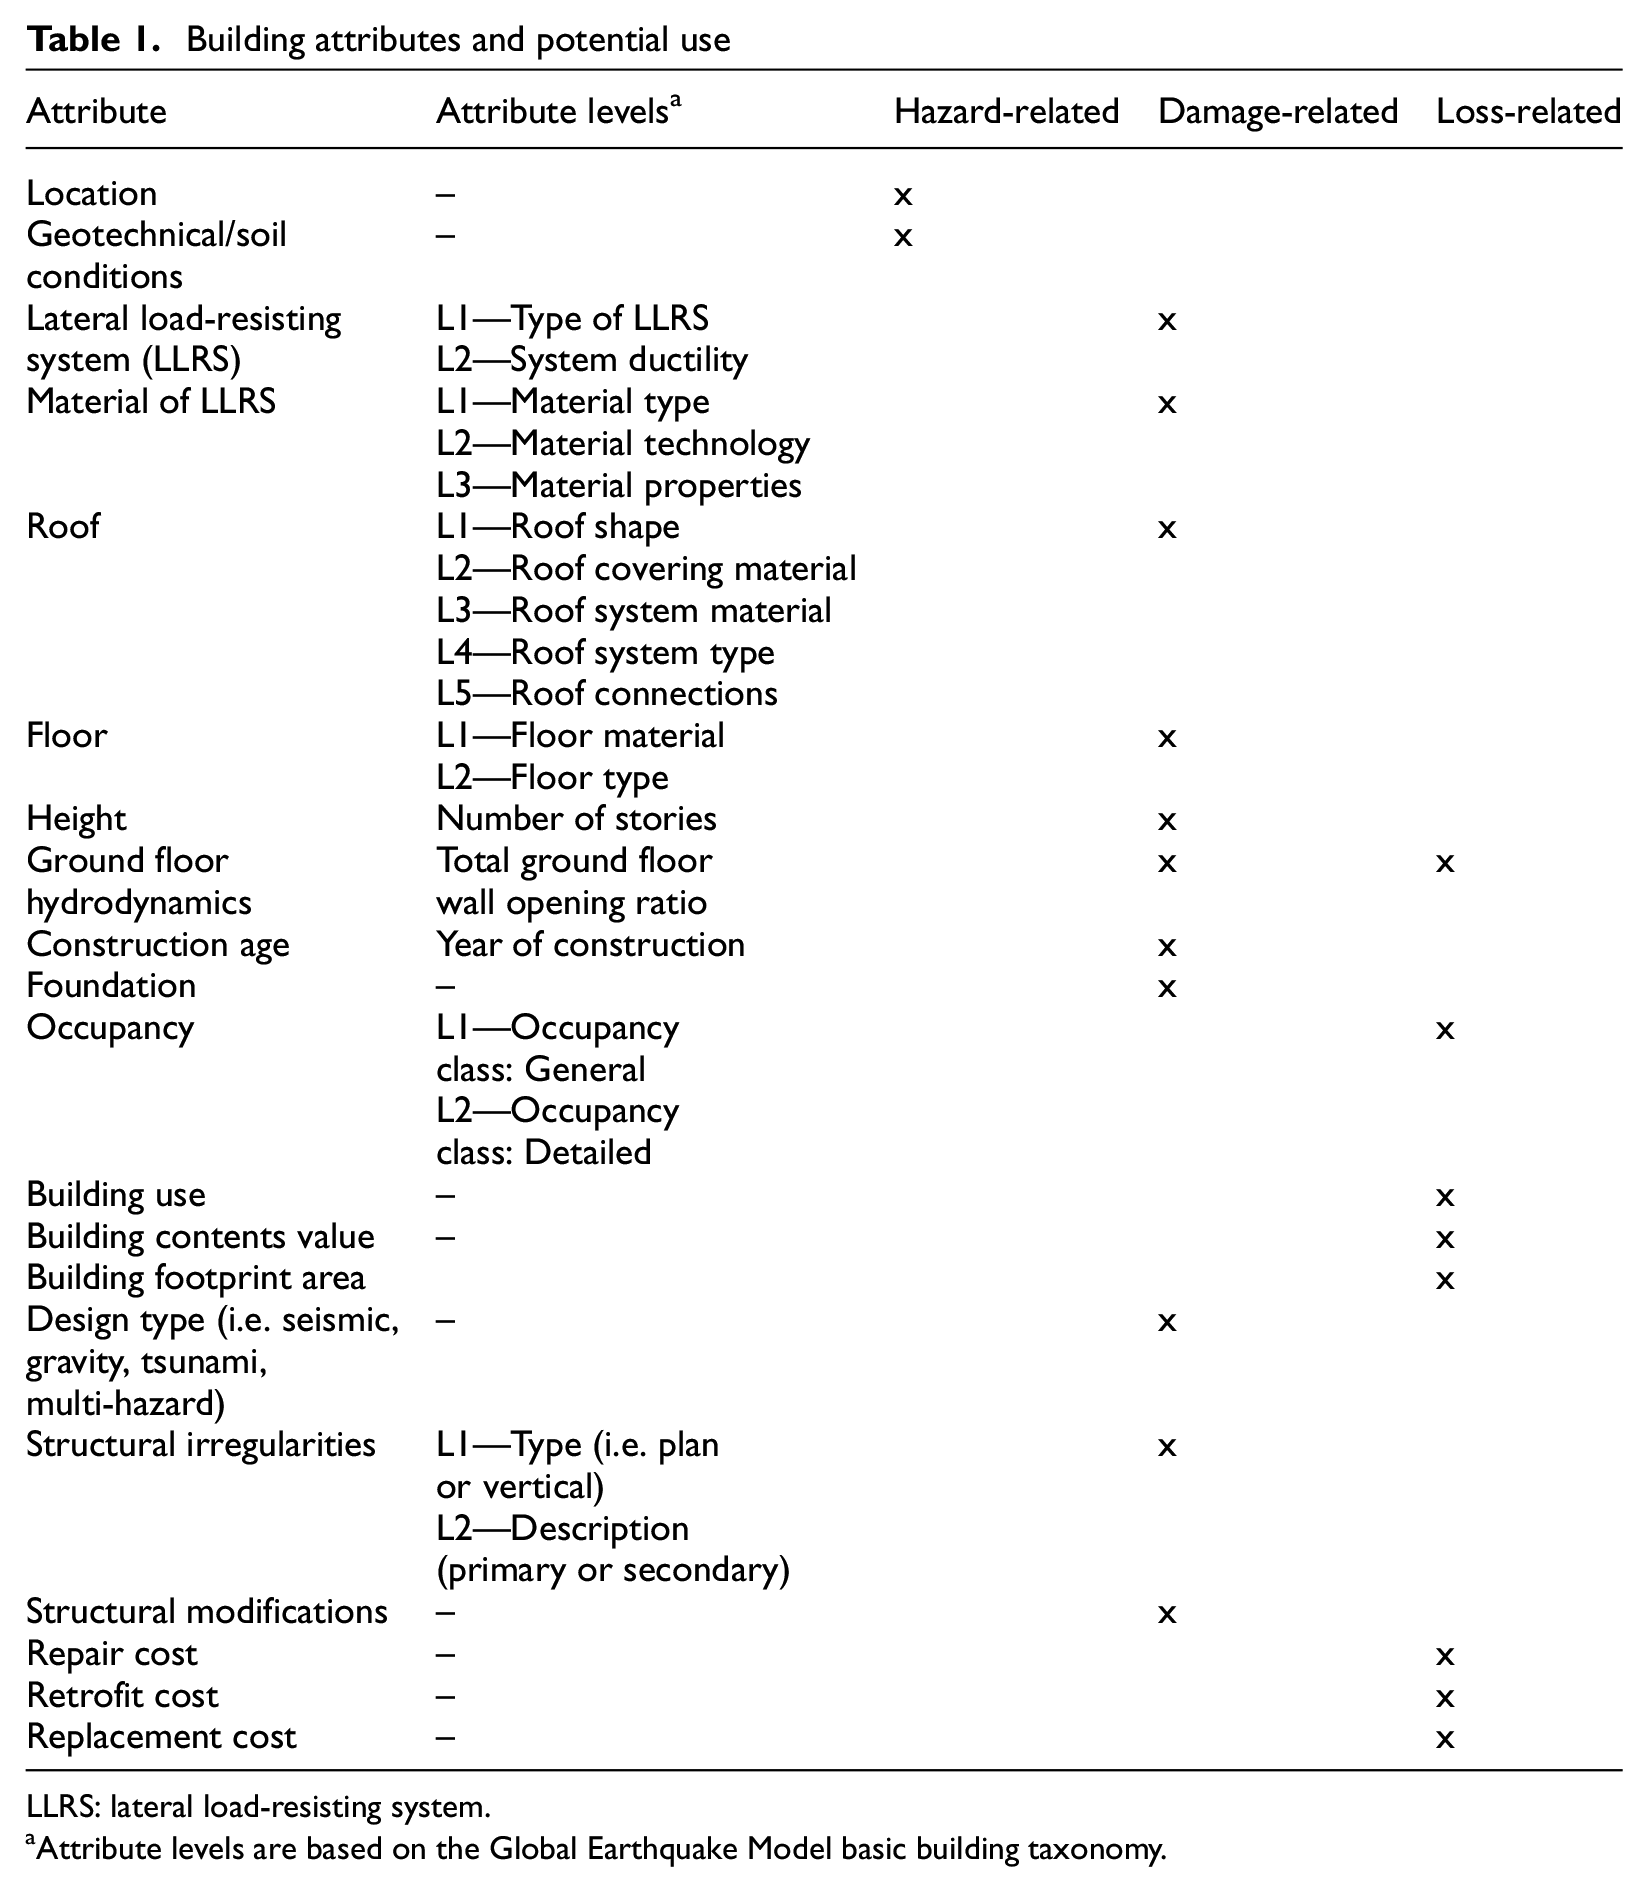
LLRS: lateral load-resisting system.
Attribute levels are based on the Global Earthquake Model basic building taxonomy.
At a regional level, exposure data is typically collected by integrating various information sources (e.g. census data, national housing distribution, remote sensing data), collection of data on representative buildings, and application of expert judgment in developing aggregated statistical building stock data. The produced aggregated statistical data on building stock are then disaggregated using various statistical interpolation and extrapolation techniques. Examples of such data collection efforts are described in Crowley et al. (2012), Ehrlich et al. (2018), Geiß and Taubenböck (2013), Matsuoka et al. (2013), Pittore et al. (2017), and Yepes-Estrada et al. (2017), among others. Because the primary data sources (i.e. census and housing distribution data) for the development of region-specific exposure data are developed for purposes other than exposure modeling and the significant level of expert judgments and extrapolation required to use these data, the reliability of any analysis using region-specific exposure data is often limited.
In some instances, building-by-building data collection is desired to improve exposure data reliability and account for building-to-building variabilities in vulnerability modeling (e.g. Sevieri et al., 2021). In such cases, windshield, sidewalk, and desk-based surveys through review of structural drawings and satellite imageries are typical techniques for collecting building-specific data. In some instances, such techniques are combined in the data collection exercise, generating hybrid data collection modes. For example, Anagnos et al. (2008) combined remote sensing data, sidewalk survey, and data from public agencies (e.g. Departments of City Planning, Housing, Building and Safety, and Public Works) to develop an inventory of 1600 non-ductile concrete buildings in Los Angeles, CA, USA. Yathon et al. (2017) developed a building-specific inventory of pre-1980 high-rise shear wall buildings in Western Canada using information from structural drawings. Challenges associated with the development of building-specific inventories include lack of or limited access to structural drawings (including structural modifications), lack of or limited access to building interiors. In addition, sidewalk surveys require a large number of trained surveyors, significant timeframe for planning and implementation, and significant financial resources. Also, given the fact that expert judgment may be required in attribute interpretation during the data collection process, having a large number of surveyors can result in significant variation in data reliability within a data collection exercise.
Montoya (2003) suggested that a combination of remote sensing, global positioning systems (GPS), digital video using manned vehicles, and geographic information systems (GIS) data can be used for building inventory data collection purposes. In recent years, technological advances and innovations have resulted in the availability of street-view images, thereby nullifying the need for digital videos. For example, Google Street View provides interactive panoramas of stitched virtual reality photographs taken from various positions along several streets globally. Furthermore, the rise in microblogging sites and social media platforms allows mining images taken at locations of interest. Such images can supplement street-view images. Virtual sidewalk surveys can be carried out using street-view images. Aerial photos from Google Earth provide better information on building adjacencies, plan irregularities, and roof construction, which a surveyor may not be able to observe from a traditional sidewalk survey. Furthermore, virtual sidewalk surveys can be conducted from the comfort of a work desk, requiring less personnel and expended time. Another advantage of the street-view image database is the availability of images of a particular structure collected over a long period of time (and at multiple times). For example, Figure 1 shows how Google Street View images can be used to track structural and non-structural modifications. The identified cases of structural modifications may be flagged for further evaluation. Also, during a remote survey, GIS data can be used to collect information on the proximity of the buildings to hazard sources (e.g. earthquake faults, rivers/coasts, slopes).
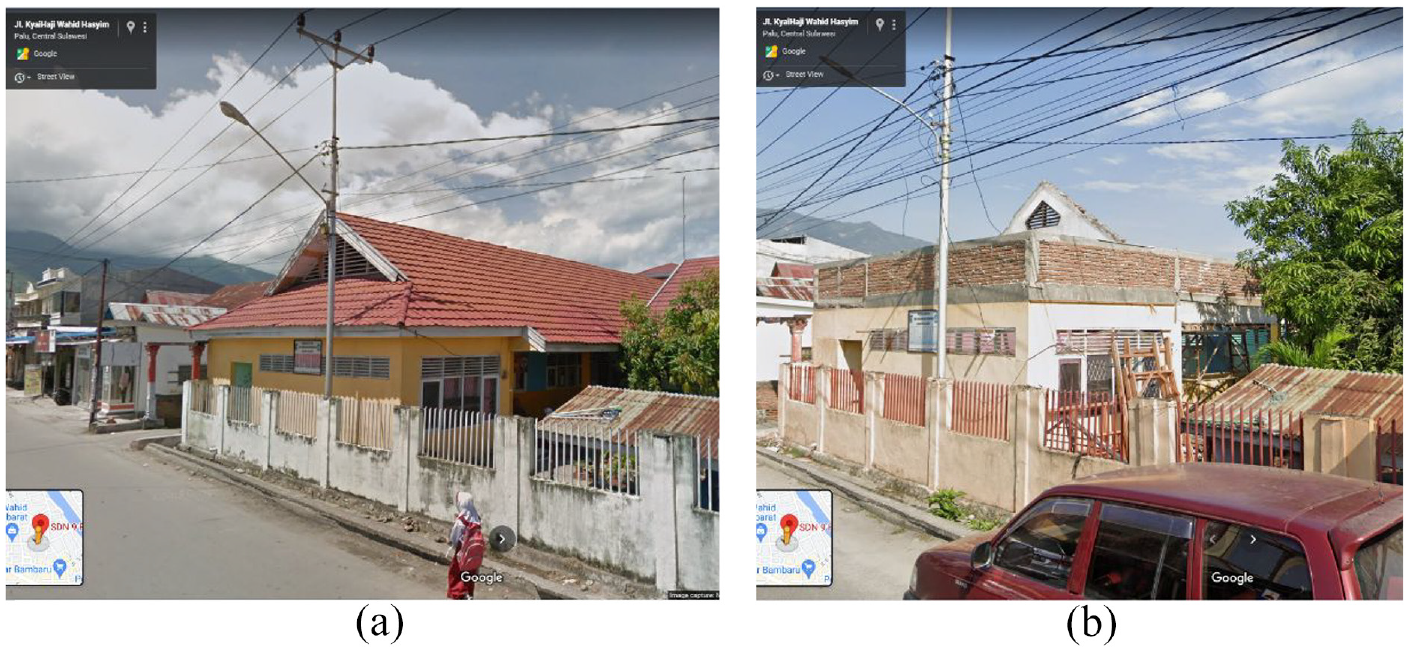
Google street images depicting structural modifications to a school building in Central Sulawesi: (a) Image from August 2019; (b) Image from October 2019.
Typically, satellite and street-view images are supplementary to a traditional sidewalk survey (FEMA, 2015). However, the review of the pros and cons of various practical data collection strategies suggests that a virtual sidewalk survey (using satellite and street-view images) can be an optimal alternative to the traditional sidewalk survey.
The following section discusses a mixed-mode survey technique using the traditional and remote sidewalk survey techniques. Regardless of the potential use or size of the study area, it is important for risk modelers to quantify and propagate epistemic uncertainties in developed exposure data due to a trade-off between expended resources and data completeness (or reliability) for any adopted survey approach. Further discussions on quantifying this trade-off using an inter-rater reliability analysis are presented subsequently in this article.
Mixed-mode data collection framework
Following the need/decision to develop a building-specific inventory for a survey area, the potential use of the inventory (e.g. emergency response planning, enforcement of a retrofit ordinance, damage assessment, loss estimation, recovery planning) is defined. It is also expected that the decision-makers have identified the key attributes (Table 1) needed to achieve the goals of the data collection exercise and also developed an appropriate data collection form for the data collection exercise. Examples of data collection forms for disaster risk assessment are available from technical handbooks and published research studies (e.g. the FEMA P-154 technical document for Rapid visual screening for potential seismic hazards (FEMA, 2015; Gentile et al., 2019; Sevieri et al., 2020)). The mixed-mode data collection framework described in this study can then be used in developing the building inventory.
The proposed framework has been developed to enable accessible, rapid, cost-effective, and comprehensive data collection on structural and non-structural attributes of large building portfolios. The proposed framework is conceptually described in Figure 2 and involves first conducting a desk-based collection of inventory data from census and other databases. Next, exposure characteristics for a subset of the buildings are evaluated using both the remote sidewalk survey (hereafter referred to as remote survey) and the traditional sidewalk survey. Finally, the results of this exposure assessment are used to determine the suitability of the remote survey approach for exposure data capture. If there is a high correlation between the remote and sidewalk survey results, then the remote survey is deployed for the region’s full building exposure database development. Each step of the approach is described in greater detail in the following sub-sections.
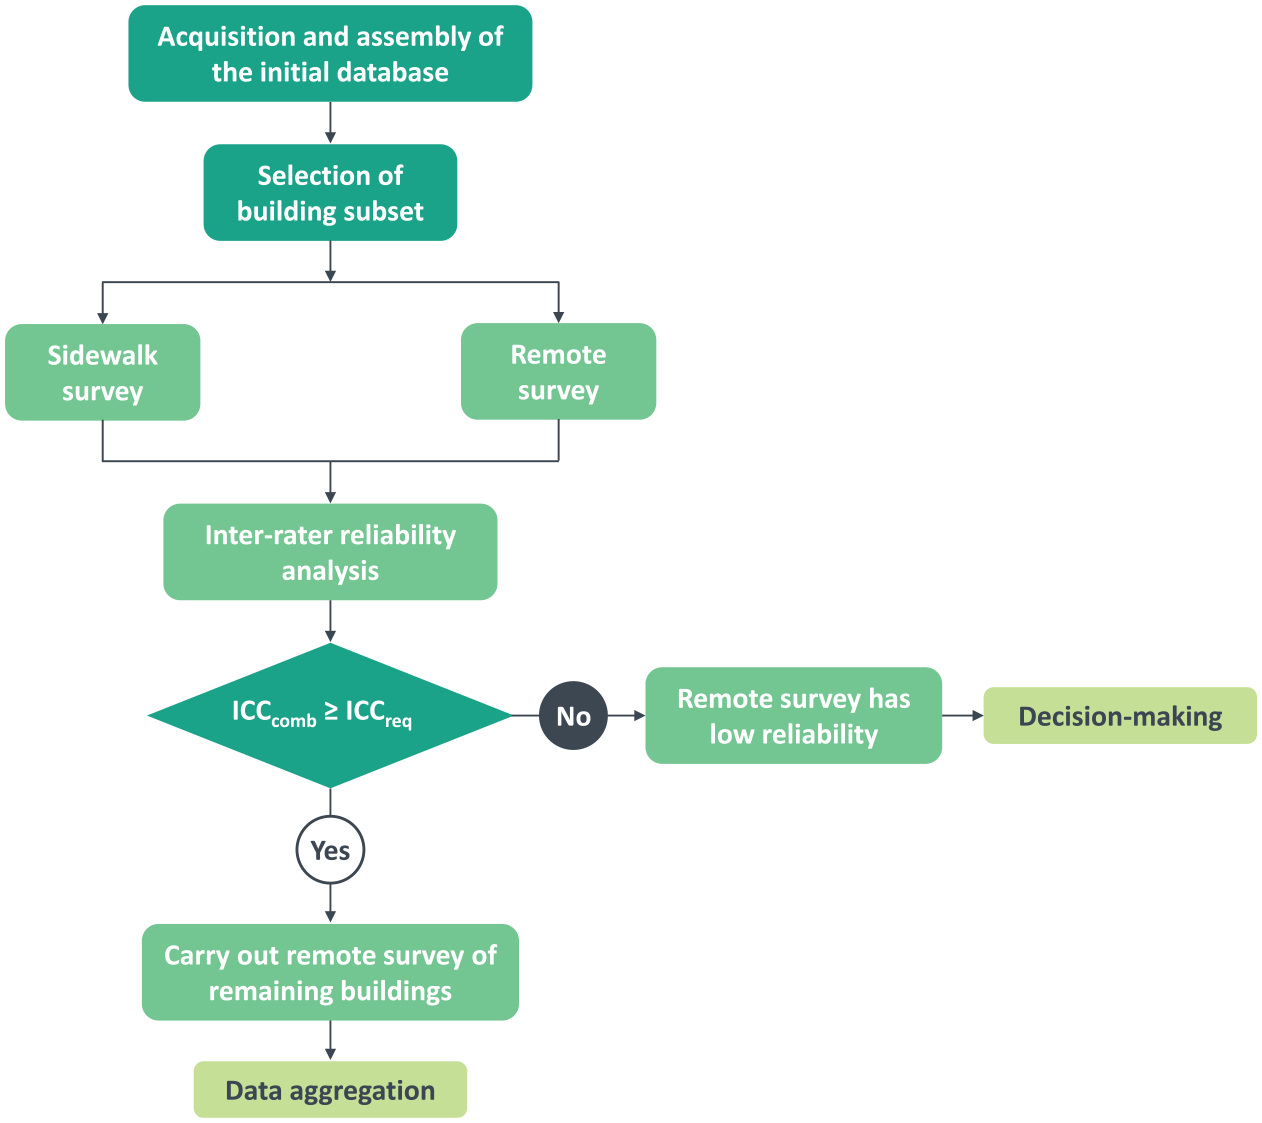
Proposed data collection framework (ICCcomb and ICCreq are the computed and required reliability indices, respectively).
Step 1: acquisition and assembly of the initial database
This step entails acquiring existing information on the buildings to be surveyed from census data, building information from government agencies, and other readily available databases. Information such as location and occupancy type, number of stories, age (if available), and number of buildings within the survey area are acquired from these sources. In addition, the building location can also be linked with available digital geotechnical databases to identify the soil types in the survey area and hazard exposure.
Step 2: identification and selection of asset subset
A subset of buildings representing the building stock is selected in this step. A stratified sampling technique is recommended for determining the appropriate sample size. First, the building stock is classified into building classes. The building classes can be defined in terms of type and material of the structural system (i.e. lateral load-resisting system), building risk category, design era of the building (e.g. pre-seismic or seismic-designed) based on the building age/year of construction (or year of any significant structural retrofit), and number of stories/building height. Depending on the homogeneity level of each building class and the entire building portfolio, a number of archetypes (or index buildings) from each building class are then selected for an inter-rater reliability analysis (discussed later in this article). The size of the selected asset subset influences the confidence level and margin of error for the subsequent inter-rater reliability analysis output. For example, the larger the selected sample size, the higher the confidence level on the inter-rater reliability analysis output.
Step 3: traditional sidewalk and remote surveys on selected asset subset
Both the traditional sidewalk and remote surveys are carried out for each building in the asset subset. As discussed above, the data collection form is completed for each survey using any data collection form developed for the data collection exercise. The remote survey involves mining open-source satellite and Google Street View images of the buildings of interest. It is also recommended that the surveyors note the average time and cost spent on data collection for both survey techniques and the travel time (and cost) between surveyed buildings for the traditional sidewalk survey. Such information provides decision-makers with valuable metrics to quantify the trade-offs between the two methods (e.g. Opabola and Galasso, 2022).
It is noted that variations in the engineering knowledge level of the surveyors can influence the output of the inter-rater reliability analysis (Step 4). To avoid introducing this factor, the survey manager could define minimum knowledge requirements for the sidewalk and remote surveys and ensure all surveyors are adequately trained. If possible, the surveyors designated to carry out the remote surveys should be part of the sidewalk survey team. This approach provides an opportunity to better assess the quality of remote survey data.
Step 4: reliability analysis
Once the sidewalk and remote surveys of the subset of the building portfolio are completed, inter-rater reliability (IRR, otherwise known as inter-rater agreement) analysis is carried out to assess the reliability of the remote survey for the intended data collection purposes. The IRR analysis is used to quantify the degree of agreement and consistency between data collected from the remote and sidewalk survey technique.
A widely used reliability index in IRR analysis is the intraclass correlation coefficient (ICC). According to available studies (Bartko, 1966; McGraw and Wong, 1996; Shrout and Fleiss, 1979), a total of ten forms of ICC have been defined based on (a) the model class (i.e. one-way or two-way random effects or two-way mixed-effects); (b) the type, which depends on how the measurement protocol will be applied in an actual application (i.e. single rater or the average of k raters), and definition of a relationship considered to be important (i.e. absolute or consistency agreement). This article does not provide detailed information on each ICC form as such information is readily available in the existing literature (e.g. Koo and Li, 2016; McGraw and Wong, 1996).
Based on a critical review of the ten forms of ICC discussed in McGraw and Wong (1996), a two-way random effect model is selected for IRR analysis of sidewalk and remote building surveying. The selected type is a single rater, and the chosen definition is absolute agreement. The corresponding formulations for evaluating the ICC and confidence intervals, given the chosen combination of model, type, and definition, are well summarized in McGraw and Wong (1996) and are not repeated here. It is also noteworthy that functions for computing ICC are available in open-source software packages (e.g. R) and commercially available software (e.g. Stata or MATLAB).
Once the ICC for each attribute is defined, the overall reliability ICCcomb can be computed as
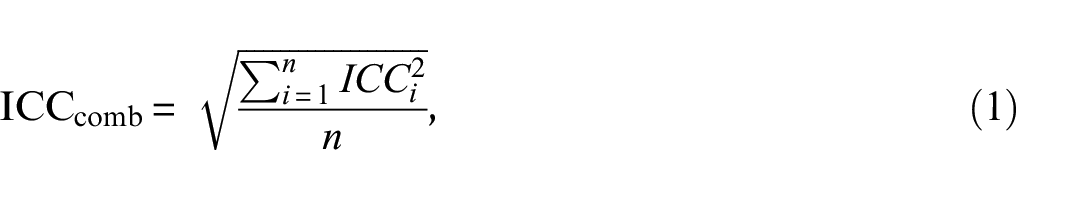
where i = 1,2, …, n is the considered attribute (e.g. plan irregularity, soft story, roof type, etc.).
The ICC of each attribute and the overall ICCcomb are compared with an acceptable reliability value (ICCreq) to assess the reliability of the remote survey technique. There is currently no consensus on ICC bounds for defining reliability classes. Table 2 shows suggested ICC bounds for various reliability classes by Cicchetti and Sparrow (1981) and Koo and Li (2016). The more recent Koo and Li (2016)’s ICC bounds are recommended for adoption.
Definition of ICC bounds for reliability classes
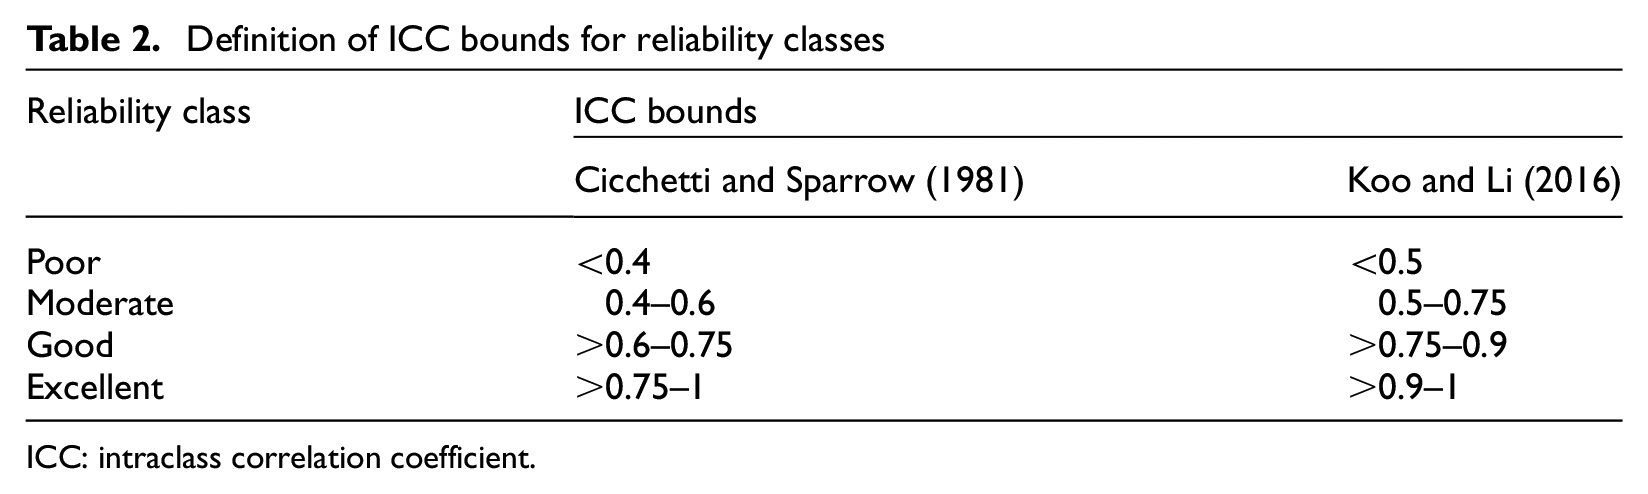
ICC: intraclass correlation coefficient.
It is noted that there is no standard value for acceptable reliability based on the evaluated ICC. The data collection end-user may decide on the acceptable reliability class and/or acceptable reliability (ICCreq). It is recommended that a reliability class “Good” is sufficient to consider the remote survey as reliable and hence suitable for deployment at a larger scale. If the computed ICC is greater than the ICCreq, the remote survey technique can be adopted to survey the building inventory. If the ICC is less than an acceptable value, the remote survey technique is not recommended. In some instances, irrespective of the computed ICC, decision-makers can choose to proceed with the remote survey with the intention of propagating the epistemic uncertainty due to low reliability during the data usage. The decision-making process can factor in the lower time and costs expended on the remote survey relative to the traditional sidewalk survey.
Step 5: remote survey deployment
The remote survey can be deployed to the remaining inventory when the decision-makers are comfortable with the data collection reliability. However, it is expected that during the remote survey exercise, there may be complex cases in which the remote survey is unable to be used. Such cases are typically related to unfavorable camera angles or obstructions from nearby buildings, fences, traffic, or trees. Such cases can be noted and recommended for subsequent traditional sidewalk surveys.
Step 6: data aggregation
The remote survey can only provide data related to structural and non-structural attributes of the surveyed buildings. For loss estimation purposes, information on occupancy characteristics would need to be derived from other sources, as described in Step 1. Step 6 entails harmonizing the data from different sources and desk studies with the remote survey data to develop a comprehensive database.
Case study: schools in Palu, Sigi, and Donggala regions of Indonesia
The proposed framework is applied to capture exposure data regarding schools in Indonesia affected by the 28 September 2018 Central Sulawesi earthquake and triggered hazards. Sulawesi island is located at the junction of the Australian, Sunda, and Philippine plates (Hall, 2012; Hamilton, 1979; Prasetya et al., 2001; Spencer, 2011). Due to geological, geotechnical, and hydrological factors on the island, the region is susceptible to ground-shaking-induced liquefaction, landslides, and tsunami. The 2018 Central Sulawesi event resulted in significant losses to the school infrastructure in Palu, Sigi, and Donggala due to the ground shaking and triggered tsunami and liquefaction. The predominant construction types for school buildings are one-story confined masonry buildings and two- to three-story reinforced concrete (RC) frames. Typical damages to school buildings include out-of-plane failure of masonry walls, damage to poorly confined gables and walls (Figure 3a and b), damage to concrete columns and beams (Figure 3c), and floor slab cracking due to differential settlement. Most of the damage can be attributed to the use of poor construction materials and poor design practices, and significant degradation of the structures due to corrosion-induced reinforcement degradation (EEFIT-TDMRC, 2019).
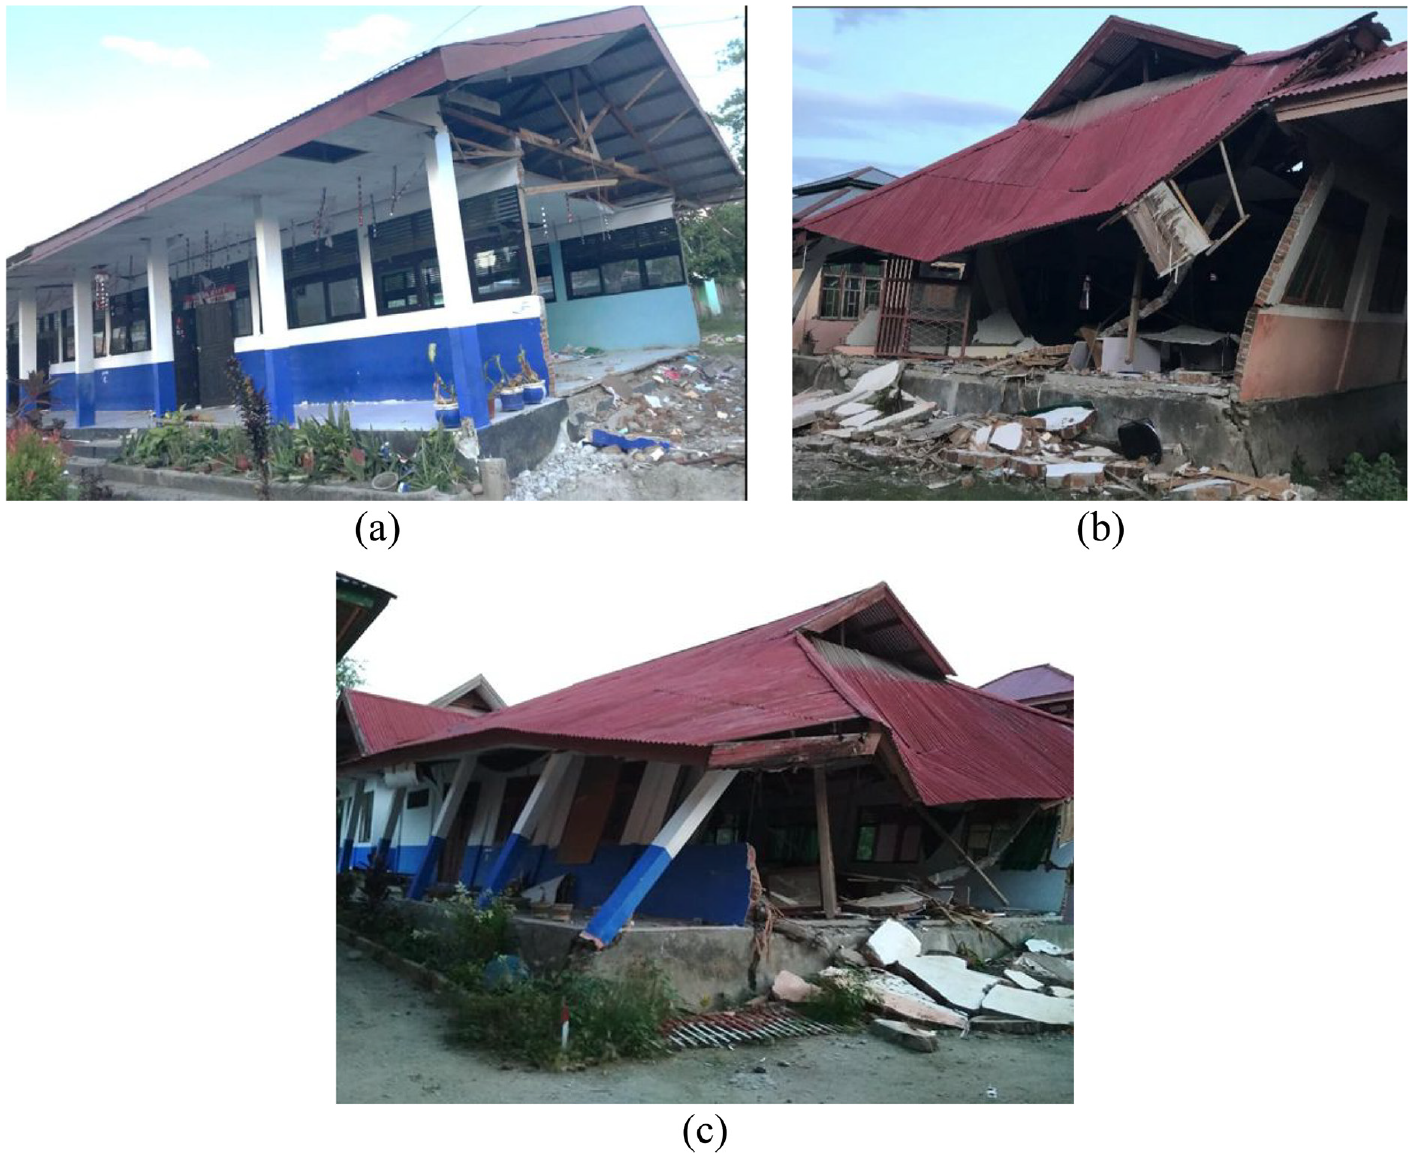
Structural damages to school buildings after the 2018 Central Sulawesi event (EEFIT-TDMRC, 2019).
Initial schools database
The initial data source for this study was the Ministry of Education, Culture, Research, and Technology website (MoECRT; https://dapo.kemdikbud.go.id/, last accessed 11 November 2021), which provides information on school names, location, and occupancy (i.e. number and gender of students and teachers). The MoECRT website also includes information on school ownership, that is, state- or privately-owned. The majority of the privately-owned schools belong to religious organizations, with the schools located in the vicinity of the proprietor church or mosque.
According to MoECRT, there are 3782 elementary and junior high schools in the Central Sulawesi region. Out of these, 220 are located in Palu, 336 in Sigi, and 451 in Donggala (see Table 3). Most schools in Palu, Sigi, and Donggala are government-owned (85% and 80% of elementary and high schools, respectively).
Distribution of elementary and junior high schools in Palu Sigi and Donggala
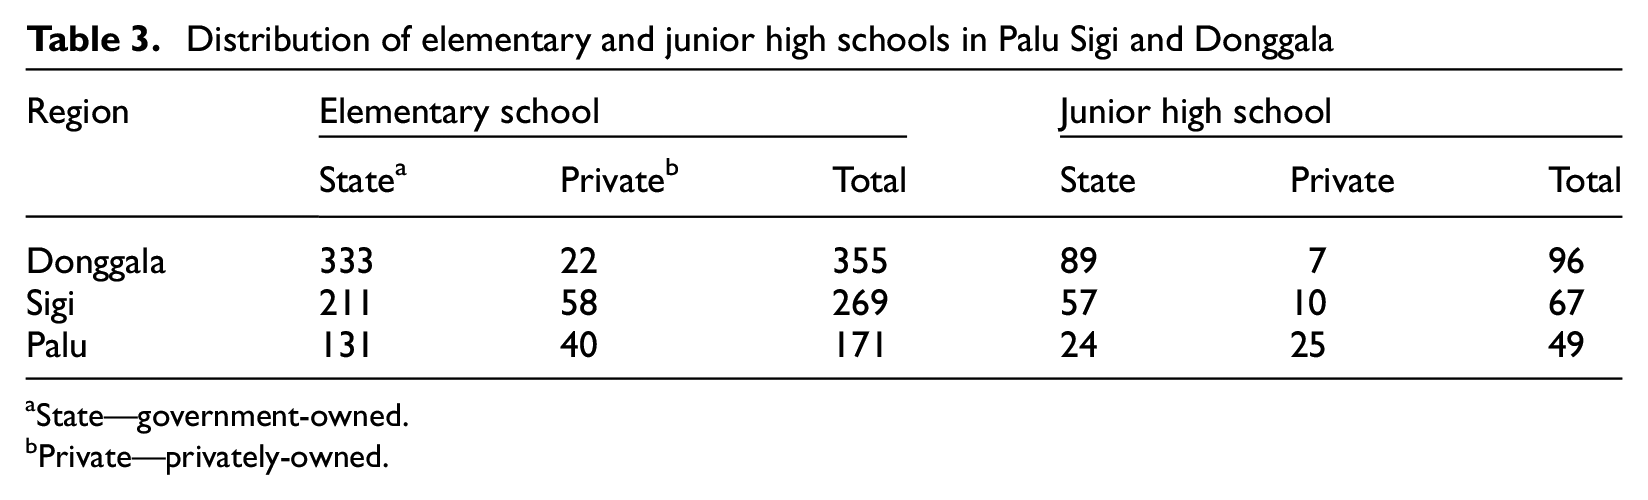
aState—government-owned.
Private—privately-owned.
A list of 454 schools in Palu, Sigi, and Donggala was created from the MoECRT website. The list consisted of 273 schools in Palu (including Palu East district, Palu West district, Palu South district, Palu North district, Mantikulore district, Tatanga district, Tawaeli district, and Ulujadi district); 131 in the Sigibiromaru, Dolo, Dolo South, Dolo West districts of Sigi regency; and 50 in the Central Banawa and Banawa South districts of Donggala.
The 454 schools have been selected to have an even distribution of considered hazard sources. All the buildings are susceptible to ground shaking combined with liquefaction, landslides, tsunami, and/or floods. As shown in Figure 4, many schools in the central Sulawesi region are located close to the sea. This is because these schools around the coastal area serve the fishermen communities along the coast. Hence, the location of some of the schools is influenced by the socio-cultural and economic situations in the region.
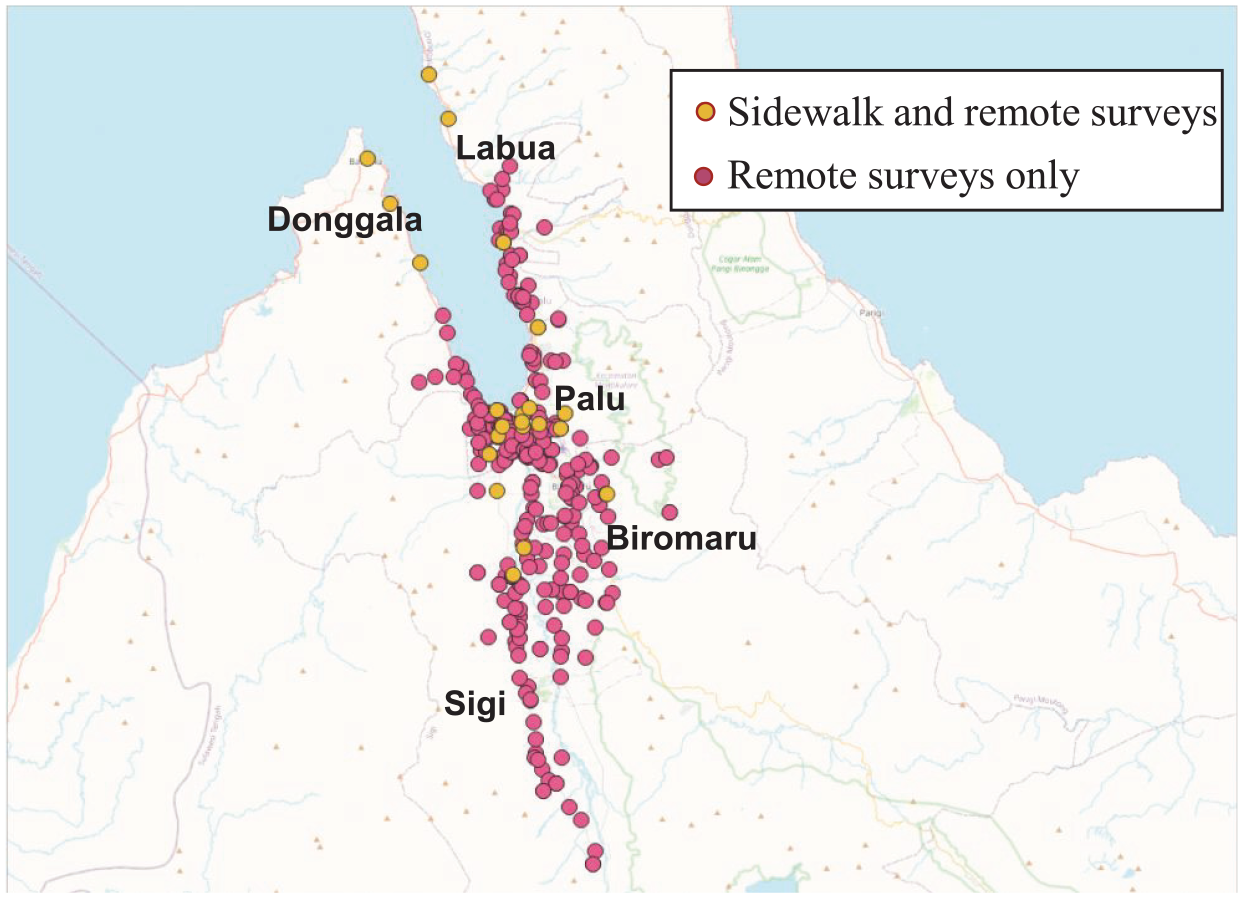
Location of the surveyed 454 schools in Palu, Sigi, and Donggala (IRR analysis was carried out using results from the 30 schools with sidewalk and remote surveys data).
An electronic rapid visual survey (eRVS) form was developed using the koBoToolbox platform for the data collection process. The eRVS form contains questions necessary to assess the multi-hazard exposure and vulnerability of the buildings using attributes presented in Table 1. In addition, the eRVS collates information on the structural configuration and attributes, non-structural attributes, and irregularities of the structures (i.e. vertical and in-plan irregularities). The eRVS form is provided together with the developed database (Opabola et al. 2022).
Selection of building subset for IRR analysis
There is a high level of homogeneity in school buildings in Central Sulawesi because most of the schools are government-owned. For government-owned schools, the architectural layout and structural configurations are similar. On the other hand, privately-owned schools can have slightly varying structural configurations and are typically multi-story (mostly two-stories).
Using available information on the 454 schools in the initial database, 30 schools with a total of 206 buildings were selected. The selection process entailed considering hazard history, proximity to hazard sources (i.e. proximity to the liquefaction zones from the 2018 event, proximity to Palu river, and proximity to the coastline), building age (i.e. considering if the buildings were constructed pre-2012 or post-2012 Indonesian seismic code), proprietorship (i.e. government or private), damage history from 2018 event and post-2018 intervention history. The post-2018 history considers that new buildings have been constructed in some schools, some schools have relocated to new sites, and some schools have been repaired or retrofitted. A graphical representation of hazard interaction and the post-disaster damage severity of the selected 30 schools following the 2018 Central Sulawesi event is presented in Figure 5.
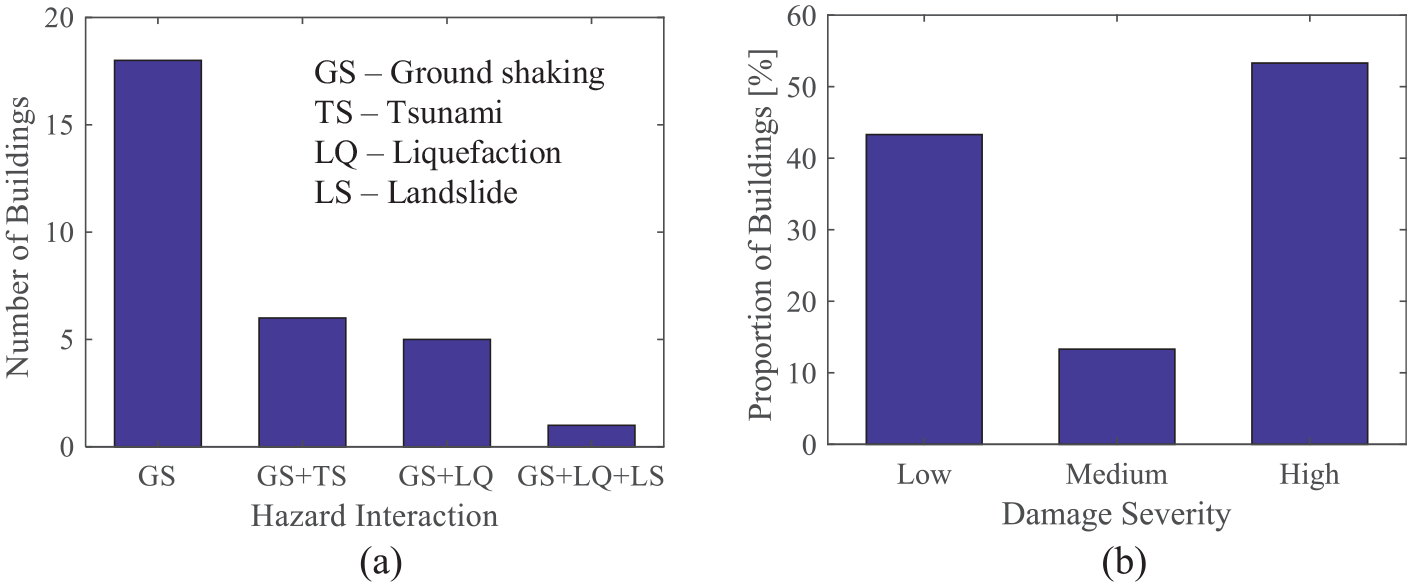
Graphical representation of (a) hazard interaction; and (b) school building damage severity of the selected 30 schools following the 2018 Central Sulawesi event.
The location of the 30 schools is shown in Figure 4. Single- and multi-story structures are represented in the subset of 30 schools. Expectedly, given the prevalence of single-story school buildings, 87% of the buildings in the 30 schools are single-story. Ninety percent of the 30 schools are government-owned.
Sidewalk visual survey
The sidewalk survey of the 30 schools was carried out by a group of six local assessors in Indonesia over a period of 10 days using the developed eRVS form. The expended time includes the travel time to/between surveyed buildings and the inspection time of each building. The COVID-19 pandemic significantly influenced the pre-planning and execution phase of the sidewalk survey.
The sidewalk survey also provided an opportunity to interview the school principals to validate the occupancy information available on the MoECRT website. The principal interviews were organized as part of the data quality control exercise.
Remote survey
One assessor carried out the remote survey of the 30 schools, including 206 buildings, over a period of less than 2 days. The remote survey entailed sourcing images from Google Street View and aerial view software, social media platforms (Facebook and other microblogs such as Twitter and Instagram), and school websites. Using these data and images, the eRVS form for each building was completed. Compared with the sidewalk survey, there were no health and safety issues (COVID-related or otherwise) with the remote survey.
IRR analysis
IRR analysis of the data collected from the sidewalk and remote surveys on the 206 school buildings was carried out. Table 4 shows results from the IRR analysis for relevant data on generation information and structural and non-structural attributes. As shown in Table 4, all the attributes indicate an excellent level of agreement. An ICCSRSS of 0.99 was computed for the considered attributes. The excellent level of agreement was attributed to the typical simple configuration and high homogeneity level of the school building portfolio. Lower ICC values may be computed for building portfolios with low homogeneity levels and more complex architectural and structural configurations.
Results of comparative study between sidewalk and remote survey for the 30 schools
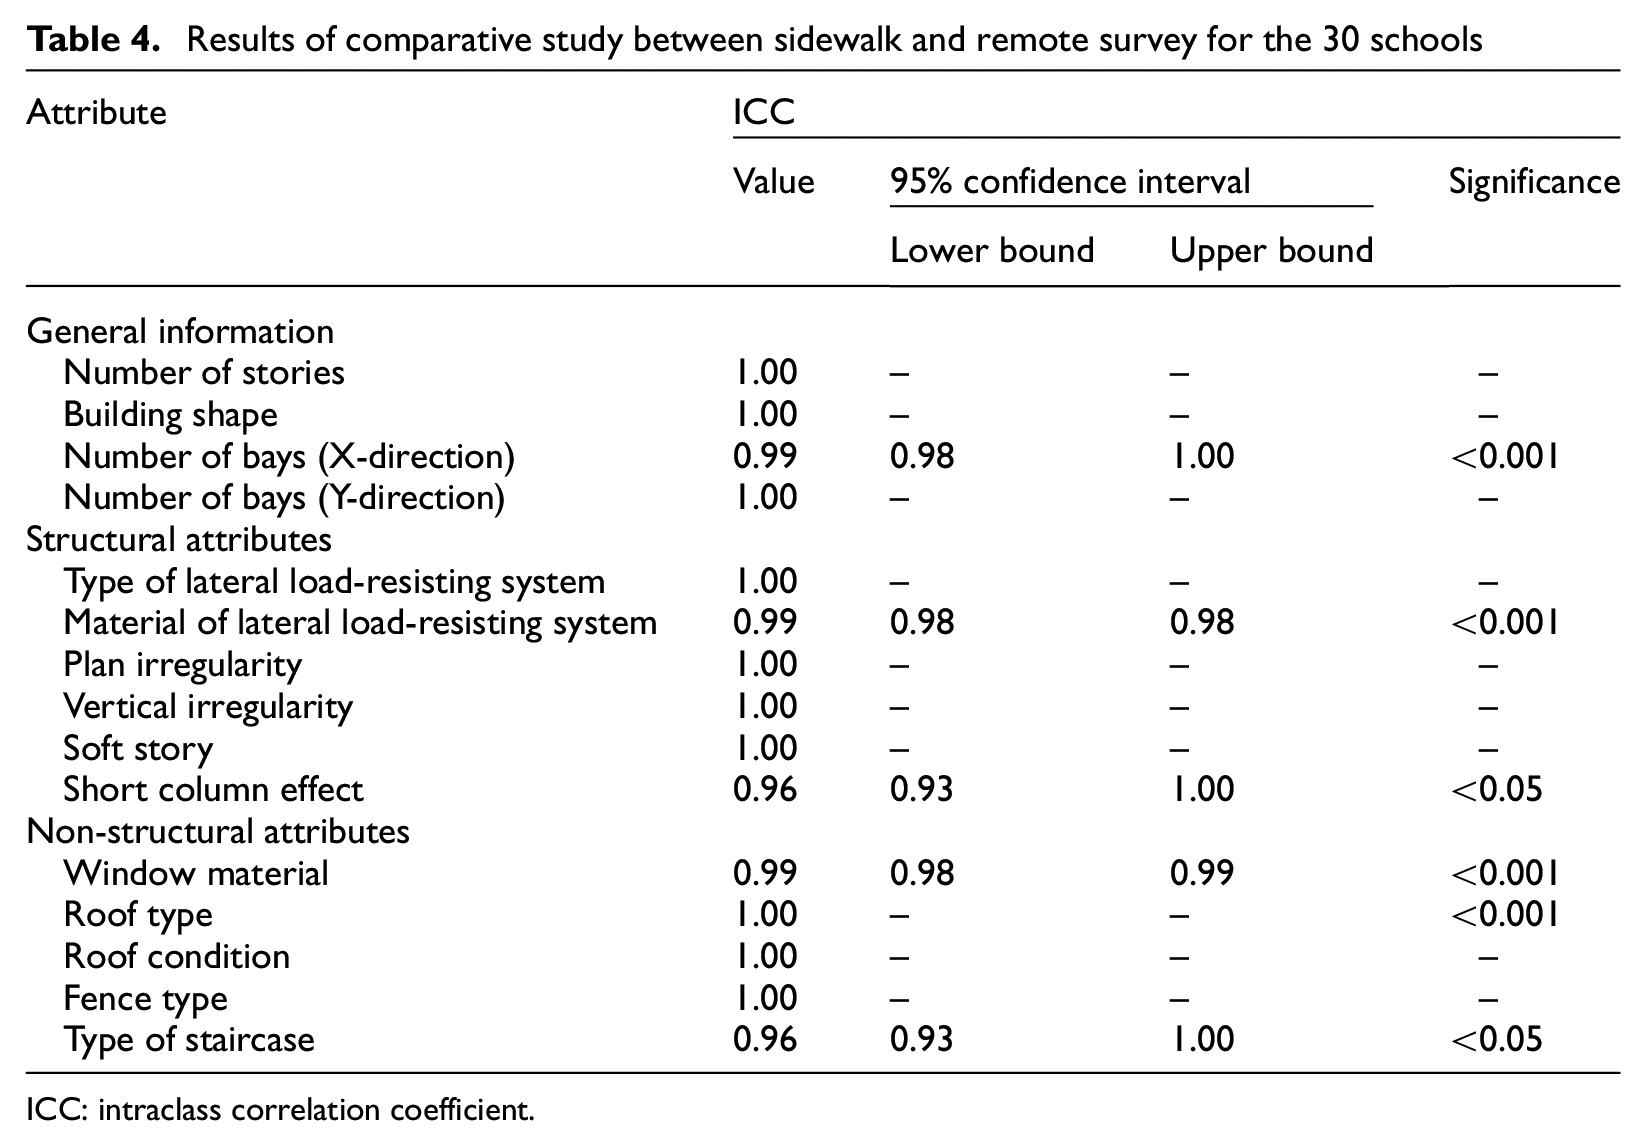
ICC: intraclass correlation coefficient.
Deployment of remote survey for building stock
Given the satisfactory reliability assessment exercise over the 206 school buildings in the 30 schools, the remote survey was deployed to the other 424 schools (2330 school buildings in total). Two assessors carried out the remote survey of the 2330 school buildings over a period of 31 days.
Observed challenges with the remote survey techniques in Central Sulawesi
A few schools in Central Sulawesi are located in remote, non-motorable locations; hence, no street-view images are available for them. For such schools, only satellite images were used for the data collection exercise. Hence, applying the remote survey technique in marginalized communities with no street-view coverage may be challenging. As previously discussed, a traditional sidewalk survey would need to be deployed in such cases.
In certain instances, for example, in cases where the side view of the building is parallel to the main road, the camera angles of the street-view images may reduce the data collection reliability. Also, obstructions from nearby buildings, fences, traffic, or trees limits can limit the data collection reliability.
For one of the 206 buildings surveyed for the inter-rater analysis, the surveyors observed reinforcement corrosion in a structural component during the traditional sidewalk survey exercise. The light spalling and reinforcement corrosion could not be detected through the remote survey exercise. However, it is noteworthy that a traditional sidewalk survey may only be used to detect reinforcement corrosion in cases where spalling has occurred.
Data aggregation and quality control
The data collected from various sources were finally merged together to develop the building inventory database, which provides details of the exposure characteristics at different levels, as shown in Figure 6. As indicated earlier, the sidewalk survey (together with the principal interview) was adopted to evaluate the quality of the information available on the MoECRT website and the remote survey.
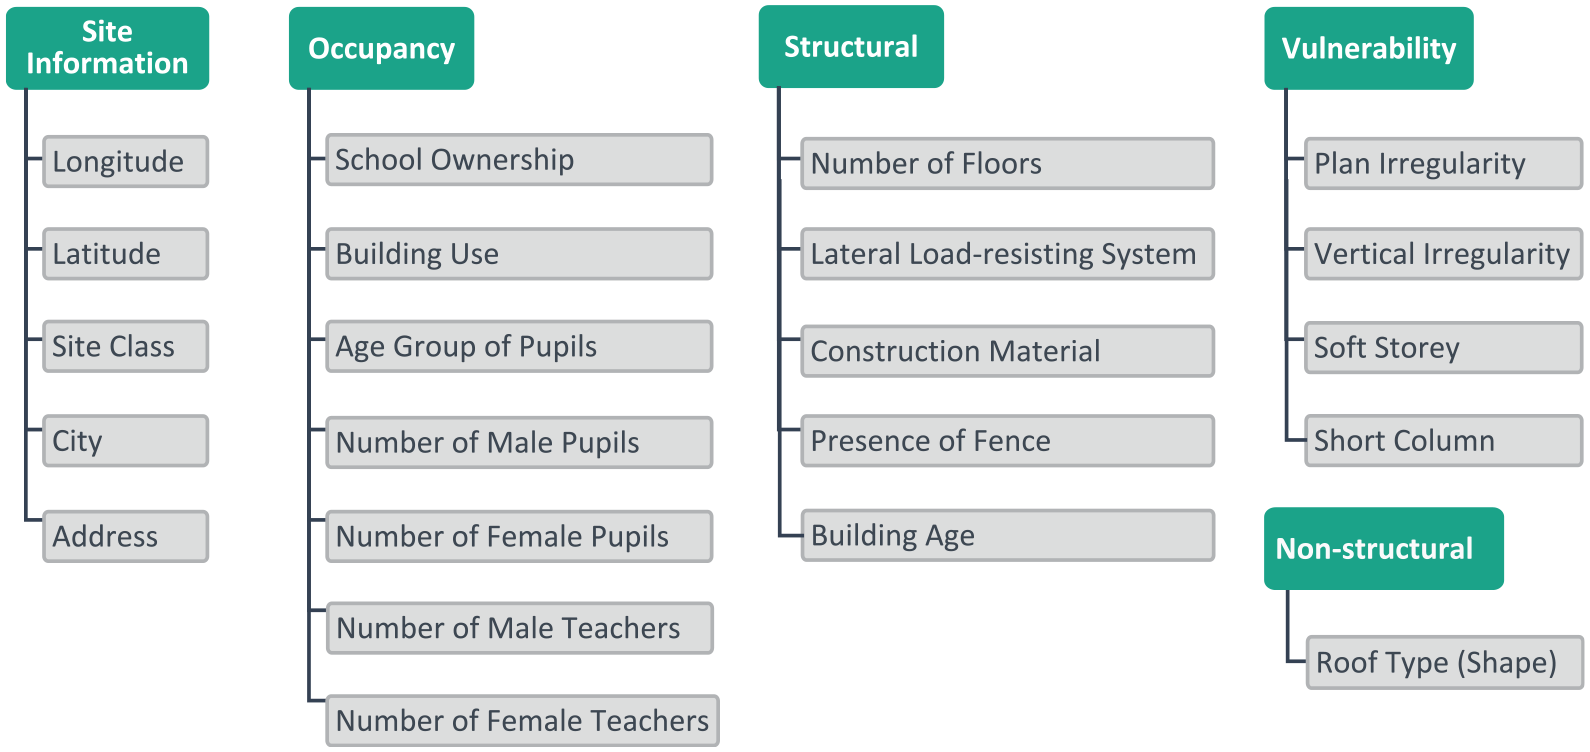
Information available in the database.
The information provided in the database are attributes presented in Table 1. The first level of details pertains to generic site information, which is necessary for the building identification, on one hand, and site-specific hazard characterization, on the other hand. Site information incorporates the addresses of the schools, obtained mainly from the MoECRT website, in addition to the geographic coordinates, that is, longitude and latitude. Such coordinates are readily available on the Google Maps platform. The second level of detail describes occupancy information for each school, consisting of school ownership type (e.g. public, private) and occupancy type for each school building (e.g. classrooms, offices, libraries, labs, halls). The number of students and staff, together with their gender distribution, are also provided.
The third level of detail is dedicated to the structural characteristics of each school building. Such characteristics include the number of stories, which serves as an indicator of the building height, and building age, which serves as a proxy for the design code level (if any). The type of lateral load-resisting system (e.g. RC frame, steel frame, wooden structure) and the construction material (e.g. steel, RC, wood) are also provided, which offers an idea about the expected structural response against different hazards. The presence of a fence around the school buildings is also reported, together with the type of fence system such as picket, half-picket, and solid. Fence systems serve as barriers against tsunami actions. Structural vulnerability indicators are also incorporated in the developed database, which are quite significant as they might cause adverse effects on the structural performance of buildings. Those indicators include plan and vertical irregularities, and pounding potential. The main horizontal irregularity that could be easily identified via the remote survey is the plan shape, which can be detected using aerial/satellite imagery provided by Google Maps/Google Earth. Irregular plan shapes (e.g. L-, T-, C-shaped buildings) could lead to torsional behavior and stress concentration at corner structural elements. On the other hand, vertical irregularities that could be inspected through the remote survey are setbacks, soft stories, and discontinuous structural components. The final level of details represents the roof shape/characteristics (e.g. flat, pitched), which is relevant to determining the diaphragm conditions, that is, rigid or flexible, as well as strong-wind vulnerability factors.
Final schools database
The final database of schools comprises 454 schools and 2536 buildings. Figure 7 provides some statistical representations of the main characteristics of these school buildings in the form of bar and pie charts. Figure 7a clearly shows that one-story buildings are the dominant type. Only 6% of the buildings have two stories, and less than 0.5% have three stories. Figure 7b shows that students constitute 91% of the population within school buildings. The ratio between male and female students is almost equal to 1. Teaching staff represent around 7% of the population, with the majority of this staff being female. It is highlighted that the information regarding the school population is obtained from the MoECRT website.
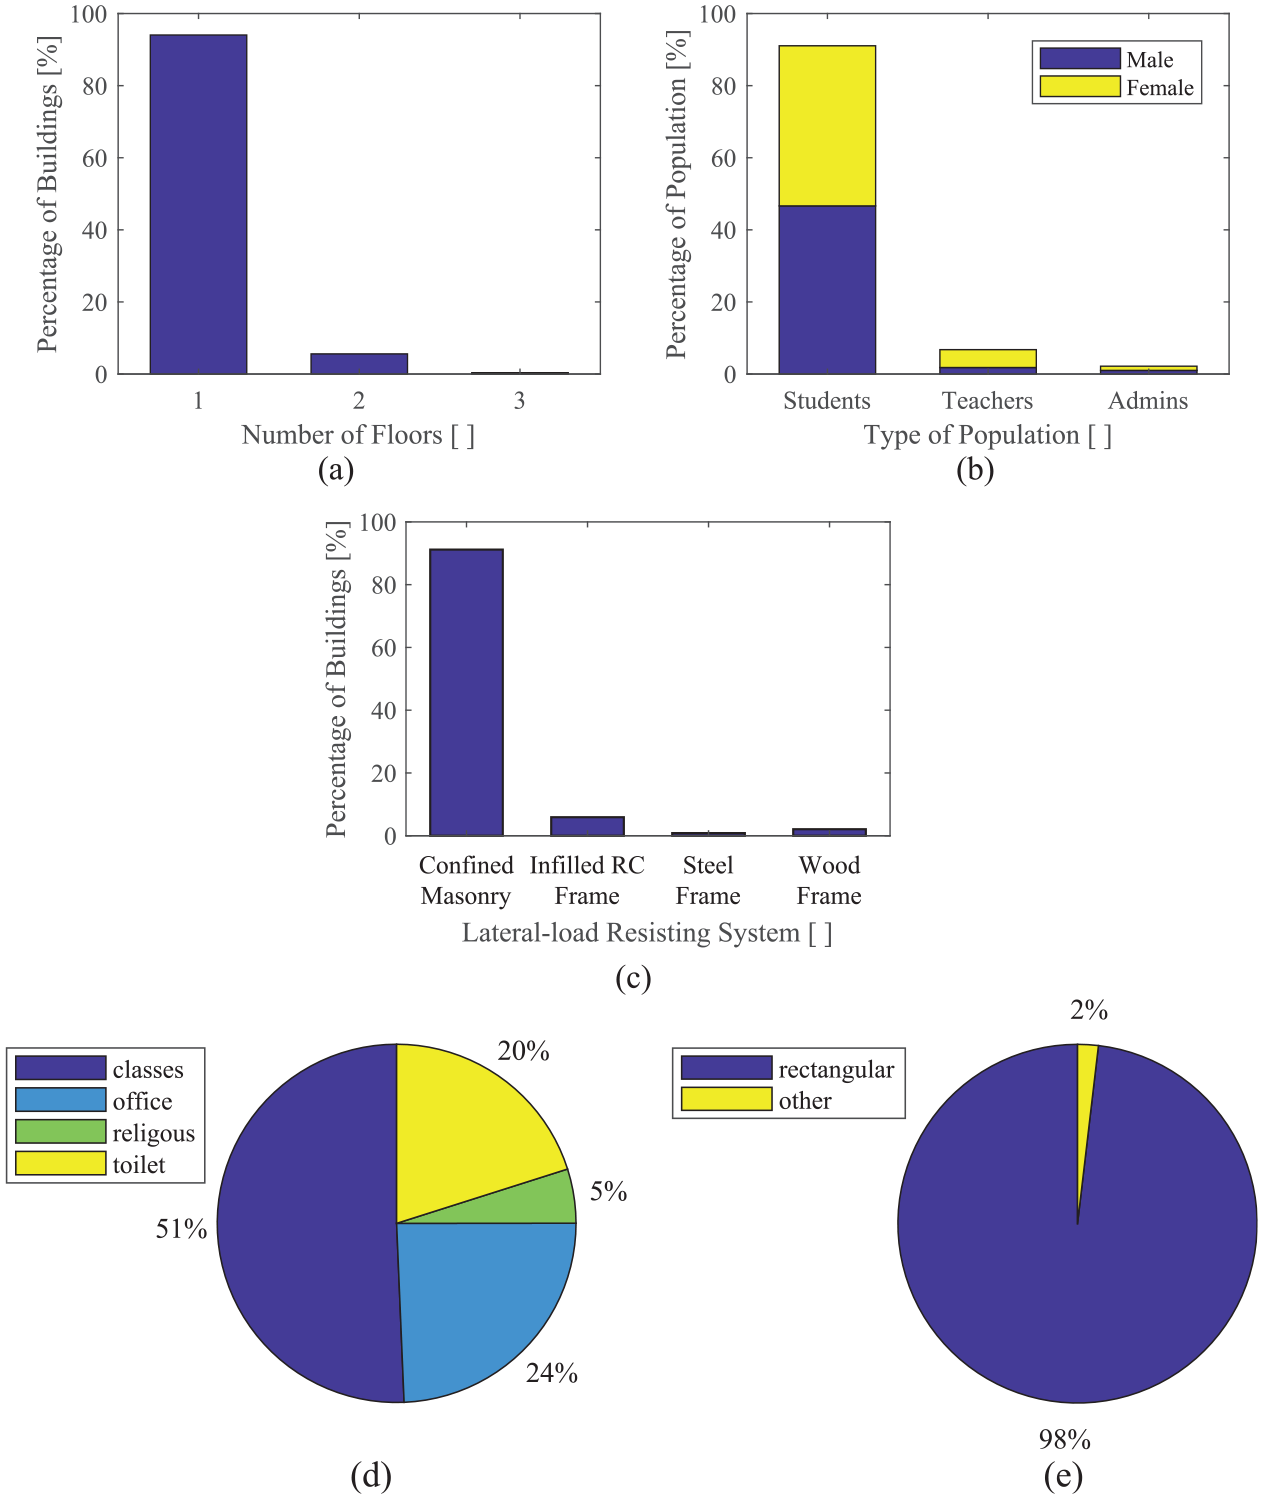
Statistical representation of (a) number of floors; (b) school population; (c) type of lateral load-resisting system; (d) building use; and (e) plan shape.
Figure 7c demonstrates that about 90% of the school buildings are confined masonry buildings, while less than 3% of the buildings have either steel or timber frames as their lateral load-resisting system.
Figure 7d illustrates that 51% of the school buildings are classrooms. These also include other educational facilities such as libraries and labs. Office buildings account for the second major building use, covering 24% of the buildings. Toilets constitute 20% of the buildings, whereas 5% are used for religious gathering purposes. Finally, Figure 7e reports that 98% of the school buildings are rectangular with respect to plan shape. Almost 2% of the buildings have other plan shapes such as L-, C-, and T-shapes.
Potential use of database
The presented Palu school hubs data set has many potential uses for the structural engineering community (researchers, stakeholders—including local authorities and risk modelers—and NGOs). The school database compliments efforts of the World Bank-funded Global Program for Safer Schools (GPSS) on the development of a global library of school infrastructure (GLOSI) (World Bank, 2021; D’Ayala et al., 2020). The database can be useful in developing archetype structural models of school buildings for multi-hazard vulnerability assessment purposes. Researchers interested in community-level multidisciplinary disaster preparedness, planning, and management studies can also use the database. Furthermore, catastrophic risk modelers can use the database for regional-level risk assessment studies.
Open-source data record
Due to the need to comply with ethical guidelines for sharing data related to minors (i.e. school pupils), all the collated data cannot be made public. Therefore, information at the first and fourth levels (i.e. school names, school location, and observed vulnerabilities), including collated images, is not available to the public. However, researchers who need information on the first and fourth levels for research purposes can contact the corresponding author. The redacted database can be accessed at doi.org/10.5281/zenodo.6583119.
Conclusion
This article proposed a rapid and cost-effective mixed-mode data collection framework for building inventory development using a combination of sidewalk and remote survey approaches. The remote survey approach entails using open-source GIS information and street-view and satellite-view images to collect information on the buildings’ location and structural and non-structural attributes.
The mixed-mode framework involves conducting sidewalk and remote surveys for a subset of buildings (ensuring all building classes are well represented) within the building portfolio. Subsequently, an inter-rater reliability analysis (to evaluate the ICC) on the data collected from both the sidewalk and remote surveys is used to assess the reliability of the remote survey to the remaining building portfolio. The remote survey is deployed for surveying building classes with an ICC value not less than the specified minimum ICC.
The feasibility of the proposed framework was demonstrated using a portfolio of 2536 school buildings in the Central Sulawesi region of Indonesia. Inter-rater analysis of data collected from the sidewalk and remote surveys of a subset of 206 school buildings (about 10% of building inventory) shows that the ICC values for the collated data on structural and non-structural attributes are typically greater than 0.99. The remote survey approach was subsequently deployed to the remaining 90% of the building portfolio.
As observed during the case study presented in this article, it is expected that there may be complex cases in which the remote survey is unable to be used during the remote survey exercise. Such cases are typically related to a lack of street-view coverage, unfavorable camera angles or obstructions from nearby buildings, fences, traffic, or trees. In such cases, the mixed-mode survey framework allows the deployment of a traditional sidewalk survey.
The collated building database has been made open-source. The database has many potential uses for NGOs, stakeholders, and structural engineering and catastrophe risk modeling research communities. The database can be used in pre-event risk analysis and management, post-event loss estimation, and regional-level decision-making on school assets. Given that school buildings in developing countries, particularly in South-East Asia, have similar architectural and structural configurations, the published data can be easily scaled and applied to other South-East Asian countries.
Footnotes
Acknowledgements
The authors acknowledge research assistants from Syiah Kuala and Tadulako Universities who supported the sidewalk survey of the 30 schools during the COVID-19 pandemic.
Declaration of conflicting interests
The author(s) declared no potential conflicts of interest with respect to the research, authorship, and/or publication of this article.
Funding
The author(s) disclosed receipt of the following financial support for the research, authorship, and/or publication of this article: The Resilient School-hubs project is funded by the UKRI-ESRC with project reference ES/T002956/1.