
Abstract
This article develops global models of damping scaling factors (DSFs) for subduction zone earthquakes that are functions of the damping ratio, spectral period, earthquake magnitude, and distance. The Next Generation Attenuation for subduction earthquakes (NGA-Sub) project has developed the largest uniformly processed database of recorded ground motions to date from seven subduction regions: Alaska, Cascadia, Central America and Mexico, South America, Japan, Taiwan, and New Zealand. NGA-Sub used this database to develop new ground motion models (GMMs) at a reference 5% damping ratio. We worked with the NGA-Sub project team to develop an extended database that includes pseudo-spectral accelerations (PSA) for 11 damping ratios between 0.5% and 30%. We use this database to develop parametric models of DSF for both interface and intraslab subduction earthquakes that can be used to adjust any subduction GMM from a reference 5% damping ratio to other damping ratios. The DSF is strongly influenced by the response spectral shape and the duration of motion; therefore, in addition to the damping ratio, the median DSF model uses spectral period, magnitude, and distance as surrogate predictor variables to capture the effects of the spectral shape and the duration of motion. We also develop parametric models for the standard deviation of DSF. The models presented in this article are for the RotD50 horizontal component of PSA and are compared with the models for shallow crustal earthquakes in active tectonic regions. Some noticeable differences arise from the considerably longer duration of interface records for very large magnitude events and the enriched high-frequency content of intraslab records, compared with shallow crustal earthquakes. Regional differences are discussed by comparing the proposed global models with the data from each subduction region along with recommendations on the applicability of the models.
Keywords
Introduction
In seismic design, analysis, and hazard calculations of engineered facilities, ground motion models (GMMs), formerly also referred to as ground motion prediction equations (GMPEs), are used to predict the intensity of ground shaking. Traditionally, these GMMs are developed for the elastic pseudo-spectral acceleration (PSA) at a 5% reference damping ratio. The damping ratio represents the level of energy dissipation in structural, geotechnical, and non-structural systems. In reality, structures can have damping ratios other than 5%, depending on the structural type, construction material, and the level of ground shaking. For example, base-isolated structures typically have damping ratios much higher than 5%, while flexible tall buildings can have damping ratios as low as 2.5% (Tall Buildings Initiative (TBI), 2010). Damping ratios could vary between 0.5% and 10%, depending on the structural or non-structural materials (NUREG/CR-6919 (U.S. Nuclear Regulatory Commission Office of Nuclear Regulatory Research, 2006), Tables 5–1 and 7-2, used in NUREG/CR-7230 (U.S. Nuclear Regulatory Commission Office of Nuclear Regulatory Research, 2013)). They could be much larger than 5% for structures with damping systems (ASCE/SEI 7-10, 2010, Table 18.6-1).
Interface subduction earthquake recordings (selected data used in modeling)

The typical engineering practice is to scale the predicted 5% damped PSA

A review of existing DSF models, dating all the way back to the classic work of Newmark and Hall (1982), can be found in Rezaeian et al. (2012). Other terminologies have been used in the literature, a common one being Damping Modification Factors (DMF); however, we follow the terminology used by the Next Generation Attenuation (NGA-West2) project in Rezaeian et al. (2014a) and use DSF hereafter.
The majority of available DSF models are functions of the damping ratio and spectral period. Some models have recognized the importance of the duration of motion on energy dissipation (and hence on DSF) and have included other parameters as surrogates for the duration of motion in their formulations because the duration of motion is not a parameter that is readily available to a design engineer. Furthermore, most of these available models are calibrated to recordings from shallow crustal earthquakes in active tectonic regions due to the relative abundance of such recordings. Very few studies have considered extensions of the DSF model to subduction zone earthquakes, and most of these studies are recent and limited to specific regions (Castillo and Ruiz, 2014; Daneshvar et al., 2016, 2017; Fernandez-Davila and Mendo, 2020; Miranda et al., 2020; Piscal and López-Almansa, 2018; Rezaeian et al., 2018; Zhao et al., 2019, 2020; Zhou and Zhao, 2020). Consequently, current building design regulations (e.g. ASCE/SEI 7-10, 2010, which is based on Newmark and Hall, 1982; EN 1998-1, 2004; Mexico City Building Code, 2017) use DSFs that are based on models developed for crustal earthquakes. The model proposed in this study could be used to improve the building code DSFs for subduction zone earthquakes. Below, we first summarize the shallow crustal model by Rezaeian et al. (2012, 2014a), because their functional form will be considered in this study. We then summarize the available subduction-specific models or studies that focus on the differences between subduction and crustal DSF models.
DSF for shallow crustal earthquakes
In the Next Generation Attenuation, NGA-West2, project (Rezaeian et al., 2012, 2014a, 2014b), we developed a parametric DSF model for shallow crustal earthquakes in active tectonic regions. This model was developed for horizontal (separate models for RotD50 and GMRotI50 components, which are direction-independent average measures of the two horizontal components) and vertical components of ground motion. In addition to damping ratio and spectral period, moment magnitude
DSF for subduction earthquakes
As mentioned above, few studies exist that focus on the DSF for subduction earthquakes. Most of these studies are recent and are only applicable to specific regions. Among these are Castillo and Ruiz (2014), Daneshvar et al. (2016, 2017), Piscal and López-Almansa (2018), Miranda et al. (2020), Fernandez-Davila and Mendo (2020), and Zhou and Zhao (2020) that provide DSFs for subduction earthquakes in Mexico, southwestern British Columbia (Canada), Colombia, Chile, Peru, and Japan, respectively. Castillo and Ruiz (2014) is the only model available for the Central America and Mexico region. They use local records in the Valley of Mexico categorized into seven seismic zones with different types of soil to develop a parametric model for median DSF as a function of damping ratio, period, and the dominant period of the soil. Their model is different from others in that they calculate the DSF from the uniform hazard spectra at different damping ratios. This model is limited to damping ratios larger than 5% (10%–35%), and the coefficients are based on two return periods and the seven seismic zones. They note the importance of spectral shape on DSF but conclude that the influence of source mechanism including magnitude and frequency content is only significant for soft soil sites in this region. Daneshvar et al. (2016, 2017) is the only model relevant to the Cascadia subduction zone as it is developed for the southwestern British Columbia in Canada, using local records supplemented by relevant global records from Japan. They investigate the differences between the three types of earthquakes (crustal, interface subduction, and intraslab subduction earthquakes) and develop a parametric model for the median DSF as a function of damping ratio and period. This model is applicable to damping ratios from 1% to 30%, and its coefficients are provided for periods up to 3 s. They report negligible dependence on soil class but significant dependence on the frequency content and duration of motion. They also report more dependence on period for intraslab earthquakes, which they attribute to the richer high-frequency content of intraslab records compared with other types of earthquake records. Also, because they only use very large magnitude subduction interface earthquake records and only consider high damping ratios, they conclude that the longer duration of interface records results in nearly constant DSF values.
The three local models developed for the South America region are for Colombia, Peru, and Chile and compare DSF medians based on local data to the values provided by building design regulations. The model by Piscal and López-Almansa (2018) is different from others because it proposes a framework to utilize simulated ground motions with similar durations as local available recordings in order to develop DSF models in regions where recordings are sparse. They demonstrate the application of their proposed framework for a region in Colombia and develop a median DSF model as a function of damping ratio and spectral period. This model is applicable to periods of up to 4 s. Sensitivity analyses is done for soil type with the conclusion that it is less relevant compared to period, and therefore soil type is not used as a predictor variable in the Colombia DSF model. Fernandez-Davila and Mendo (2020) use local recent recordings in the Peru region for three types of soil conditions to develop a median model of DSF that is a function of period. The coefficients are provided for damping ratios larger than 5%. They show that there are discrepancies with DSF values in design regulations, which are mainly based on data from crustal earthquakes. Such discrepancies with design regulations are also observed by Miranda et al. (2020), who propose a median DSF model for Chile that is period independent but is a function of damping ratio and spectral shape. The spectral shape is captured by a proxy called SaRatio. They use a relatively rich database of interface subduction records but a relatively sparse database of intraslab subduction records. They investigate a few different combinations of predictor variables that include magnitude, duration, and site class. They note that site class is not important for rock and firm sites. The final model variation that they recommend is only a function of damping ratio and SaRatio and is recommended for periods less than 6 s.
Finally, Zhao et al. (2019) look at the effects of earthquake source, path, and site conditions on DSF for subduction earthquakes in Japan. They use records from global crustal databases (NGA-West2) to investigate the differences between different types of earthquakes and recommend that separate DSF models should be developed for the three different types of earthquakes (crustal, interface subduction, and intraslab subduction earthquakes). Based on this study, Zhou and Zhao (2020) and Zhao et al. (2020) develop median DSF models for the displacement and acceleration spectra, respectively, for subduction intraslab earthquakes in Japan. The Zhou and Zhao (2020) model for the displacement spectra is comparable to our definition of DSF based on pseudo-acceleration spectra in Equation 1 and is a function of damping ratio, period, and site conditions. Although the importance of source and path parameters (e.g. magnitude and distance) is recognized in this study, they are not used as predictor variables in the model. This model is applicable to periods up to 5 s. None of the above-mentioned studies have developed a parametric model for standard deviation of DSF, but Zhou and Zhao (2020) look at sample values and mention that standard deviations are smaller than those for GMMs at a 5% damping ratio.
This study
The Next Generation Attenuation for subduction earthquakes (NGA-Sub) project (Bozorgnia et al., 2018, 2021) has recently developed a comprehensive database of recorded ground motions for subduction zone earthquakes to be used in the development of a new set of subduction GMMs for the RotD50 horizontal component at a 5% damping ratio. This is the largest uniformly processed ground motion database for subduction events to date and includes data from seven regions. We worked with the NGA-Sub project to develop an extended database that includes PSA for 11 damping ratios of 0.5%, 1%, 2%, 3%, 5%, 7%, 10%, 15%, 20%, 25%, and 30%, as well as measures of significant duration of motion (based on various levels of Arias intensity) for each record. In this article, we use this database to empirically develop global subduction DSF models.
In 2018, a preliminary analysis of a subset of the NGA-Sub data (Rezaeian et al., 2018) revealed that the shape of the crustal DSF model proposed by Rezaeian et al. (2014a) can capture the overall behavior of the subduction DSF data with respect to damping ratio, spectral period, duration, magnitude, and distance, for almost all regions included in the NGA-Sub database, but differ over specific ranges of these parameters. The largest discrepancies between the subduction data and the crustal DSF model were seen for very small and very large magnitudes (below 5 and above 8), for small distances less than 100 km (particularly at periods greater than about 1 s), and for large distances greater than 300 km (particularly at periods shorter than about 0.5 s). Most significant differences are seen outside the applicable range of the crustal DSF model (e.g. magnitudes and distances greater than 8 and 300 km, respectively) or where the subduction data are very limited. Overall, a more significant dependency of subduction DSF on spectral period was observed compared to crustal DSF, suggesting that the regression coefficients should be recalibrated to better fit subduction data. Furthermore, the subduction DSF data showed more dependencies on site parameters (e.g. shear-wave velocity of the top 30 m in soil,
Based on the conclusions from Rezaeian et al. (2018), the proposed model in this article retains the functional form of the crustal DSF model by Rezaeian et al. (2014a) but recalibrates the period-dependent regression coefficients of the median and standard deviation models to achieve a better fit to the NGA-Sub data. Two magnitude- and distance-dependent global DSF models (i.e. two sets of period-dependent regression coefficients) are developed separately for interface and intraslab subduction earthquakes. A discussion is provided on possible future updates to the model by including additional predictor variables that represent site parameters and could improve the model for very short periods. Furthermore, long-period adjustments to the model are proposed for periods longer than 5 s to account for the fewer reliable data at such periods and to ensure that the DSF model converges to 1 at very long periods. Finally, the applicability of the proposed global model for each of the seven regions in the NGA-Sub database is discussed, and example applications of the DSF models to NGA-Sub GMMs are provided.
NGA-Subduction DSF database
The NGA-Sub database contains over 70,000 recordings from over 900 earthquakes in seven regions: Alaska (ALK), Cascadia (CAS), Central America and Mexico (CAM), South America (SAM), Japan (JPN), Taiwan (TWN), and New Zealand (NZL). To develop a DSF model, we calculated the horizontal PSA (i.e. RotD50 component) at all 11 damping ratios listed above in the “Introduction” for events that have a moment magnitude
Selected records for modeling
To ensure that reliable and high-fidelity data are used in modeling (i.e. in regression), we further reduce the number of recordings in our database by only selecting the records that were screened and used by two of the NGA-Sub GMM developer teams (Parker et al., 2020, 2021 resulting in PSBAH20 GMM; and Kuehn et al., 2020, resulting in KBCG20 GMM). Each team independently evaluated the NGA-Sub data based on their own individual selection criteria; one team selected a total of about 16,000 records, and the other selected only 7000 records. They both discarded recordings beyond a distance of
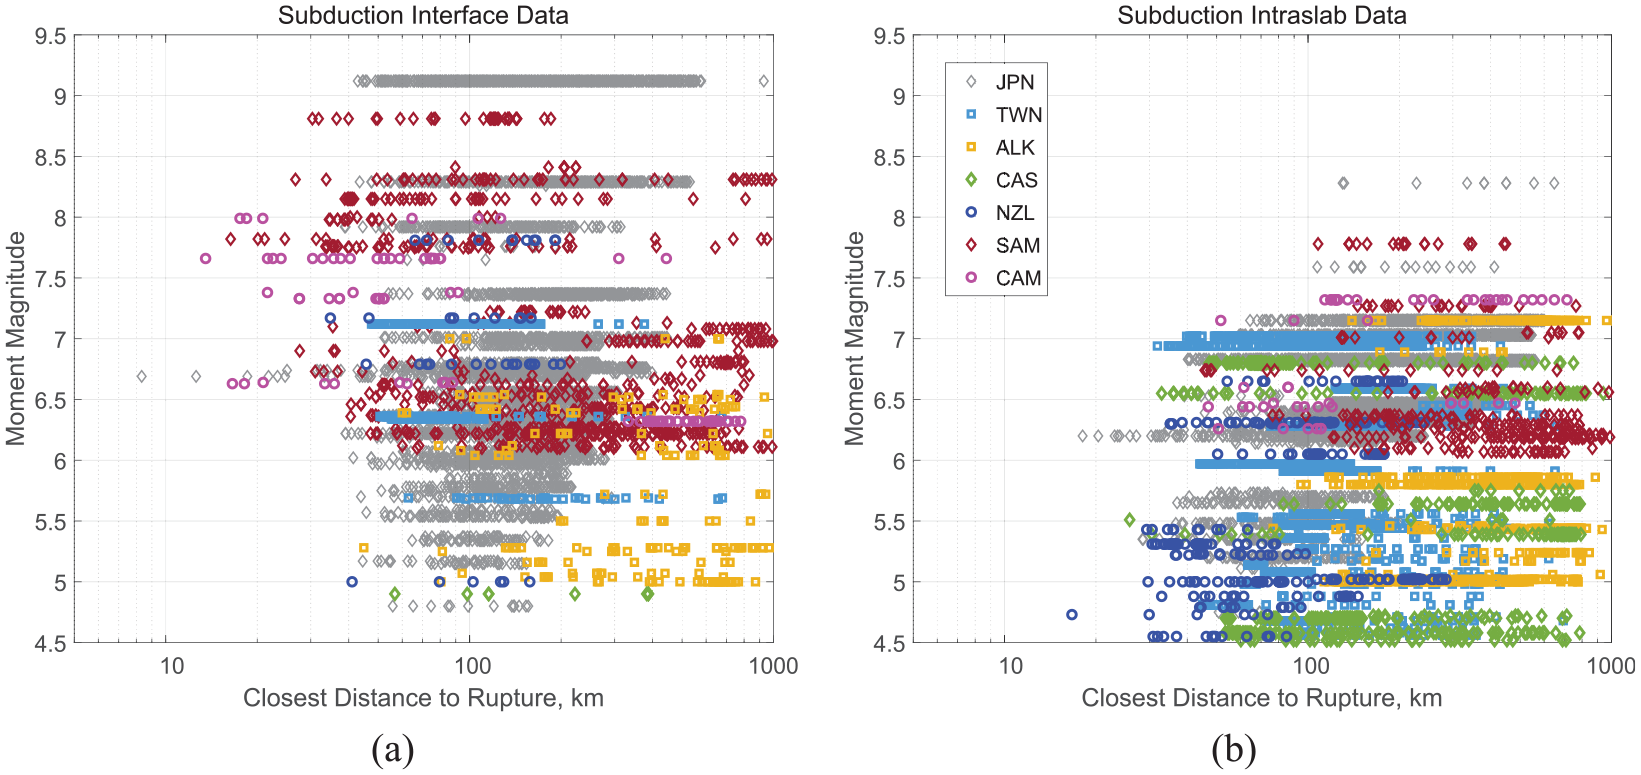
Magnitude–distance distribution of selected records from (a) subduction interface (7061 datapoints) and (b) subduction intraslab (9400 datapoints) earthquakes, color-coded by regions.
To examine the model sensitivity to the selected set of records, we also studied an alternative larger set of selected records (not shown in Figure 1), disregarding the selections and thereby constraints of the NGA-Sub GMM developers. This alternative set contained a much larger number of records: over 19,000 records for interface events and over 20,000 records for intraslab events. It contained a significantly larger number of recordings at larger distances because the
Compared to the NGA-West2 database for shallow crustal earthquakes (Rezaeian et al., 2014a), magnitudes of subduction events are generally larger, especially for interface subduction events, and data for shorter distances (less than 50 km) are sparser. In the development of the crustal DSF model (Rezaeian et al., 2014a), we only used records with
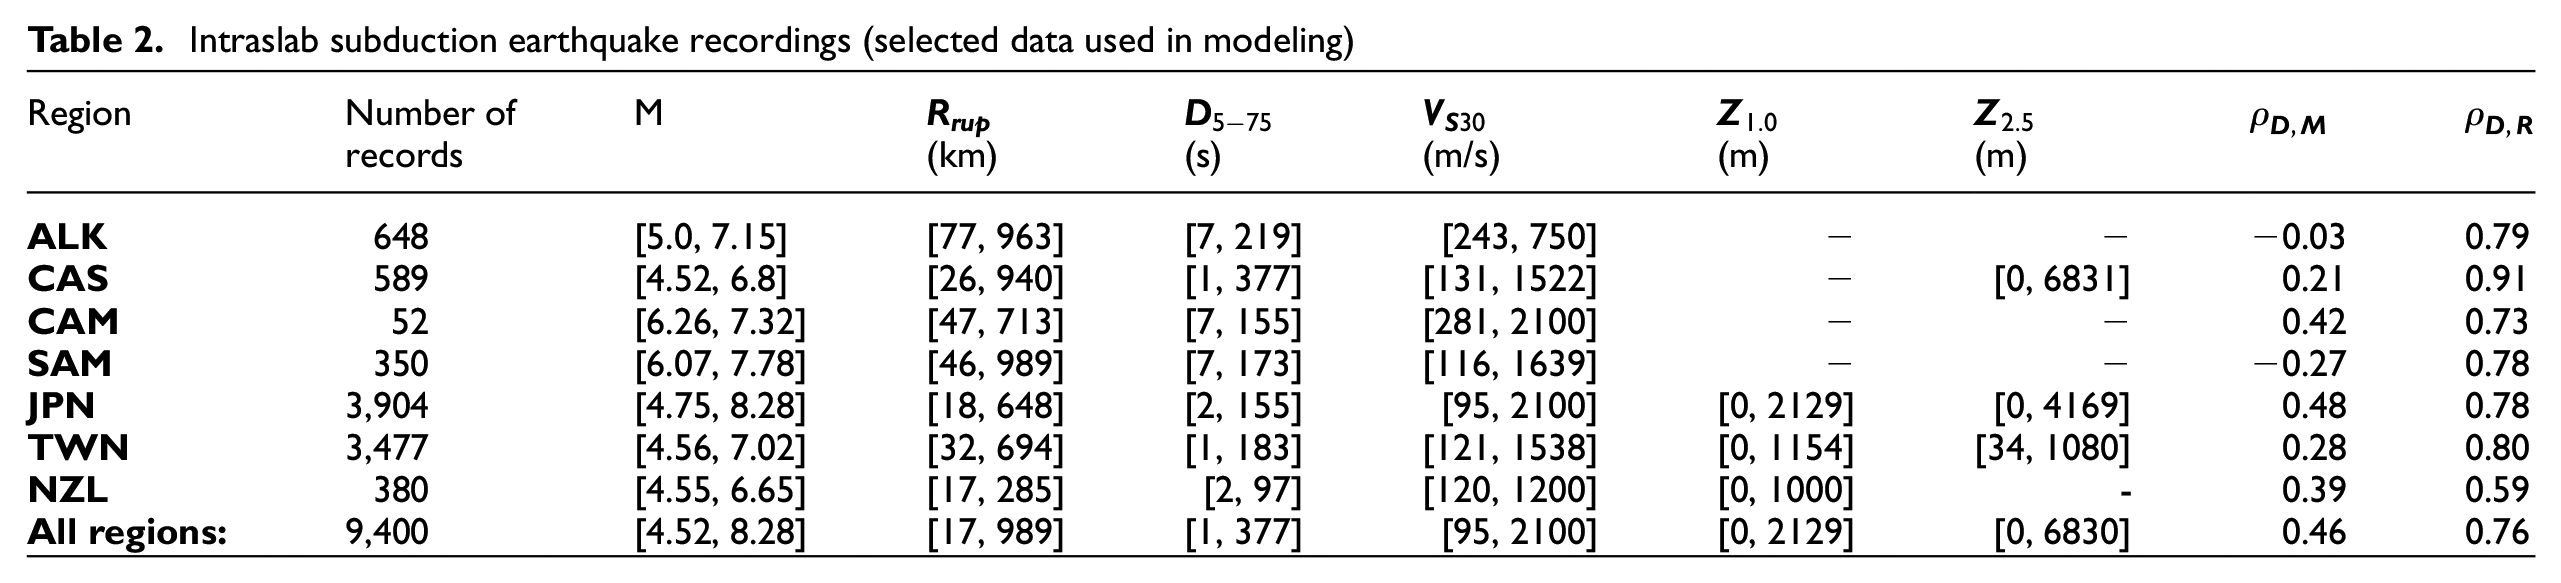
The statistics of the selected records in Figure 1 are summarized and broken down by regions in Tables 1 and 2 for interface and intraslab subduction earthquakes, respectively. These tables show the three-letter abbreviation for each of the seven regions, the number of recordings from each region, ranges of moment magnitude
Intraslab subduction earthquake recordings (selected data used in modeling)
The global dataset for interface earthquakes has a good representation of magnitudes (with a mean of 7.08), distances (with a mean of
The global dataset for intraslab earthquakes also has a good representation of magnitudes (generally smaller than interface earthquakes, as expected, with a mean of 6.16), distances (with a mean of
DSF for interface versus intraslab earthquakes
Separating the data into interface and intraslab earthquakes is necessary to capture the systematic differences between the DSFs of these two tectonic regimes as also noted by Daneshvar et al. (2016, 2017) and Zhao et al. (2019). Furthermore, having two models helps with the application of the DSF to GMMs, which are also developed separately for interface and intraslab earthquakes.
To demonstrate the differences between DSF for interface and intraslab earthquakes, Figure 2 shows the dependency of median DSF (i.e. approximated by the sample mean of ln(DSF), assuming a lognormal distribution for DSF) on spectral periods at all 11 damping ratios for an example magnitude–distance bin (magnitudes between 6 and 7 and distances smaller than 100 km) using data from Japan. The two subplots in this figure correspond to interface and intraslab subduction events. Both bins have comparable number of recordings (401 versus 350), as well as similar magnitudes and distances, but there is an obvious difference between the DSF of the two tectonic regimes: the peaks of the DSF of intraslab events are more extreme and occur at shorter periods, with DSF converging toward unity at shorter periods (see 1–10 s) compared to interface events. This behavior seems typical for all other regions and magnitude–distance bins, where data are available, supporting our recommendation to develop two separate models for interface and intraslab events. The dashed lines in Figure 2 correspond to the NGA-West2 crustal DSF model (Rezaeian et al., 2014a) calculated at the mean values of magnitude and distance for the data in each bin. These dashed lines are superimposed for comparison, showing that the crustal model has a similar shape to the subduction data but does not fit well, particularly at periods greater than 1 s and for intraslab recordings from Japan. This supports our recommendation that the regression coefficients of the model proposed in Rezaeian et al. (2014a) should be recalibrated to subduction-specific data.
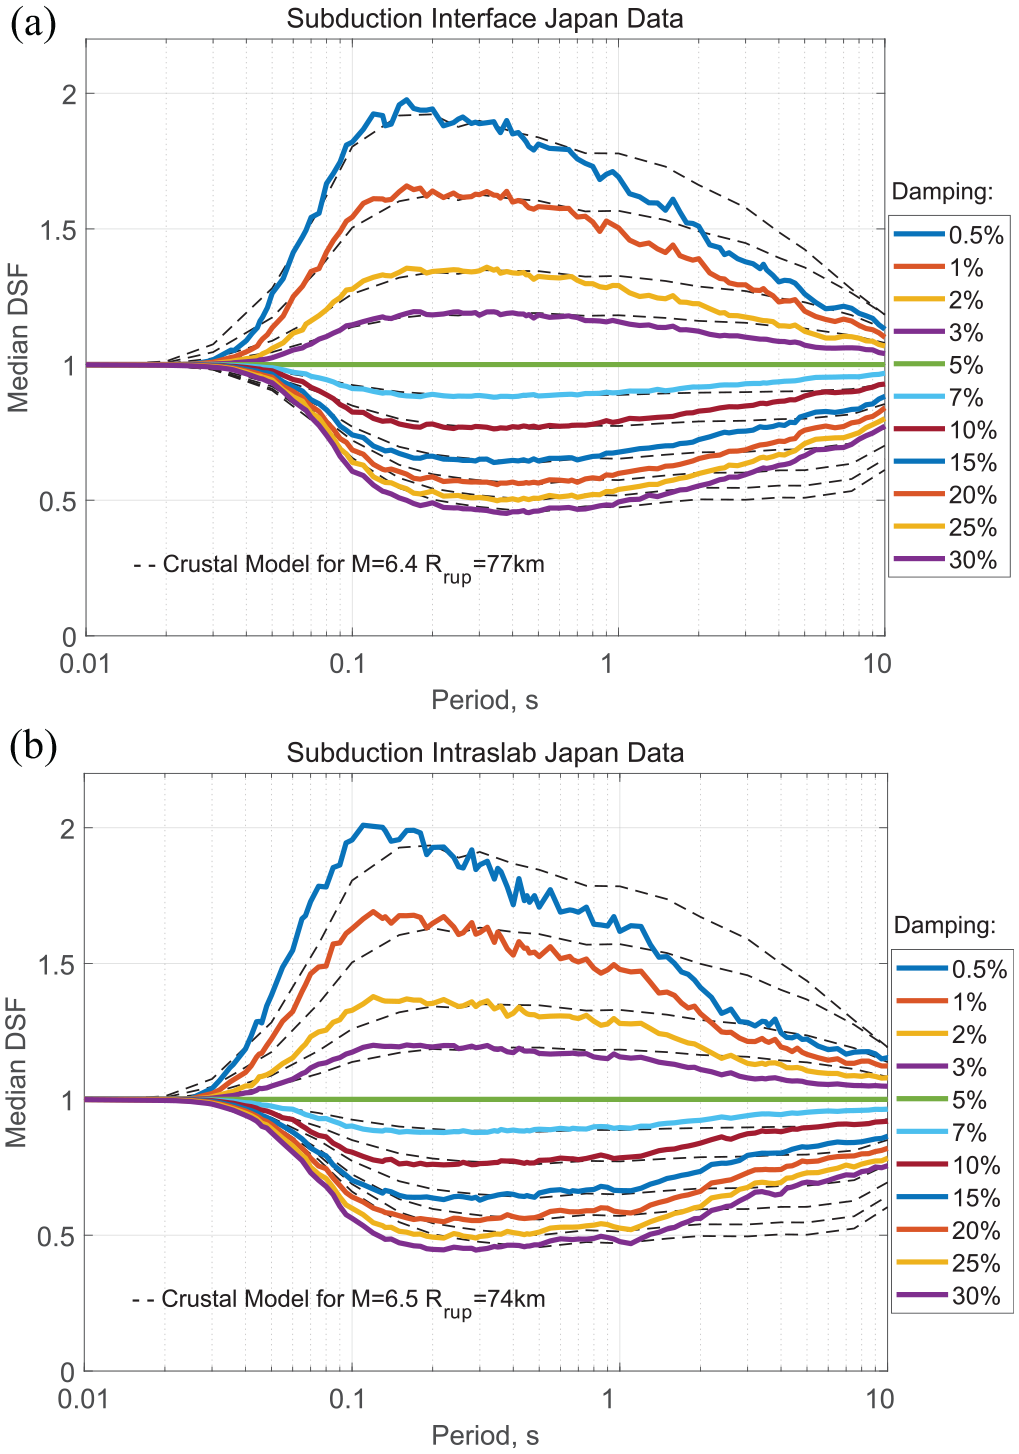
Differences between (a) subduction interface DSF and (b) subduction intraslab DSF. The solid lines show the median DSF from Japan recordings with magnitudes between 6 and 7 and with distances less than 100 km. 401 and 350 datapoints are used, respectively, in (a) and (b). The dashed lines show the NGA-West2 crustal DSF model for the corresponding mean magnitude and distance of data.
Model development
The DSF model is strongly influenced by the shape of the response spectrum and the duration of motion as discussed in detail in Rezaeian et al. (2012, 2014a). Figure 3 shows the dependence of DSF on the duration of motion for subduction events at an example period of 1 s and damping ratios of 2% and 20% for interface and intraslab subduction earthquakes. Like crustal earthquakes, this dependence is substantial for both types of subduction earthquakes. Since duration of motion is not a practical parameter for a design engineer,
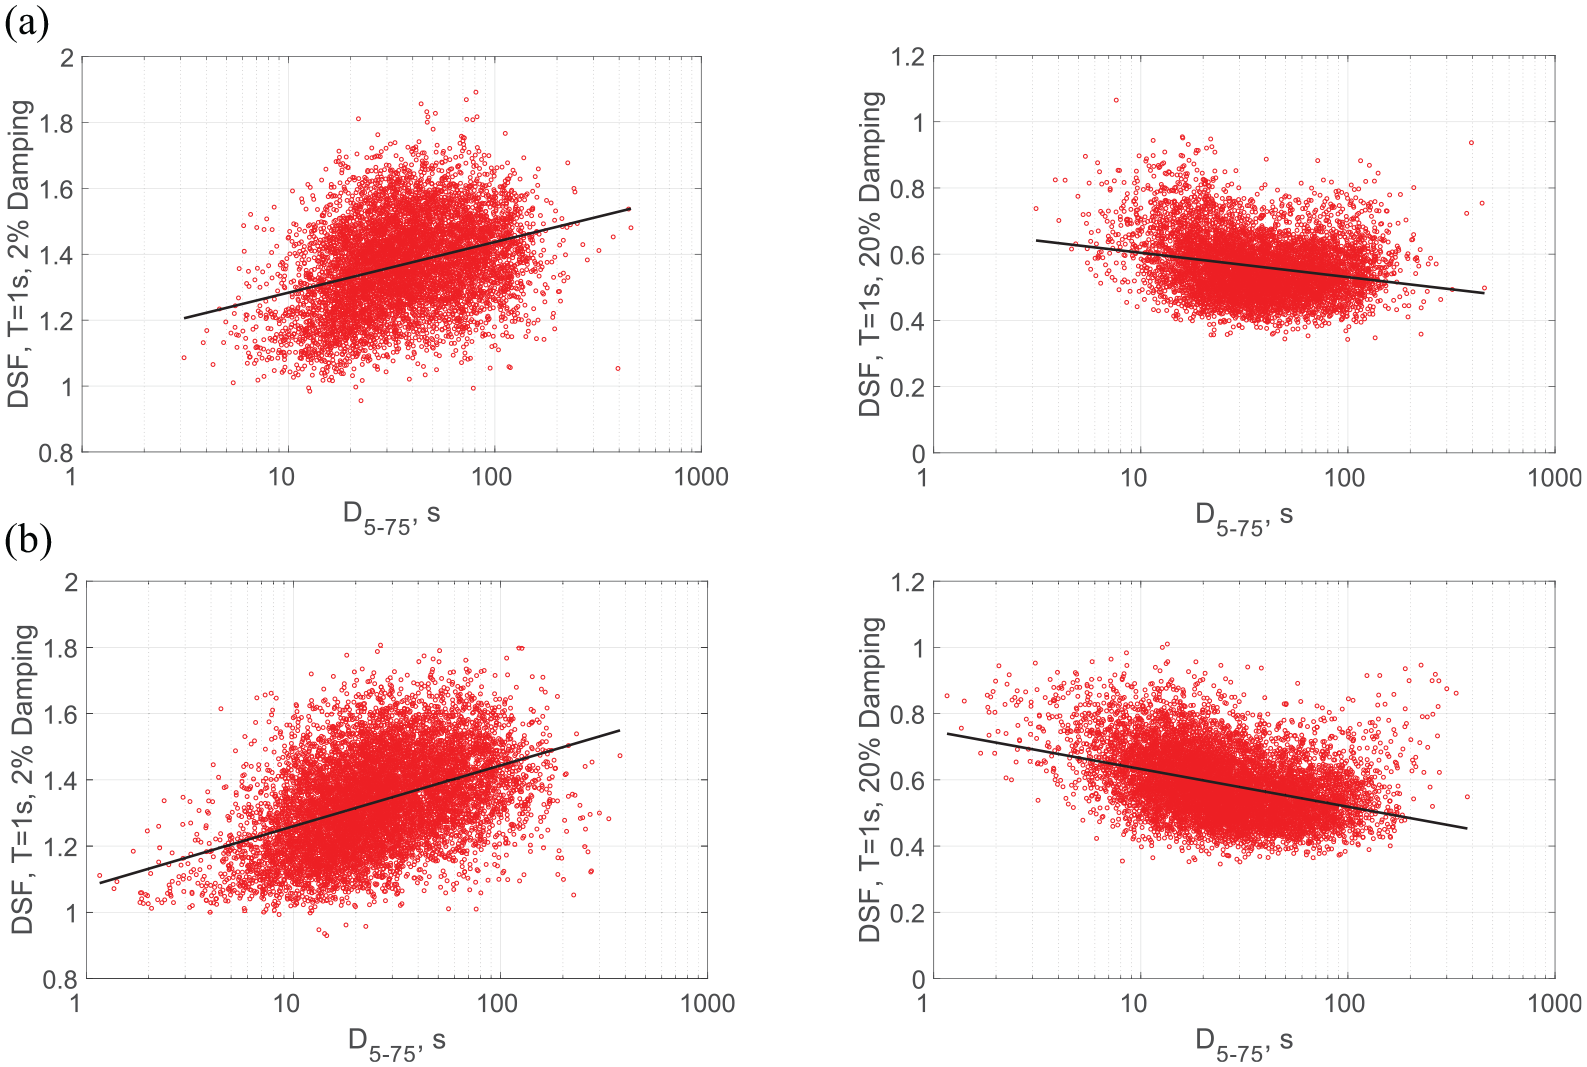
Influence of duration,
Median DSF
To make a model for the median DSF, we follow a step-by-step regression process as described in Rezaeian et al. (2012). Regression is done separately at 21 spectral periods:
We start by including both parameters

At every step, we observe that the coefficients of the constant term
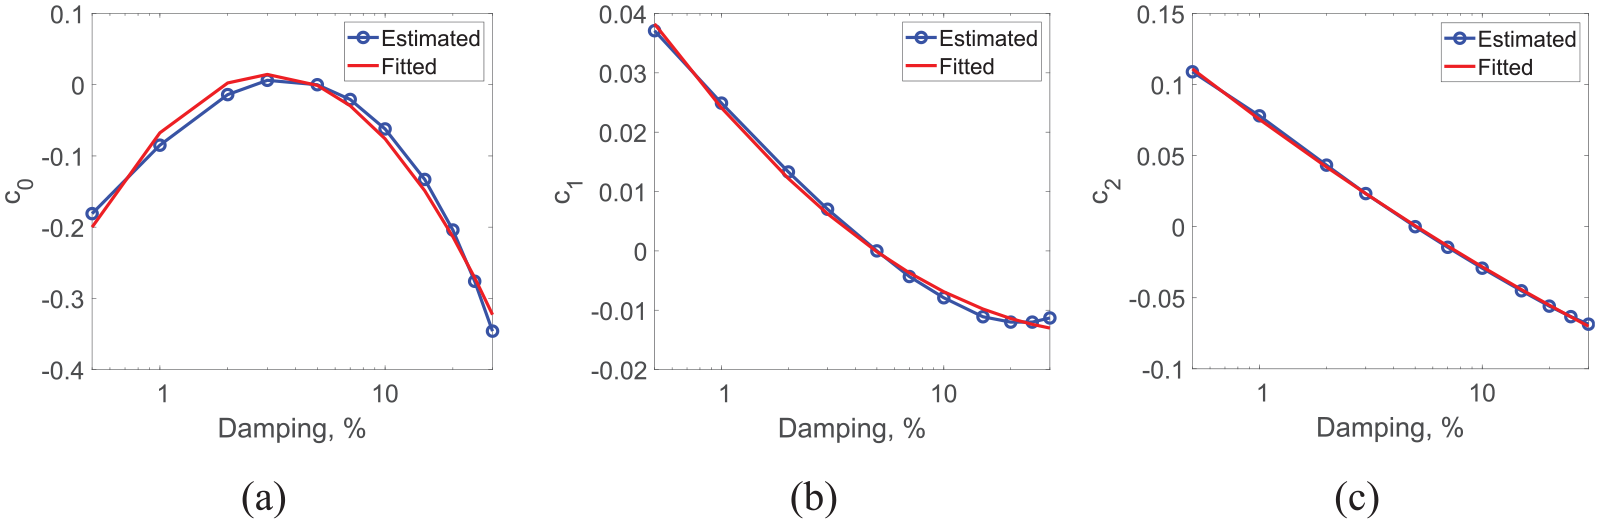
Coefficients of (a) the constant term
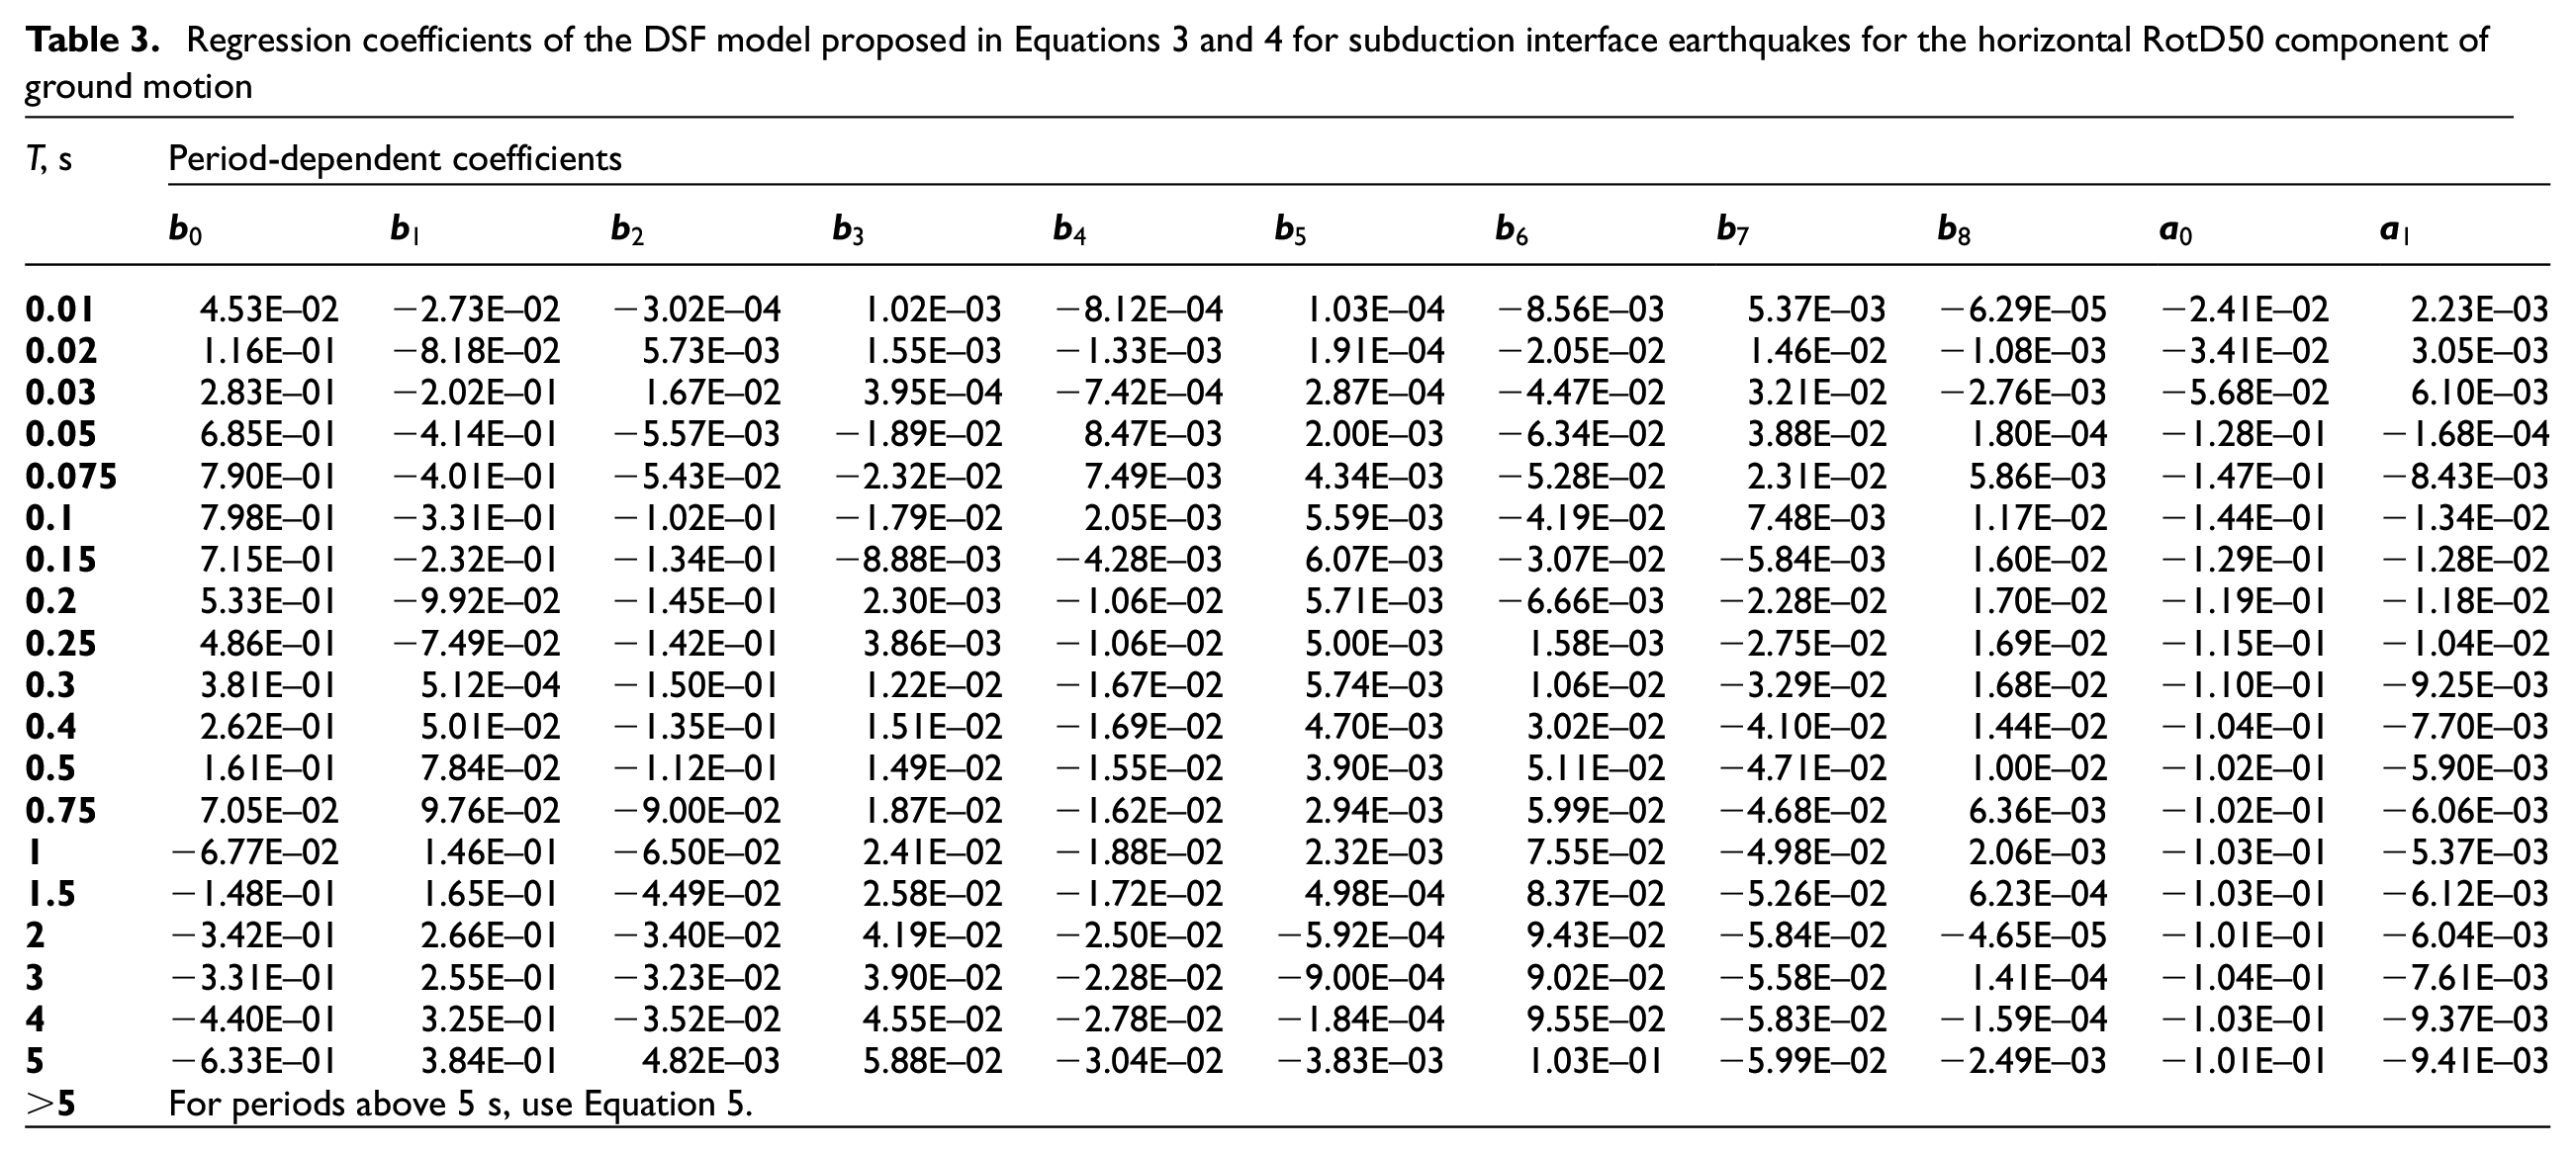
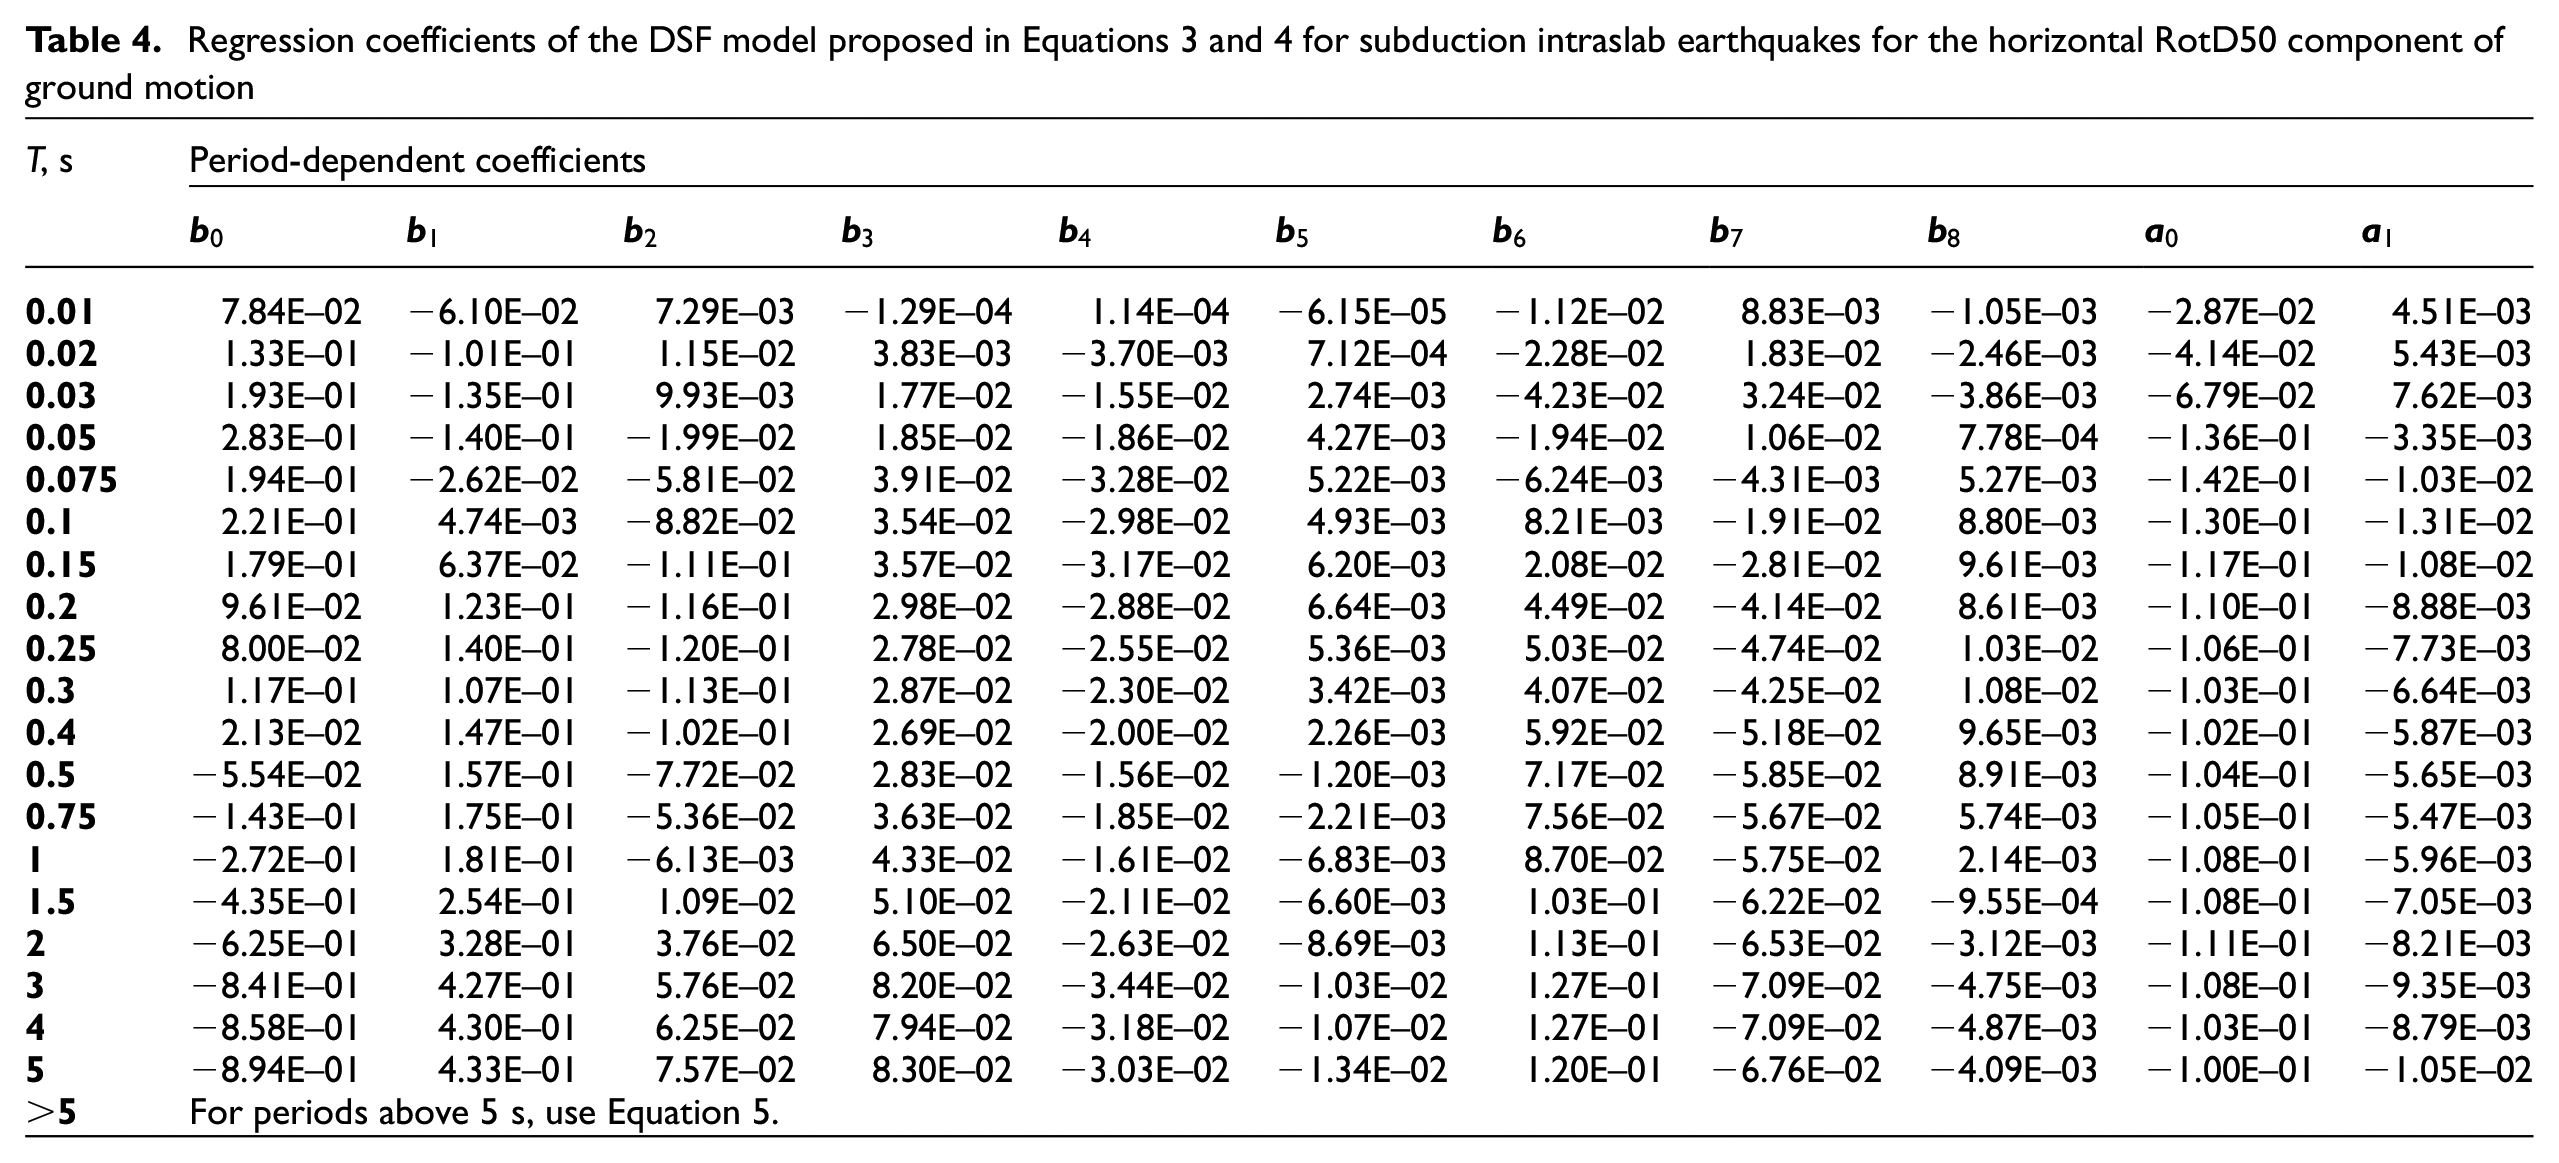
The proposed parametric model of the median DSF is shown in Equation 3, which is derived by incorporating a quadratic function of
Regression coefficients of the DSF model proposed in Equations 3 and 4 for subduction interface earthquakes for the horizontal RotD50 component of ground motion
Regression coefficients of the DSF model proposed in Equations 3 and 4 for subduction intraslab earthquakes for the horizontal RotD50 component of ground motion
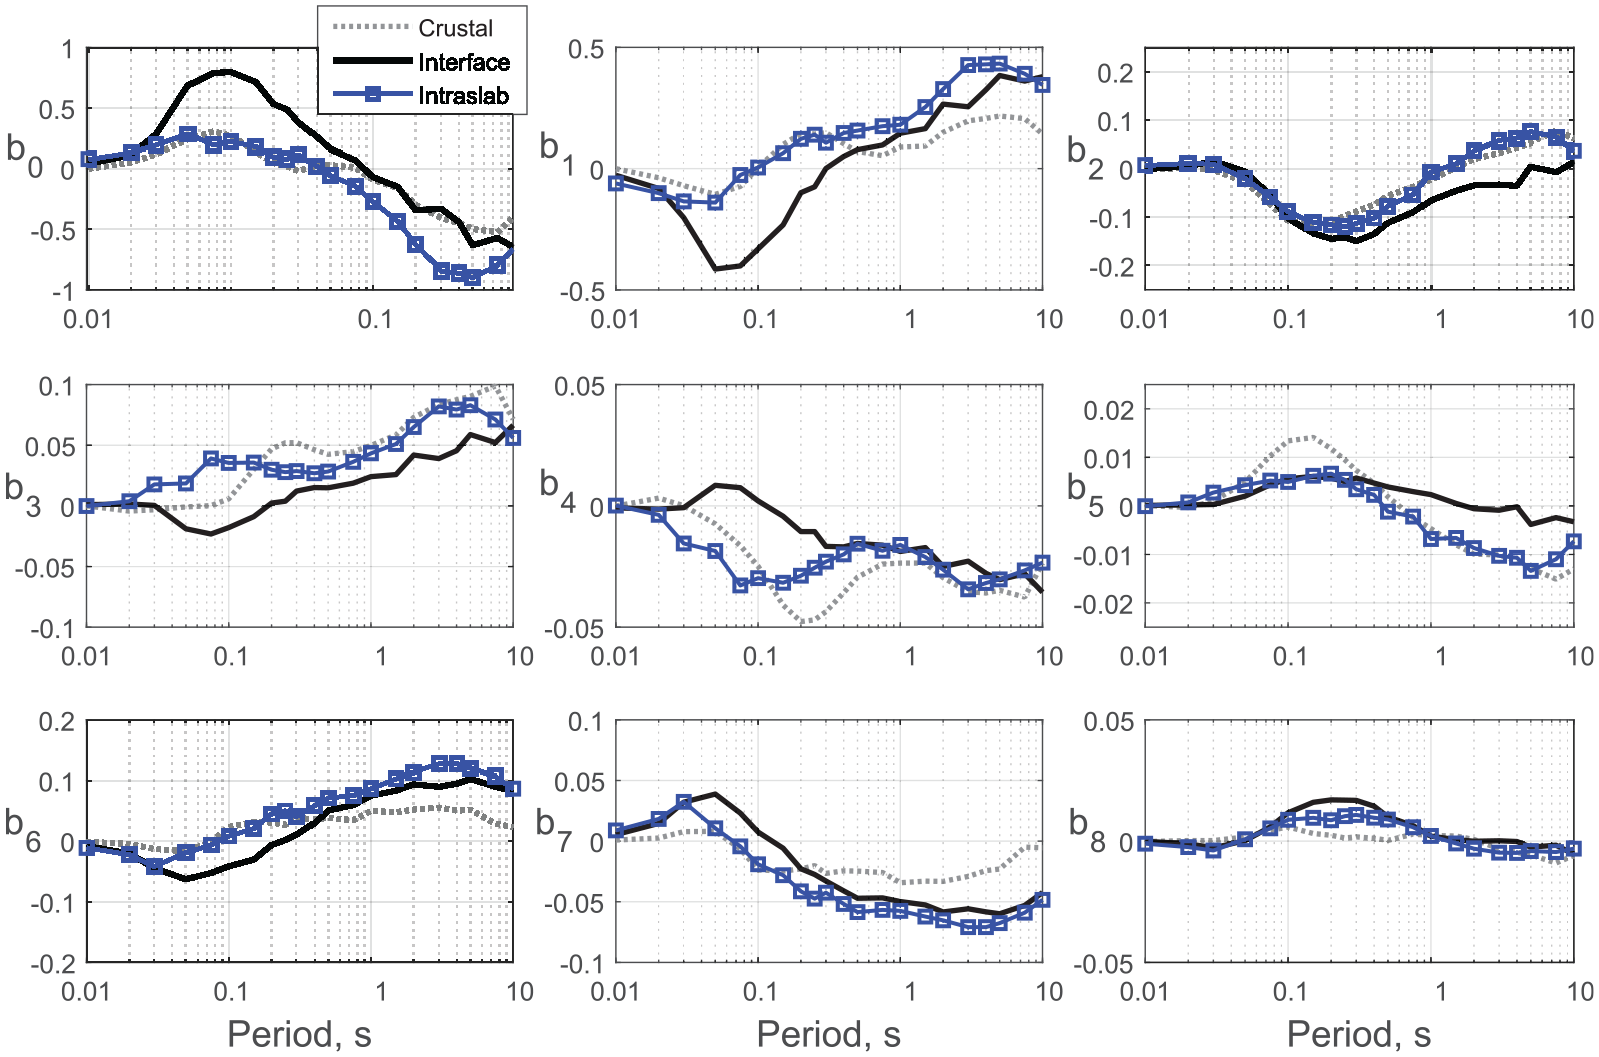
Period-dependent coefficients in Equation 3 for subduction interface, subduction intraslab, and crustal earthquakes for horizontal RotD50 component of ground motion.
Standard deviation
To make a model for the standard deviation of
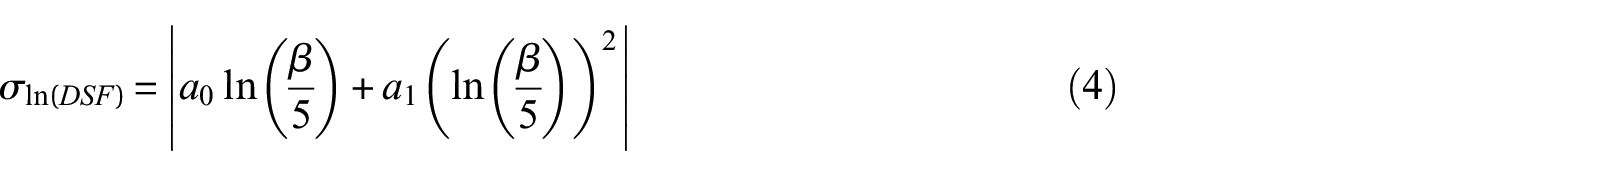
Standard deviations of
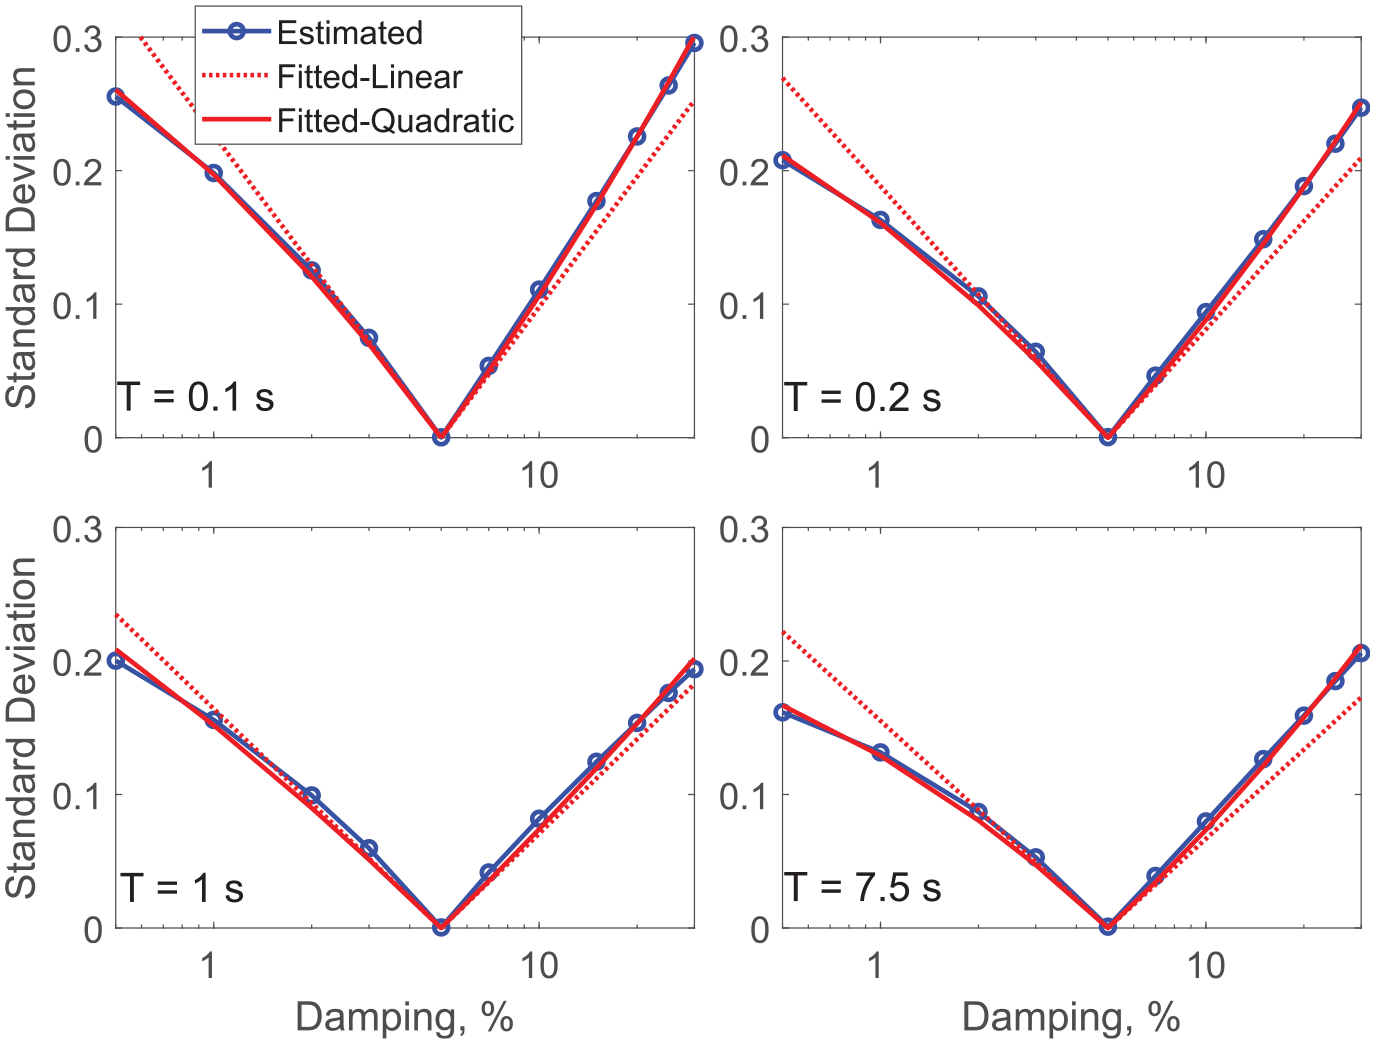
The two coefficients of the standard deviation model,
Period-dependent standard deviation coefficients
Residuals
We know that the duration of motion is an important parameter that influences the DSF; however, as previously mentioned, explicit inclusion of duration in the model is not ideal in practice as duration is generally not available to a design engineer. In general, duration is controlled by the earthquake magnitude and distance from the rupture. Therefore, we believe that the inclusion of magnitude and distance should model the dependencies on the duration of motion. After performing regression using Equation 3 and scrutinizing the residual diagnostic plots, we find that most of the influence of duration on DSF can, in fact, be captured through inclusion of
Residuals versus
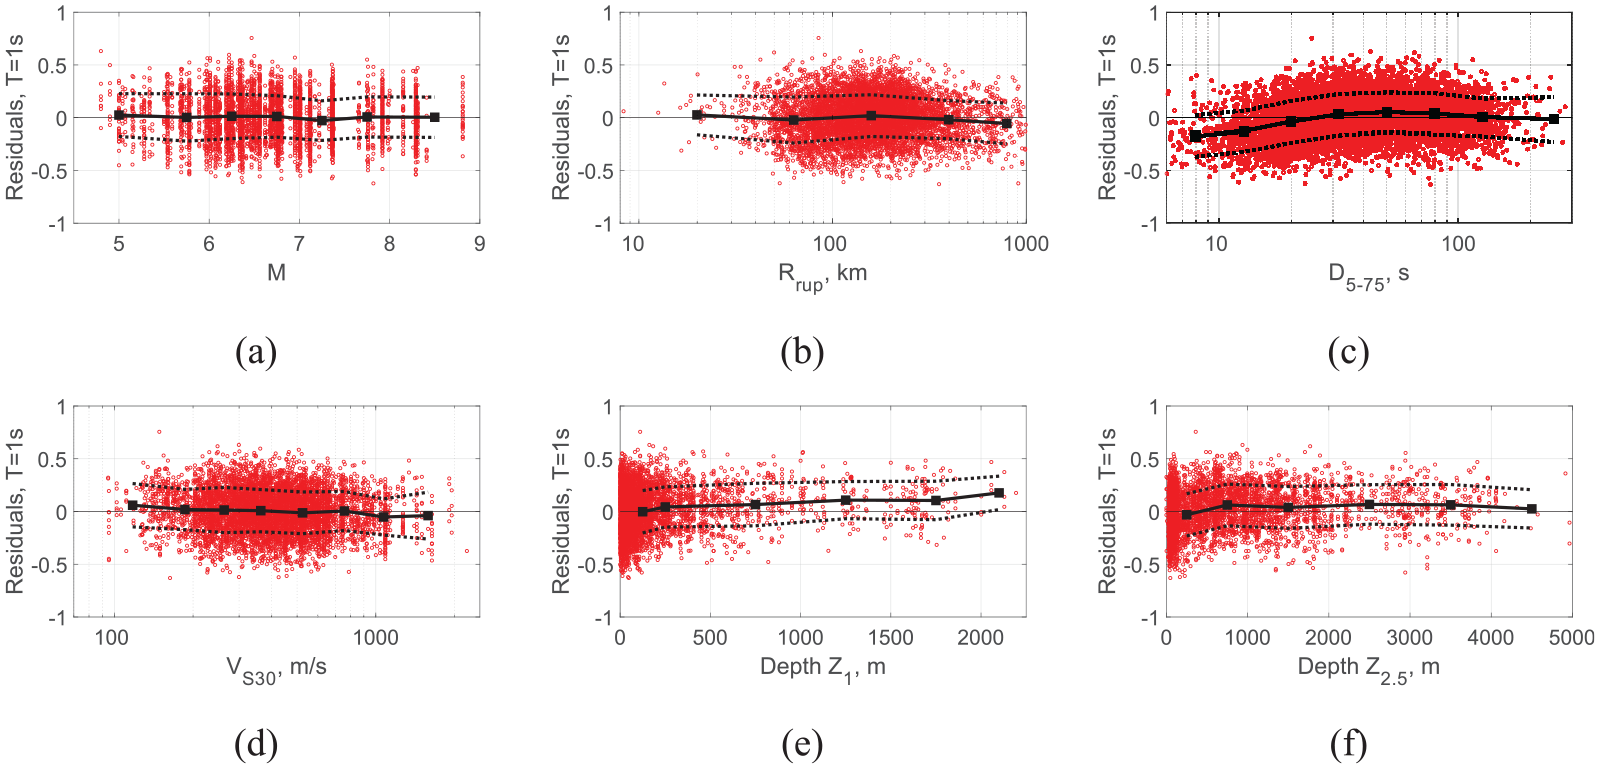
Example residual plots for subduction interface DSF model at 20% damping and 1-s period. The solid and dashed black lines show residual patterns, respectively, representing the mean and standard deviation of residuals in almost equally spaced bins of data.
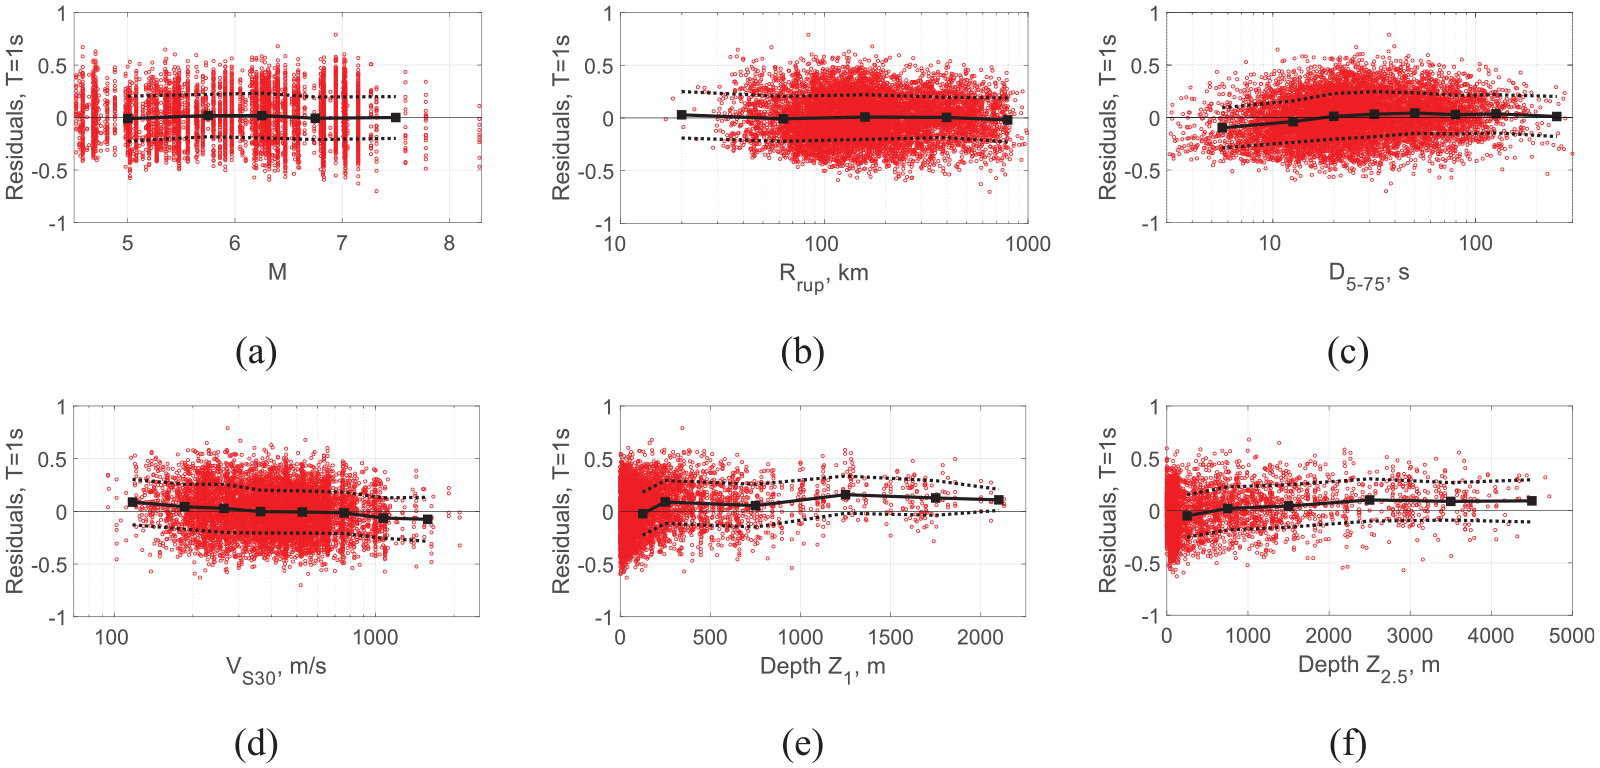
Example residual plots for subduction intraslab DSF model at 20% damping and 1-s period. The solid and dashed black lines show residual patterns, respectively, representing the mean and standard deviation of residuals in almost equally spaced bins of data.
The residuals are symmetrically scattered above and below the zero level with no obvious systematic trends with respect to
Figures 8 and 9 (d–f) also show the residuals with respect to site parameters
The proposed median DSF model
We calculate the proposed magnitude and distance-dependent global subduction DSF models according to Equation 3 and the regression coefficients in Tables 3 and 4. The resulting median DSFs are shown in Figure 10 for both interface and intraslab subduction earthquakes at three magnitudes of 7, 8, and 9 and at two distances of 75 and 300 km. In this figure, the crustal DSF model is also shown for comparison. Note that magnitude 9 and 300 km distance are extrapolations for the crustal model beyond its recommended range of applicability. In general, the peak of median DSF for intraslab earthquakes is shifted toward shorter periods and is more extreme in value (higher for damping less than 5% and lower for damping more than 5%), suggesting higher frequency content is present (the same behavior was seen in vertical crustal ground motions, Rezaeian et al., 2014b, which have higher frequency contents compared to horizontal motions). Also, the most significant differences between subduction and crustal events are seen at longer periods and at larger damping ratios, where the subduction DSF converges toward unity faster (with respect to period) than the crustal DSF. Differences are greater at larger magnitudes and distances where the crustal model is an extreme extrapolation and hence not expected to behave well. Physically, we expect the DSF to be 1 at very long periods (damping does not matter for extremely flexible structures). Observe that the DSF for various damping ratios converge toward unity at relatively shorter long periods for smaller magnitude events and for smaller distances. The proposed model in Equation 3 does not have any constraints to ensure that DSF is 1 at very long periods. Furthermore, the data quality decreases at long periods due to instrument limitations. Therefore, in the following section, we propose long-period adjustments to the DSF model for periods longer than 5 s.
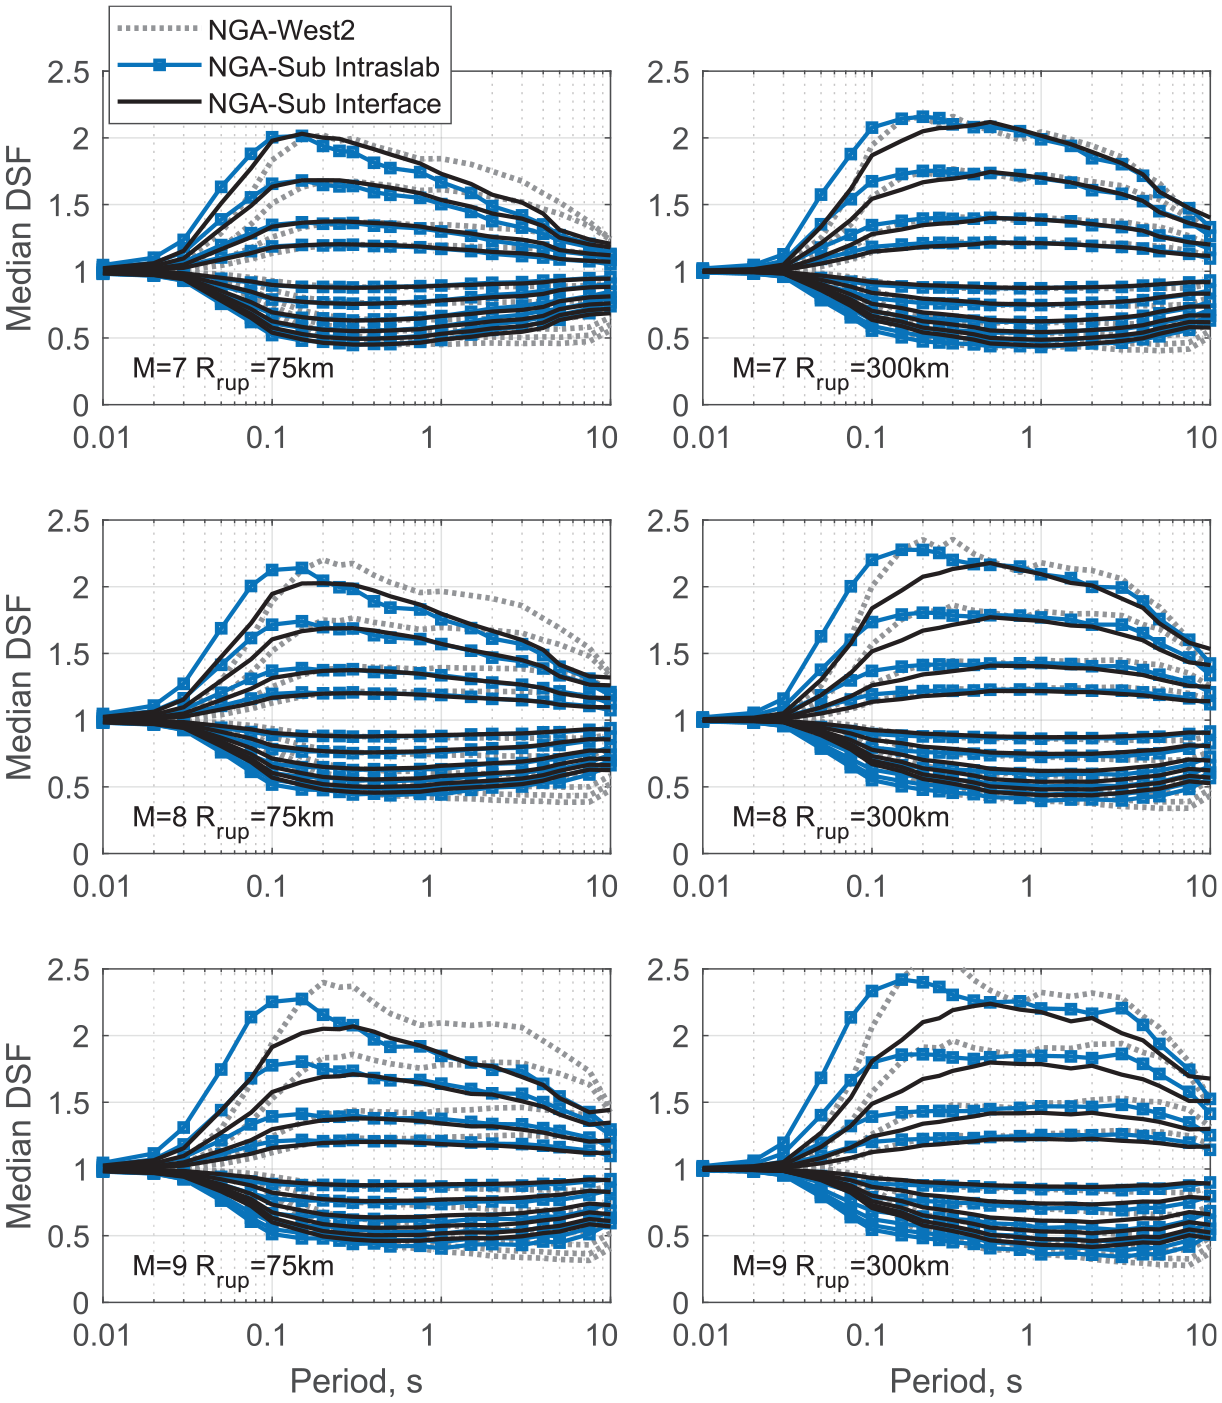
The proposed global subduction models for median DSF of interface and intraslab earthquakes based on Equation 3. The crustal model from “NGA-West2” (gray dotted lines) is superimposed for comparison. The curves from top to bottom correspond to damping ratios of 0.5%, 1%, 2%, 3%, 7%, 10%, 15%, 20%, 25%, and 30%.
Long-period adjustments
DSFs are expected to converge to 1 at very long periods. The spectral period at which DSF approaches 1 is a function of magnitude with the DSF for larger magnitudes approaching 1 at relatively longer periods (as also observed from empirical data in Figure 10). Using empirical data, the long-period scaling of median DSF is not well constrained for periods greater than 5 s due to data limitations. To adjust the DSF long-period scaling, a set of stochastic simulations are performed using SMSIM (Boore, 2005) with the two-corner point-source model for hypothetical crustal earthquakes.
The simulations are only used to inform the magnitude-dependence scaling of the empirical-based DSF values at 5 s, so that the DSF values are constrained to be 1 at very long periods. The simulated spectral amplitudes are not used directly; instead, the main use of these simulations is to determine the magnitude dependence of the corner frequency, which controls the frequency band with enough energy to lead to significant resonance of a single-degree-of-freedom oscillator at long periods. As a result, even though the validity of the SMSIM simulation approach might be questionable in terms of spectral amplitudes at long periods or for large magnitude events, it is a viable approach for our purposes. Spectral accelerations are simulated for magnitudes 5–8.5 at distances of 10 and 50 km for periods of 1–360 s. Median spectral acceleration is calculated over 20 realizations performed for each magnitude and distance scenario. As shown in Figure 10, the long-period convergence is also a function of distance; given that recordings from subduction earthquakes are mostly for larger distances, we use the results from 50 km simulations, a more appropriate distance range (compared to 10 km) for both crustal and subduction earthquakes.
For each magnitude distance scenario, DSF is computed for damping ratios of 0.5%, 2%, 10%, and 20%. For each scenario and each damping ratio, the value of


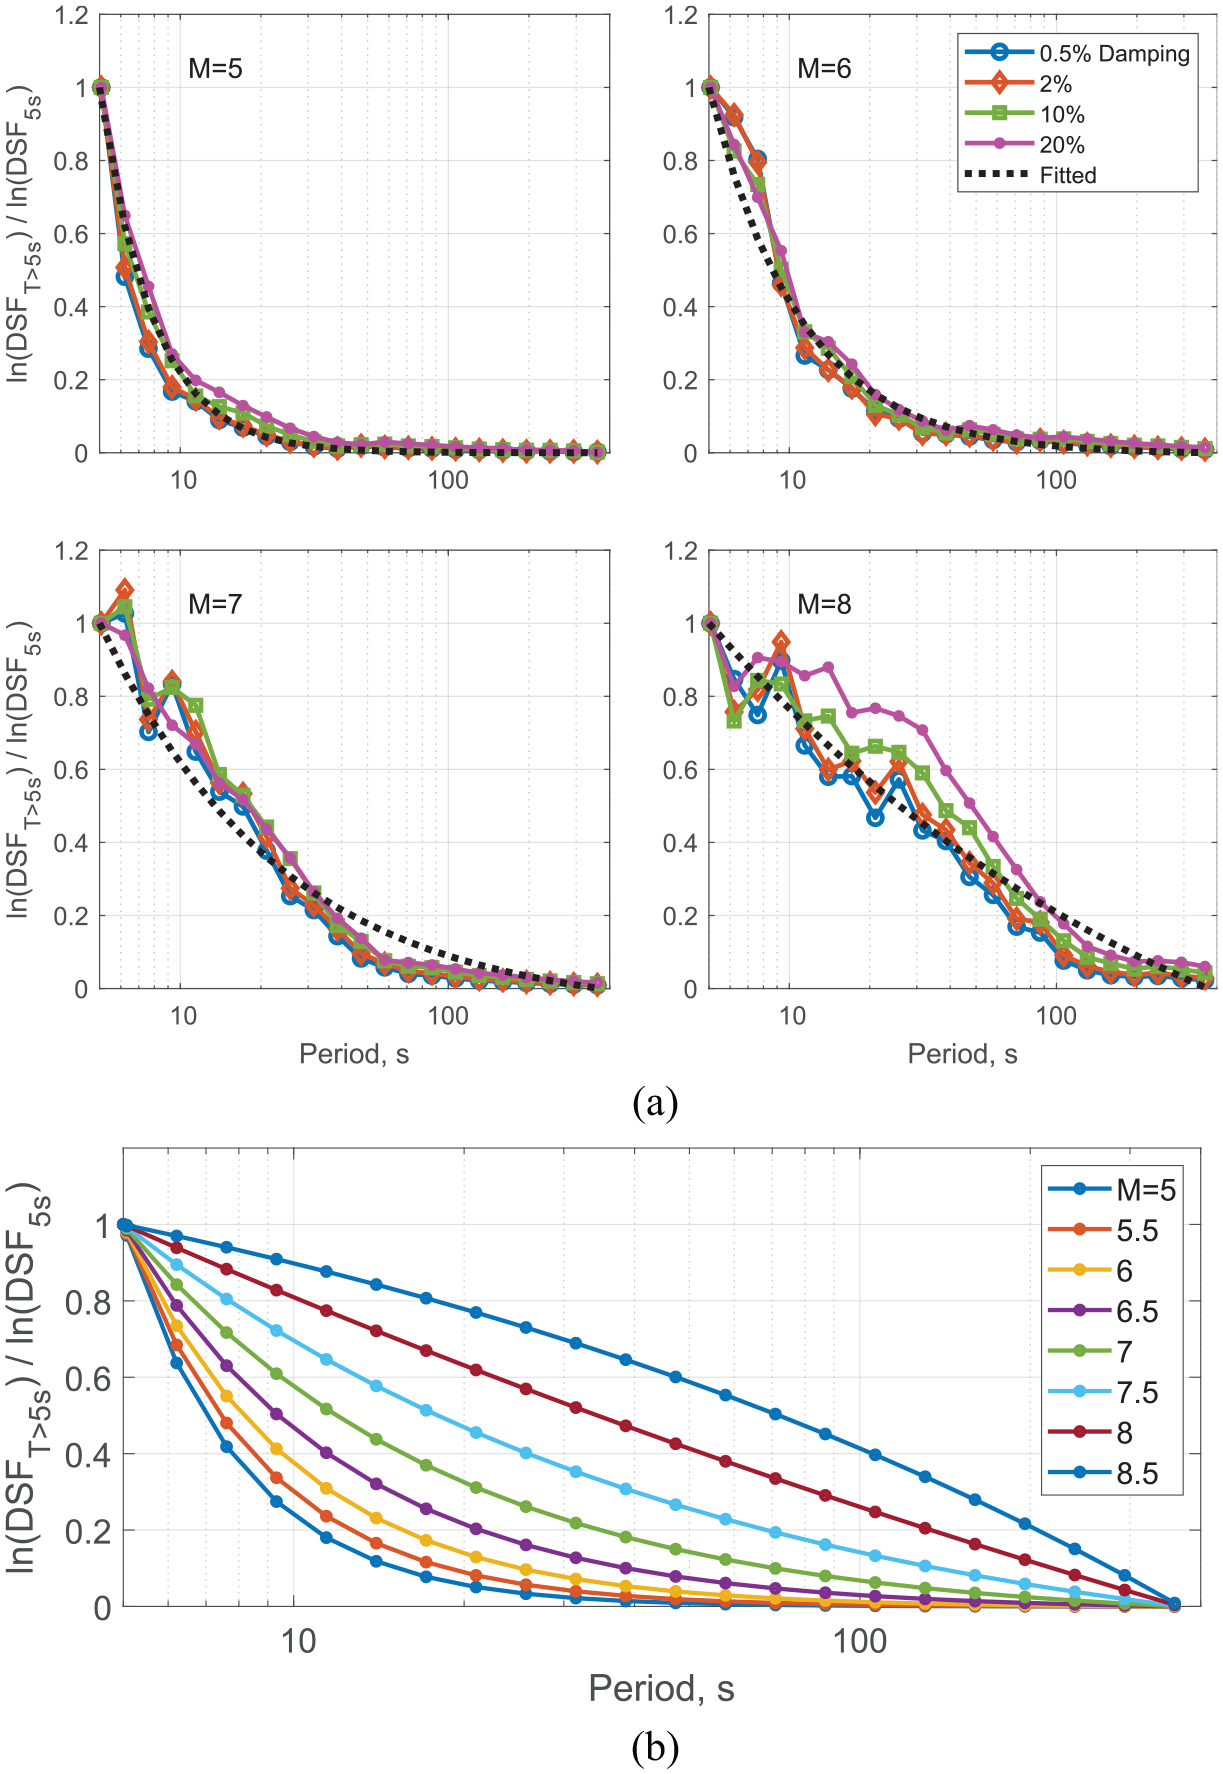
Long-period scaling for different magnitude earthquakes: (a) the colored curves show the scaling obtained from using SMSIM simulations for magnitudes 5, 6, 7, and 8 and for a distance of 50 km at damping ratios of 0.5%, 2%, 10%, and 20%. The fit to the data is shown with dotted black curves; (b) the fitted function, Equation 5, for long-period scaling is shown for different magnitude events from 5 to 8.5.
The proposed long-period DSF scaling model in Equation 5 is presented in Figure 11b for various magnitudes between 5 and 8.5. The median DSF model in Equation 3 is applicable for periods up to 5 s. For periods greater than 5 s, the median DSF obtained at 5 s is adjusted according to Equation 5. Figure 12 presents the median DSF adjusted for long periods for interface earthquakes with magnitudes 5, 6, 7, and 8 and distance of 75 km for damping ratios of 0.5%, 1%, 2%, 3%, 5%, 7%, 10%, 15%, 20%, 25%, and 30%. This figure compares the median DSF without long-period adjustment (solid lines) to the long-period adjusted median DSF (dotted lines) for periods between 5 and 10 s.
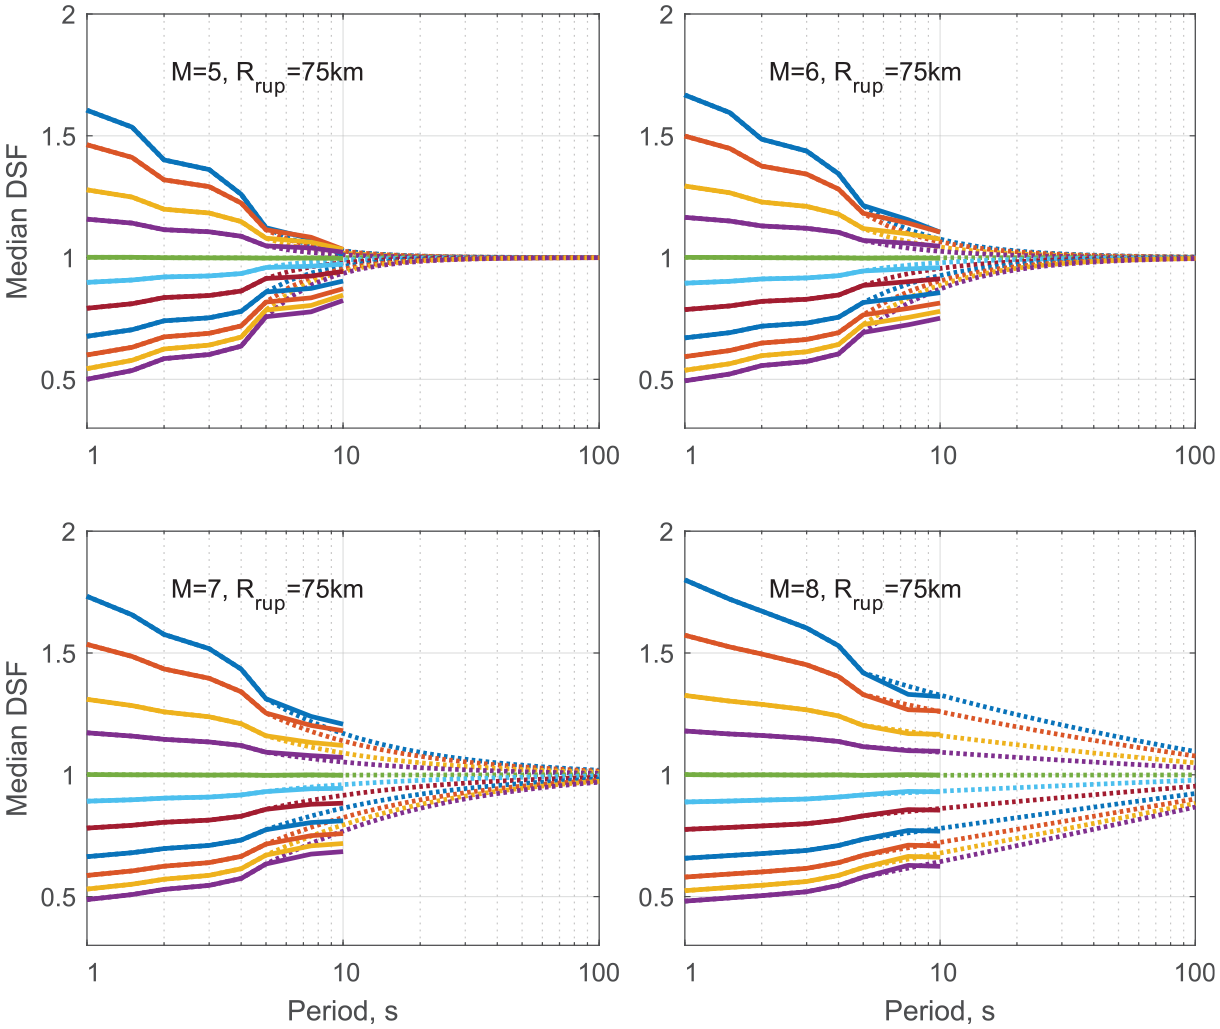
Long-period adjustment for median DSF for interface earthquakes with magnitudes 5, 6, 7, and 8 for a distance of 100 km. Solid lines show the unadjusted median DSF compared to the adjusted DSF at long periods in dashed lines. The curves from top to bottom correspond to damping ratios of 0.5%, 1%, 2%, 3%, 7%, 10%, 15%, 20%, 25%, and 30%.
Applicability of the model to specific regions
We compare the proposed global subduction models of median DSF (with the long-period adjustments) to the data from each of the seven subduction regions in Tables 1 and 2. This, along with residual analysis, helps to assess the applicability of the proposed global models for each region. Examples of such comparisons are shown in Figures 13 to 19, respectively, for Alaska, Cascadia, Central America and Mexico, South America, Japan, Taiwan, and New Zealand. The main challenge in assessing the regional applicability is that the data from some regions are very limited; for example, Alaska and Cascadia do not have enough large magnitude data for interface earthquakes (Tables 1 and 2). The use of a global model is recommended in the absence of sufficient data in such regions and overfitting the model to such limited data is not recommended.
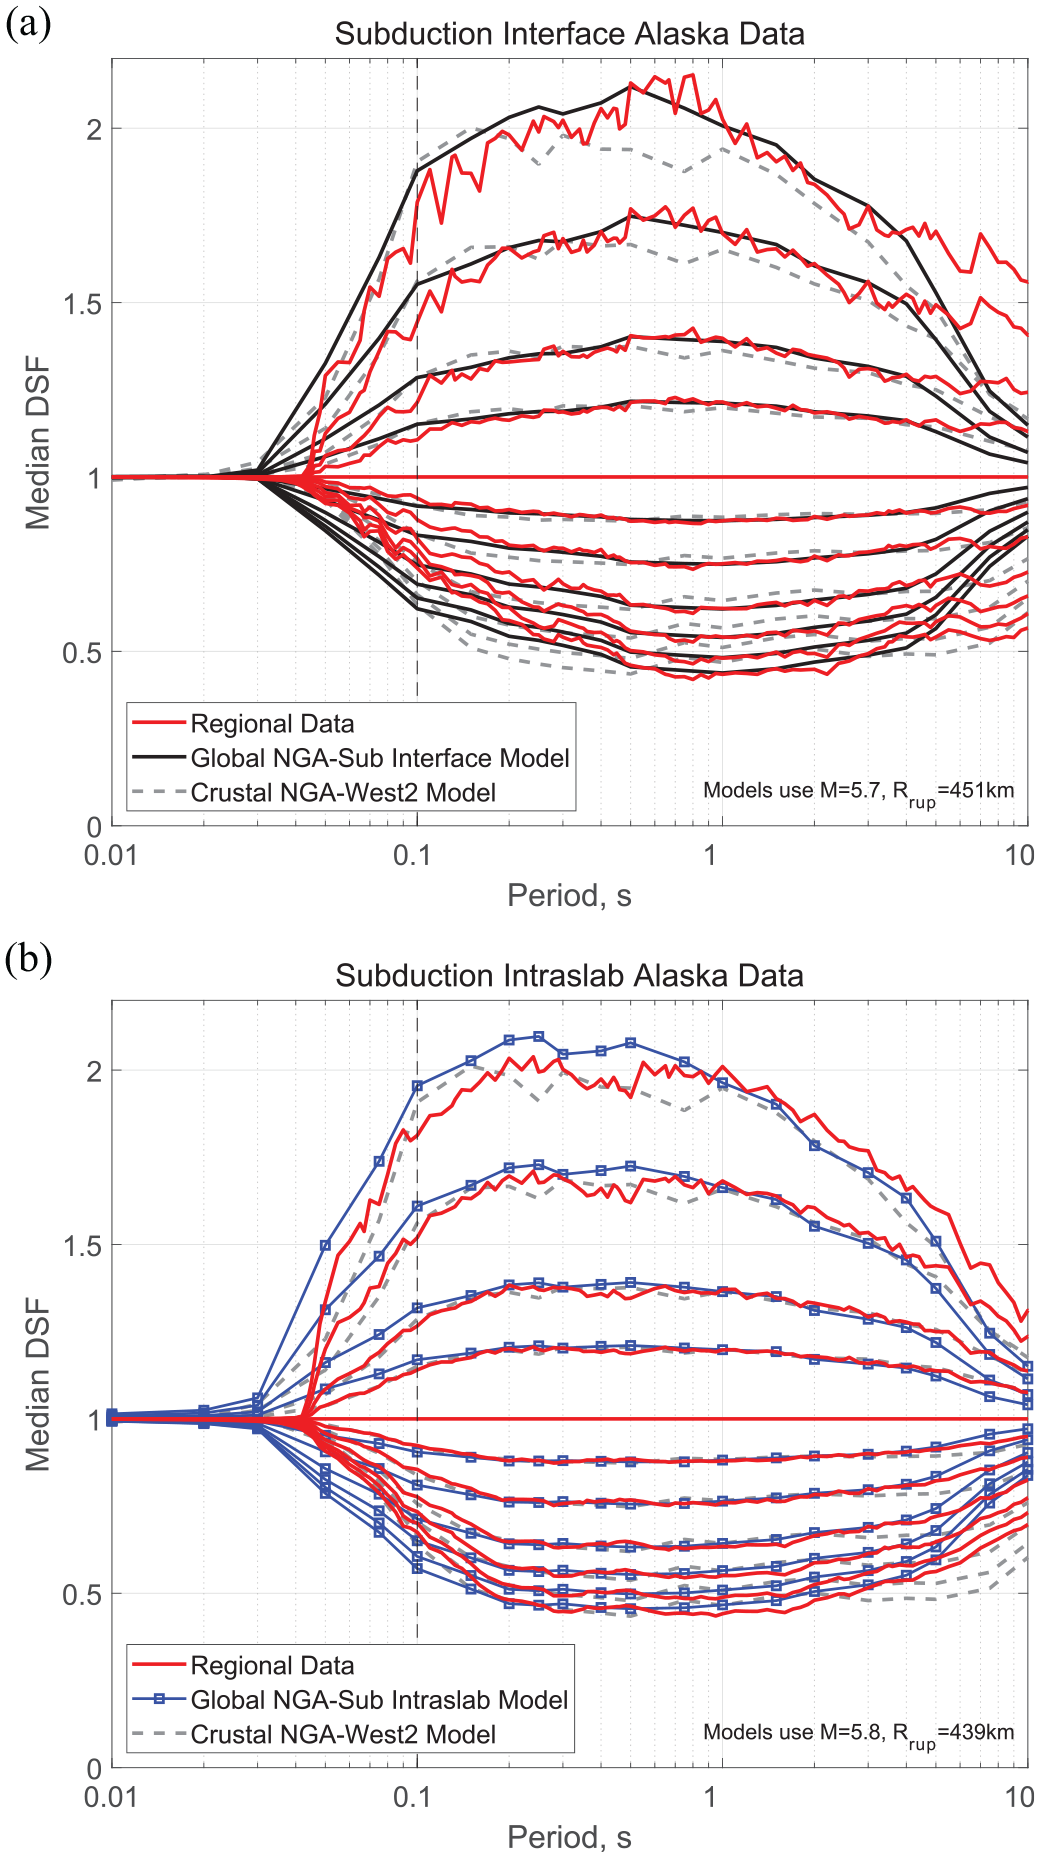
Alaska data versus proposed global models of DSF for subduction (a) interface and (b) intraslab earthquakes. The curves from top to bottom correspond to damping ratios of 0.5%, 1%, 2%, 3%, 5%, 7%, 10%, 15%, 20%, 25%, and 30%.
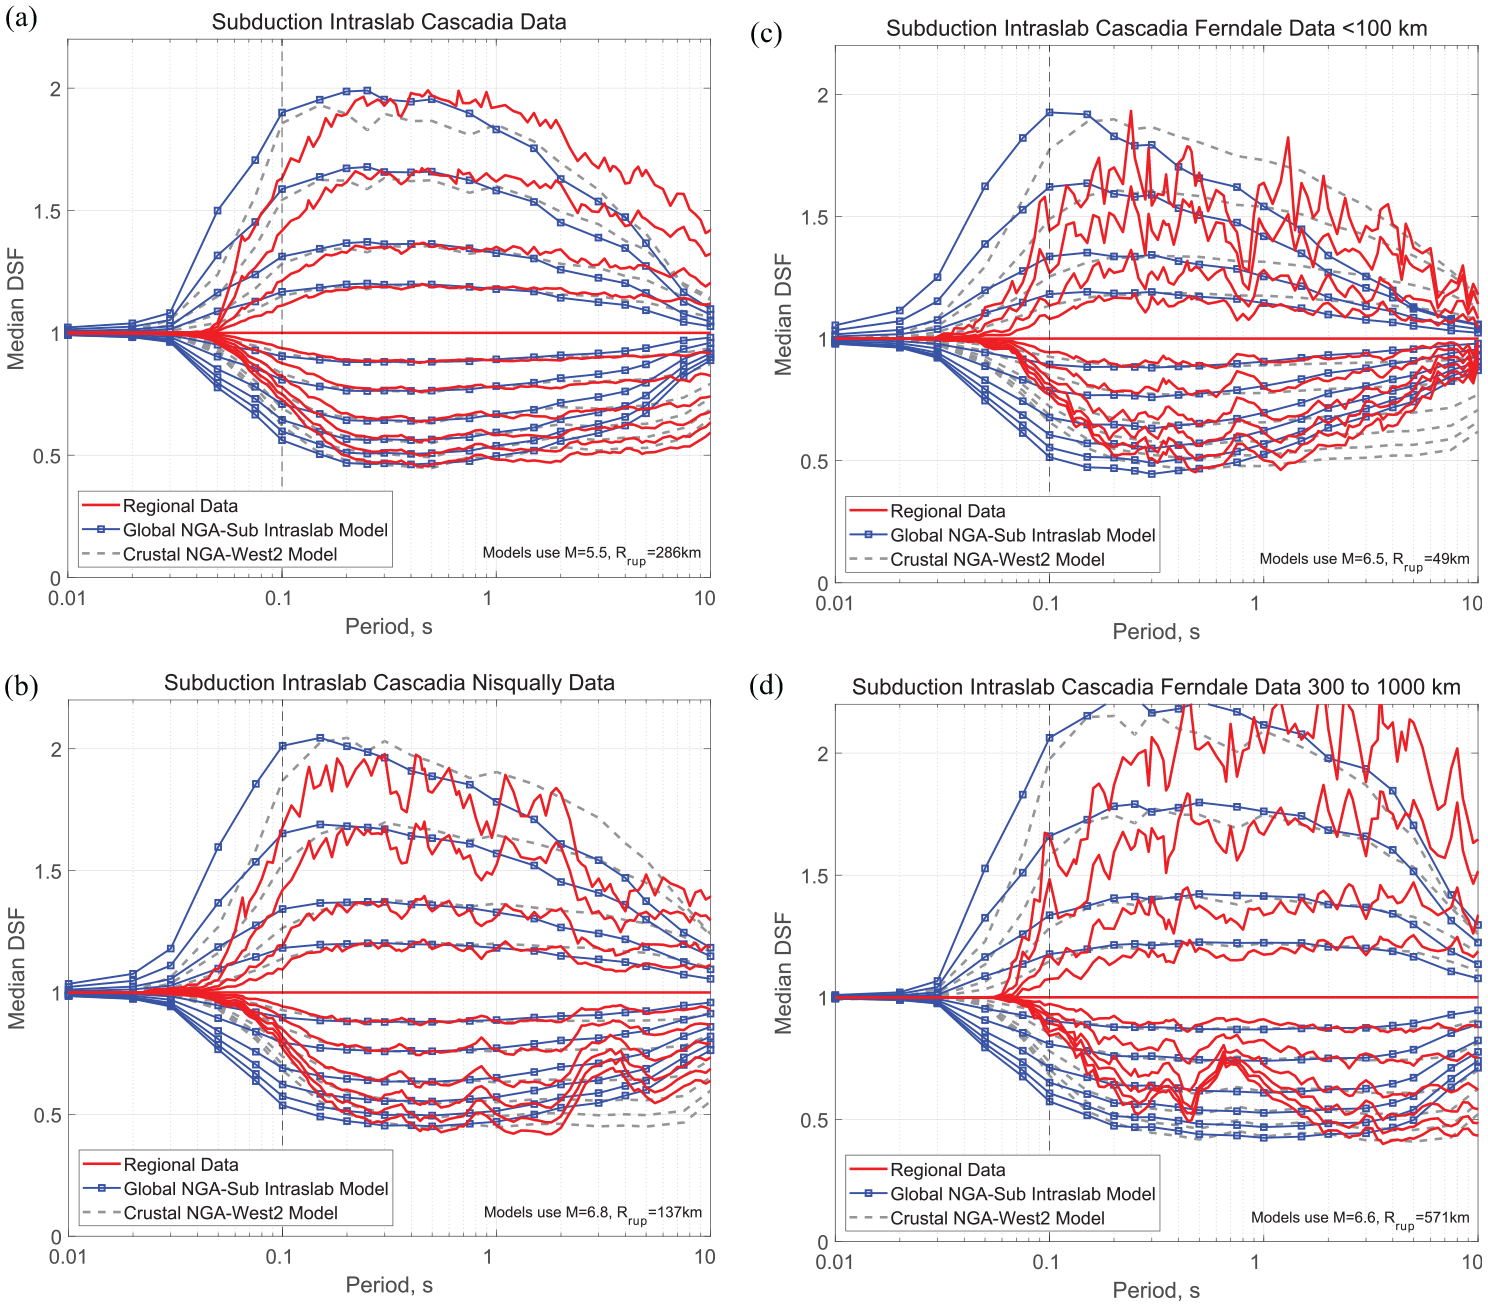
Cascadia data versus the proposed global model of DSF for subduction intraslab earthquakes: (a) all CAS data (Table 2); (b) Nisqually earthquake data with 104 recordings; (c) Ferndale earthquake data with 17 records with distances less than 100 km, and (d) Ferndale earthquake data with 30 records between 300 and 1000 km. The curves from top to bottom correspond to damping ratios of 0.5%, 1%, 2%, 3%, 5%, 7%, 10%, 15%, 20%, 25%, and 30%.
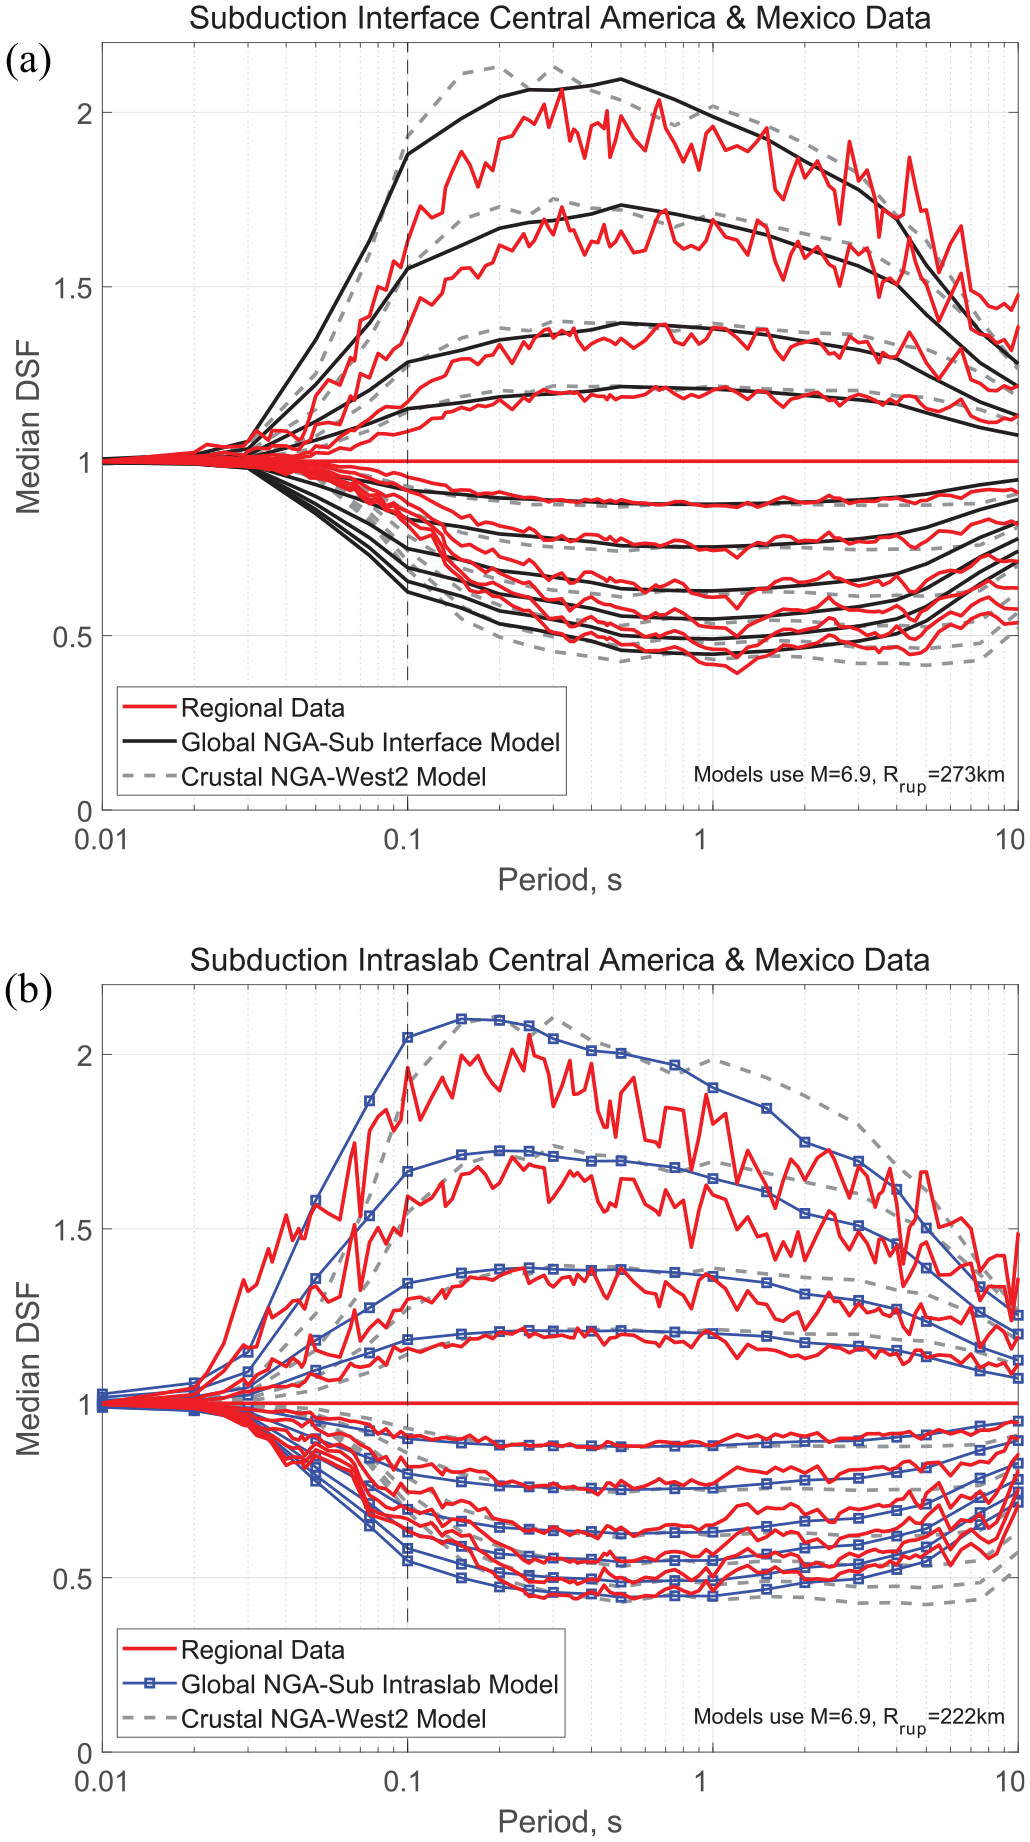
Central America and Mexico data versus proposed global models of DSF for subduction (a) interface and (b) intraslab earthquakes. The curves from top to bottom correspond to damping ratios of 0.5%, 1%, 2%, 3%, 5%, 7%, 10%, 15%, 20%, 25%, and 30%.
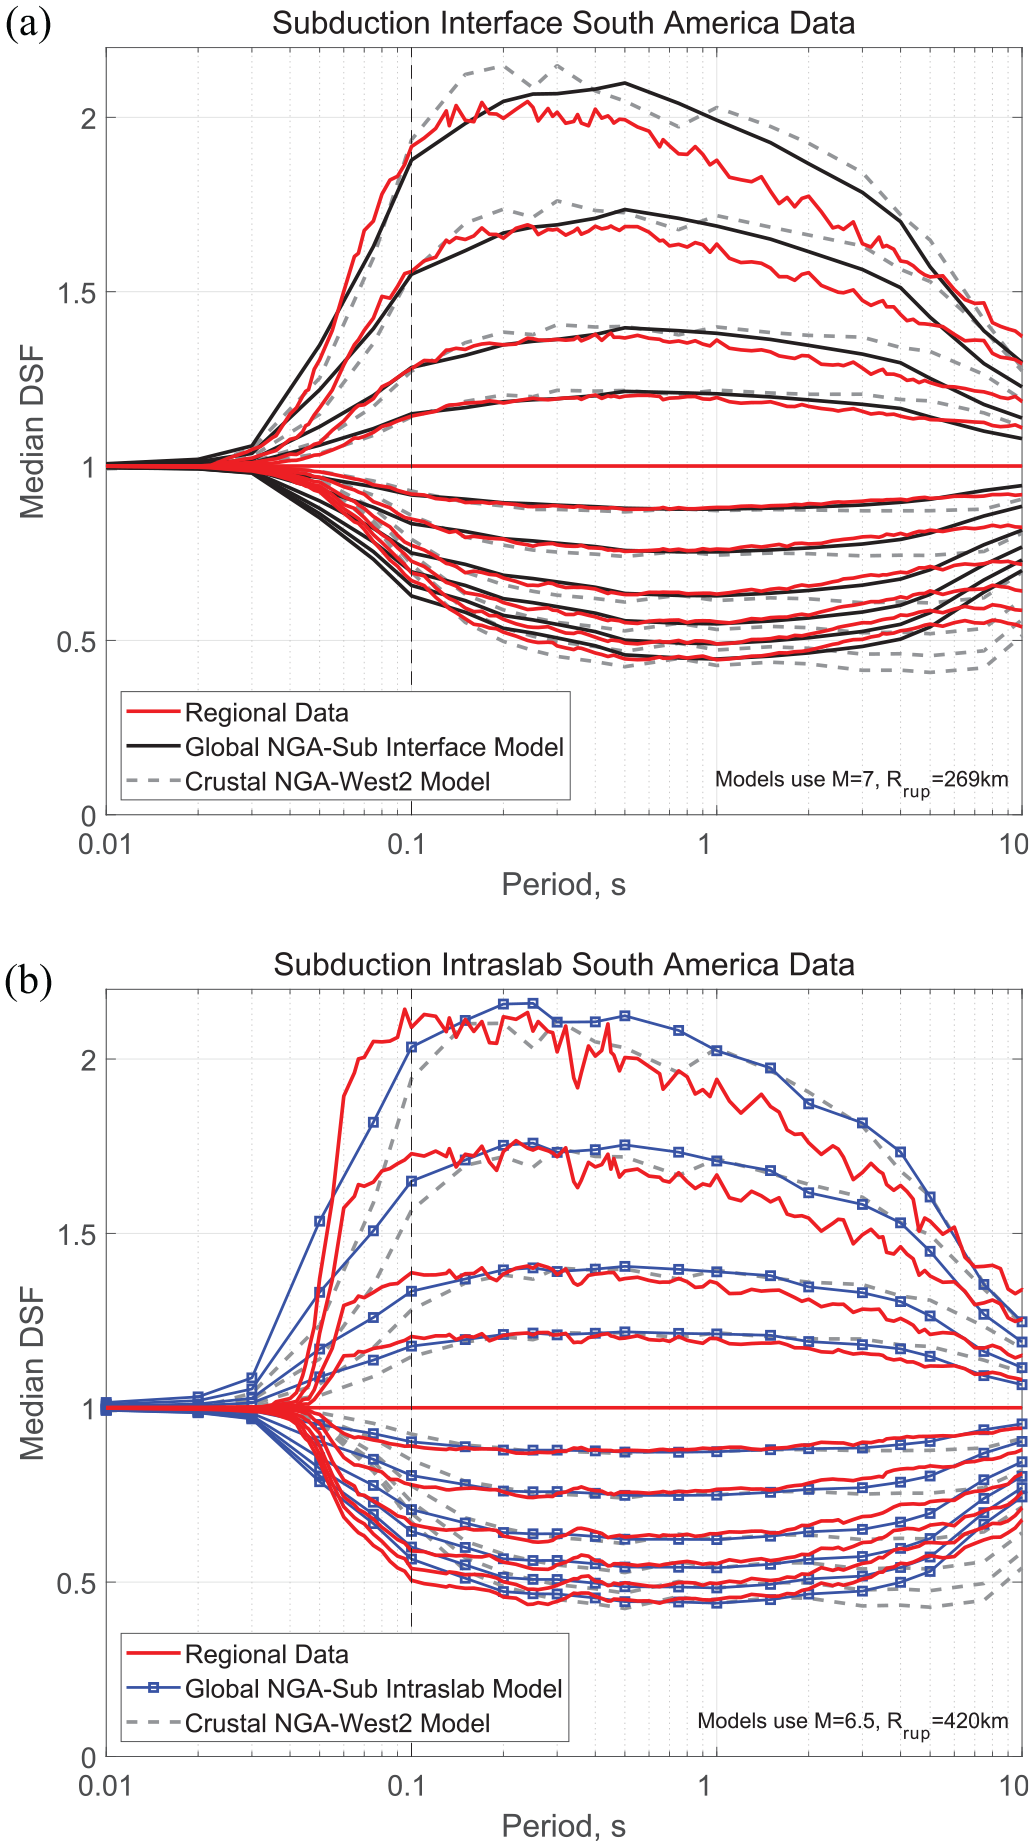
South America data versus proposed global models of DSF for subduction (a) interface and (b) intraslab earthquakes. The curves from top to bottom correspond to damping ratios of 0.5%, 1%, 2%, 3%, 5%, 7%, 10%, 15%, 20%, 25%, and 30%.
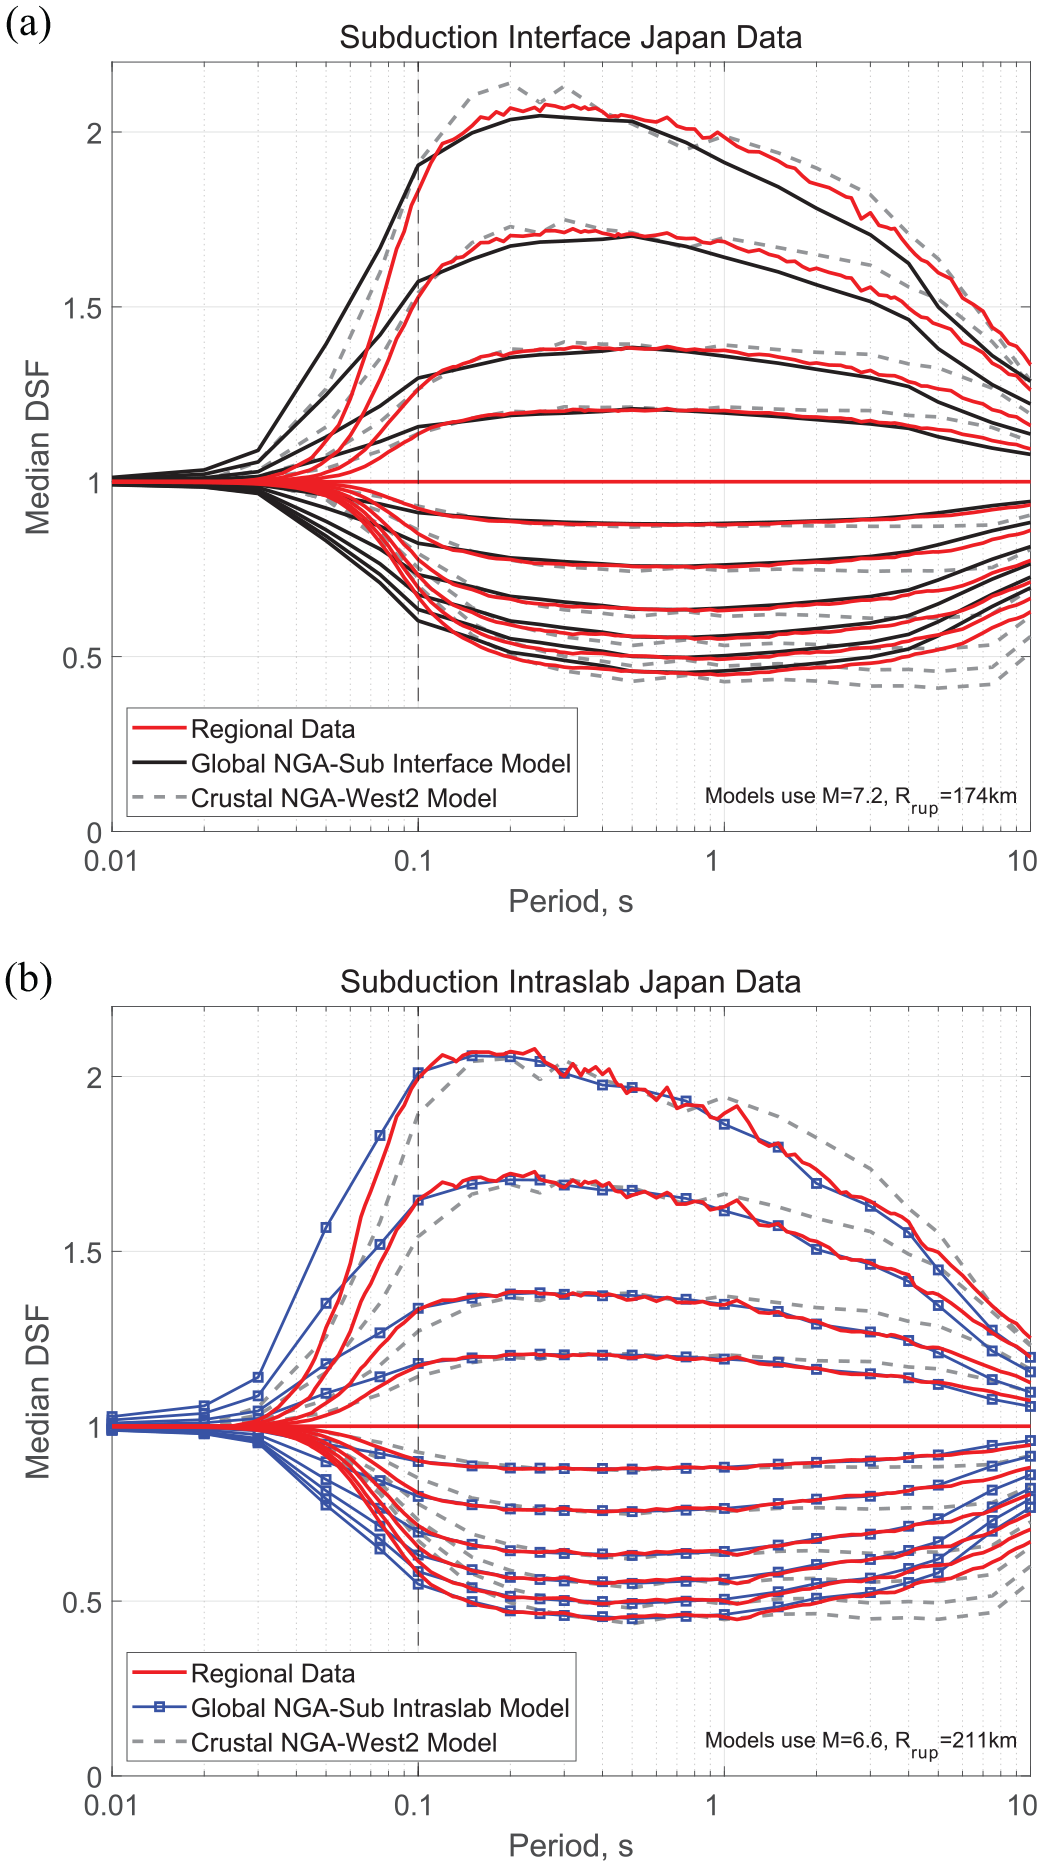
Japan data versus proposed global models of DSF for subduction (a) interface and (b) intraslab earthquakes. The curves from top to bottom correspond to damping ratios of 0.5%, 1%, 2%, 3%, 5%, 7%, 10%, 15%, 20%, 25%, and 30%.
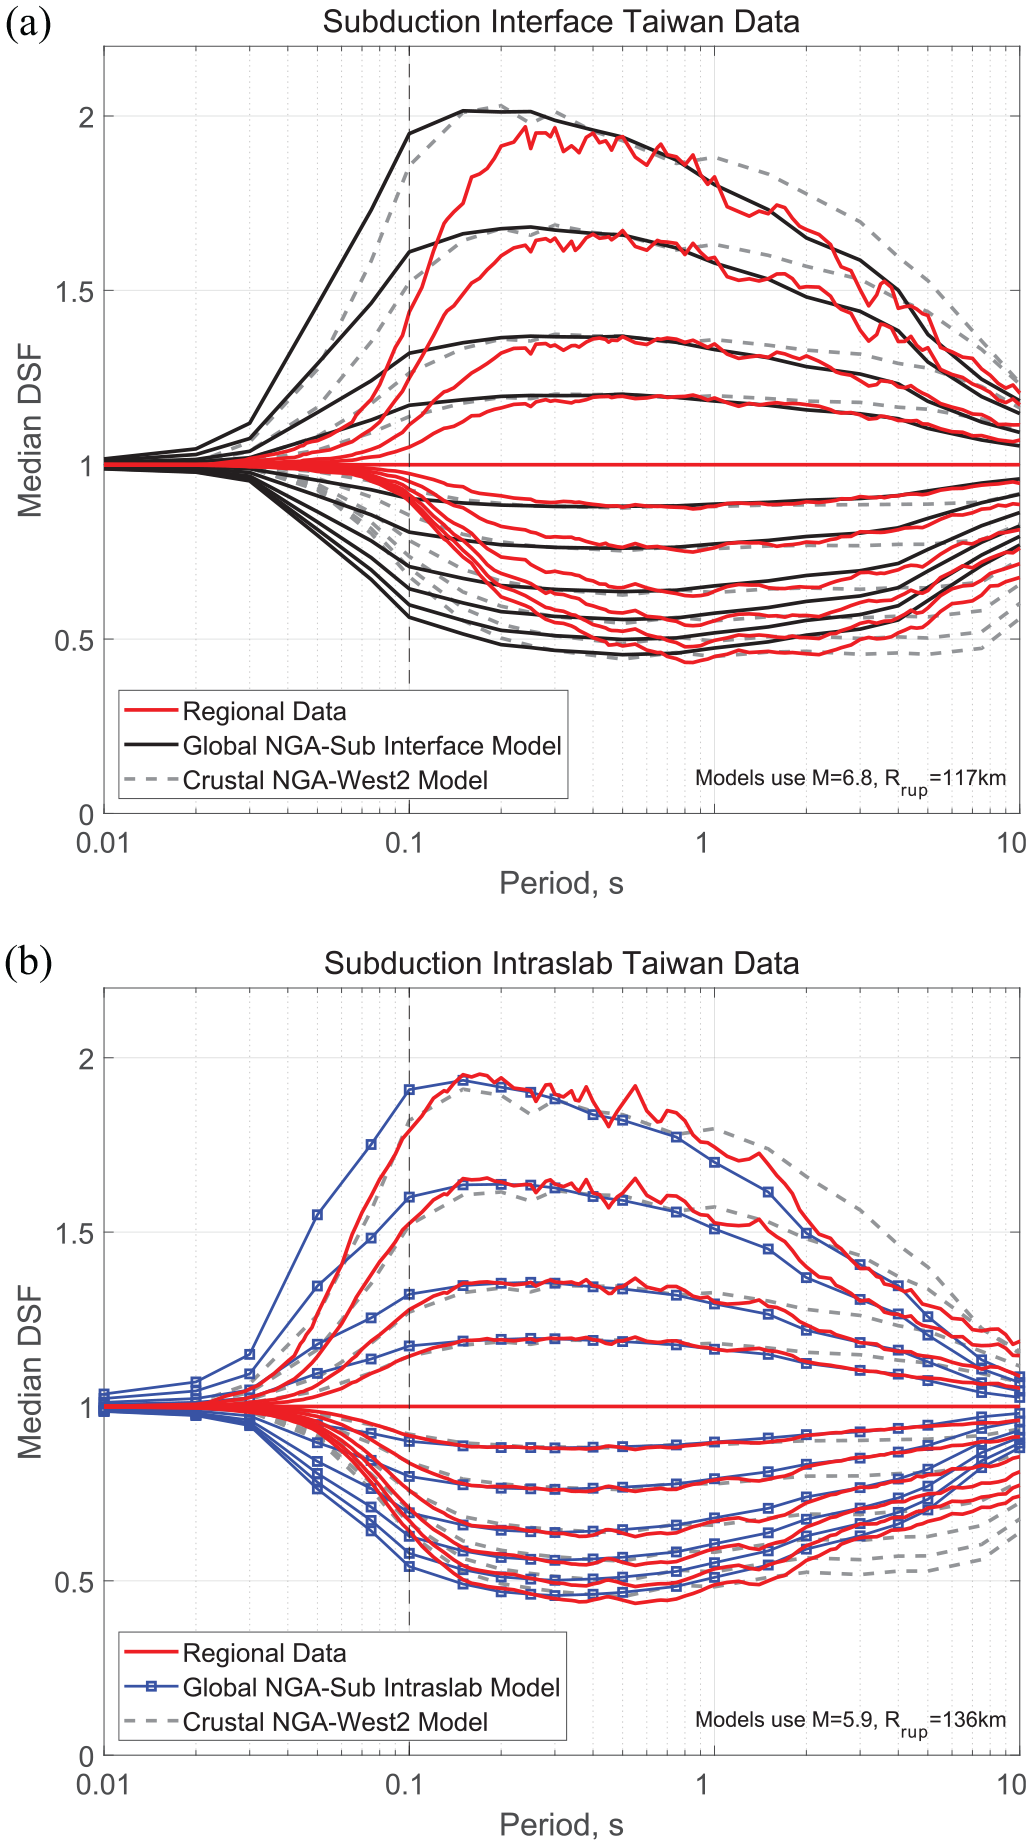
Taiwan data versus proposed global models of DSF for subduction (a) interface and (b) intraslab earthquakes. The curves from top to bottom correspond to damping ratios of 0.5%, 1%, 2%, 3%, 5%, 7%, 10%, 15%, 20%, 25%, and 30%.
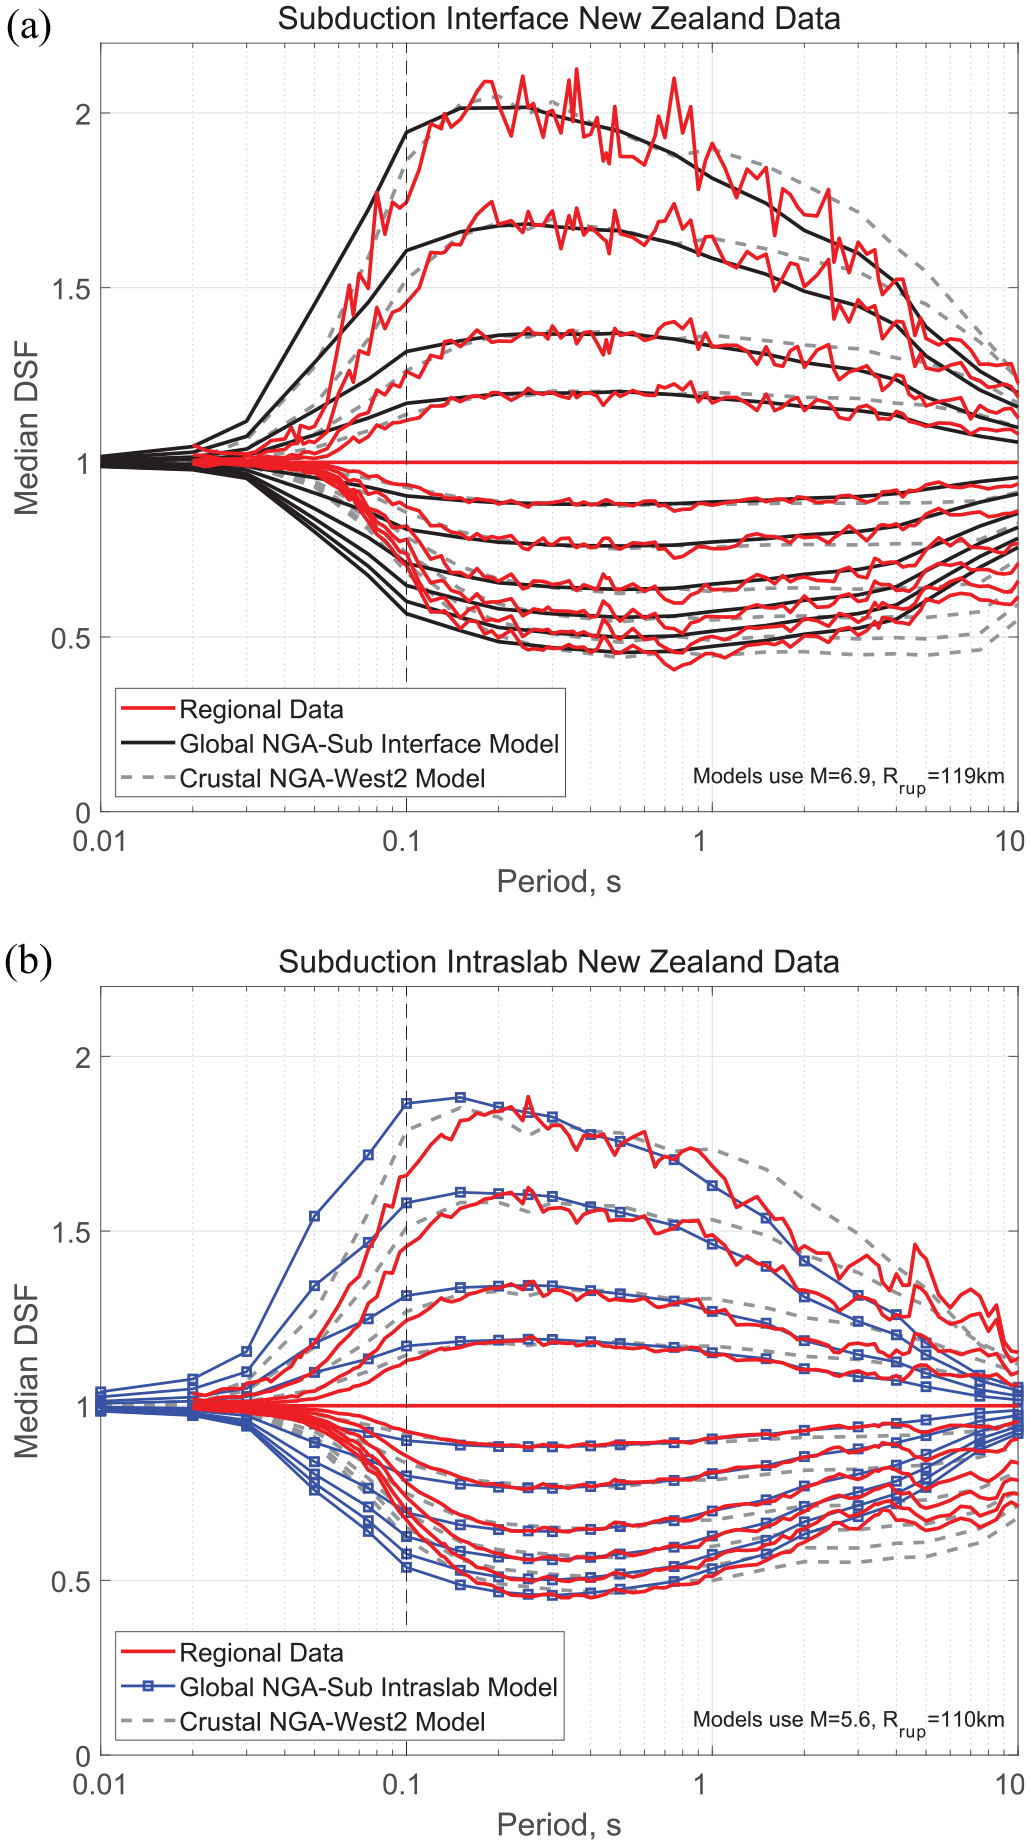
New Zealand data versus proposed global models of DSF for subduction (a) interface and (b) intraslab earthquakes. The curves from top to bottom correspond to damping ratios of 0.5%, 1%, 2%, 3%, 5%, 7%, 10%, 15%, 20%, 25%, and 30%.
The models in Figures 13 to 19 are calculated and plotted for magnitudes and distances equal to the mean values of magnitude and distance for the selected set of regional data. These values are presented within each figure, for example,
The best fit to the data is observed for Japan (Figure 17), which has the greatest number of recordings in the database, followed by good fits for Alaska (Figure 13), South America (Figure 16), Taiwan for intraslab earthquakes (Figure 18b), and New Zealand for interface earthquakes (Figure 19a). The fit to the data for Central America and Mexico region (Figure 15) is acceptable, despite the fewer number of recordings in this region that results in non-smooth curves in Figure 15. Improvement to the proposed model through the long-period adjustments of Equation 5 can be observed in Figure 19b for New Zealand intraslab earthquakes, where the long period data do not behave as expected.
For Cascadia, there are very few recordings to make regional comparisons for interface earthquakes (see Table 1); therefore, Figure 14 only shows the comparison of the global model to data from intraslab earthquakes. The fit of the global model to data is not as good as in other regions when considering all Cascadia recordings collectively (Figure 14a). To better understand this region, Figures 14b to d show the same comparison for two individual earthquakes in the Cascadia database: the 2001 Nisqually earthquake (NGA-Sub Earthquake ID 2000004) with a magnitude 6.8 and 104 recordings (Figure 14b), and the 2010 Ferndale earthquake (NGA-Sub Earthquake ID 2000014) with a magnitude 6.55 and 54 recordings (Figures 14c and d). The fit of the model to Nisqually data is very good (Figure 14b). However, the fit to Ferndale data depends on the distance range; the fit is good for distances less than 100 km with 17 recordings (Figure 14c), except around 1 s where data behavior is unusual; the fit is also good for distances between 100 and 300 km (not shown here due to the few number of recordings, 7, that result in very jagged curves); the fit for distances greater than 300 km (Figure 14d), where most Ferndale recordings are available (30 out of 54) is not good. Considering that the behavior of data is unusual in Figure 14d, especially around 1 s and longer periods, we consider this as an example where the model should not be overfitted to data. Furthermore, because the Ferndale earthquake was in the Mendocino fracture zone, some experts may not consider it an interface or intraslab event. Therefore, we recommend the proposed global DSF model for use in the Cascadia region, considering the nice fit to the Nisqually earthquake data.
For Taiwan interface events (Figure 18), the fit of the proposed global model is not ideal for periods less than 0.3 s. This could be attributed to the regional differences, which result in ground motions with different frequency contents. The spectral shapes for recordings from Taiwan interface earthquakes indicate that the peak of the spectra happens at longer periods (about 0.6 s) for Taiwan recordings compared with other regions (about 0.2 to 0.4 s for Japan recordings). Such regional differences for Taiwan interface earthquakes (resulting in differences between the data and the model in Figure 18a) are also observed by the NGA-Sub GMM developers (oral communications with the authors of Kuehn et al., 2020, and Parker et al., 2020). The global DSF model could be improved for use in Taiwan locations by including region-specific site parameters for this region in future studies. We do not recommend the use of our proposed global DSF model for Taiwan subduction interface earthquakes for periods shorter than 0.3 s for damping ratios less than 5%, or for periods shorter than 0.5 s for damping ratios greater than 5%. In all other cases, the global model is recommended.
Comparison with other models
In previous sections, we compared our proposed subduction DSF model (NGA-Sub interface and intraslab models) with data for various regions and with the crustal NGA-West2 model of Rezaeian et al. (2012, 2014a). The crustal NGA-West2 DSF model had been compared with other crustal models and with models used in building design regulations (also based on crustal models) in Rezaeian et al. (2012); such comparisons are not repeated in this article given that our focus is on subduction earthquakes. Most of the existing DSF models for subduction earthquakes, summarized in the “Introduction,” are either very limited in their range of applicability, have different parameters, or are developed for a specific region that observes a combination of subduction interface, subduction intraslab, and crustal earthquakes, and are therefore not comparable to our proposed models for interface and intraslab earthquakes. The only recent model for subduction earthquakes that is comparable to our proposed model is that of Daneshvar et al. (2016, 2017), which was developed using local data from southwestern British Columbia (Canada) enhanced by recordings from Japan. This model is compared to our proposed model in Figure 20.
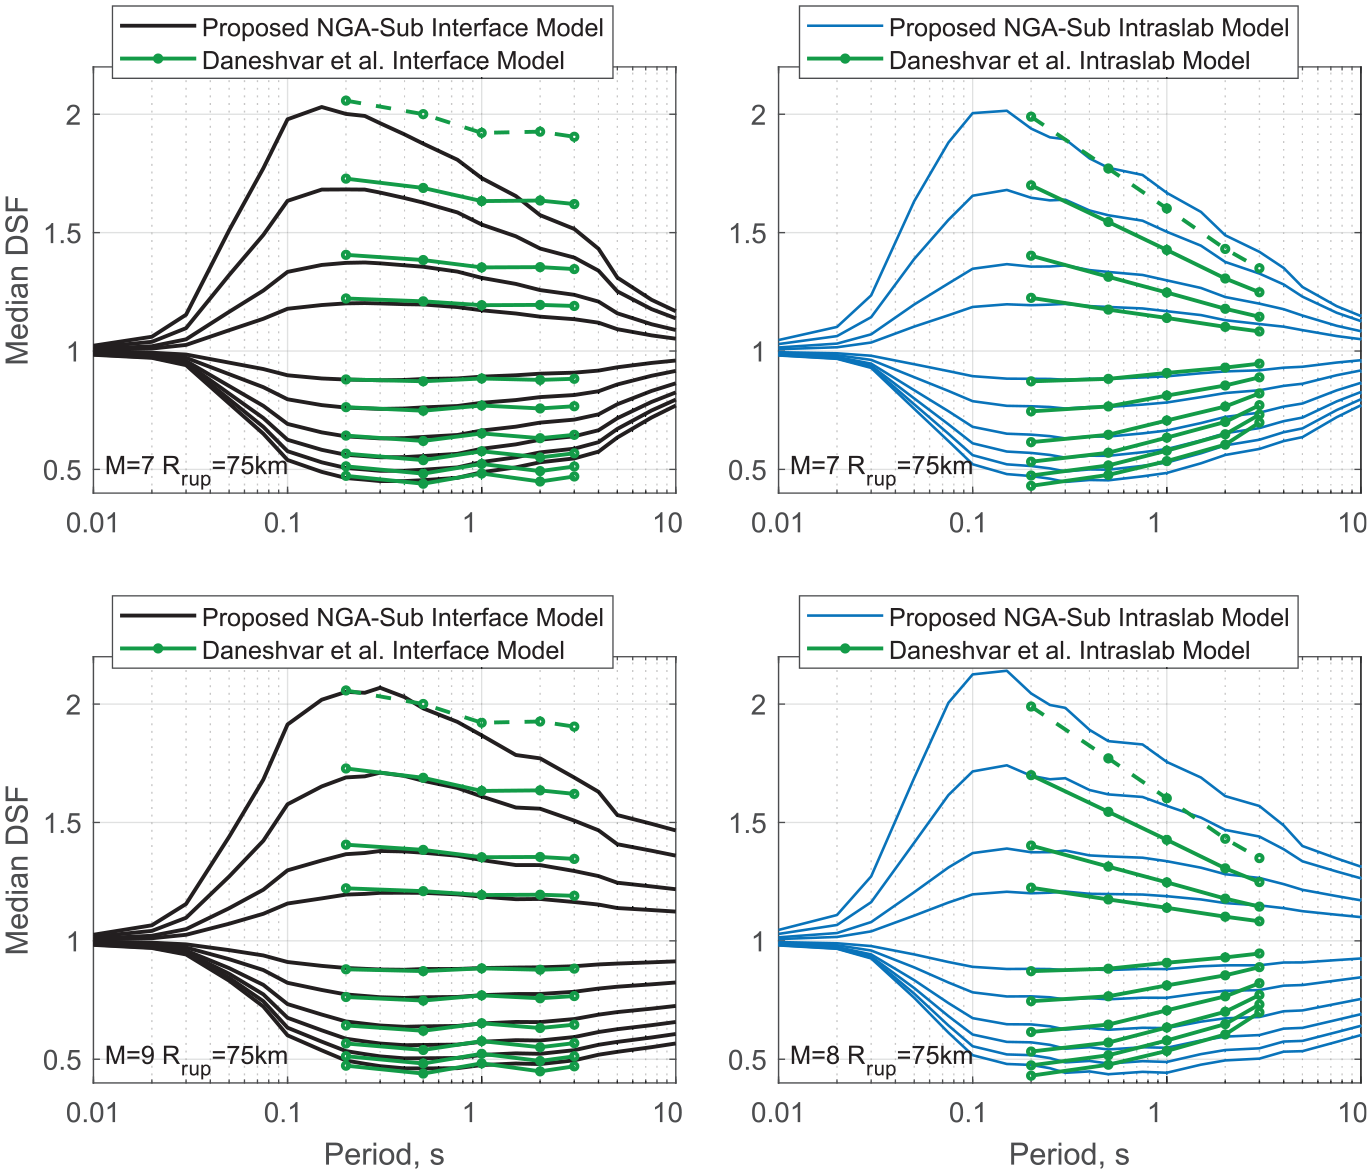
Comparisons between our proposed NGA-Sub model of DSF and the Daneshvar et al. (2016, 2017) model for subduction interface and intraslab earthquakes at two magnitudes (7 and 9 for interface, 7 and 8 for intraslab), at 75 km distance. The curves from top to bottom correspond to damping ratios of 0.5%, 1%, 2%, 3%, 7%, 10%, 15%, 20%, 25%, and 30%. The Daneshvar et al. model is the same for different magnitudes, it is calculated assuming a soil class C and
To calculate the Daneshvar et al. (2016, 2017) model, a soil class C (as defined by Daneshvar et al., 2016) and a
The Daneshvar et al. (2016, 2017) model is not a function of magnitude or distance, and therefore, it is the same for
Figure 21 compares our proposed NGA-Sub model with the models in two building design regulations, ASCE/SEI 7-10, 2010, and EN 1998-1, 2004. As previously mentioned, these regulations are period-independent and based on models developed for crustal earthquakes. They are also not dependent on magnitude or distance; therefore, they are the same for all four subplots in Figure 21, which represent different magnitudes and distances. They are shown for a period range of 0.2–5 s and for damping ratios of 2%, 10%, 20%, and 30%. Observe that depending on the damping ratio, period, event type, magnitude, or distance of interest, they can be very conservative or unconservative.
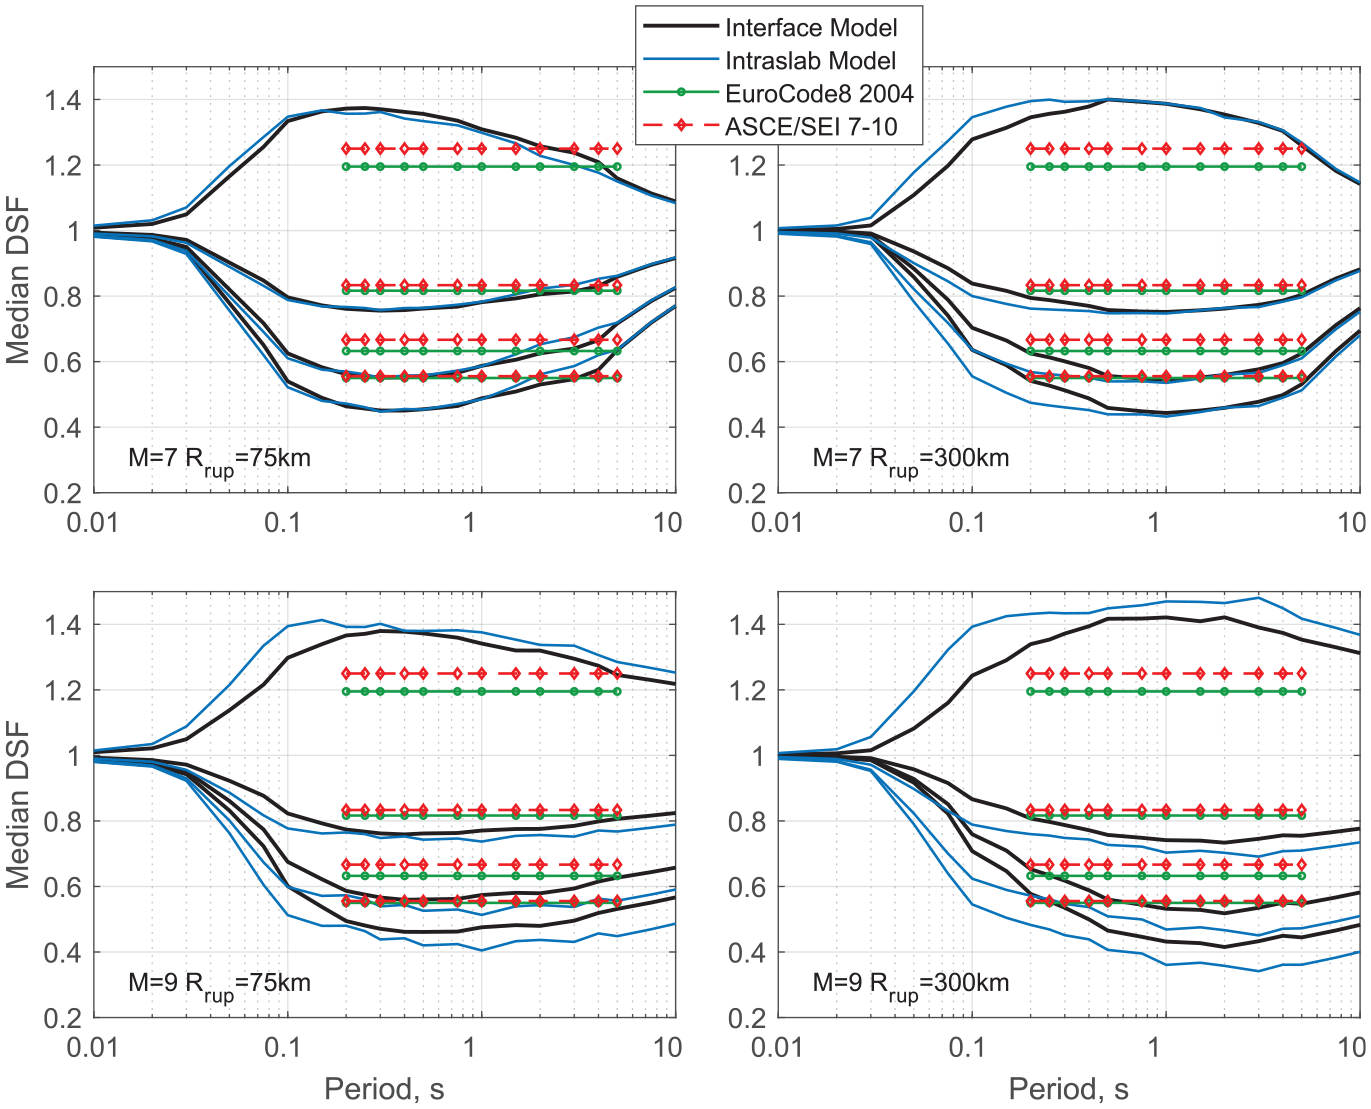
Comparisons between our proposed DSF models for subduction interface and intraslab earthquakes and the models in building code regulations for EuroCode 8 (EN 1998-1, 2004) and ASCE/SEI 7-10 (2010) at two magnitudes of 7 and 9, and two distances of 75 and 300 km. The EuroCode 8 (EN 1998-1, 2004) and ASCE/SEI 7-10 (2010) are based on crustal models and period independent; they are also independent of magnitude and distance and therefore are the same in all panels. The curves from top to bottom correspond to damping ratios of 2%, 10%, 20%, and 30%.
Application of the model to NGA-Subduction GMMs
To demonstrate the application of the DSF model, Figure 22 scales the 5% damped response spectrum for different damping ratios, using two example scenarios: one for a subduction interface event of magnitude 9, and one for a subduction intraslab event of magnitude 7, both at a distance of 75 km.
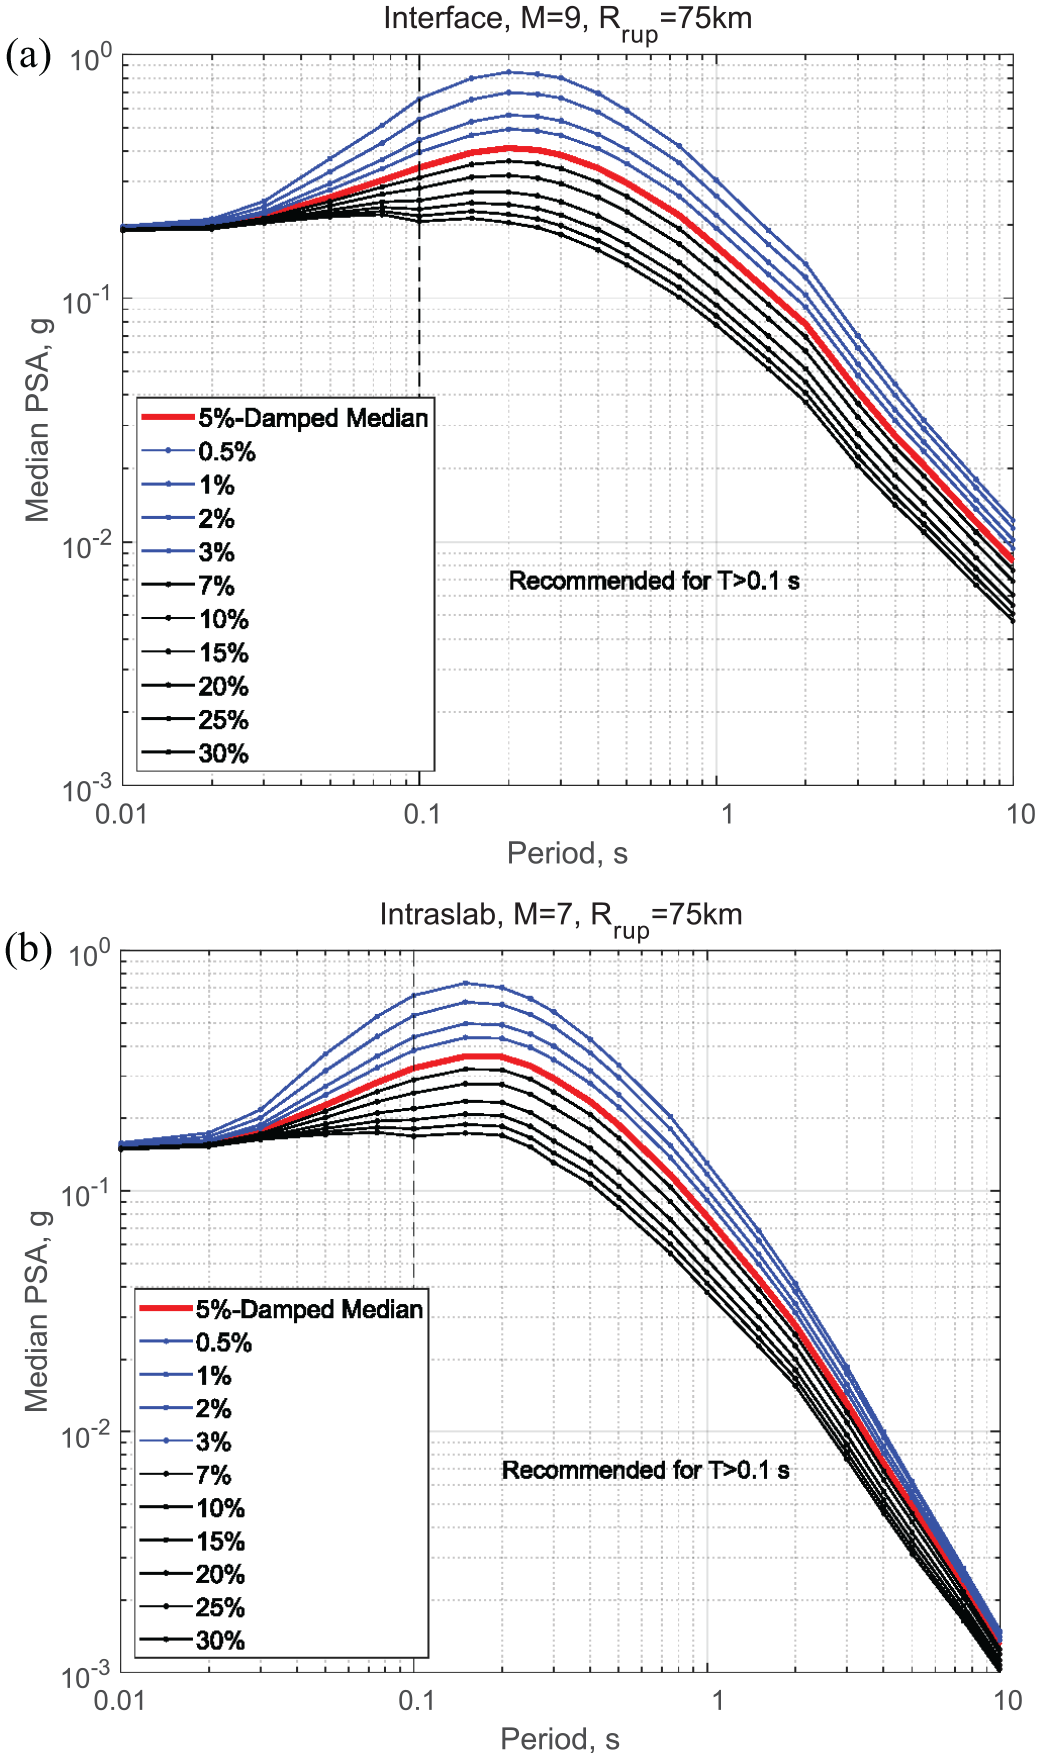
Average of two NGA-Subduction GMMs (KBCG20 and PSBAH20) are used for 5%-damped medians for (a) an interface global scenario for a magnitude 9 earthquake, assuming
The 5% damped PSA is calculated by taking the average of two NGA-Subduction GMMs, KBCG20 (Kuehn et al., 2020) and PSBAH20 (Parker et al., 2020, 2021). Global versions of the models without regional assumptions or epistemic sampling are used. The GMMs are not adjusted for backarc (an input parameter indicating the location with respect to the volcanic arc) or deep basin effects. Assumptions for input parameters, depth to the top of rupture
The proposed standard deviation model
The proposed standard deviation model for
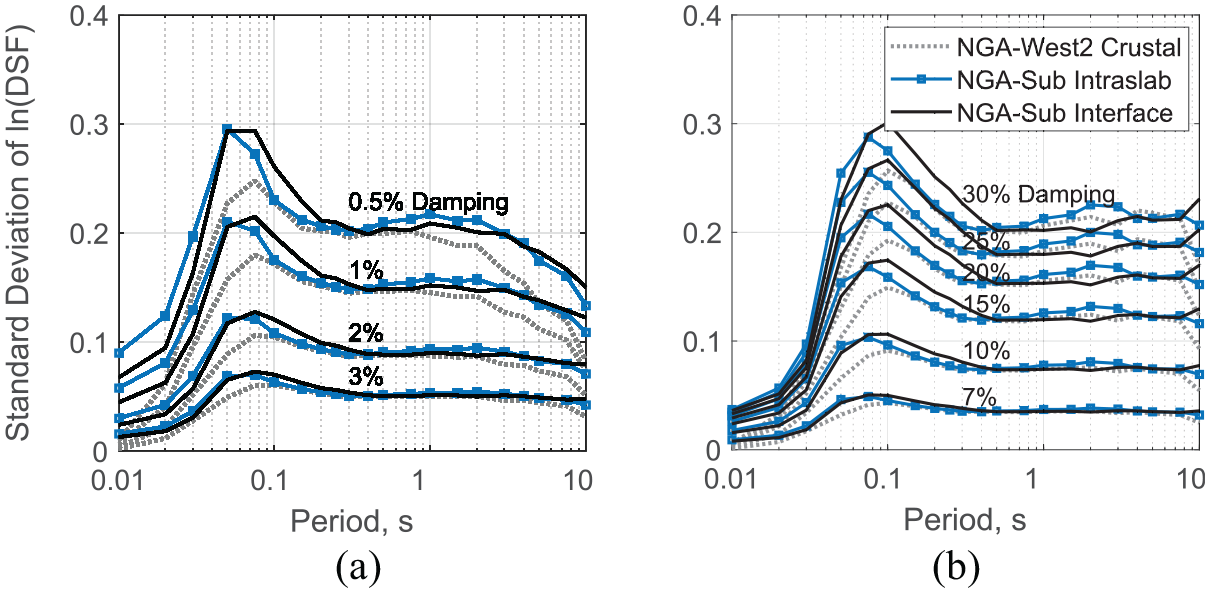
The proposed global subduction models for standard deviation of ln (DSF) according to Equation 4 for damping ratios (a) less than 5%, and (b) more than 5%. The crustal model from “NGA-West2” (gray dotted lines) is superimposed for comparison.
Application of standard deviation model
The standard deviation of the scaled response spectrum,

where
We calculate sample correlation coefficients,
Sample correlation coefficients between
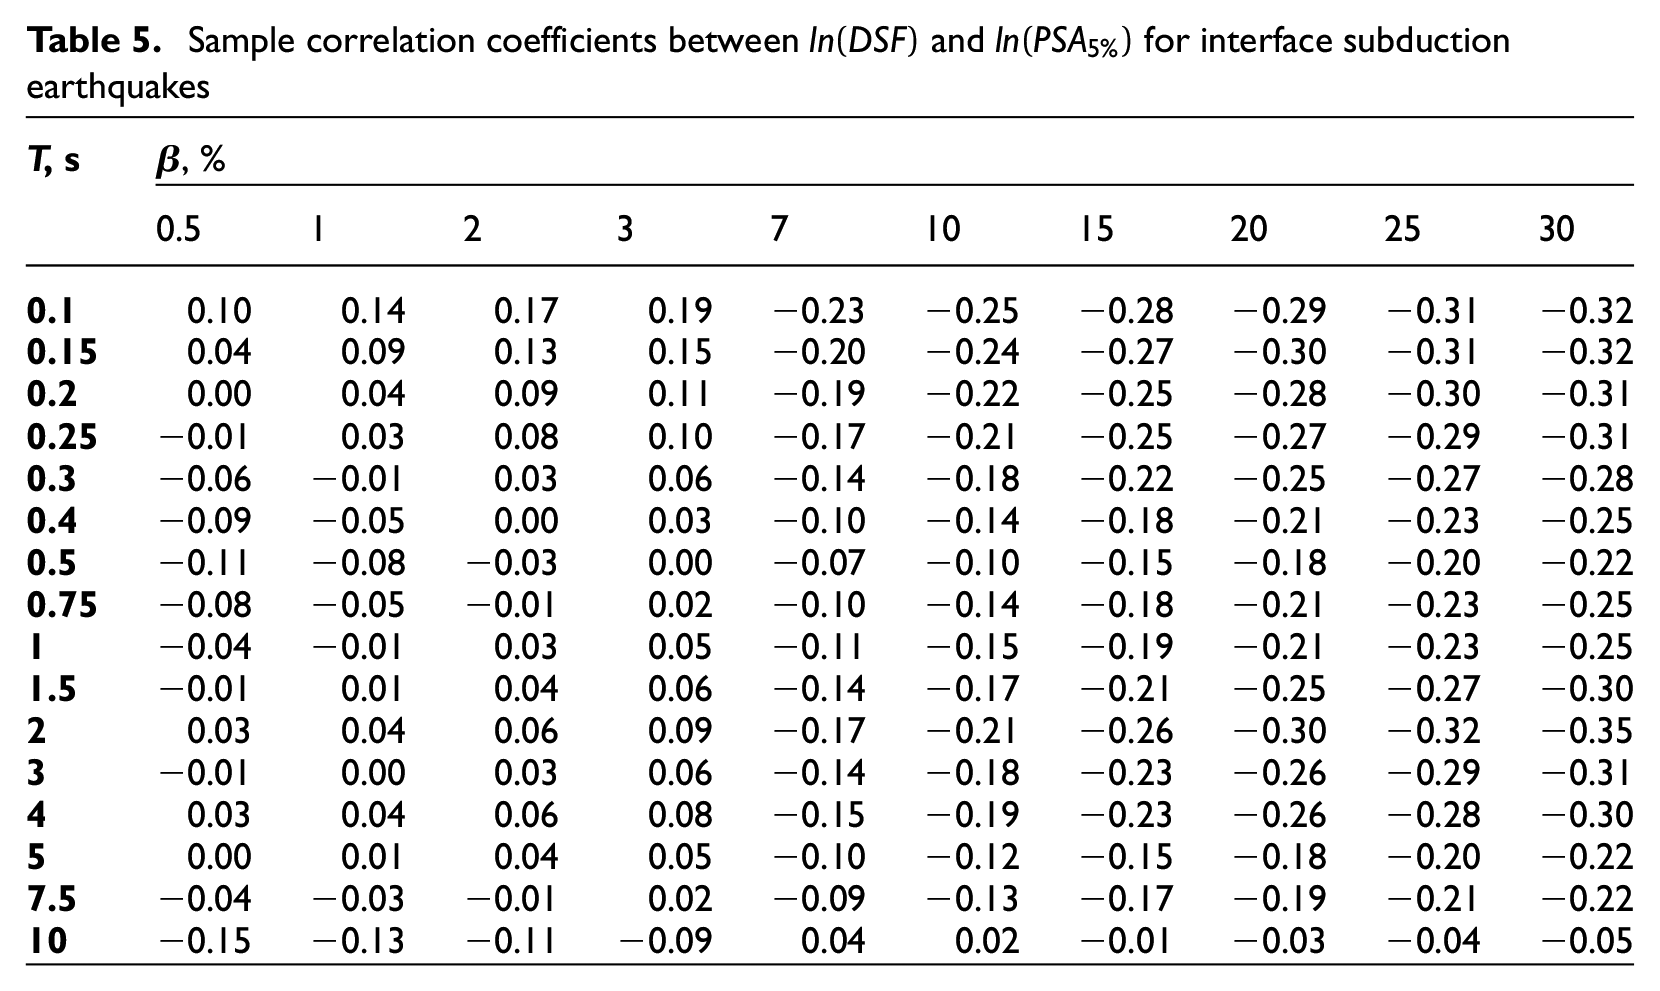
Sample correlation coefficients between
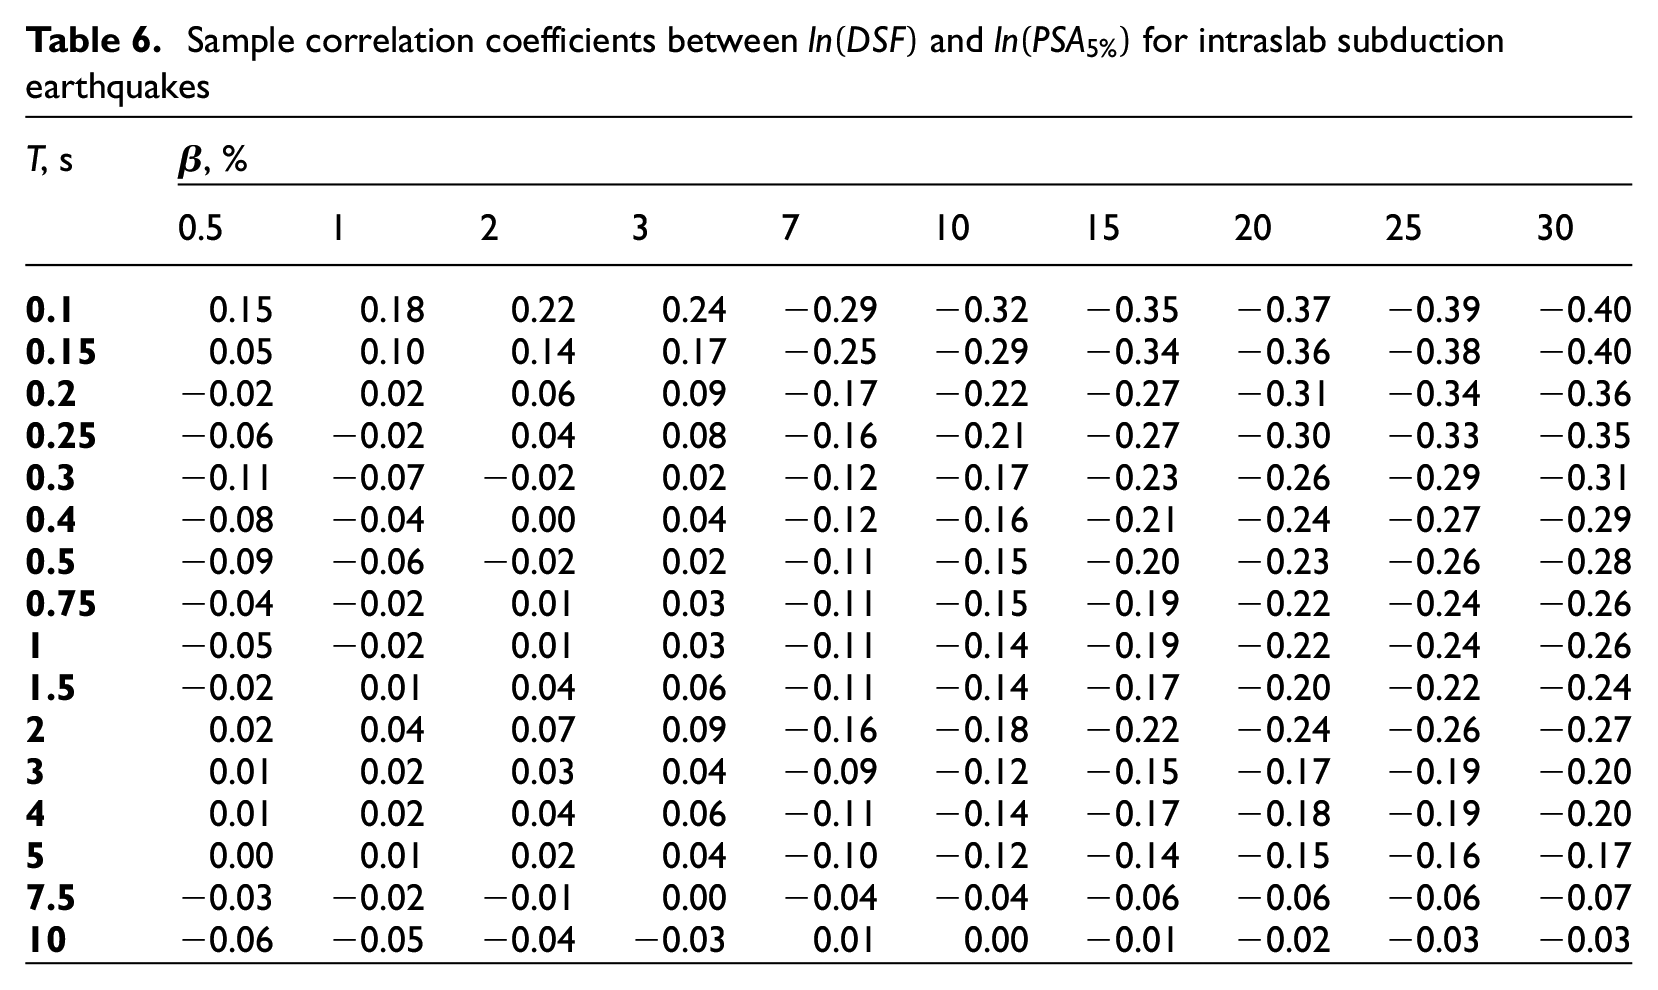
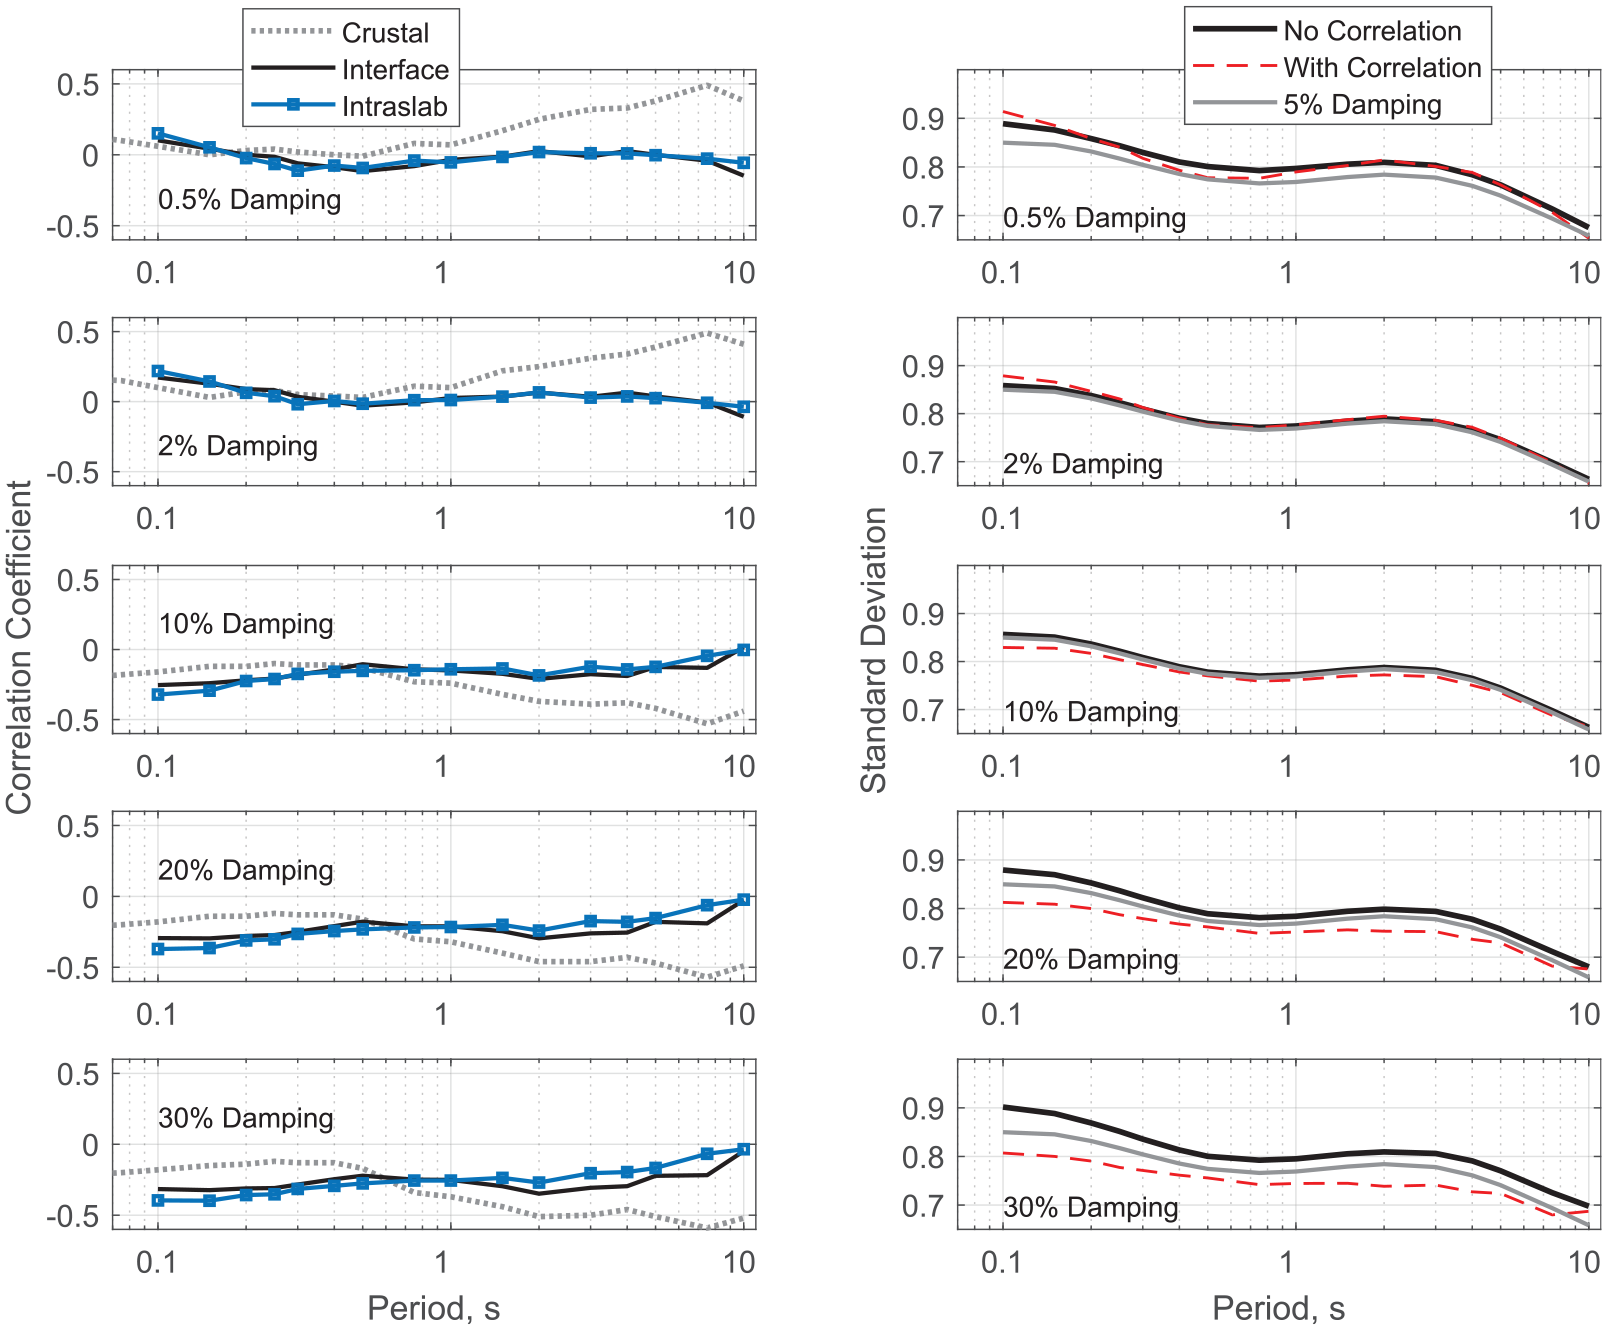
Correlation coefficients between
To demonstrate the application of the standard deviation model, Equation 6 is evaluated using
Conclusion and future direction
This article develops and presents magnitude and distance-dependent parametric models of the DSF for subduction interface and intraslab earthquakes for the horizontal (RotD50, the most commonly used direction-independent measure in recent years) component of ground motion. The functional forms for the median DSF and its logarithmic standard deviation are the same as those of the NGA-West2 DSF model for crustal earthquakes, but the period-dependent coefficients are derived using the newly developed NGA-Sub database for subduction earthquakes from seven regions (Alaska, Cascadia, Central America and Mexico, South America, Japan, Taiwan, and New Zealand). Magnitude-dependent long-period adjustments are proposed based on simulations for periods longer than 5 s to ensure that the DSF converges to 1 at very long periods. The proposed DSF models can be used to scale subduction-specific GMMs (including NGA-Sub GMMs) from a 5% damping ratio to other damping ratios from 0.5% to 30%. They are applicable to magnitudes between 4.5 and 9, and to distances up to 1000 km. The models are recommended for periods greater than 0.1 s. They are recommended for all subduction regions except for Taiwan interface earthquakes at periods shorter than 0.5 s, due to local characteristics that cause different spectral shapes and introduce additional bias in the DSF model. Future revisions of the model should consider additional predictor variables that better describe the high-frequency content of the motion and site effects such as basin amplifications in order to improve the model for periods less than 0.1 s and for regions with deep basins. The proposed DSF models are developed to scale the medians and standard deviations of 5%-damped GMMs as demonstrated in our example applications to NGA-Subduction GMMs. The scaled GMMs will then be used directly in applications such as PSHA. To scale 5%-damped ground motions resulting from PSHA, the input magnitude and distance to the proposed DSF model can be determined from disaggregation of hazard at the site of interest.
Footnotes
Appendix 1
Acknowledgements
The constructive interactions with the NGA-Sub researchers through numerous meetings are gratefully acknowledged. The opinions, findings, conclusions, or recommendations expressed in this publication are those of the authors, supported by the USGS, and do not necessarily reflect the views of the study sponsors. Any use of trade, firm, or product names is for descriptive purposes only and does not imply endorsement by the US government. We greatly appreciate the feedback received from the reviewers of this article and thank Dr. Najib Bouaanani for providing the codes to the Daneshvar et al. (2016, 2017) models.
Declaration of conflicting interests
The author(s) declared no potential conflicts of interest with respect to the research, authorship, and/or publication of this article.
Funding
The author(s) disclosed receipt of the following financial support for the research, authorship, and/or publication of this article: This research was partially supported by the U.S. Geological Survey (USGS). Core support for the NGA-Subduction research project was provided by FM Global, USGS, the California Department of Transportation, and the Pacific Gas & Electric Company.