
Abstract
This article presents the seismic assessment and retrofit design of an existing old building in Greece of great regional importance. The Building is the “Administration building of Kalamata” located in the city of Kalamata, capital of the Messinia Prefecture. The Building, the largest in the city, is a seven-floor reinforced concrete (r/c) structure with a basement built in 1974. The seismic assessment procedure is based on the provisions of the EN 1998-3 code and the Greek code for structural interventions “KAN.EPE.,” introducing several novelties that give solutions to difficult practical problems with respect to the modeling, the analysis methods, and performance evaluation framework. The article presents details of the Building’s modeling, description of the analyses, and the corresponding results, as well as the most efficient retrofitting schemes that fulfill the safety demands (i.e. performance level B or “Life safety” and performance level C or “Collapse prevention” according to KAN.EPE.), considering cost and minimal disturbance both for the superstructure and foundation interventions. While considering the various intervention solutions, it proceeds with new simplified ways that optimize the proposed solution. As such, it can be used as a paradigm for finding clever, practical, and at the same time economical solutions. An interesting characteristic of the Building is that it has been strengthened already after the damaging earthquake of 1986, but the new usage requirements raised questions about the adequacy of that earlier strengthening. Last, but not least, it must be mentioned that this building is unique in the sense that the main earthquake record (a strong motion accelerogram) obtained during the damaging 1986 Kalamata earthquake was at its basement. This record is also used for the assessment.
Keywords
Introduction
A major objective of the modern earthquake engineering is the development of reliable seismic analysis, assessment, and retrofitting methodologies for existing older reinforced concrete (r/c) structures. A large number of r/c structures have been designed and constructed in earthquake-prone regions following (or in many cases not following) recommendations of design codes developed in periods at which the experience in structural failures was limited while the available tools in earthquake disaster prevention were less advanced. Considering the fact that density of human activities increases along with the age of infrastructure and structures, earthquakes can exact a heavy toll to the country as a whole.
To mitigate the seismic risk, efforts are observed in a global scale toward the establishment of modern design guidelines and recommendations for the seismic upgrade of structures. These efforts are led by professional and governmental associations and agencies specialized in earthquake disaster prevention and recovery (ASCE/SEI 41-17, 2017; ATC, 1997a, 1997b, 2000; CEN EN 1998-3, 2005; KAN.EPE., 2013). The latest seismic assessment methodologies (ASCE/SEI 41-17, 2017; CEN EN 1998-3, 2005; KAN.EPE., 2013) require structures to satisfy multiple performance objectives, that is, levels of damage sustained under corresponding levels of seismic hazard, following the concept of the performance-based seismic design (PBSD) (ATC, 2006; Fardis et al., 2015; SEAOC, 1995). The updated European codes incorporate precisely the extensive analytical and experimental research conducted recently (Fardis, 2009), as well as the experience gained from the past large earthquakes (Bolt, 2003; Lee et al., 2003) on damage assessment and failures expected. Modern, rational, and simple assessment methodologies take the advantage of the increased computational power, while low-disturbance retrofitting methods enable engineers to bring the old structures up to current safety standards effectively and quickly (Chisari and Bedon, 2017; Lampropoulos et al., 2016; Marzano et al., 2020; Seyhan et al., 2015).
The region of southern Europe (Greece, Italy, and Turkey) is one of the most active seismic regions worldwide due to the presence of active faults there. Focusing on the area of Greece, devastating earthquakes have repeatedly taken place causing a large number of human casualties and great economic losses (Elenas, 2003; GEEREERI/ATC Cephalonia Report, 2014; Papazachos and Papazachou, 1997). Over the last 25 years, the Greek seismic design codes were mainly updated three times (EAK/2000, 1999; NEAK, 1993) with the latest upgrade being the adoption of CEN EN 1998-1 (2005). In parallel, a new Greek code for structural interventions, known with the acronym of KAN.EPE. (2013), was introduced in the view of the necessity to enhance the safety of existing r/c buildings that dominate the share of construction type in the country. The code KAN.EPE. (2013) provides guidelines related to seismic assessment and retrofitting of existing r/c buildings and applies together with the corresponding provisions of EN 1998-3 (CEN EN 1998-3, 2005; KAN.EPE, 2013; Peponi et al., 2017). The first edition of KAN.EPE. (2013) was introduced in 2012, while thereafter is constantly updated. The syntax and implementation of KAN.EPE. (2013) coincided with the increasing efforts of Greek authorities over the last decades to embark research programs for evaluating the seismic performance of high-importance public buildings, such as schools, hospitals, and administration buildings. Prompted by this, the Prefecture of Messinia (Greece) assigned to the University of Patras and to the Earthquake Planning and Protection Organization - Institute of Engineering Seismology and Earthquake Engineering (EPPO-ITSAK) the evaluation of the seismic capacity and the investigation of retrofitting scenarios for the “Administration building of Kalamata,” subsequently referred to as the Building. The basic goal was to identify a cost-effective retrofitting scheme (RS) that will allow continued usage of the Building with a minimum of interruption. This requirement makes the investigation of the intervention strategies more complicated, requiring innovative solutions not described in the standard code proposed methods.
The Building under consideration is a seven-floor r/c structure with basement, housing most of the public services of the Messinia prefecture. It was designed in 1971 with the seismic code of 1959, the concrete code of 1954, and was built in 1974. In its initial design of 1971, the Building had no r/c shear walls, no transverse beams and thus it was extremely flexible in its transverse direction. During the Kalamata earthquake of 1986 which had local magnitude, ML nearly at 6.2 (Anagnostopoulos et al., 1987), the Building suffered slight damage, which prompted the authorities to strengthen it. This damage was in the form of diagonal cracks on most of the brick infill walls as well as on the r/c façade decoration. The retrofitting was carried out by the Rehabilitation Agency of Public Works (YAΣBE) in Thessaloniki, which used four strong r/c shear walls to strengthen and stiffen each of the two parts of the building. While this intervention upgraded the Building significantly, new seismic analyses indicated that the Building could not meet the requirements of current Greek codes. It is certainly a very special building that includes short columns, hanging walls, inadequate foundation, two segments separated by a seismic joint (or expansion joint), and for this reason its retrofit is of great interest as it goes beyond the standard methods provided in the applicable codes.
This article describes the new seismic assessment of this building under the framework of PBSD and the pertinent numerical work that led to the proposed intervention scheme. A new capacity design was carried out in two phases. During the first phase, the existing data (e.g. drawings) were collected and in situ tests were conducted to investigate the state of reinforcement, the strength of concrete, and the dynamic characteristics of the building. In addition, an assessment of soil properties was made—based on existing in situ investigations—to include the foundation and soil in the numerical models. This phase was followed by elastic analysis to compare the numerical model with the measured dynamic characteristics of the Building. Subsequently (in the second phase), nonlinear models, including interaction with the soil (soil–structure interaction effects), were produced to simulate the inelastic behavior of the Building under the action of design-level earthquakes. Difficulties were encountered and practical solutions were proposed for the reliable modeling and prediction of soil–structure interaction effects due to the complex foundation and perimeter walls. Static and dynamic nonlinear analyses were performed, following the provisions of the CEN EN 1998-1 2005, CEN EN 1998-3 (2005) and KAN.EPE. (2013) codes, to evaluate story drifts, roof displacements, and deformations, and to identify those structural r/c elements and areas most highly penalized by earthquakes. The full set of analytical methods was adopted here not only to investigate a great number of possible solutions, but also to envelop the response due to uncertainties in the nonlinear modeling of major elements such as the strong shear walls and the complex foundations. Following the principles of PBSD and by accepting damage in a few secondary seismic members, a few alternative RSs were examined, and one of them was proposed to bring the building up to current safety standards, while meeting the set additional goals (minimal cost and minimal disturbance). Thus, this article may be considered as a model example of searching for the optimum RS.
Description of building and modeling features
Building geometry, materials, and soil conditions
The Building is a seven-floor r/c structure with a basement. The longitudinal dimension Lx has length 75.6 m, while the transverse dimension Ly has length 13.9 m. The Building consists of two nearly identical and statically independent structural parts separated by a thermal expansion joint in the transverse direction. In Figure 1a, a general view of the Building is presented and in Figure 1b the structural system of a typical floor plan of each part is shown. The Building has a rectangular shape with aspect ratio of each part equal to 2.7. The basement roof is partially above the ground level (about 80 cm) and its height is equal to 2.90 m. The total height of the Building is 25.2 m.
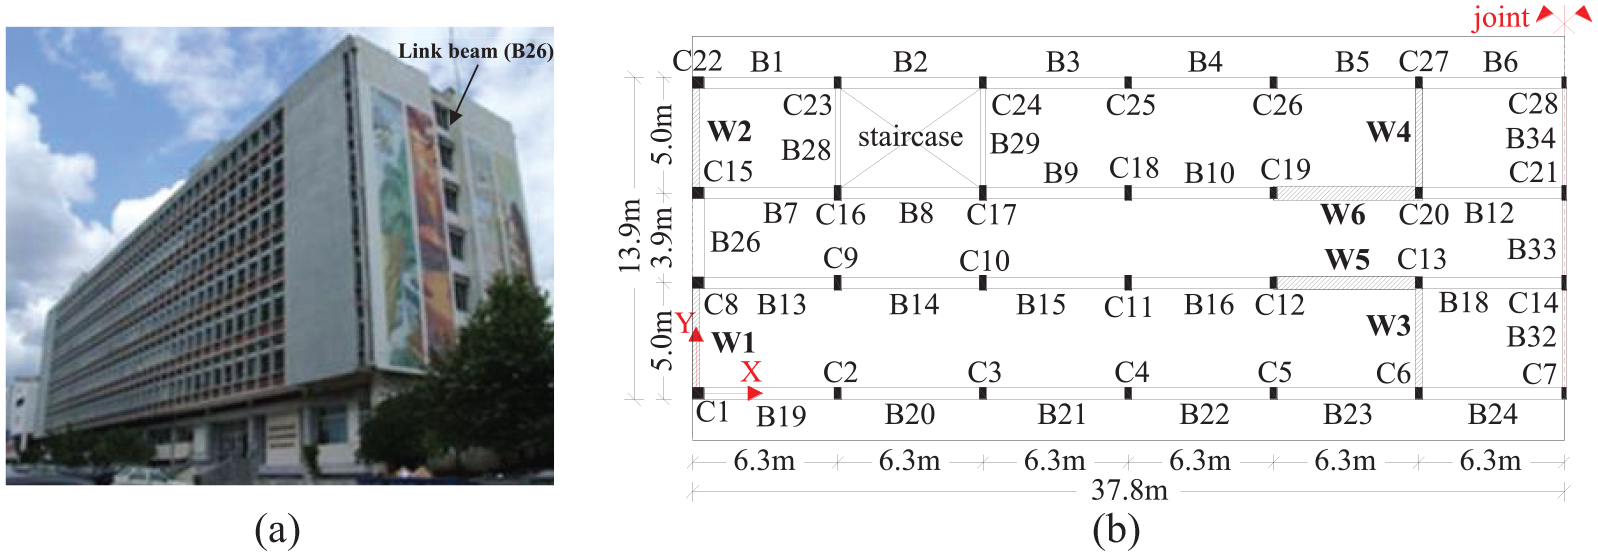
(a) The “Administration building of Kalamata” and (b) a typical story plan.
The structural system shown in Figure 1b consists of four plane frames along the x-axis, two L-shaped strong r/c walls (W3-5 and W4-6), and two I-shaped r/c walls (W1 and W2). As mentioned in the introduction, these strong r/c shear walls were constructed after the Kalamata earthquake of 1986 to strengthen and stiffen each of the two parts of the building. For their construction, the existing older columns C1, C8 and C15, C22 were used as hidden columns at the ends of the shear walls W1 and W2, respectively, while the columns C6, C12, C13 and C19, C20, C27 were used as hidden columns at the ends and corner of the shear walls W3-5 and W4-6, respectively. The cross-section dimensions of the r/c columns, beams (width/height), and walls are given in Table 1, while the floor slabs are 14 cm thick. Reinforcement details can be found in the study by Anagnostopoulos et al. (2015). It should be also noted, that the r/c shear walls W1 and W2 along the transverse direction of the Building start from the second floor and are linked with an intermediate beam, the B26, as shown in Figure 1a and b. At the level of the basement and first floor, W1 and W2 stand on a r/c wall of 85 cm thickness and 13.9 m length (entire transverse direction). At the level of basement, there is also one continuing r/c wall of thickness equal to 35 cm and height 4.8 m that runs along the long direction of the Building. The foundation consists of rectangular footings interconnected through foundation tie beams, whereas the walls W1, W2, W3-5, W4-6 are founded on strong strip footings. A full view of the foundation and elevation can be found in Figure 14 of Appendix 1.
Dimensions of the cross-sections of columns, beams, and shear walls at each level
Width/height of the beam.
Wall thickness.
Regarding the grade of concrete and steel, the in situ tests verified strengths of 25.83 MPa and 546 MPa for concrete and steel, respectively. Additional in situ measurements and geotechnical studies were conducted in the past to investigate the properties of the soil layers above and around the foundation of the building. This information was used to simulate the soil–interaction effects in the numerical models, which are presented in a following section. The three identified soil layers of the region at which the Building is founded along with their properties are shown in Table 12 of Appendix 2.
Modeling of r/c shear walls and general modeling assumptions
Based on the available drawings of the Building and the in situ tests, a detailed model was created using the software SAP2000 (2013). Beam-column elements were used for the simulation of beams and columns, while two different modeling techniques were adopted for the r/c shear walls depending on the type of analysis (linear elastic or nonlinear). For the elastic analyses, the r/c shear walls were modeled using the equivalent frame model (Lew and Narov, 1987; Xenidis et al., 2000). The equivalent frame model is compatible with the most widely used procedures in design and assessment of r/c members and leads to the calculation of the cross-section stress resultants (i.e. bending moments, shear forces, and axial forces).
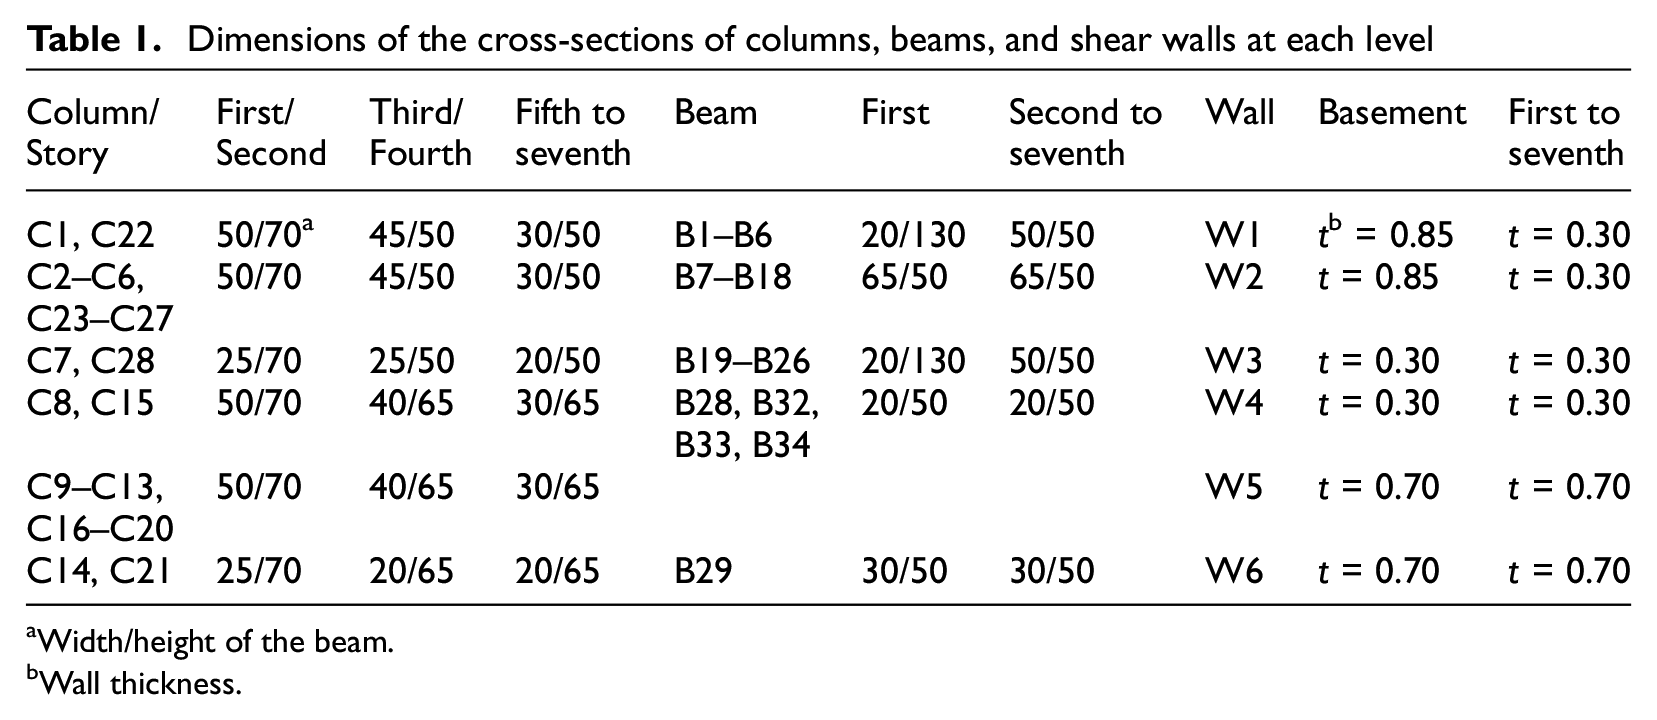
More specifically, a shear wall is separated in multiple independent parts, such as columns and webs, which are modeled using typical beam–column elements. All the wall vertical elements are connected with rigid links in bending/shear and with finite torsional stiffness at the floor levels to reproduce the behavior of the entire shear wall element. As a result, the L-shaped shear wall W3-5 was modeled using five elements (C12, W5, C13, W3, C6), while the I-shaped shear wall W1 using three elements (C8, W1, C1), as shown in Figure 2. The calculation of the bending strength capacities of the entire cross-sections of shear walls were calculated based on the available reinforcement data with the aid of the commercial software XTRACT (2006). By the utilization of the stresses along the cross-sections and the corresponding strengths, the capacity ratios of all shear walls under bending and axial force in their critical regions were calculated. These ratios are presented in a later section.
Modeling of r/c shear walls with the equivalent frame model for the linear analyses.
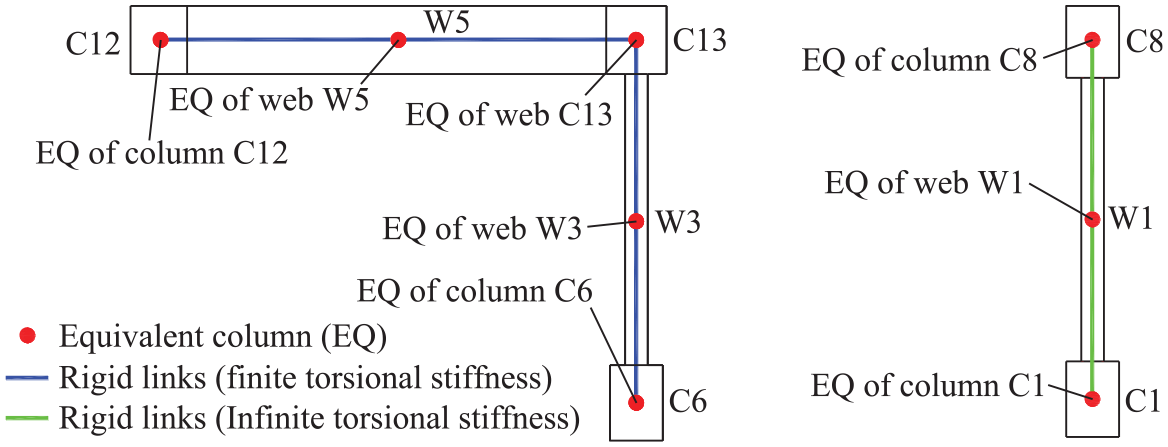
For the nonlinear analyses, one equivalent element was used at the shear center of the entire cross-section of shear walls. This model is more suitable for inelastic analysis that includes plastic hinge models. Modeling of shear walls can be simplified because the moment–rotation relationship and the calculation of the corresponding bending moments at every state of yielding are associated with the entire element at every step of the nonlinear analyses (static or dynamic). In both types of analysis, the r/c perimeter wall of the basement was modeled using two-dimensional (2D) shell elements. Figure 3 depicts a three-dimensional (3D) model representation of the Building where the perimeter wall can be seen. Additional modeling assumptions are as follows: (a) the floor slabs are assumed to act as perfectly rigid diaphragms in their plane; (b) the beam–column and beam–wall joints are modeled as perfectly rigid; (c) the effective rigidities of members were calculated for linear analyses on the basis of Table S.4.1 of KAN.EPE. (2013), and for nonlinear analyses using the provisions of §7.2.3 of KAN.EPE. (2013); (d) the infill walls were taken into consideration in linear and nonlinear analyses and were modeled using equivalent diagonal struts as described in Paragraph 7.4.1 of KAN.EPE. (2013); and (e) the staircase of the Building was included in the model.
Three-dimensional (3D) model representation of the Building: (a) overall 3D model of the building and (b) details of the model of the foundation system.
Modeling of soil–structure interaction effect
This study considers soil–structure interaction as an important effect for the dynamic analysis, using two different approximations and selecting what may be the most accurate. Based on the existing geotechnical information collected during the program (Table 12 of Appendix 2) and by using analytical and semi-empirical methods, the “coefficient of sub-grade reaction” was first estimated. Then, linear elastic springs (one vertical translational and two rotational) were assigned in the footings (they modeled as rigid bodies) to connect the foundation system to the soil. The corresponding constants of these springs were calculated on the basis of the estimated values of sub-grade reaction K (units: kN/m3). The methodology proposed by Terzaghi (1955) was adopted for the estimation of K by using the corresponding tables and the correction factors based on the dimensions and the shape of footings. In addition, the elastic support of the tie beams and the strip footings (Figure 14 of Appendix 1) were modeled using closely spaced, discrete, vertical linear elastic springs (Terzaghi, 1955). The horizontal interaction of the longitudinal r/c perimeter wall at the basement with the surrounding soil was simulated through horizontal linear springs placed at the nodes of each shell element.
In addition to the modeling described above, a second technique was examined that accounts more accurately for the seismic response of the soil–foundation system. A model based on the equations of dynamic equilibrium of a rigid foundation system resting on elastic half-space was utilized. Under this assumption, the footings were connected to the soil through six springs (three translational and three rotational) and six corresponding dashpots. The constants of these springs and dashpots were calculated using the expressions proposed by Mulliken and Karabalis (1998). Tie beams were considered as elements not interacting with the soil, whereas the strip footings were discretized in effective zones of orthogonal shape. Based on analysis results, the later modeling technique was adopted in this study as a good approximation of the dynamic response of the soil–foundation system. Modeling details of soil–foundation system can be seen in Figure 3. More information about the constant values of springs and dashpots can be found elsewhere (Anagnostopoulos et al., 2015).
Dynamic characteristics of the Building
Table 2 summarizes the three first natural periods of the Building as obtained from the in situ measurements of the dynamic characteristics. Table 2 also compares these values with the results of the various modeling approaches considered in this study with respect to the effective stiffness of the primary members (cracked cross-sections) and the two soil–structure interaction modeling methods described above. For the in situ measurements of the dynamic characteristics, a wireless network of 12 sensors (accelerometers) was developed in all floors of the Building for modal identification purposes. The excitations used here were environmental noises.
The three first natural periods of the Building
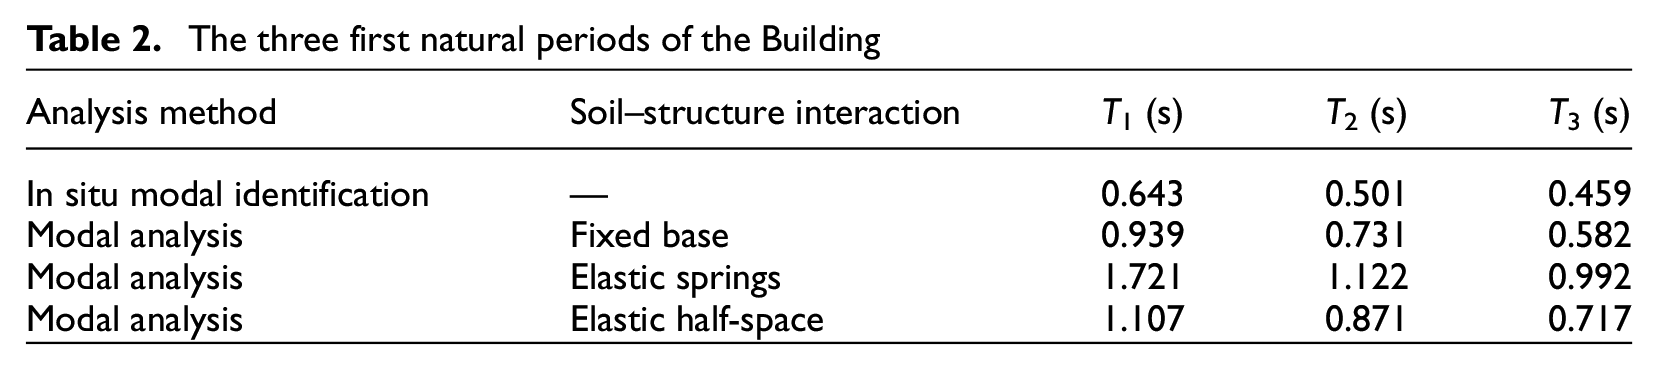
Effective stiffness of the primary members used in the modal analysis of the Building, were considered based on EAK/2000 (1999) which recommends 0.8EI for the internal columns, 0.6EI for the perimeter columns and for the shear walls, and 0.4EI for the beams. On the basis of Table 2, the difference between the in situ measured periods with those obtained from the code-compliant modal analysis, is likely to be related to the fact that in situ measurements were taken within a very small range of the elastic response of the Building. Therefore, these measurements correspond to larger stiffness than those used in the modal analysis (CEN EN 1998-1, 2005; EAK/2000, 1999). Among the modeling approaches of the soil–structure interaction effect, the model based on the equations of dynamic equilibrium of a rigid foundation system resting on elastic half-space (T1=1.107s) can be considered more accurate as it provides closer results to the in situ measured natural periods.
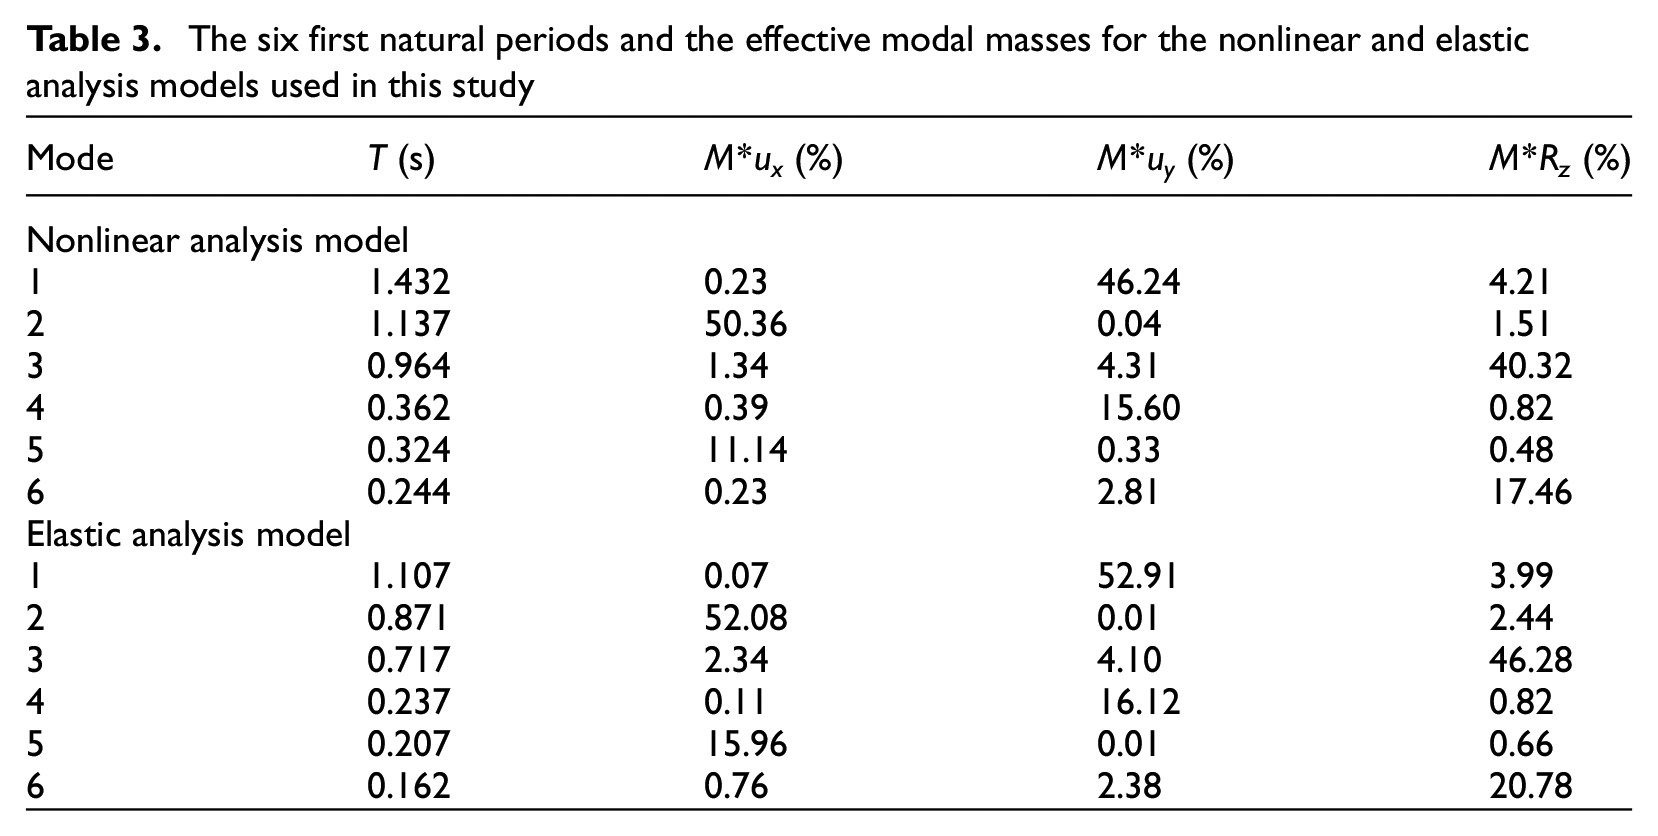
This model was adopted as a good simulation model in the framework of the elastic analyses for the seismic assessment and retrofit design of the Building. Moreover, in addition to the elastic analyses, this study performs static and dynamic nonlinear analyses in the framework of KAN.EPE. (2013), CEN EN 1998-3 (2005), and CEN EN 1998-1 (2005). According to CEN EN 1998-3 (2005) and §7.2.3 in KAN.EPE. (2013), the effective stiffness of each primary member is calculated separately when assessment is carried out in terms of large deformations. The K values were found to be in the range of 0.04EI to 0.20EI for the slab-beams, and in the range of 0.08EI to 0.38EI for the columns and shear walls. Table 3 summarizes the first six natural periods of the Building along with the effective modal masses (i.e. percentage of the total mass of the Building) for the nonlinear analysis model (K values according to CEN EN 1998-3 (2005) and KAN.EPE. (2013)) and elastic analysis model (K values according to EAK/2000 (1999)), respectively. The first natural period is translational along the y-direction of the Building (transverse direction), the second natural period is translational along the x-direction of the Building (longitudinal direction), while the third natural period is torsional about the z-axis of the Building (vertical direction).
The six first natural periods and the effective modal masses for the nonlinear and elastic analysis models used in this study
Performance-based seismic metrics in modeling
To simulate the nonlinear behavior of the r/c members, the model of lumped plasticity was utilized. More specifically, the skeleton diagram described in Appendix 4.4 of KAN.EPE. (2013) as shown in Figure 4 was used. The bending moment M was considered as measure of the resistance of a member at yielding and ultimate state. Yielding and failure deformations were expressed through the chord rotation θ (it takes into account the flexural and the shear deformations as well as the slip of reinforcing bars within the shear length Ls) at the end of r/c members (Biskinis and Fardis, 2009; KAN.EPE., 2013). Three performance levels were considered according to KAN.EPE. to limit the values of the chord rotation θ as shown in Figure 4: (a) the performance level A or “Immediate occupancy” (IO); (b) the performance level B or “Life safety” (LS); (c) and performance level C or “Collapse prevention” (CP). The above parameters for the various structural members and the corresponding interaction diagrams were determined using the BIAX software (Sfakianakis, 2002). The idealized flexural behavior shown in Figure 4 requires that the shear capacity of members has not been exceeded, and for this reason, the members were checked against shear failure using both the procedure of Appendix 7 C of KAN.EPE. (2013), and Annex A of the CEN EN 1998-3 (2005). In Figure 4, the chord rotation under flexural yielding is denoted by θy, the chord rotation under flexural failure by θu, while the limit values for the chord rotation under the IO, LS, and CP performance level are denoted as θIO, θLS, and θCP, respectively. It is noted that the partial safety factor γRd takes into account the increased (compared to the design of new buildings) uncertainties of the models, through which the effects of actions and all types of resistances are assessed respectively.
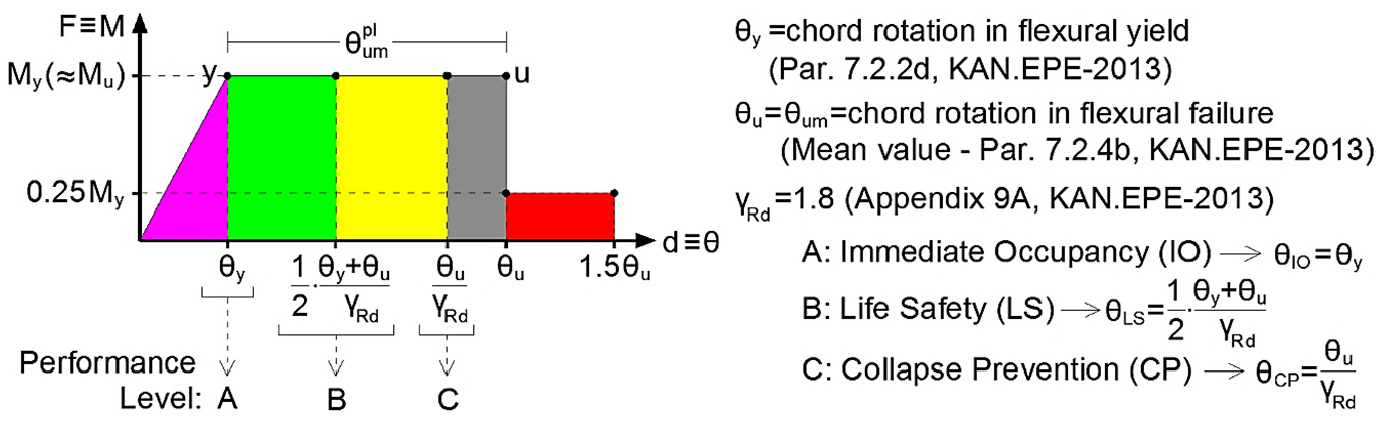
Idealized skeleton diagram of nonlinear r/c member behavior according to KAN.EPE. (2013)
Analyses for seismic assessment of the Building
The rationality of the performed analyses for the evaluation of seismic response of the Building was based on the characteristics and modeling limitations of linear and nonlinear methods. More specifically, the nonlinear time-history analyses are time-consuming not only as regards the execution time of an analysis, but also as regards the time required for the preparation of the corresponding model (i.e. calculation of M-θ and M-N diagrams for all structural members). More important than this is the lack of appropriate nonlinear prismatic models capable of “capturing” the behavior of wall type L-shaped elements. On the contrary, linear analyses are significantly less-time consuming, while at the same time tools are available to model L-shaped walls for elastic response predictions with acceptable accuracy. Such results, however, can only be considered as a first approximation to the overall inelastic behavior of the Building. As mentioned in a previous section, modeling of these strong r/c wall elements needs special treatment for each of the two types of analyses (linear and nonlinear). Thus, the performed analyses carried out are as follows:
Static nonlinear (pushover) analyses: The results of these analyses were used to determine the overall building behavior and progressive collapse. The elements expected to be damaged and the degree of damage during design-level earthquakes was assessed. Moreover, these analyses were used to assess the best strengthening solution. The nonlinear analyses model was used.
Nonlinear time-history analyses (NTHA): A more accurate assessment was performed for the damage expected in critical elements using historical earthquake records of the Messinia region and artificial records compatible to design-level earthquake. The nonlinear analysis model was used.
Elastic response spectrum analyses (ERSA): This type of analysis enables utilization of simpler, yet accurate modeling of the r/c walls with respect to strength and stiffness, thus allowing an extensive parametric study to explore efficient RSs. The elastic analysis model was used.
Description and results of the static and dynamic nonlinear analyses
Static nonlinear (pushover) analyses
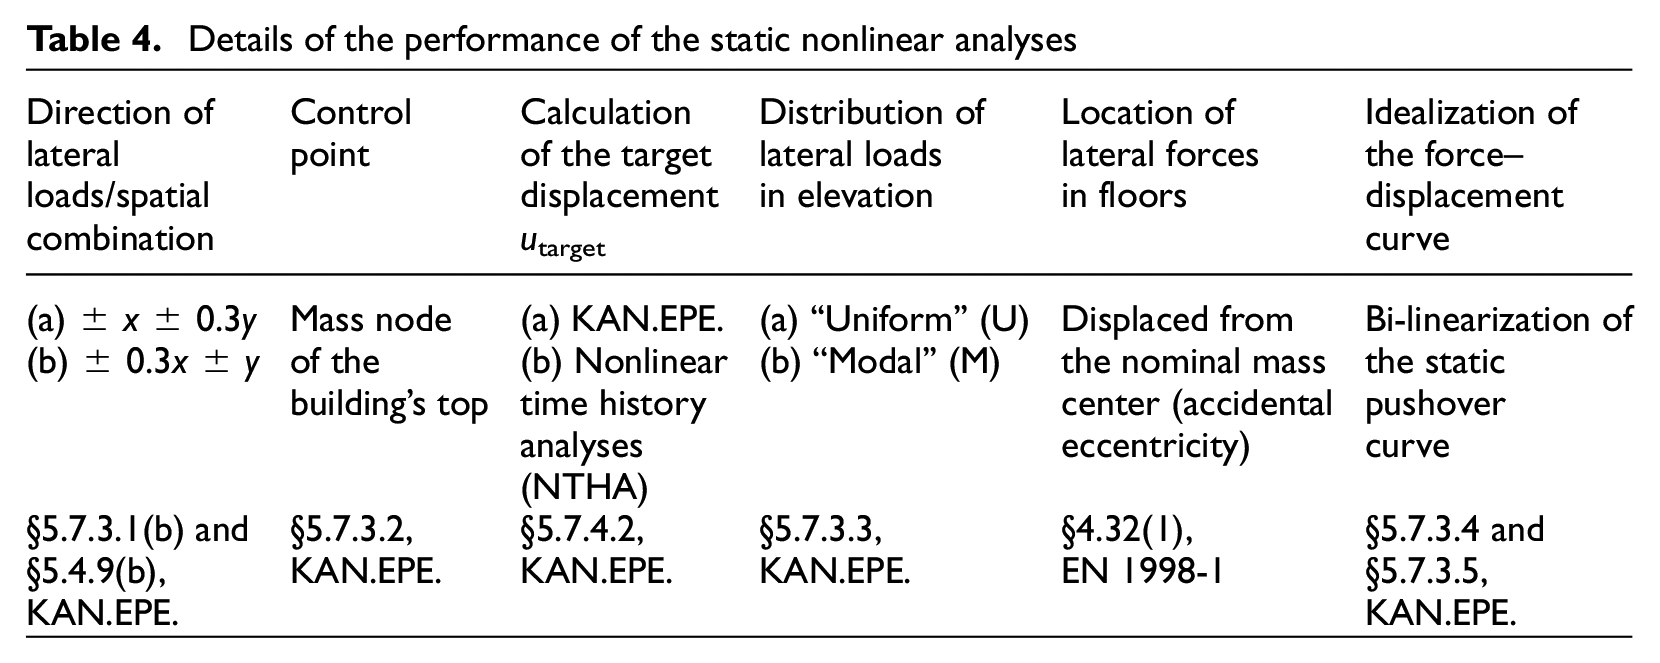
The static nonlinear analyses (pushover analyses) were performed according to the provisions of KAN.EPE. (2013) (§5.7), CEN EN 1998-1 (2005) (§4.3.3.4.2), and CEN EN 1998-3 (2005) (§4.4.4). In total, 32 static nonlinear analyses were performed as detailed in Table 4 by subjecting the Building model to several spatial combinations of seismic loads. It is noted that the Building was loaded first by the vertical load combination G+0.6Q (§4.4.2 KAN.EPE. (2013) where G is the gravity load and Q the live load), while consequently the lateral seismic forces were incrementally applied.
Details of the performance of the static nonlinear analyses
The evaluation of the seismic behavior of the building was based on the corresponding bi-linearized static pushover curves. These curves were initially utilized for the estimation of the target displacement utarget. Then, the chord rotation θ values at the ends of all r/c elements were calculated and compared with the limit values of θ defined for the three performance levels in Figure 4. Figure 5 depicts the most critical pushover curves of the Building along with notation for events as they occur in pushover analysis. The curves are normalized by the total weight of the Building (i.e. 66,864 kN) to obtain the base shear coefficient and by the total height of the Building (i.e. 25.2 m) to obtain the roof drift. Figure 5a refers to the load combination E x + 0.3E y with negative accidental eccentricity at axis y of the Building (modal distribution), Figure 5b refers to the load combination − E x − 0.3E y with negative accidental eccentricity at axis y of the Building (uniform distribution), Figure 5c refers to the load combination − E x + 0.3E y with positive accidental eccentricity at axis x of the Building (uniform distribution), and Figure 5d refers to the load combination − E x − 0.3E y with positive accidental eccentricity at axis x of the Building (uniform distribution). In Figure 5, the base shear coefficient as calculated using the design spectral acceleration (EAK/2000, 1999) for the elastic and nonlinear Building model (i.e. T1 = 1.11 and 1.43 s, respectively) is illustrated with horizontal dash line (i.e. 0.44 and 0.34, respectively). Moreover, the displacement profile along the Building height is illustrated at the level of the target displacement. The results of the 32 pushover analyses are summarized in Tables 13 and 14 in Appendix 2.
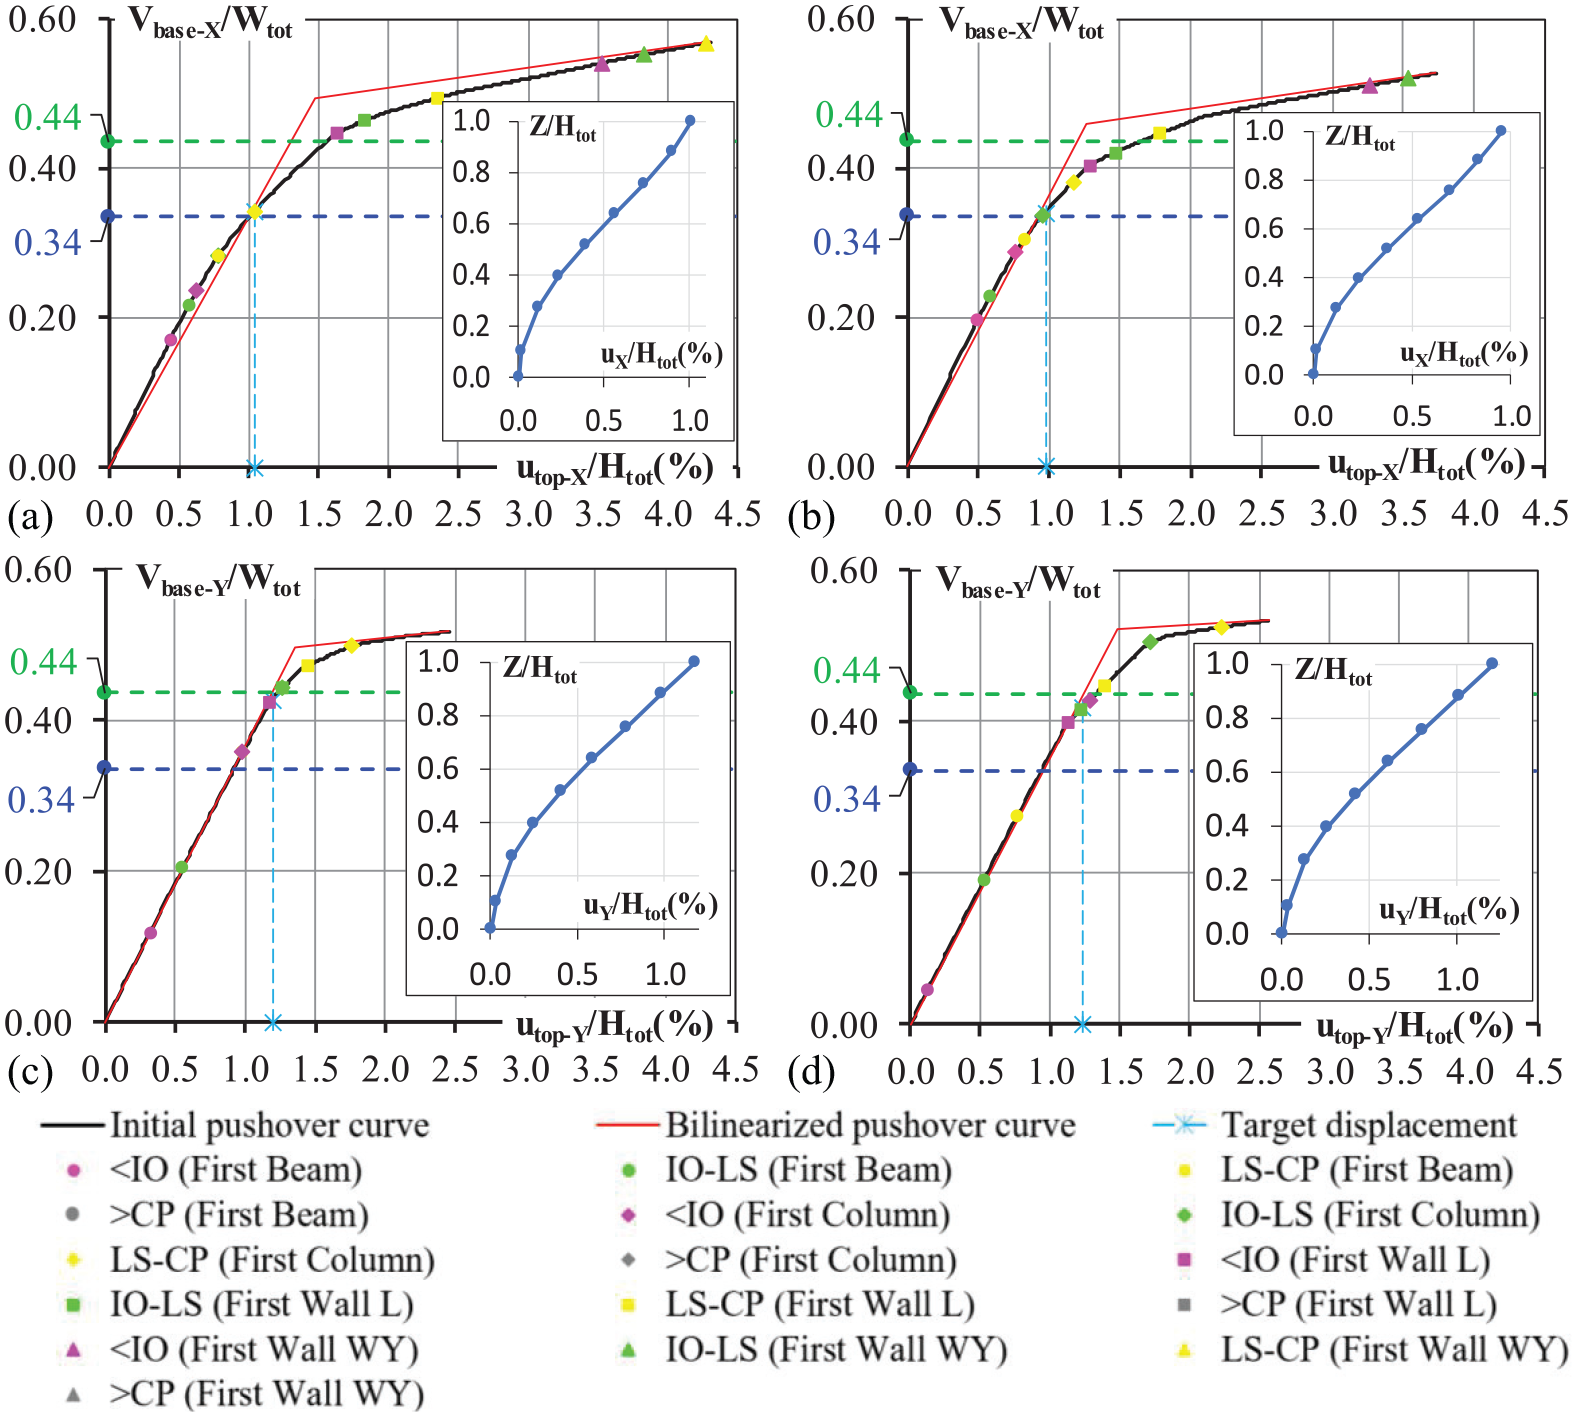
Critical normalized pushover curves of the Building along with notation for events for the load combinations (a) E x + 0.3E y , (b) − E x − 0.3E y , (c) − E y + 0.3E x , and (d) − E y − 0.3E x , where x and y are the directions of the Building.
The target displacement, utarget, was determined according to KAN.EPE. (2013). It is noted that in this study, KAN.EPE. (2013) suggests larger values for utarget compared to those that resulted from the NTHA. The main findings from the pushover analyses are as follows:
The shear walls fulfill the criterion of performance level A(IO) in almost all cases indicating that they respond elastically. Only exception is an L-shaped shear wall, which exceeds the criterion of performance level A(IO) and the criterion of performance level B(LS) in 2 of the 32 pushover analyses.
The number of beams that does not fulfill the criterion of performance level A(IO) is much larger than the corresponding number of columns. A relatively large number of beams does not fulfill the criterion of performance level B(LS) and C(CP), too.
The exceedance of the performance level B(LS) criterion in columns is insignificant (at most 2), as well as there is no column that exceeds the performance level C(CP).
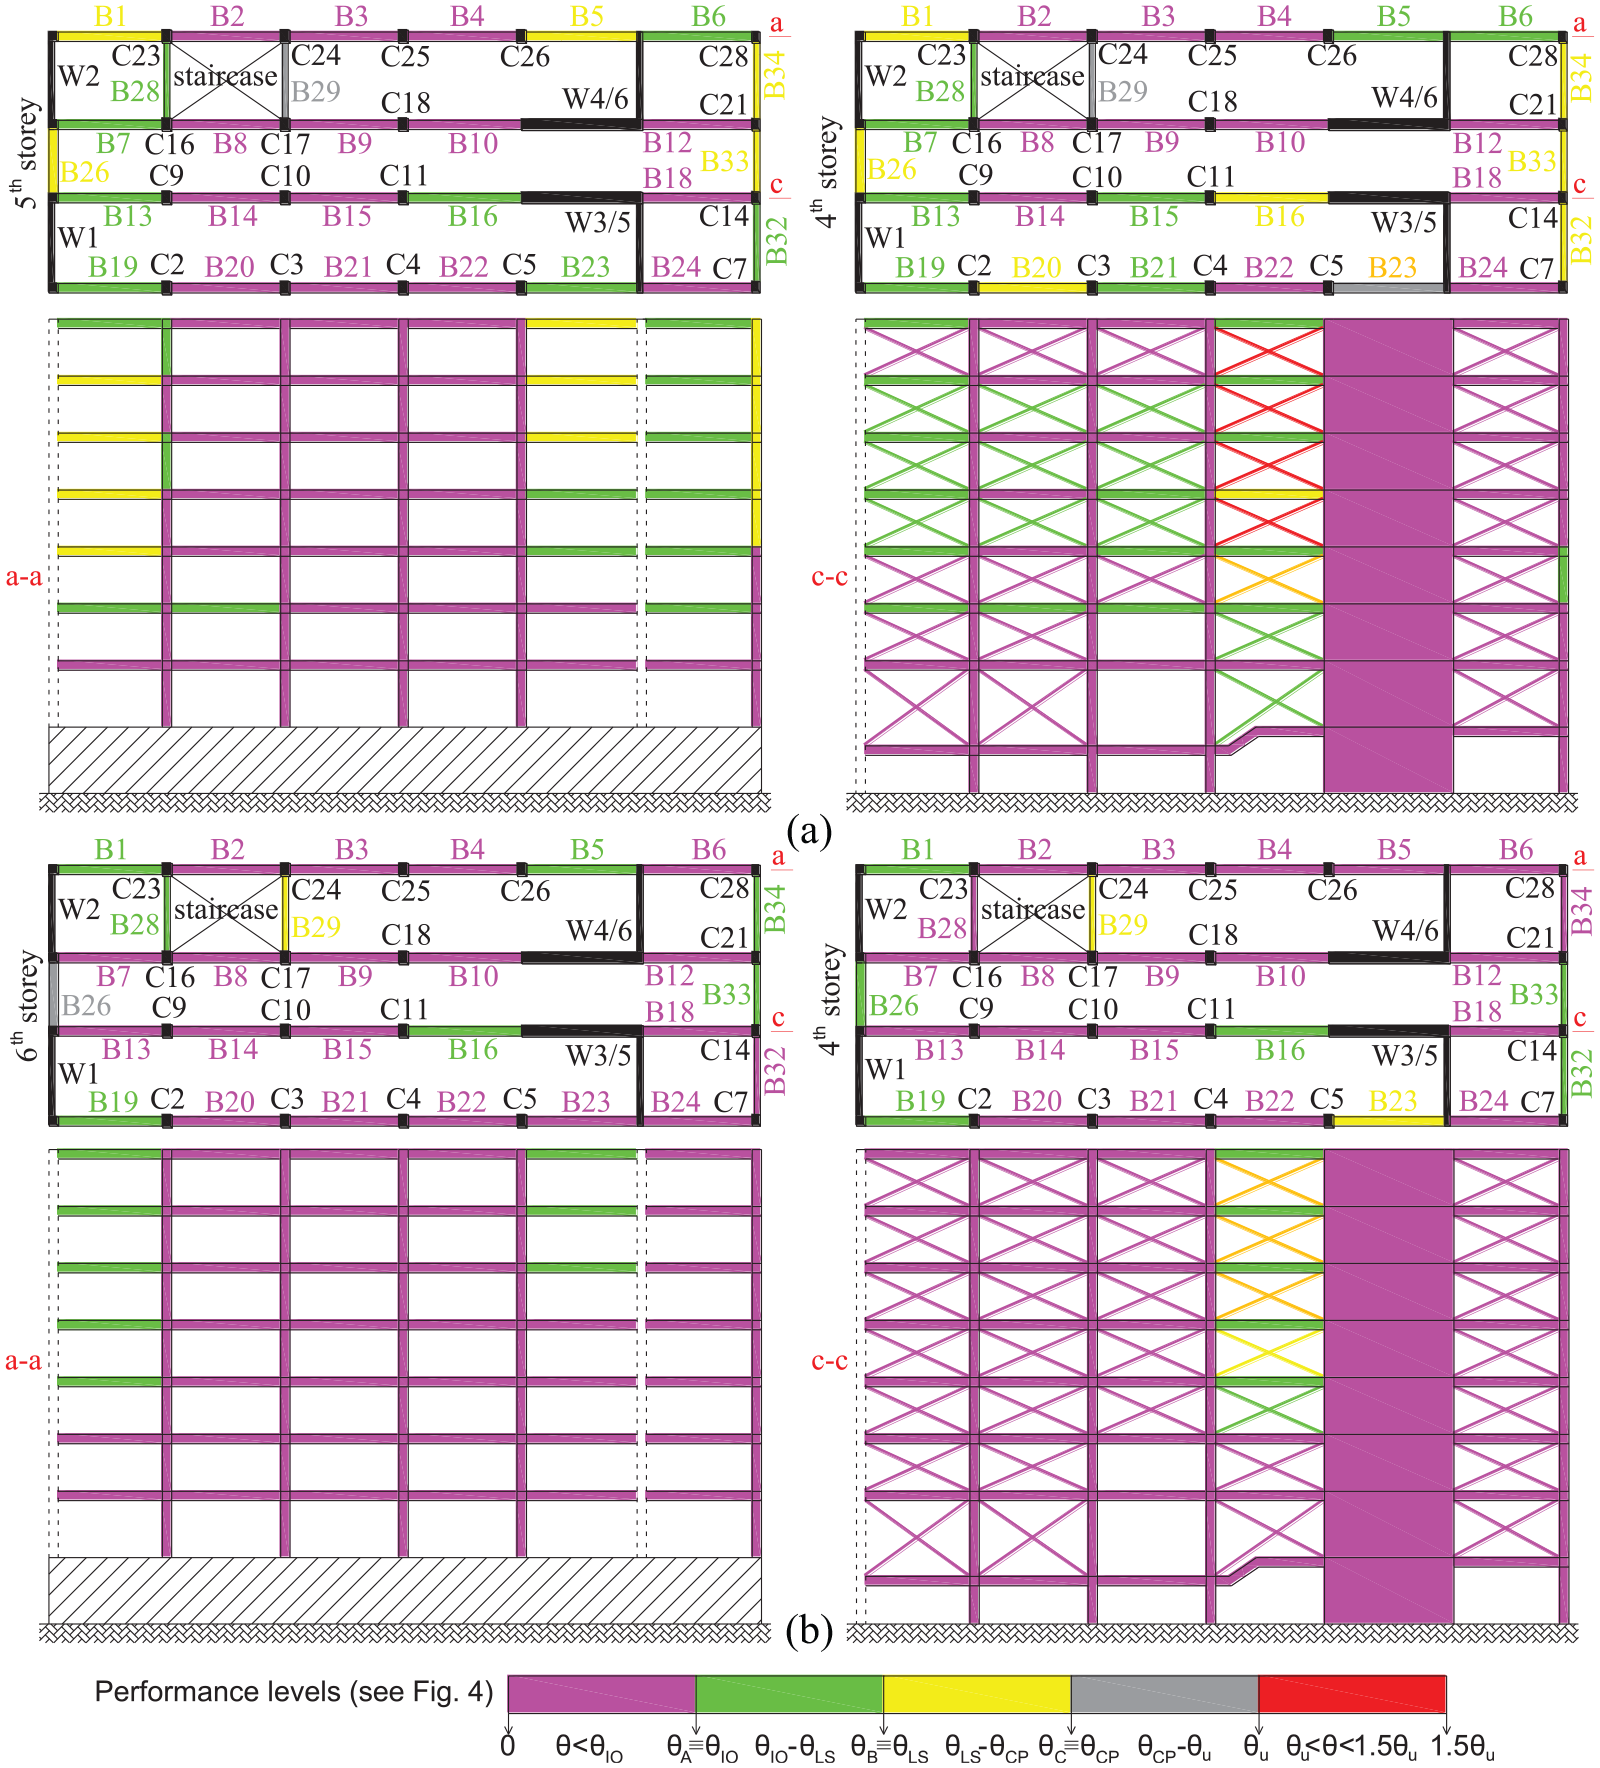
The above results give a general view of the number of critical beams, column, and shear walls. However, the damage distribution along the floor and along the height of the Building is essential to determine effective RSs. The most adverse classification of each member was used to form the envelope of the results of the 32 analyses, which is summarized in Figure 6. This figure illustrates the overall distribution of exceeded performance levels in the critical member sections and provides a synoptic presentation of the pushover analysis results (envelope of results) of Tables 13 and 14 of Appendix 2.
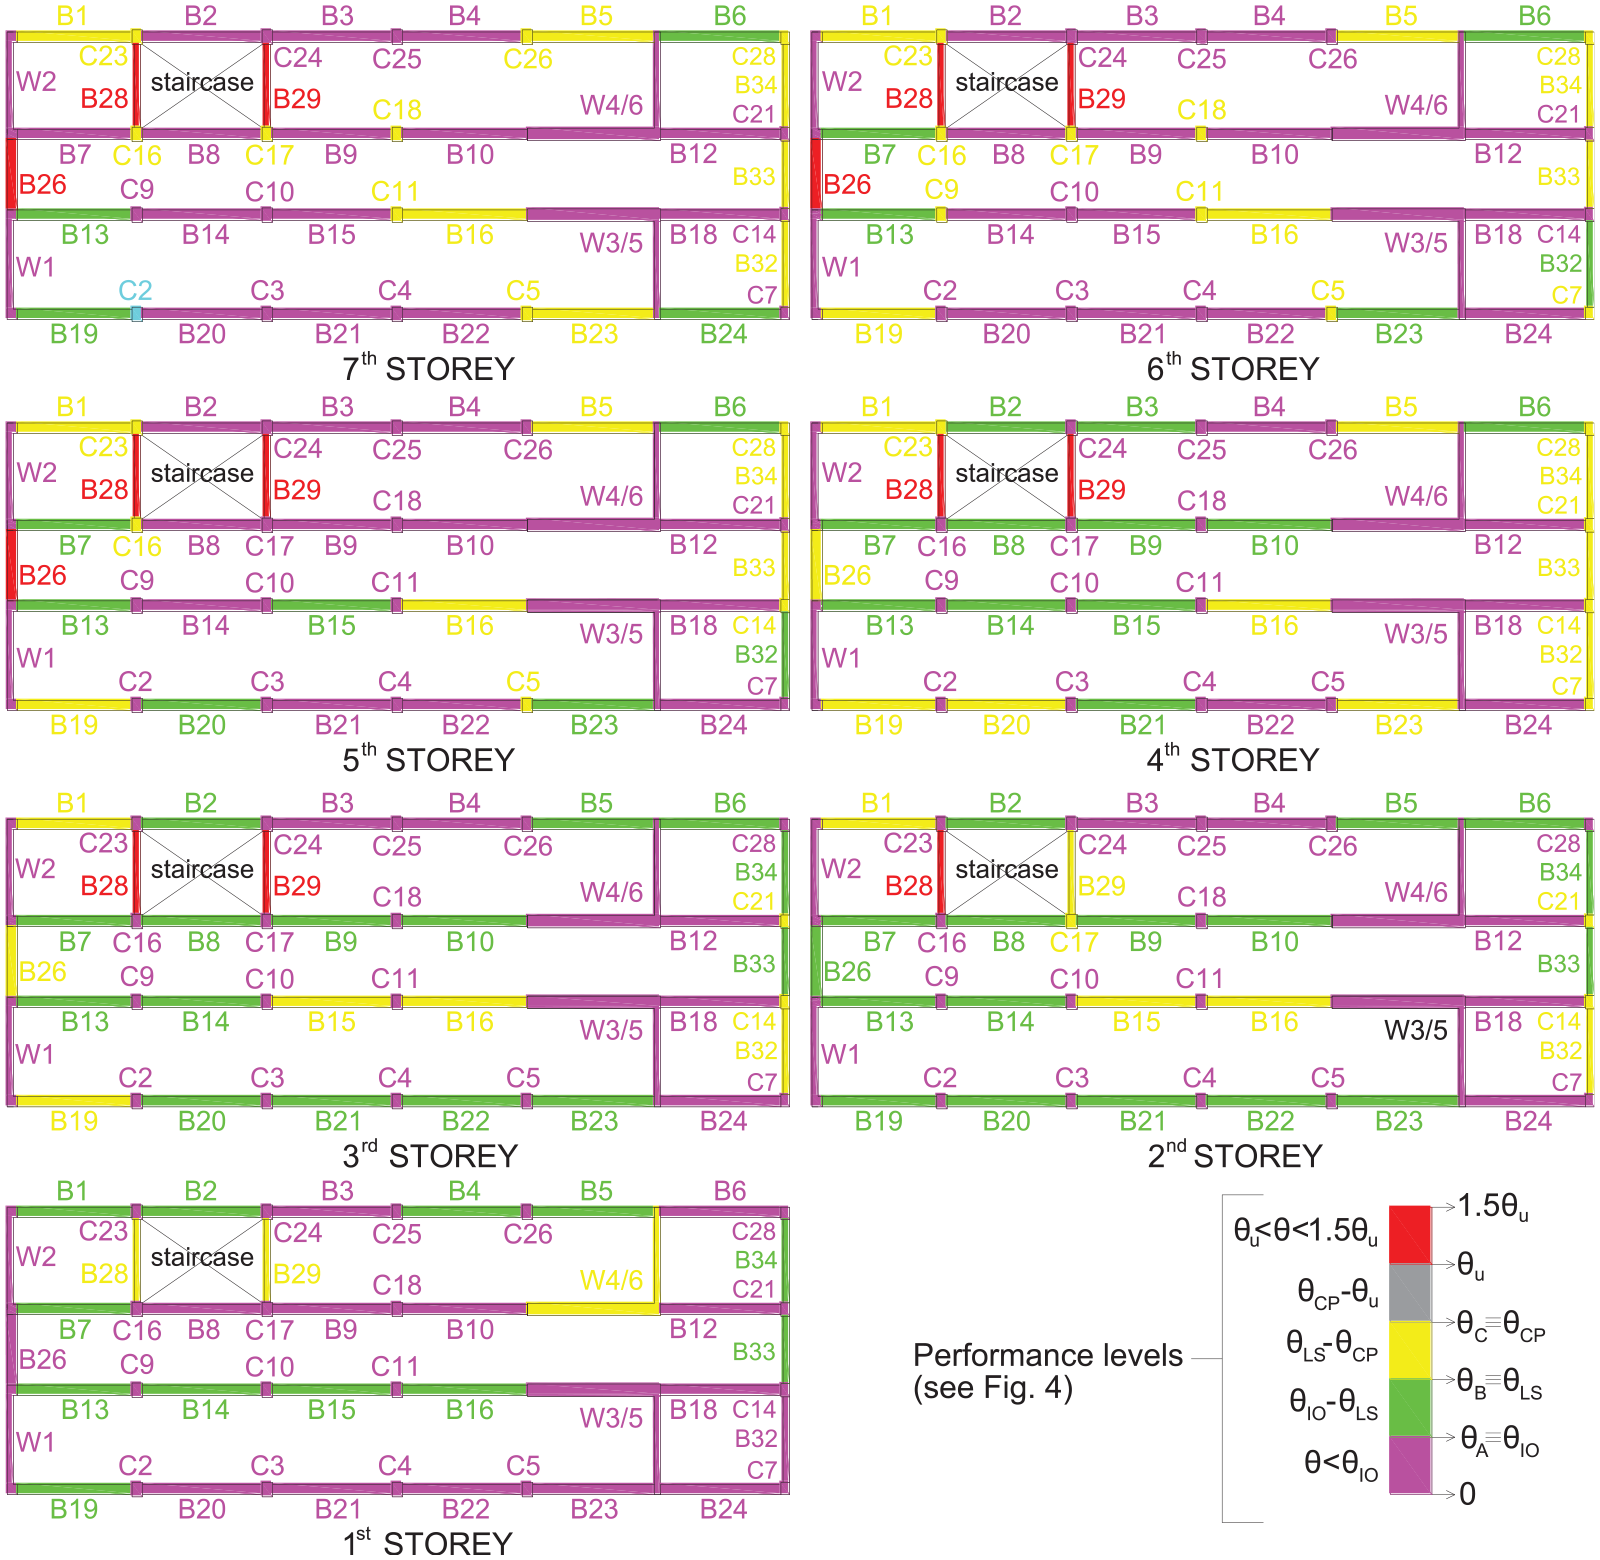
Synoptic presentation of the static nonlinear analyses’ results (envelope of results) and a typical force–displacement (pushover) curve. The nonlinear behavior of elements indicated with colors according to Figure 4.
The main conclusions based on Figures 5 and 6 are as follows:
Almost all r/c shear walls respond elastically. The only exception is the shear wall W4-6 in the first floor, which exceeds the criterion of performance level B(LS) but not that of C(CP). Nevertheless, the detailed assessment of the pushover analysis results indicates that the level of exceedance of the performance level B(LS) criterion is insignificant and no torsional behavior is observed. Therefore, it is reasonable to consider that in general all r/c shear walls respond elastically to the design earthquake.
The vast majority of columns respond elastically. Exceptions consist the columns in the region of the thermal expansion joint and the columns in the region of the staircase. Most of columns in these regions fulfill only the criterion of the performance level C(CP).
The beams along the x-axis exceeding performance level A(IO) are roughly equal to those exceeding performance level B(LS). Along the y-axis, in the region of the thermal expansion joint and the staircase, most of the beams exceed performance level B(LS) whereas a few others exceed performance level C(CP).
A relatively large number of beams are expected to exhibit damage exceeding the performance level B(LS) and C(CP), while almost all vertical elements behaved elastically and none of them exceeded the performance level C(CP). The most vulnerable regions of building are those of staircase and thermal expansion joint as well as the linking beams of the I-shaped and L-shaped shear walls. In the region of staircase, short columns (i.e. C16, C17, C23, C24) have been formed due to the presence of mid-height beams (i.e. B28 and B29), which are used to support the large stairstep at the story mid-height. These columns naturally attract higher seismic forces due to high rigidity of the staircase. In the region of expansion joint, columns and beams were initially designed to have half cross-section compared to the rest columns and beams of the same story (Figure 1b), thus consequently suffering large damages. Damages in linking beams to shear walls are due to the significantly larger rigidity of the latter, which impose large rotation demands to all neighboring elements.
Nonlinear time-history analyses
The ground motion selection was based on the provisions of EN 1998-1 (2005) (§3.2.3.1.2), which suggests selecting a set of accelerograms whose average response spectrum is as close as possible to the elastic design spectrum. For this reason, three real Greek records (i.e. 1981 Alkyonides, 1986 Kalamata, and 2003 Lefkada), each with two horizontal components, were used as a basis to generate a set of six semi-artificial accelerograms compatible with the design spectrum (EAK/2000, 1999), according to CEN EN 1998-1 (2005) and KAN.EPE. (2013). The accelerograms have been generated using the deterministic approach described in Karabalis et al. (1992). In addition, the ordinary records of four historical Greek earthquakes, namely the 1999 Parnitha, the 1995 Aigio, the 1986 Kalamata, and the 1981 Alkyonides (Theodoulidis et al., 2004), were also used for the inelastic time-history analyses. Figure 7 plots the response spectra of the ground motions against the elastic design spectrum (CEN EN 1998-1, 2005; EAK/2000, 1999). The peak ground acceleration αg was set at 0.24 g, the soil is type C and the importance factor γI was considered here equal to 1.0. It should be noted that the seismic coefficient in 1971 (i.e. year of build) was equal to 0.08 g (Royal Decree on the Seismic Code for Building Structures, 1959), while after the 1986 (i.e. period of the first retrofitting), the seismic coefficient was equal to 0.08×1.2 = 0.1 g.
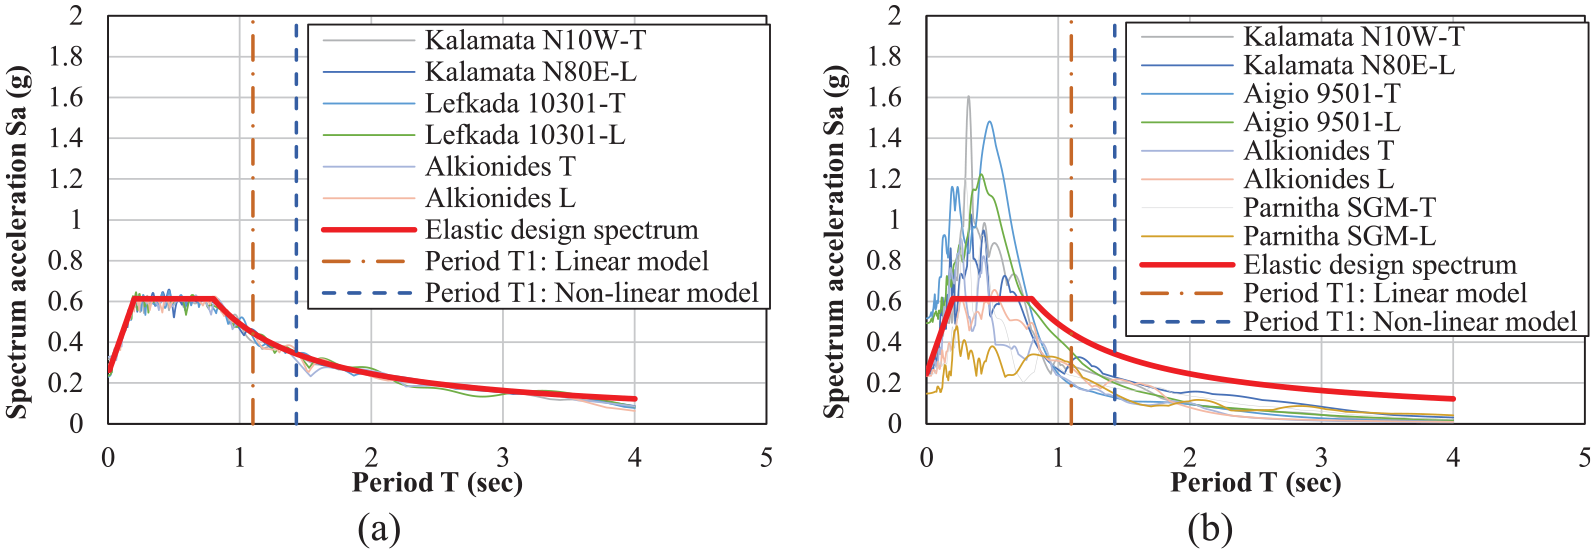
Pseudo-acceleration response spectra of the (a) six semi-artificial and (b) eight natural seismic records considered.
The results of the dynamic nonlinear analyses were expressed in terms of ductility demands. The ductility demand and capacity of each member are determined using the following equations:


In the above equations, θpl is the plastic part of the chord rotation at the member ends (max plastic hinge rotation due to the earthquake considered), θy is the corresponding yielding value of the chord rotation,
Table 5 summarizes the main results from the nonlinear dynamic analyses with the semi-artificial accelerograms for beams and columns (Table 5), showing the elements with the highest demand to capacity ratio. Moreover, the capacity values are provided separately in terms of θy and θu as defined above. Applying the 1.8 safety factor proposed by KAN.EPE. (2013) to the ultimate plastic rotation capacity, it is seen that five beams exceed the limit of the performance level C (Near Collapse). The vast majority of columns respond elastically, except those located at the expansion joint (Figure 1b). The latter exhibited demand/capacity ratios below the limit of performance level C. Figure 8 presented a synoptic view of the damage distribution along the fourth and sixth story of the Building as well as along the longitudinal axis of the Building at two representative locations. Figure 8a shows the results under the semi-artificial accelerograms, while Figure 8b under the ordinary accelerograms. The level of damage at each member is indicated with the same colors as in Figure 4. Analyses using real ground motions showed near collapse performance for beam B26 in the sixth story and of the secondary beams that support the staircase on the mid-height of the upper stories (fourth to sixth). Extended damages (collapse) are expected for the infilled walls at the core of the building. In general, the level of damage at all members under real ground motions was lower than that under semi-artificial accelerograms, but both sets of analysis results are considered and evaluated. All details can be found in the corresponding technical report of the research program) (Anagnostopoulos et al., 2015).
Time-history analysis results: maximum plastic hinge rotations at beam ends and column ends, yield rotations, ultimate plastic rotation capacities, and corresponding ductility demands
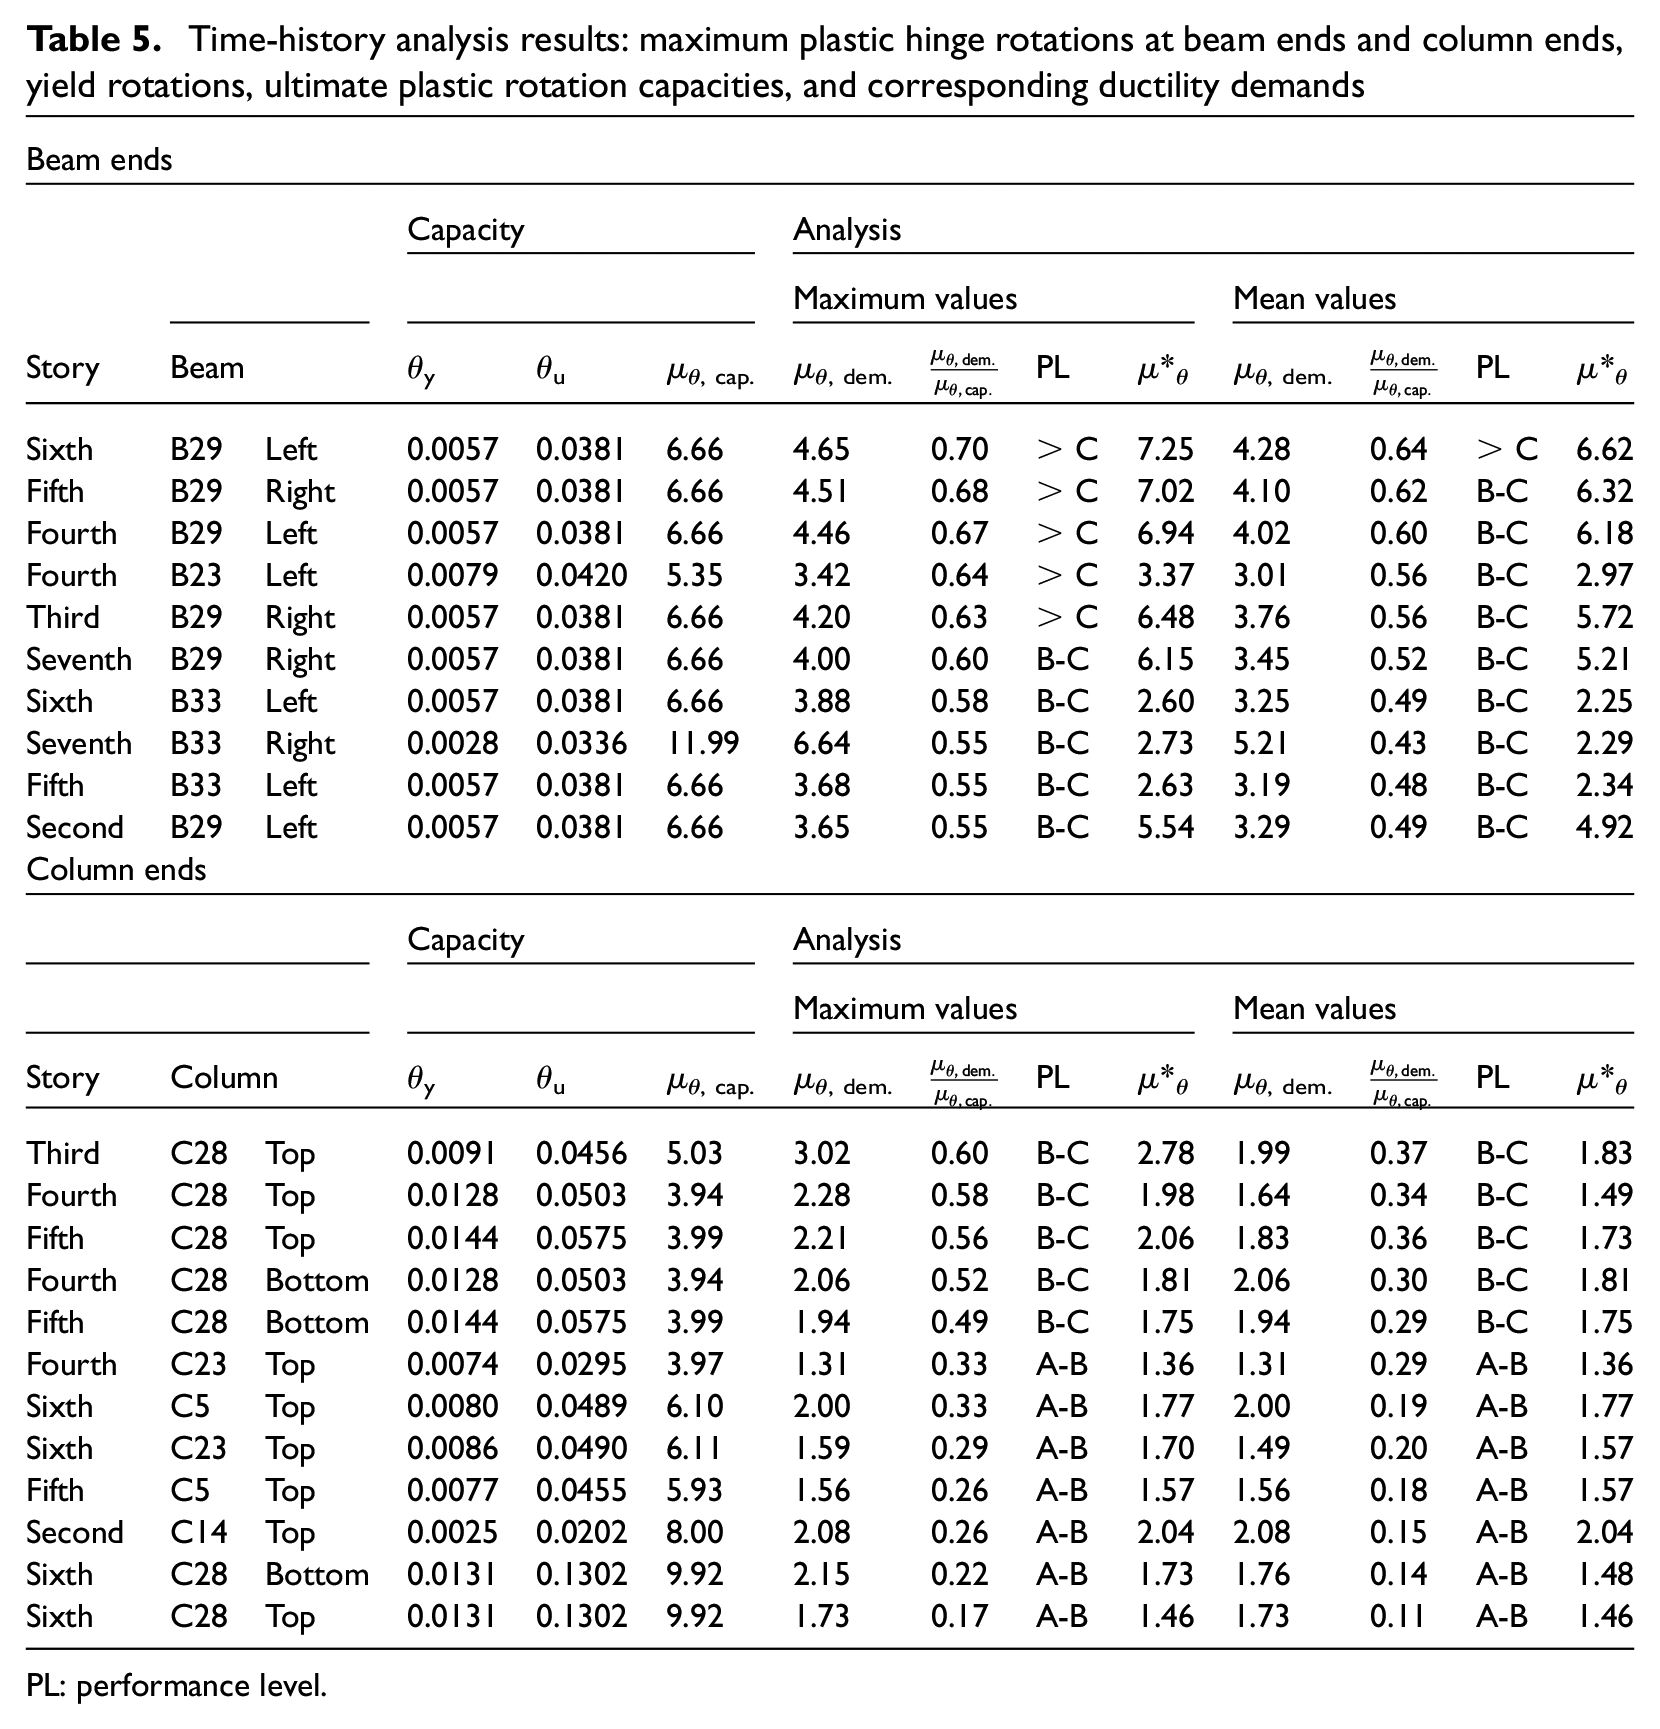
PL: performance level.
Synoptic presentation of the time-history analysis results (max values) under (a) the semi-artificial accelerograms and (b) the ordinary historical accelerograms. The nonlinear behavior of elements indicated with colors according to Figure 4.
The combined study of results of nonlinear (static and dynamic) analyses led to the following conclusions:
Most r/c members respond elastically, except for the beams and columns in the regions of the thermal expansion joint and the staircase. The remaining r/c elements fulfill at least the demands of performance level B (IO) of KAN.EPE. (2013). Thus, the nonlinear (static and dynamic) analyses led—as it was expected—to the detection of the Building’s areas, which are most vulnerable to earthquakes.
On the basis of the response described above, very important is the fact that strong r/c shear walls of the Building behaved almost elastically. For this reason, it appears prudent to utilize the approach of the elastic modeling of the major r/c shear walls even when performing inelastic analyses thus, to reduce modeling uncertainties.
The infill walls at the core of the building are expected to be damaged heavily, particularly those of top floors.
Elastic response spectrum analyses
On the basis of the nonlinear (static and dynamic) analysis results and previous conclusions, a further assessment of the Building was performed conducting ERSA. ERSA is faster than the nonlinear (static or dynamic) analyses and allow extended parametric investigations. ERSA was also used for the selection of the most efficient among several examined RSs presented at a later section. ERSA were performed according to KAN.EPE. (2013) (§5.6.3.2) in conjunction with the corresponding paragraph of EN 1998-1 (2005) (§4.3.3.3) regarding spectrum analysis (i.e. number of eigenmodes to be considered, rules for modal and spatial combinations) (Avramidis et al., 2016). The following points should be noted
The selection of the behavior factor q (or strength reduction factor R in the United States) was based on KAN.EPE. (2013). A value of q equal to 1.7 was selected considering both the construction year of the Building (before 1985) and the fact that there was no damage in its primary (load bearing) elements and infill walls are acting favorably. Additional analyses were performed for performance level C (Collapse Prevention), for which KAN.EPE. (2013) suggest a value for q equal to 2.4 (q = 1.4 × 1.7 ≈2.4).
The capacity ratios (CR) of the bending strength were selected as performance evaluation indices, but the shear capacities of the existing as well as the newly added shear walls were also checked. This was done using two different capacity ratios: one corresponding to the ratio between analysis moment to yielding capacity moment (Mdem/My,cap), and the other to the ratio between analysis moment to ultimate capacity moment (failure state; Mdem/Mu,cap).
Table 6 lists the r/c elements in each story with moment CR > 1 while Figure 9a and b illustrates the overall distribution of the moment CRs for both values of i considered and provides a synoptic presentation of the results in each story. From the ERSA results, the main conclusions are as follows:
In general, the columns appear to satisfy the requirements against force and displacement for both type of analysis (see also Figure 6). For q = 2.4, all columns respond elastically; while for q = 1.7, a significant number of columns (13/18) in the seventh story (top story) exceed the My,cap value. In the other stories the number of columns which exceeds the My,cap value is very small or zero. It must be stressed, that for neither of the two values of q, no column failures in bending (i.e. for all columns Mu,cap < 1).
A significant number of beams yield and a few fail for q = 1.7 in building regions similar to those identified by the static nonlinear analysis (see Figure 6). For q = 2.4, the respective numbers are significantly smaller, particularly in the region of staircase.
The L-shaped shear walls (W3-5, W4-6) indicate slight yielding in the three lower stories; while in the upper stories, they respond elastically. On the contrary, the I-shaped shear walls (W1, W2) respond elastically in all stories.
Number of members with CR > 1 for combination G + ψ2Q ± E xy (E xy was calculated by ERSA)
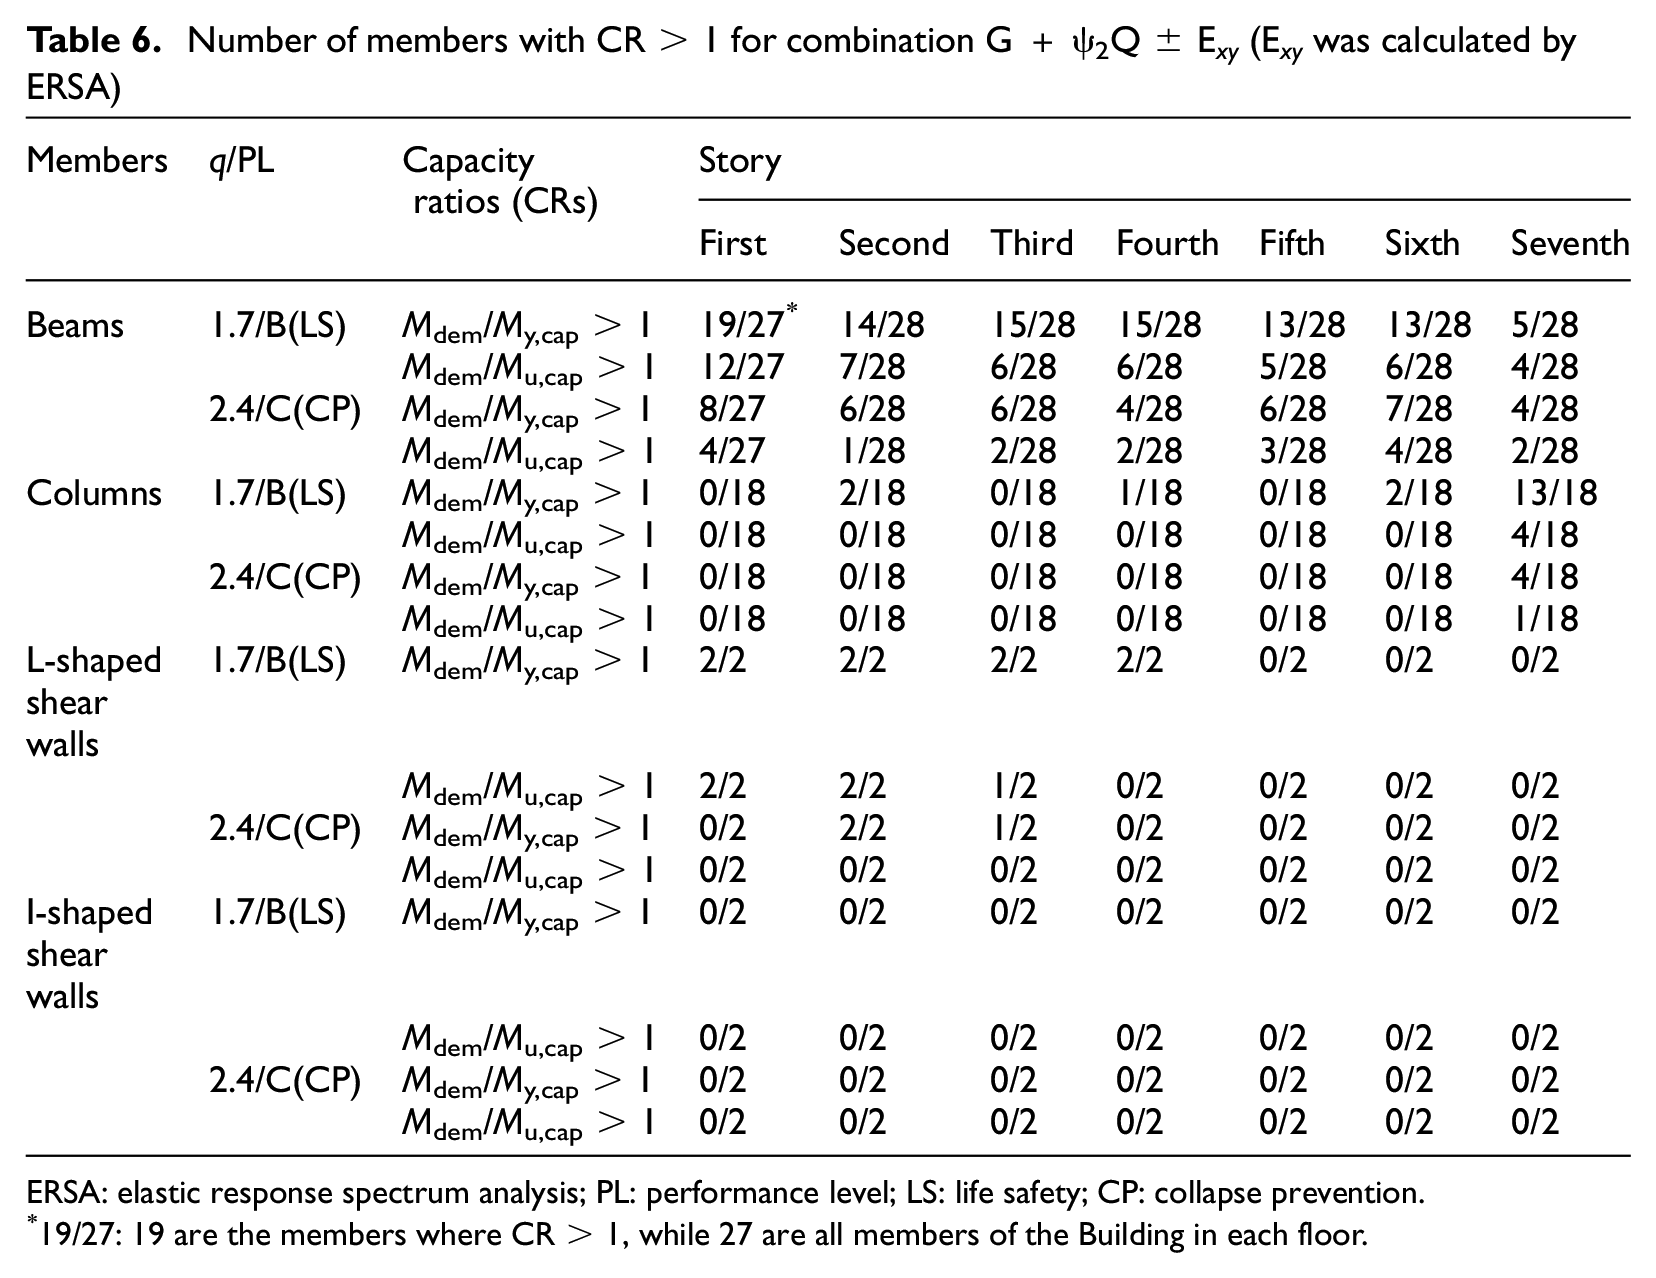
ERSA: elastic response spectrum analysis; PL: performance level; LS: life safety; CP: collapse prevention.
19/27: 19 are the members where CR > 1, while 27 are all members of the Building in each floor.
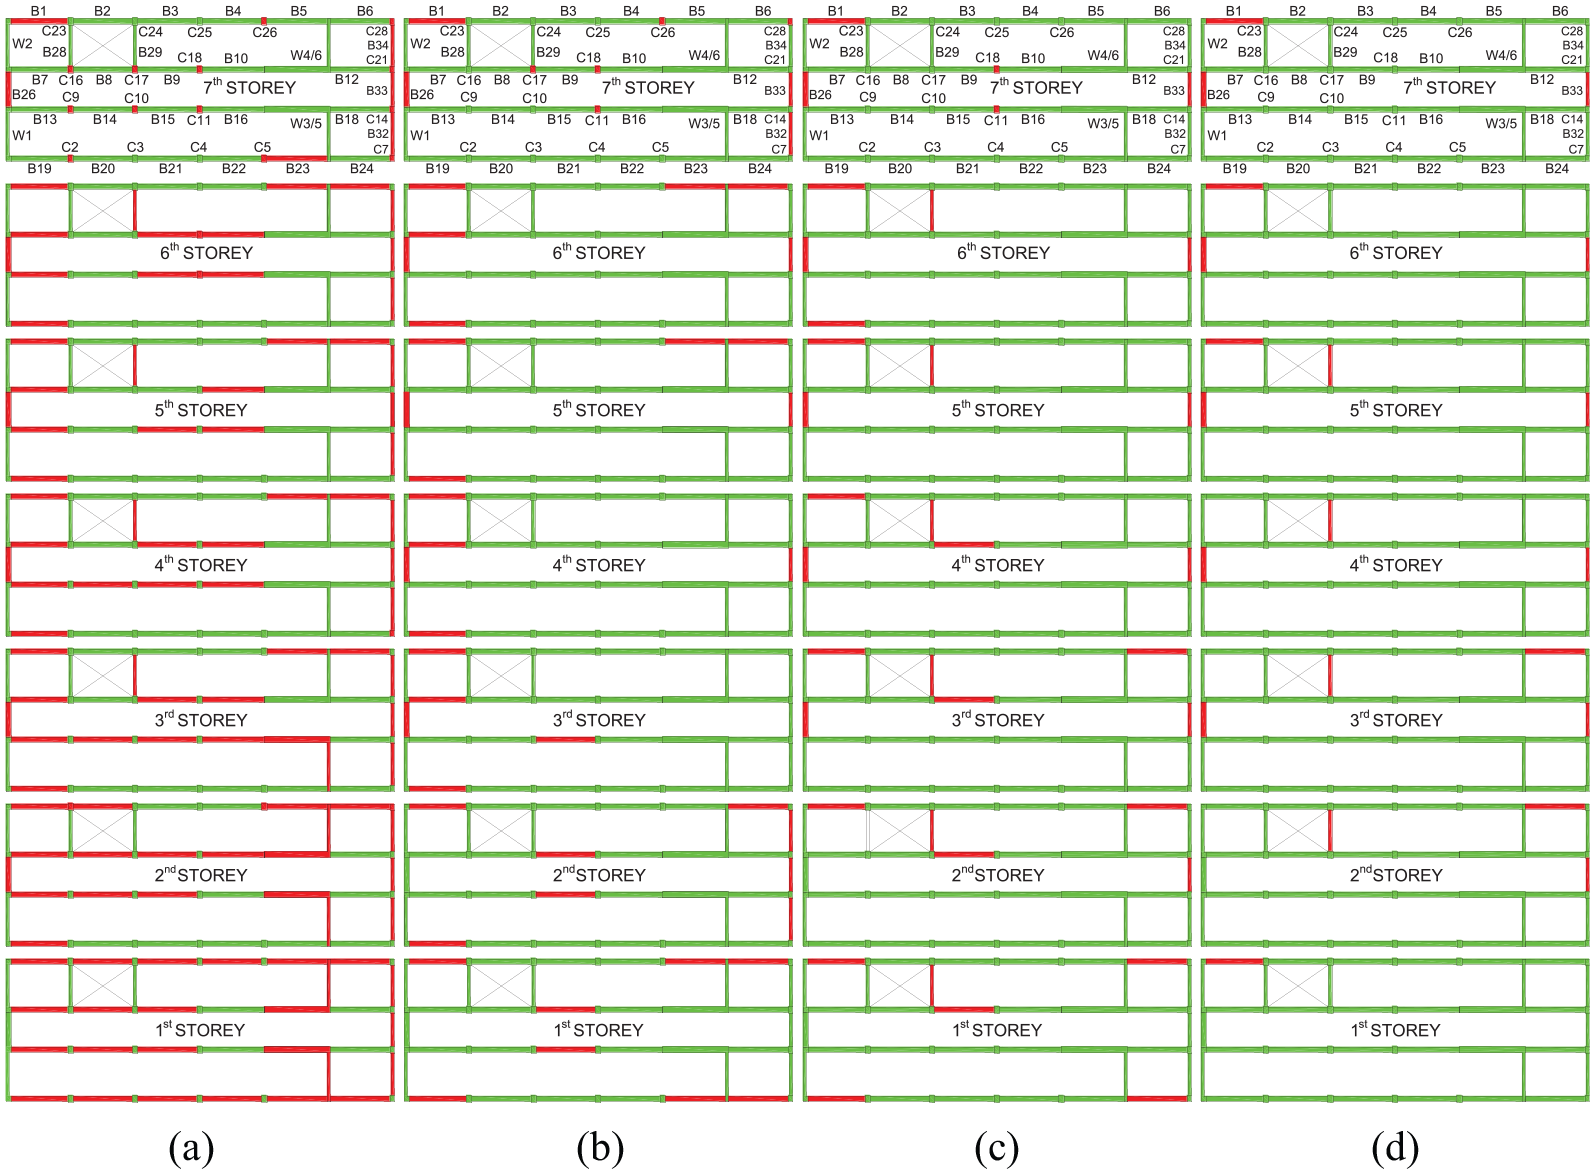
Member damage with CR > 1 (red color) and CR < 1 (green color) due to load combination G + ψ2Q ± E xy using (a) q = 1.7 for the existing building, (b) q = 2.4 for the existing building, (c) q = 1.7 for the retrofitted building, and (d) q = 2.4 for the retrofitted building.
The elastic response spectrum analyses showed that the part of the structure around the staircase and thermal expansion joint requires strengthening as well as central columns of the top story. Moreover, the L-shaped shear wall elements play an important role in the resistance of the building and any successful RS should ensure that these members remain elastic under design-basis earthquakes in order to reduce the possibility of damage on them which is difficult to repair. These results are in accordance with those obtained by utilizing the more sophisticated methods of pushover and dynamic nonlinear analyses demonstrating the efficiency of the ERSA when it is performed utilizing a proper behavior factor associated with the corresponding performance objective.
Investigation of the most efficient RS
Selection of the potential RSs
The criteria behind the selection of the studied RSs were efficiency, economy, and minimization of disturbance (most of the Building must remain operational during retrofitting). However, bearing in mind that the L-shaped r/c shear walls are crucial members for the seismic response of the Building, an additional criterion adopted was to maintain their elastic response. In this point, it must be noted that all the examined strengthening schemes included the elimination of the “short columns” formed by an external wall just above the basement of the building. In total, 17 RSs (Anagnostopoulos et al., 2015), which more or less fulfill the above-described criteria were investigated. The seismic performance of the retrofitted Building was evaluated by using ERSA adopting the two values of the q factor mentioned above (1.7 and 2.4). In the following sections, the three more effective intervention schemes are introduced while more details of the proposed RS and evaluations are presented in a later section.
Synoptic presentation of the three more efficient RSs
Figure 10 briefly illustrates the more effective RSs among the 17. The main goal is to connect the columns C16 and C23 (staircase) with a 30 cm thick r/c shear wall that runs along the entire height of the Building (new shear wall W9 in Figure 10). A second goal of these schemes is the strengthening of the frame in the region of the thermal expansion joint. This happens by constructing two new r/c shear walls of 40 cm thickness between the columns C7 and C14, and between the columns C21 and C28 (new shear wall W7 and W8 in Figure 10). Differences are as follows:
In the scheme RS1 (Figure 10a) the new r/c shear wall W7 extends only up to the fourth story due to operational reasons, while the new r/c shear wall W8 extends to the top of the Building. The shear wall W9 runs along the entire height of the Building. In addition, the four columns (C7, C14, C21, C28) and the beam B33 (between the columns C14 and C21) of the frame in the region of the thermal expansion joint are strengthened using r/c jackets in all stories.
In the scheme RS2, the strengthening of the frame in the region of the thermal expansion joint is achieved as in the scheme RS1. Moreover, the part of the slab enclosed by columns C12-C13-C20-C19 is strengthened by increasing its thickness to 40 cm and new beams are formed between columns C5-C12-C19-C26 and between the columns C13 and C20 in the upper three stories (Figure 10a).
In the scheme RS3 (Figure 10b), both the shear walls W7 and W8 in the expansion joint stop at the fourth story, while the shear wall W9 runs along the entire height of the building to reduce the damages in the beams and columns around the staircase. The four columns (C7, C14, C21, C28) in all stories of the frame in the region of the thermal expansion joint as well as the beam B33 (which connects columns C14 and C21) in the lower four stories are strengthened using r/c jackets.
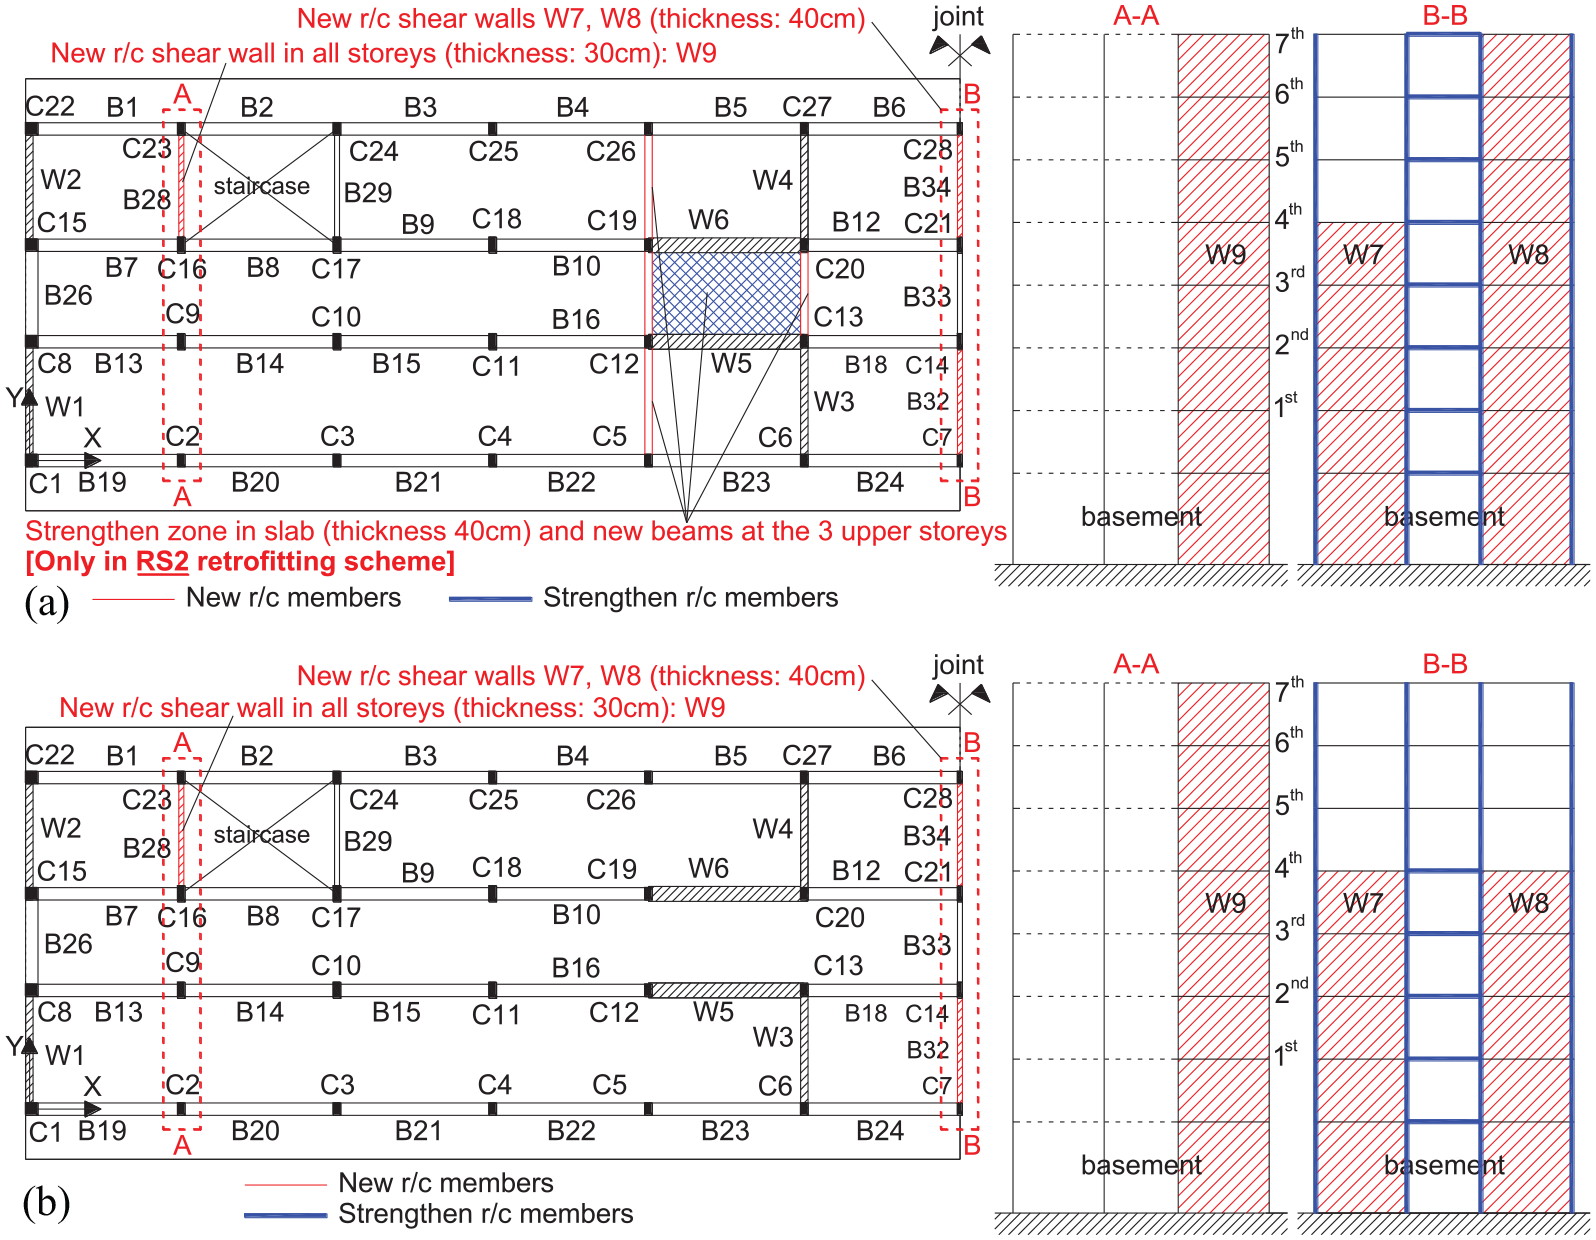
The three most effective retrofitting schemes: (a) RS1, RS2, and (c) RS3 schemes.
Table 7 presents the maximum values of CR for yielding of the reinforcement for walls W3-5, W4-6, W1, and W2, for the three RSs and for q = 1.7. RS3 ensures elastic behavior of all walls and this is the reason it was finally selected among the three schemes. Elastic behavior of the massive walls reduces the uncertainties regarding the nonlinear behavior of the vertical members. It is noted that the yielding capacity ratios of walls W1, W2 of the RS1 and RS2 are close to 1, meaning that also RS1 and RS2 lead to almost elastic behavior of the shear walls of the building. However, constructional operations for RS3 are less than the other two schemes and thus RS3 (Figure 10c) is the proposed RS. The main reasons are as follows:
In the external frame at the thermal expansion joint, there are no infill walls for the three upper stories. This enables the internal direct communication between the two separate, but identical structural parts of the Building (Figure 1b) forming a large open space. This open space accommodates important activities (i.e. use of meeting rooms, offices, presentation rooms, monitoring emergency plans) and should remain as it is.
By retaining the internal communication between the separate parts of the Building also enables the smooth operation of the Building during retrofitting, thus resulting in less disturbance.
Compared to RS2, strengthening of the slabs and construction of new beams are not required in RS3. This results in no interruption of businesses in the central part of the Building, thus avoiding a complete downtime of the three upper stories.
Maximum CR (in yielding) of the critical cross-sections of the existing r/c walls W3-5, W4-6, W1, and W2 (q = 1.7)
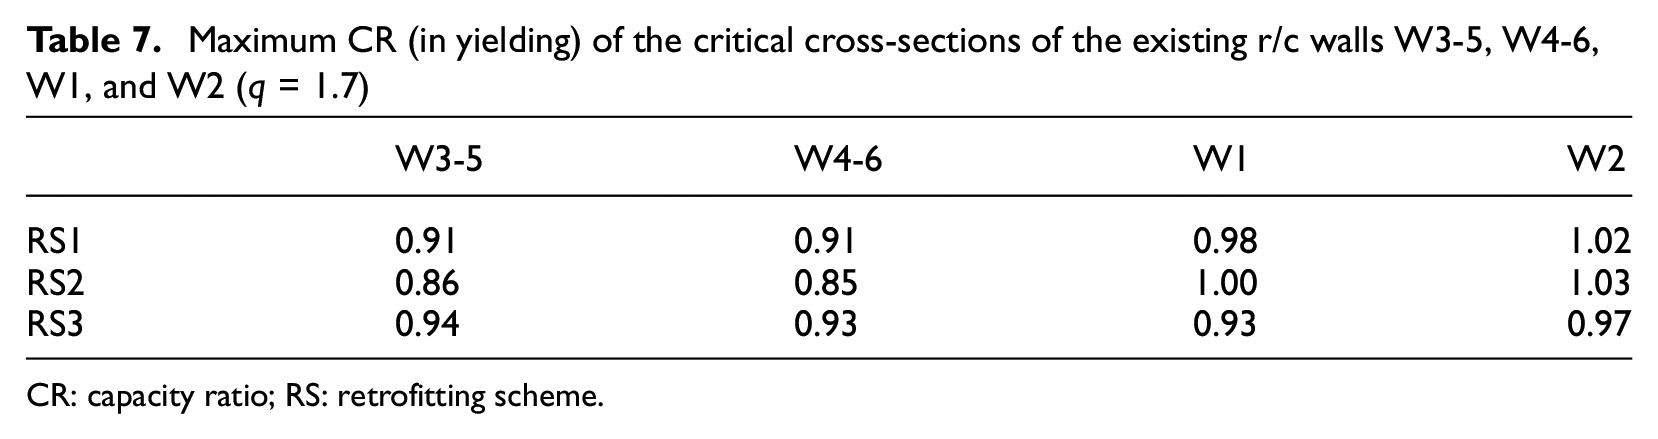
CR: capacity ratio; RS: retrofitting scheme.
Description and verification of the proposed retrofitting
Description and verification of the superstructure retrofitting
Figure 11 illustrates indicative interventions, which are required for the implementation of the proposed scheme RS3 in the basement level including details to the reinforcement, post-installed anchorage, and so on of the r/c column jackets and new r/c shear walls. More details of the RS3 for the other story can be found in Figure 15 of Appendix 1. A monolithic connection between the existing and the new members was assumed for the determination of the strength and ductility capacities of the new and retrofitted members. Figure 11 also indicates that r/c column jacketing in the location of the expansion joints has to be limited to three sides only. As an alternative of r/c jackets, steel or fiber-reinforced polymer (FRP) jackets are used in practice, but this might not be an effective solution here. New shear walls (i.e. W7, W8, and W9) are required at the locations of the existing weak columns and beams, and these existing members are proposed to be used as hidden members of the new r/c walls. The proposed r/c jacketing is considered as a part of the whole work required for constructing the new shear walls resulting in reduced construction effort and time. Moreover, the fact that three sides of the existing columns and beams are accessible may result to insufficient confinement and anchorage for solutions like steel or FRP jackets.
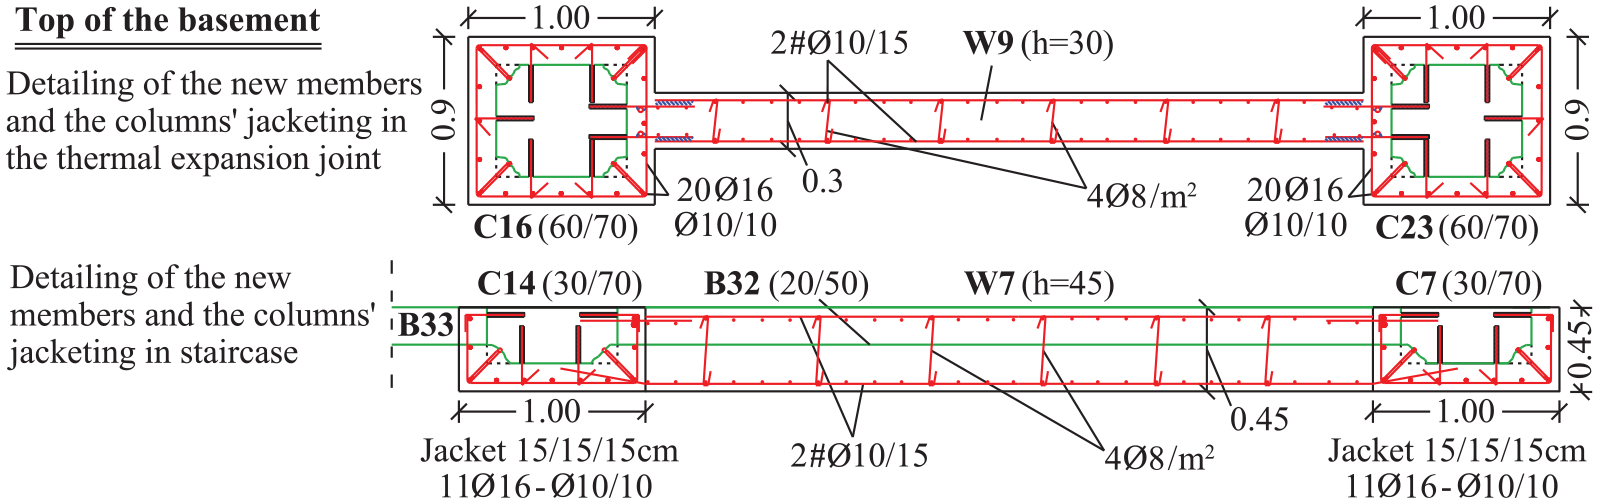
Typical detailing of the new r/c shear walls W7 and W9 and r/c jackets of columns C7, C14, C16, and C23 of the solution RS3 in the basement level.
The proposed RS3 scheme accepts some minor damage in a few beams of the Building and in just two columns of the last story (seventh) as summarized in Table 8. More specifically, only 2 columns of 16 (i.e., total columns in the floor) of the seventh story exhibit CR > 1.0 for bending failure, though only for q = 1.7 (performance level B(LS)). Regarding the r/c shear walls (existing and new ones), all of them exhibit CR < 1.0 for bending yield (Table 8) indicating that, they remain essentially elastic. Figure 9c and d illustrate the distribution of bending failure CR for the members of the retrofitted Building for both values of q, and thus provides a synoptic presentation of bending failures in all stories. Comparing Figure 9a and b with Figure 9c and d, one can observe that the selected RS reduces the bending failures. Thus, for q = 1.7, a small number of beams fail (two to six per floor); while for q = 2.4, the corresponding number is even lower (one to four per floor). It should be stressed, however, that the failing beams in all the stories are the beams B26, B29, and B33, the first two of which connect massive r/c shear walls and for this reason it would be exceedingly expensive to eliminate the level of damage in them.
Number of columns and beams of strengthened building (RS3) had CR > 1 against bending failure and number of r/c walls had CR > 1 against bending yielding (over the total number of members per floor) due to the combination G + ψ2Q ± E xy
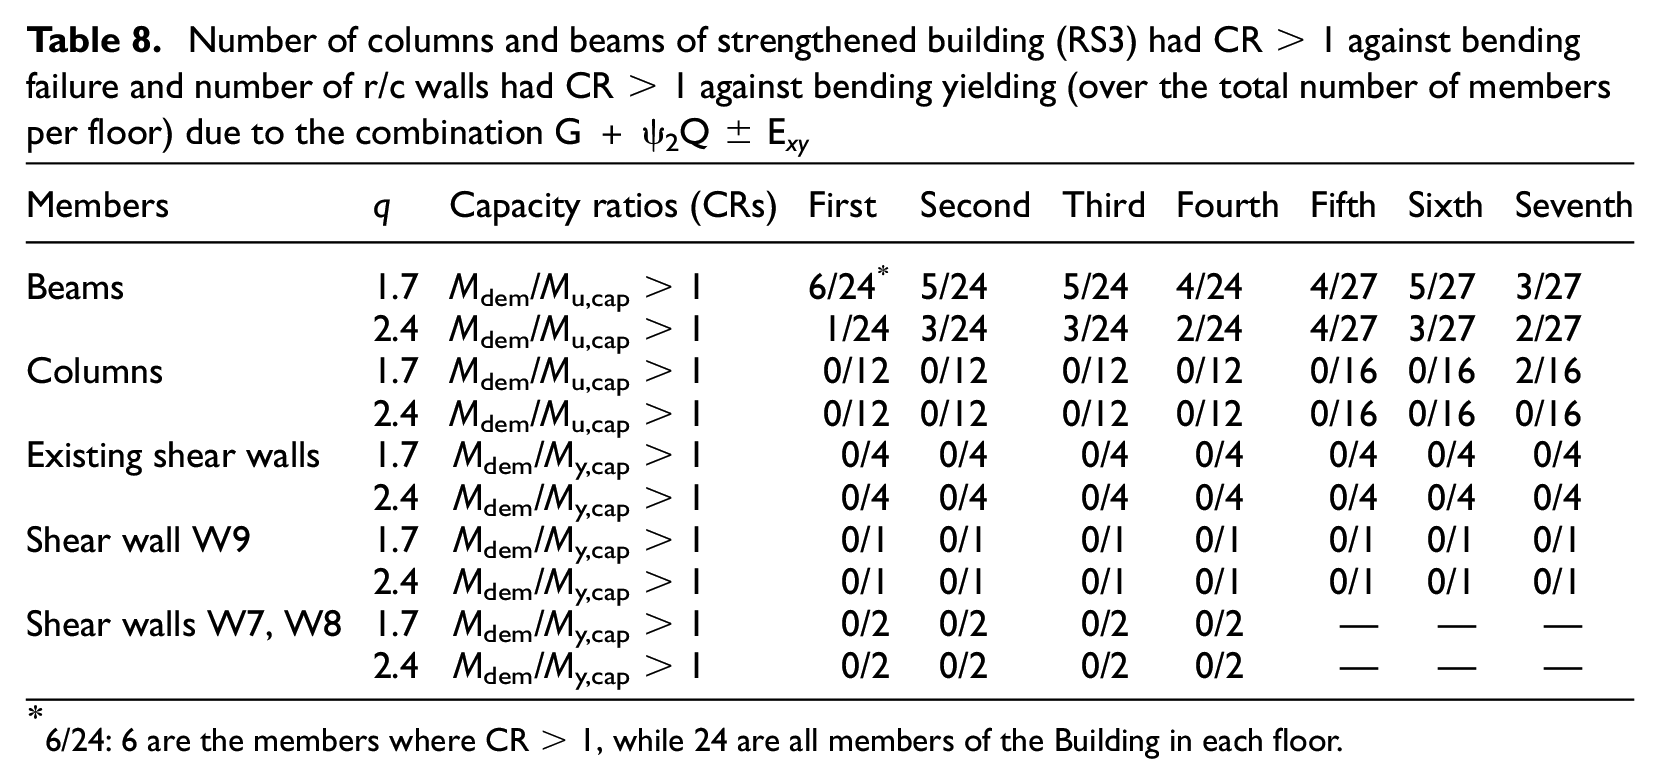
6/24: 6 are the members where CR > 1, while 24 are all members of the Building in each floor.
The acceptance of damage in beams is not out of the provisions of KAN.EPE. (2013) and EN 1998-3 (2005), which permit the consideration of such beams as secondary seismic members. According to the aforementioned codes, the performance criteria applicable to the primary members can be neglected for the secondary ones. Nevertheless, to ensure that the failure of these beams does not significantly affect the seismic response of the strengthened building as well as the primary beams can safely support the gravity loads after an earthquake, additional analyses were performed, assuming both ends of the secondary beams as pinned. The results of these analyses confirm the consideration of beams B26, B29, and B33 as secondary seismic members, indicating minor influence of them on the seismic performance of the strengthened building. Table 9 summarizes these analysis results. Comparison with the results of analyses in which the beam ends were assumed as fixed are also provided. Finally, the new and the existing r/c shear walls were checked and found to be of adequate resistance against brittle, shear failure for q = 1.7. Table 10 presents the result of these checks.
Maximum values of CR against bending failure for vertical members of the two models with different assumption about the modeling of beams B26, B29, and B33 [G + ψ2Q ± E xy (q = 1.7)]
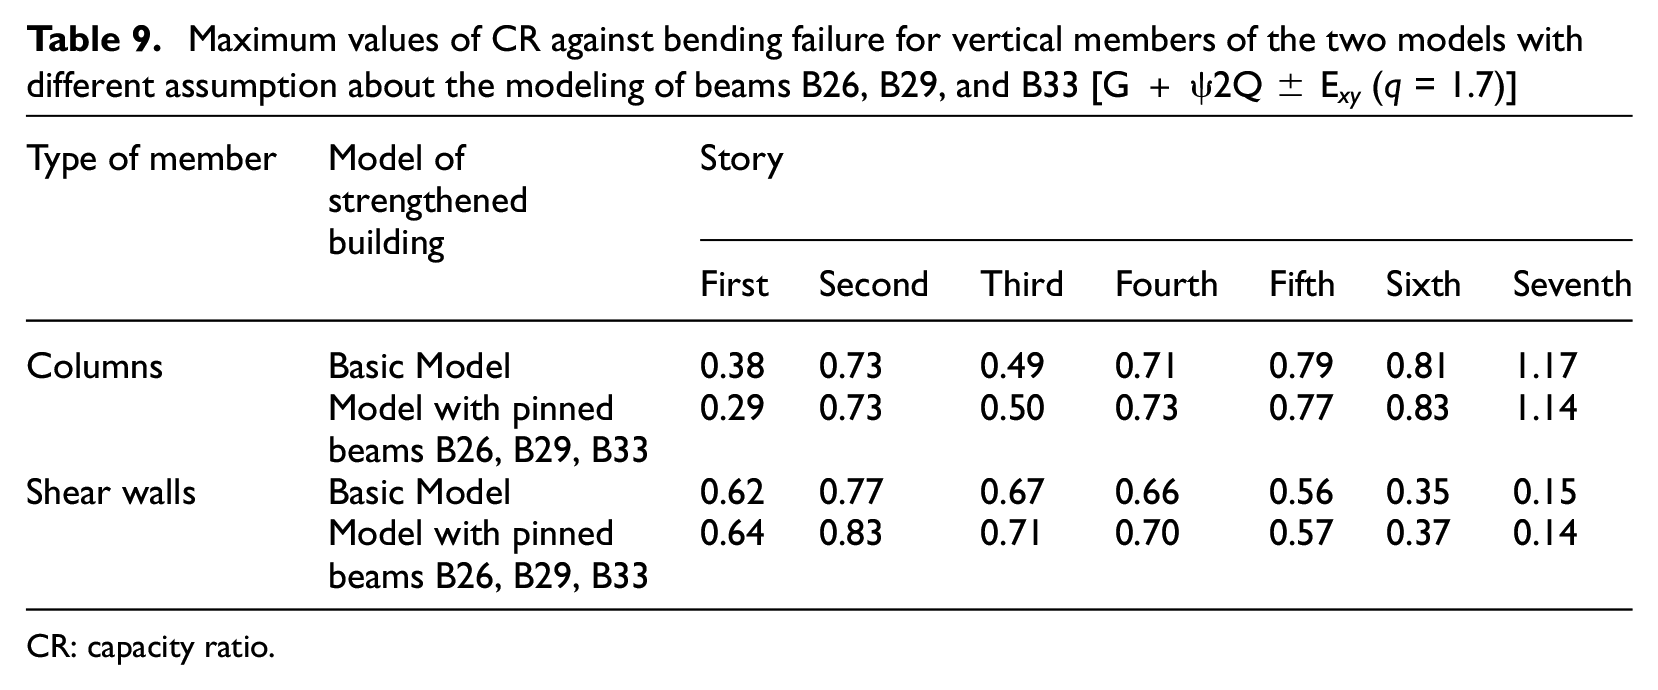
CR: capacity ratio.
Shear CR of the existing and the new shear walls of the strengthened building due to combination G + ψ2Q ± E xy (q = 1.7)
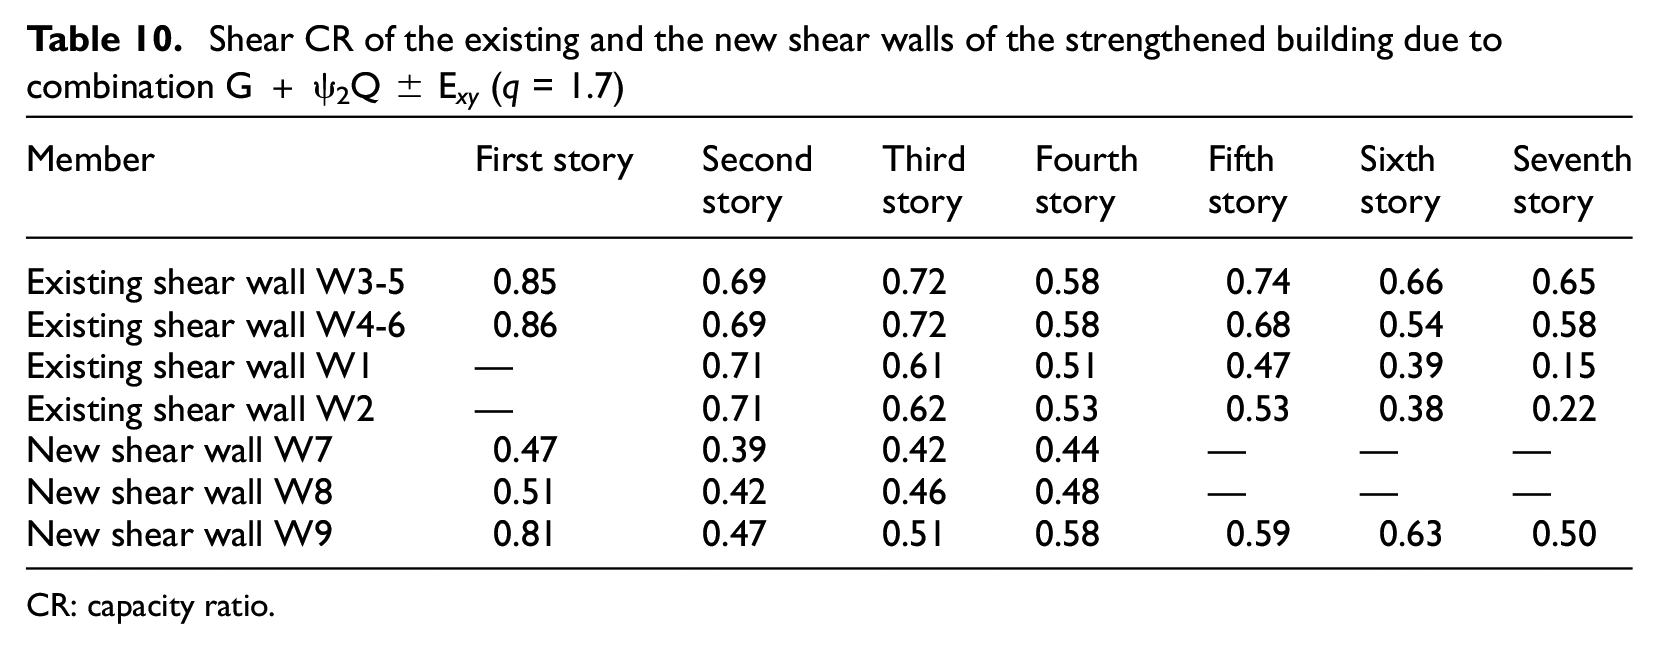
CR: capacity ratio.
Description and verification of the foundation retrofitting
This section presents the evaluation of the seismic performance of the foundation in view of the superstructure retrofit and suggests specific interventions to bring the foundation to targeted safety standards. A new Building model with emphasis on its foundation was created. In this model, the foundation was modeled by shell finite elements to accurately determine the stress distribution at each element above the soil as well as to help the decision-making through a realistic representation of results. All the foundation elements were considered to behave elastically. The model based on the equations of dynamic equilibrium of a rigid foundation system resting on elastic half-space was utilized as discussed in a previous section. The peak stress values as obtained from the ERSA utilizing the two behavior factors q (i.e. 1.7 and 2.4) was compared to the bearing capacity (allowable pressure), σu of the soil. The nonlinearity of the soil was ignored as exceedance of allowable pressure is not acceptable. Considering the available in situ data (Table 1), the bearing capacity was taken equal to 250 kPa for the static loading. This value was increased by 50% for seismic actions (σu,seism = 375 kPa). This increase was documented by the Greek seismic code of 1959 (Royal Decree on the Seismic Code for Building Structures, 1959), which was valid in Greece at the year of design of Building (1971), as well as by the literature (Peck et al., 1974; Tiznado and Paillao, 2014).
A reference analysis under the load combination G + ψ2Q ± E xy was conducted first for the current building as retrofitted in 1986. Figure 12 illustrates the stress distribution along the (rectangular and strip) footings for q = 1.7, while Table 11 summarizes the maximum and minimum values of stress for both q (i.e. 1.7 and 2.4) factors considered in this study. One can observe significant excess of the bearing capacity, particularly in the perimeter of the current building and near the expansion joint. Even if a first retrofitting study of the Building was conducted in 1986, it appears that the foundation requires upgrade according to current provisions. However, it should be noted that there are important uncertainties with respect to the damping considered in soil springs as well as in the method for determining the bearing capacity of soil. Figure 12 and Table 11 point out a significant excess of the bearing capacity in all perimetrical footings, at the foundation beams F/B1 and F/B2 and in footings of the expansion joint columns. Thus, the intervention on the foundation was considered as imperative.
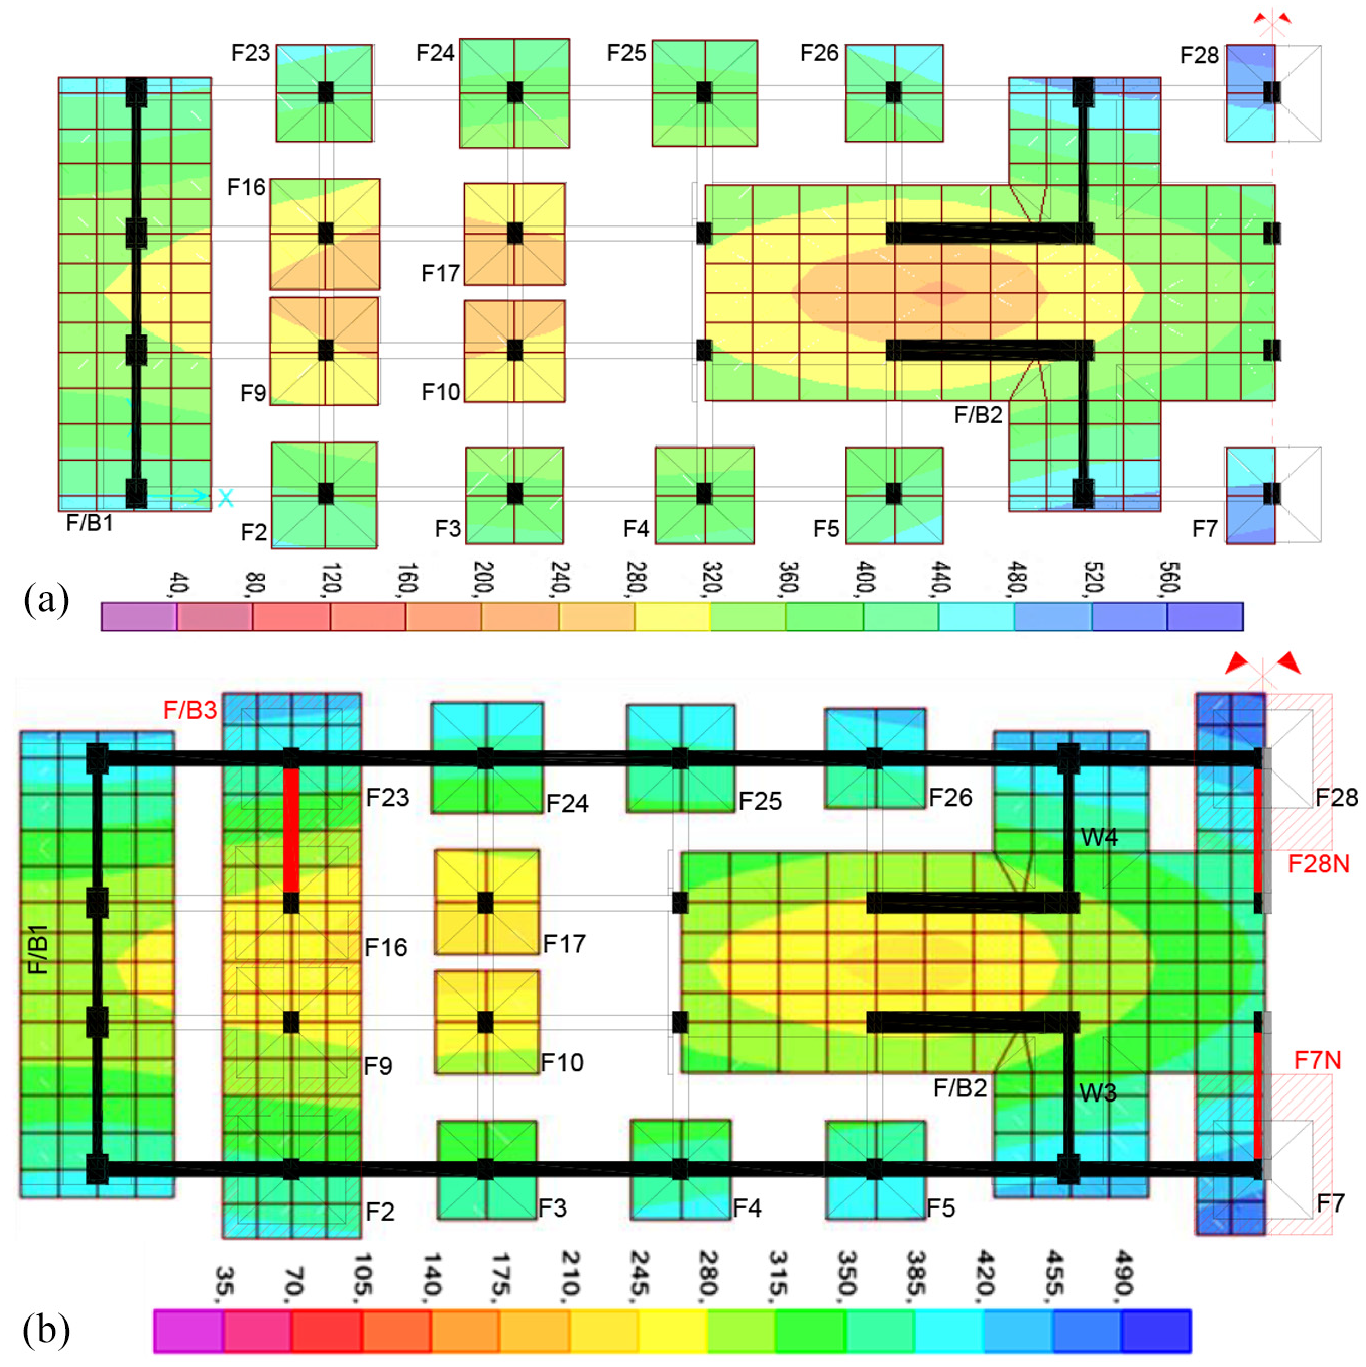
(a) Distribution of soil stresses (in kPa) in current building as retrofitted in 1986 and (b) distribution of soil stresses (in kPa) in the retrofitted foundation.
Maximum, minimum, and mean soil stresses (in kPa) in current building as retrofitted in 1986 and in the proposed retrofitted building (RS3) [G + ψ2Q ± Exy]
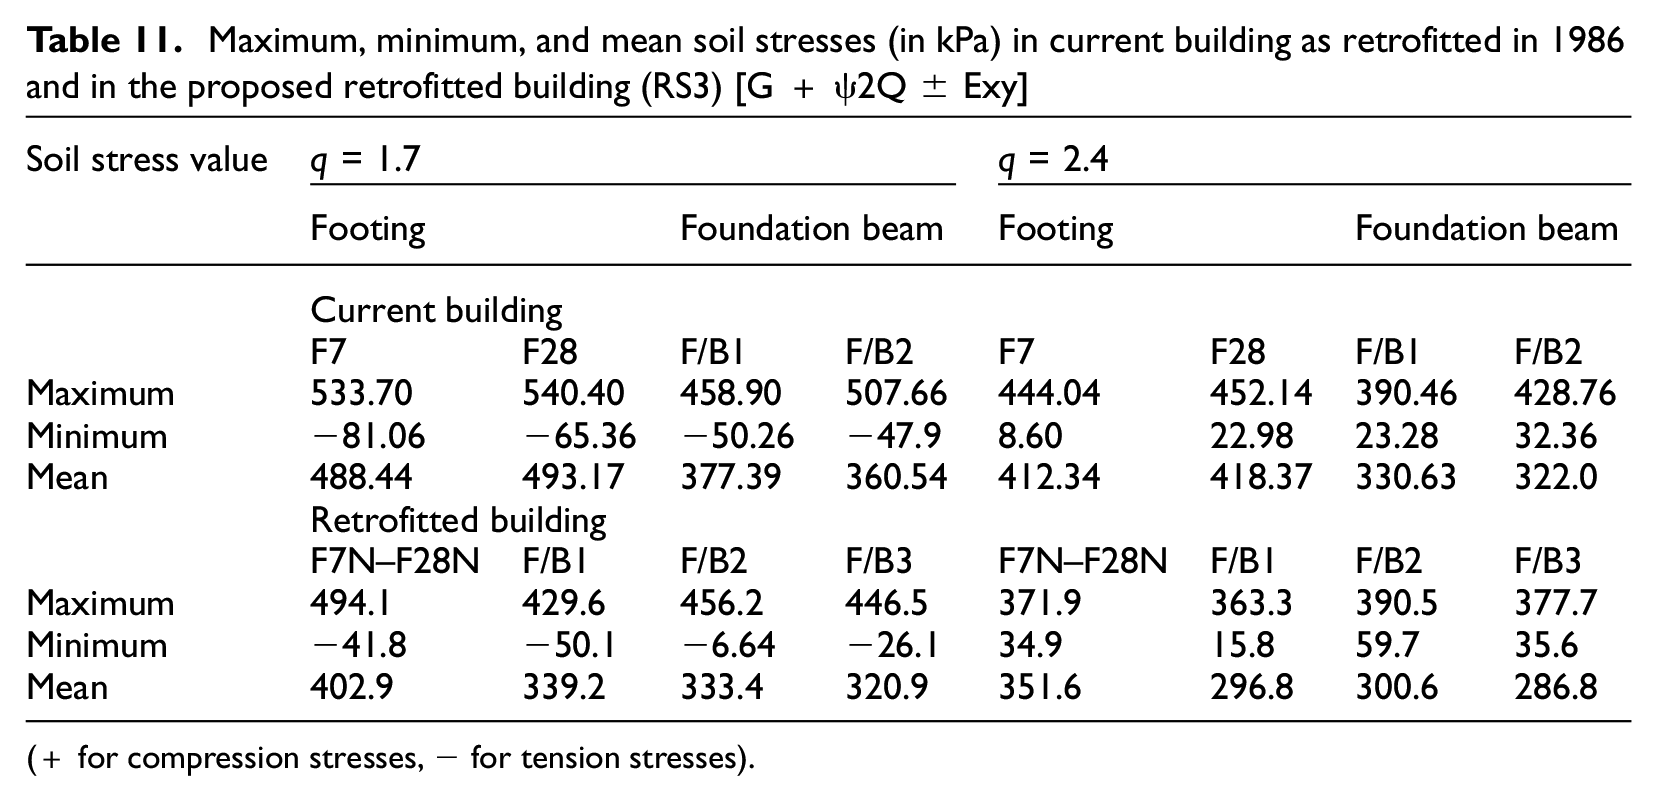
(+ for compression stresses, − for tension stresses).
Two schemes of retrofit were examined for which analyses have shown a significant reduction of the maximum contact pressure, while stresses are near to the allowable bearing capacity. Considering the accessibility to the foundation r/c members, Figure 13a introduces the most suitable RS and Figure 13b the second preferable RS, respectively. In the first RS, a new foundation beam is proposed to be constructed to link together the most critical individual footings forming a continuous foundation element, while in the region of the expansion, joint footing enlargements are proposed to connect the individual footings with existing neighboring foundation beams. More specifically, a new foundation beam (F/B3) is constructed to enclose the individual footings F2-F9-F16-F23 and provide adequate foundation to the new shear wall W9. In addition to that, the footings F7 and F28 of columns C7 and C28, respectively, will be linked to the central beam footing F/B2 by enlarging the sizes of their current footings (F7N and F28N) as shown in Figure 13a. This treatment provides additional support to the new shear wall W7 and W8. In the second RS shown in Figure 13b, two r/c basement slabs of 1.0 m thickness each are examined to link the individual column footings with neighboring existing foundation beams. More specifically, one basement slab will enclose the individual footings F2-F9-F16-F23 with the beam footing F/B1 that supports the W1 and W2 wall, while a second basement slab will enclose the individual footings F7-F28 with the beam footing F/B2 that supports the W4/6 and W3/5.
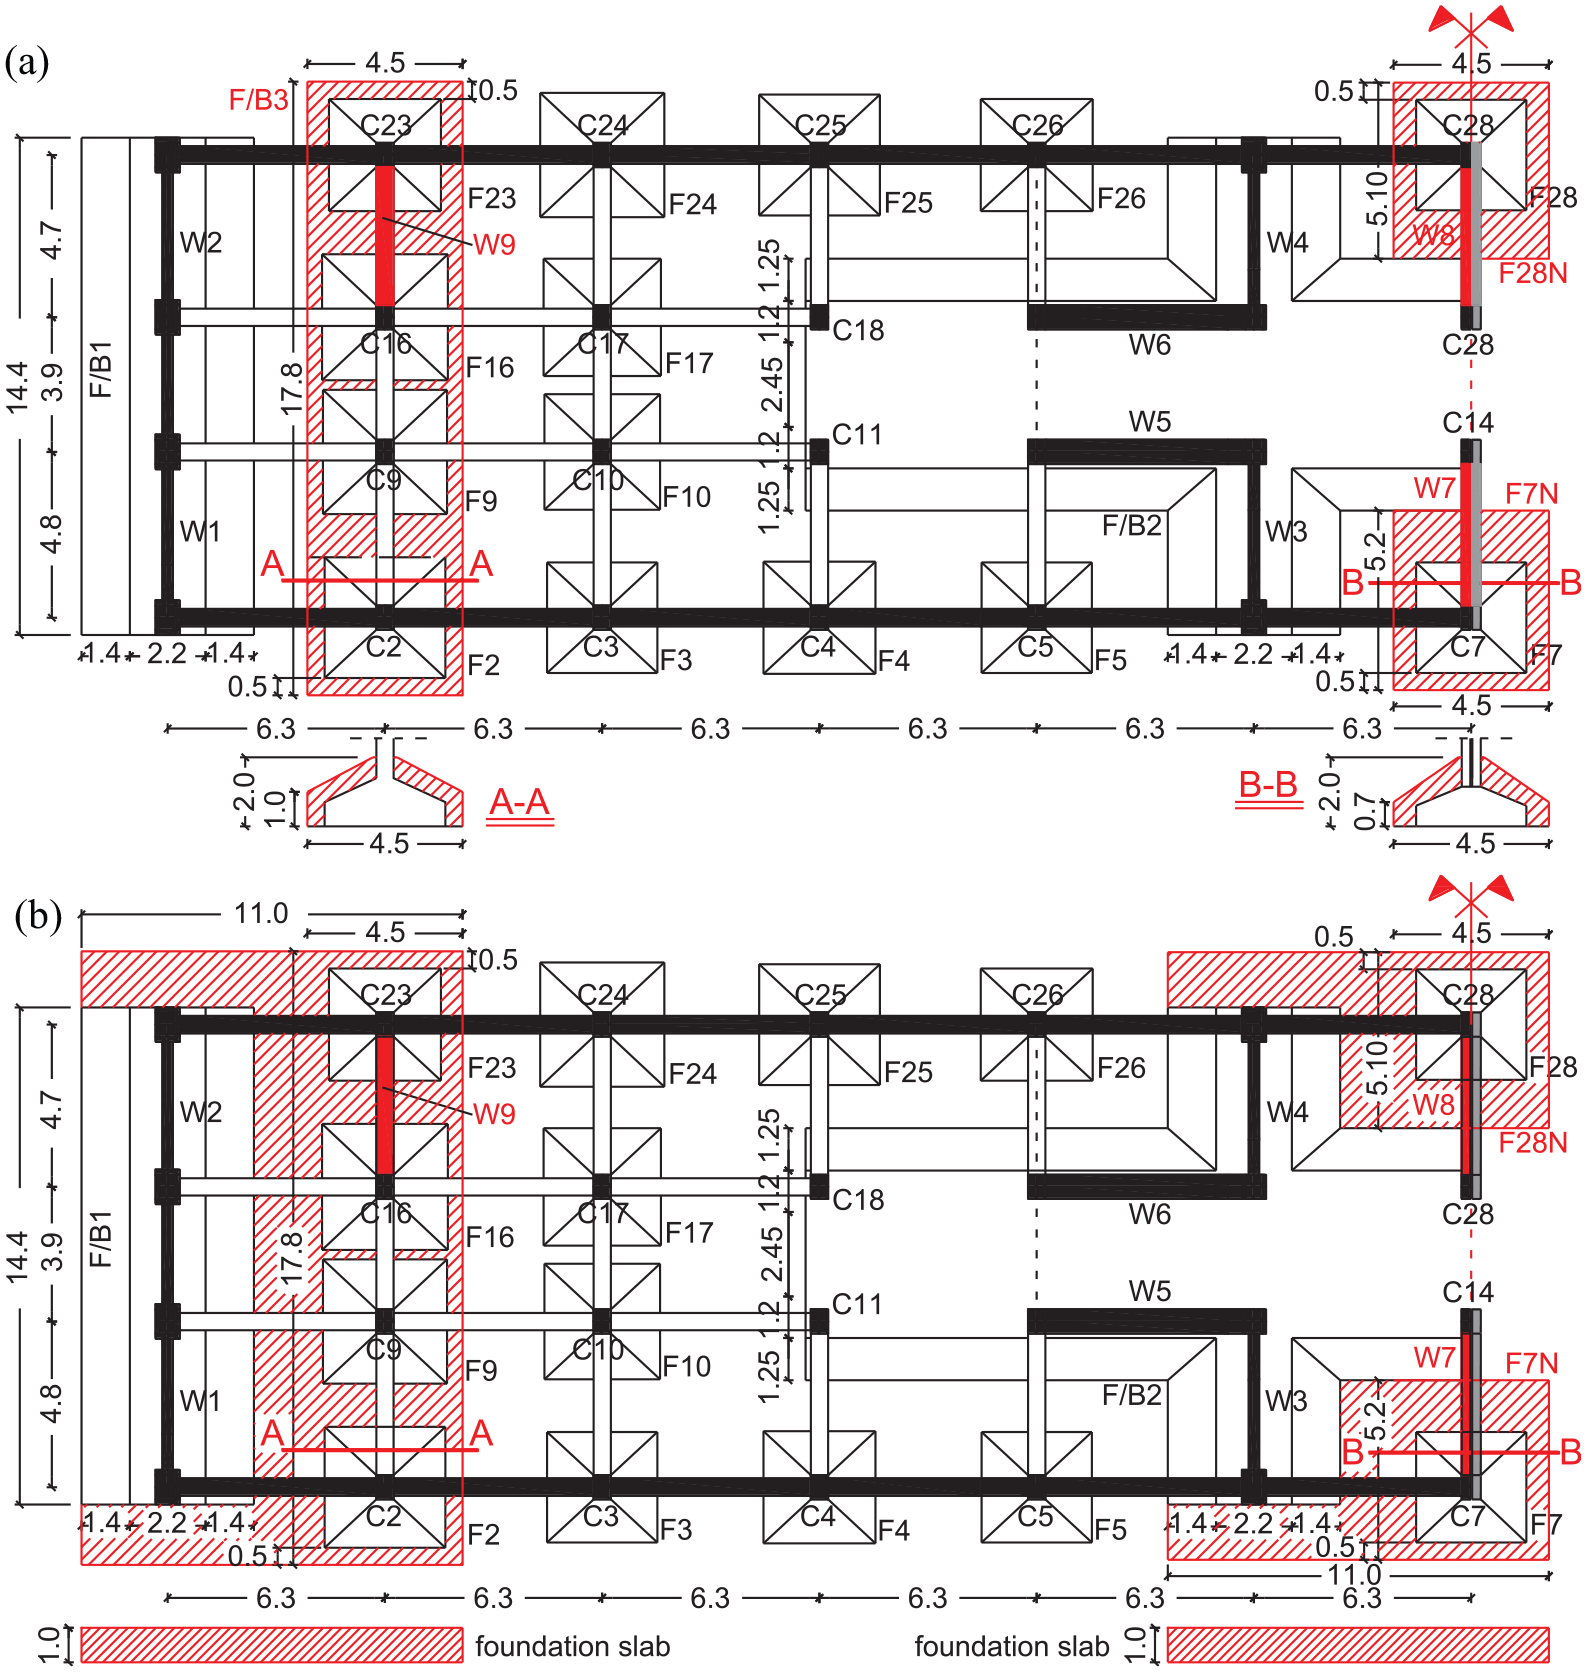
(a) The proposed retrofitting scheme and (b) the second retrofitting scheme for the foundation of the Building.
Figure 12b illustrates the stress distribution along the foundation members of the proposed RS for q = 1.7. Table 11 summarizes the maximum, minimum, and mean values of stress of soil stresses for the retrofitted building. Compared to the current foundation, the proposed retrofitting reduces the maximum stress from 540.4 kPa to 494.1 kPa for q factor 1.7. Moreover, it distributes more uniformly the stress along the foundation maintaining the stress below the critical limit for a larger area than the current foundation (Figure 12). A similar reduction on the peak values was observed for q factor 2.4 (from 452.1 kPa to 390.5 kPa). Because those peak values were observed mainly at the corners of the Building perimeter and considering that both the q = 1.7 and σu = 375 kPa are quite conservative values, the proposed retrofitting can be adopted with safety. To this end, it should be noted that an additional analysis was conducted in which the two nearly identical and statically independent structural parts separated by the thermal expansion joint in the transverse direction were both modeled (Figure 1a). The analysis results showed a further reduction of the maximum stress at the two new footings F7N and F28N shown in Figure 13a. The maximum stress was reduced from 494.1 kPa to 442.90 kPa.
Conclusion
This article evaluates analytically the seismic response of the “Administration building of Kalamata” based on the provisions of the Eurocodes and on the more detailed and strict Greek code for structural interventions known with the acronym of KAN.EPE. that fully complies with the philosophy of Performance based seismic design. On the basis of analysis results, the most suitable RSs for bringing the Building to current safety standards are developed. This was based on a number of alternative numerical possibilities that may be used as examples of applications of code requirements leading to the best approximations and hence to optimum solutions. The structure is a seven-floor r/c structure with a basement built in 1974, which has been retrofitted once in the past after experiencing slight damages during the Kalamata earthquake of 1986. The main characteristics and findings of this study are as follows:
Linear response spectrum analyses and nonlinear static pushover and dynamic analyses were used, not only to investigate a great number of possible solutions, but also to envelop the response due to uncertainties in the nonlinear modeling of the L-shaped major shear wall elements and foundation.
Difficulties were encountered for the reliable modeling and prediction of soil–structure interaction effects as it was difficult to resort to 3D finite element modeling of the surrounding soil layers. The latter became even more complicated due to the complex foundation, not all of which was at the same level, consisting of a combination of a grid of tie beams connecting column footings and a massive concrete block serving as the common foundation of the L-shaped wall elements.
Based on the nonlinear static pushover analyses of the existing building, the r/c shear walls fulfill the criterion of performance level immediate occupancy (IO) in almost all cases indicating that they respond elastically. Only exception is an L-shaped shear wall, which exceeds the criterion of performance level A(IO) and the criterion of performance level life-safety (LS). A relatively large number of beams also does not fulfill the criterion of performance level life-safety (LS) and collapse prevention (CP). The exceedance of the LS criterion in columns is insignificant (at most 2) as well as there is no column that exceeds the CP criterion.
Based on the dynamic analyses of the existing building, except for the beams and columns in the regions of the staircase and the thermal expansion joint, the majority of r/c members respond elastically, whereas the remaining members fulfill at least the demands of IO criterion. Central role in the Building response play the massive shear walls of the Building that respond almost elastically. The infill walls at the core of the Building are expected to be damaged heavily, particularly those of top floors.
The proposed retrofitting scheme introduces one shear wall in the supporting frame of staircase and two shear walls in the external frame at expansion joint. The r/c shear walls at expansion joint extend up to the fourth story. All columns of the frame as well as the beams connecting the new r/c shear walls (in the lower four stories) are strengthened using r/c jackets. A new foundation beam under the region of staircase and upgrade of the individual footings under the region of expansion joint are proposed to safely transfer the shear wall forces and distribute uniformly the soil stresses.
The ERSA appears to be the easiest and sufficient for retrofit design when it is performed utilizing a proper behavior factor associated with the corresponding performance objective. ERSA results are near to those obtained through the more sophisticated methods of pushover and dynamic nonlinear analyses demonstrating the efficiency of the former.
ERSA were conducted to evaluate the performance of the retrofitted building as indicated in KAN.EPE. The value of q = 1.7 was selected for evaluating the seismic response under the performance level B(LS), while the value of q = 2.4 for the performance level C(CP). For the former value, all shear walls behave elastically, the expected yielded beams are reduced to 32 from 94, and the expected yielded columns are reduced to 2 from 18.
By accepting damage in very few beams (considering them as secondary seismic members), which were modeled as hinged at their ends for verification purposes, the selected solution brings the Building up to current safety standards, meeting life protection as well as collapse prevention performance criteria.
Footnotes
Appendix 1
The foundation of the Building consists of rectangular footings interconnected through foundation tie beams, whereas the walls W1, W2, W3-5, W4-6 are founded on strong strip footings as indicated by the cut A-A, B-B, and C-C, respectively, as shown in Figure 14. Moreover, along the longitudinal dimension of the basement there is a r/c wall of thickness equal to 35 cm and height 4.8 m (including the height of footings) as indicated in cut E-E and D-D in Figure 14.
Figure 15 illustrates the interventions that are required for the implementation of the proposed scheme RS3 in the superstructure including details to the reinforcement, post-installed anchorage, and so on of the r/c column jackets and new r/c shear walls for all floor levels.
Appendix 2
Table 12 presents the three identified soil layers of the region at which the Building is founded along with their properties.
Tables 13 and 14 lists the total end sections of each member type (e.g. column, beam, and shear wall) of the Building that meet the criteria of the target performance level against the number of all end sections of the corresponding member type (i.e. in total 252 end sections for columns, 390 end sections for beams, 56 end sections for shear walls) for the 32 pushover analyses considered.
Acknowledgements
The cooperation of the head of Technical Services in Prefecture of Messinia, Mr P. Giannakeas is gratefully acknowledged. The authors are also grateful to Dr Christos Karakostas and Dr Thomas Salonikios of the Earthquake Planning and Protection Organization - Institute of Engineering Seismology and Earthquake Engineering (EPPO-ITSAK); Dr Triantafillos Makarios of Department of Civil Engineering, Aristotle University of Thessaloniki; Dr George Papagianopoulos and Dr Dimitrios Baros of Department of Civil Engineering, University of Patras, for their valuable assistance.
Declaration of conflicting interests
The author(s) declared no potential conflicts of interest with respect to the research, authorship, and/or publication of this article.
Funding
The author(s) disclosed receipt of the following financial support for the research, authorship, and/or publication of this article: This study was funded by the prefecture of Messinia in Greece and was carried out under the guidance and supervision of the last author.