
Abstract
Current dynamic graph anomaly detection models learn multibehavior patterns for abnormal edges poorly and rely too much on the differences in long-term snapshots. Aiming at the above problems, combine dual behavior contrast dynamic graph anomaly detection model is proposed. Firstly, a dual behavior learning module is designed, where the role-based behavior learning submodule constructs graphlet degree vector by identifying four self-isomorphic orbits to capture deep structural features, while the attribute-based behavior learning submodule obtains attribute vectors through graph convolutional network. Then, the results are combined in the dynamic edge representation module to form the dynamic representations of edges to capture dual behavior patterns. Lastly, the anomaly detection module is designed to detect newly generated edges by combining contrastive learning with gated recurrent unit. We conduct experiments from four perspectives: anomaly detection accuracy, parameter sensitivity, robustness of module variants, and model runtime efficiency. The results demonstrate that the model achieves a peak accuracy of 92.05% in the task of dynamic edge anomaly detection.
Introduction
Graph anomaly detection is widely used in many domains, including finance, news, and social networks (Xu et al., 2018). From the perspective of graph composition, dynamic graph anomaly detection can be categorized into abnormal node detection, abnormal edge detection, abnormal subgraph detection, and abnormal graph detection. Most research focuses on abnormal node detection but overlooks the importance of abnormal edge detection, such as messages exchanged between users in social networks, which include information such as the timestamp and content of the messages, the information is modeled as dynamic edges, carrying significant semantic features within dynamic graphs. Therefore, we aim to detect abnormal edges in dynamic graphs.
In the task of dynamic abnormal edge detection, methods based on graph neural networks (GNNs) have demonstrated superior performance. Early dynamic graph anomaly detection methods (e.g., Ji et al., 2013; Ranshous et al., 2016) perform anomaly detection by defining specific anomaly patterns for structure changes. However, such methods rely too much on predefined anomaly patterns and only apply to specific data types. To solve this problem, feature extraction-based methods become mainstream, which is divided into graph embedding methods and spatiotemporal feature-based methods. Graph embedding methods continuously update the node embedding by traversal methods such as random walking, depth-first search (DFS), and breadth-first search (BFS; e.g., Grover & Leskovec, 2016; Perozzi et al., 2014; Von Luxburg, 2007; Yu et al., 2018). Although this type of method can be applied to various types of data, they do not adequately capture the neighborhood features in the graph, leading to suboptimal performance. Additionally, spatiotemporal feature-based methods, while capturing features from both spatial and temporal dimensions, overlook the role patterns of dynamic edges, which presents certain limitations (e.g., Cai et al., 2021; Yang et al., 2023; Zheng et al., 2019). Recently, reconstruction-based methods (e.g., Gao et al., 2022; Liu et al., 2021) have achieve superior performance.
However, existing research still has some problems. Firstly, since abnormal edges in the network will be camouflaged by establishing connections with normal entities, and the feature extraction-based methods usually use one-hop neighbor information of the node as input, the deep structural features of nodes are ignored. As shown in Figure 1(a), an abnormal edge between the nodes
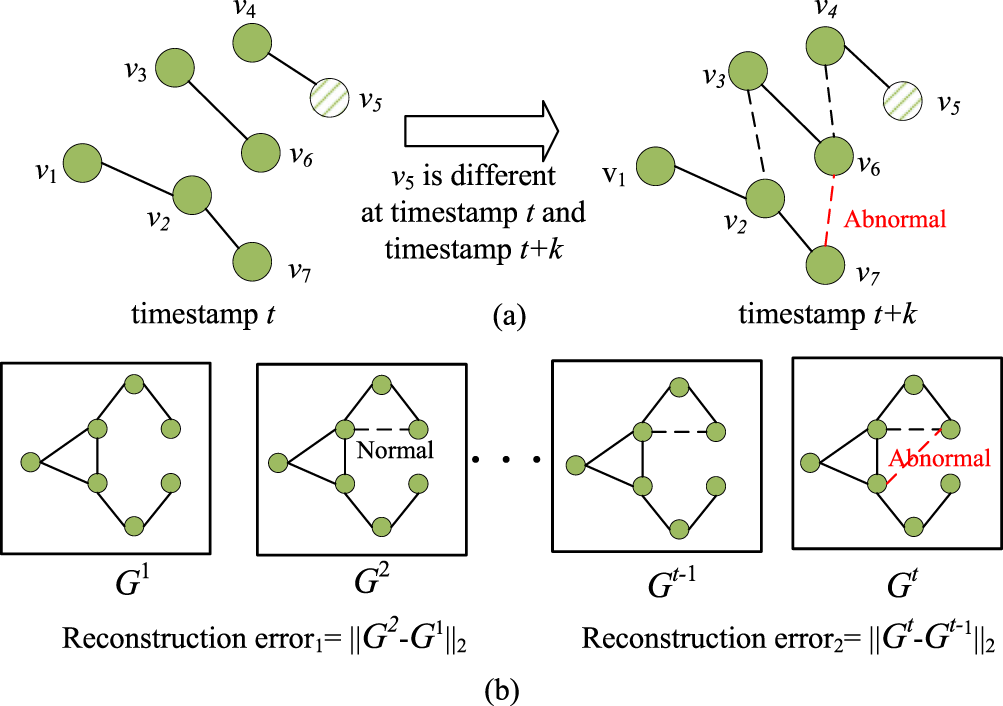
Two challenges of existing methods: (a) the one-hop neighbors are insufficient to represent the impact of the newly added edges and (b) using only reconstruction error as the anomaly score is too one-sided.
Secondly, reconstruction-based methods usually take the reconstruction errors of long-term snapshots as anomaly scores, which only focus on the graph structure changes between snapshots instead of distinguishing normal and abnormal edges. As shown in Figure 1(b), a normal edge is added from
To address the first challenge, the key is to capture the deep features of nodes. Inspired by the Orbit Counting Algorithm (ORCA; Hočevar & Demšar, 2014), small-induced subgraphs called graphlets are emerging as a possible tool for exploring the global and local structure of networks and analyzing the roles of individual nodes. We consider that the behavior patterns of the roles constituted by the graphlet degree vector (GDV) of the nodes can provide a more comprehensive view of abnormal edge detection. To address the second challenge, it is necessary to increase the difference between normal and abnormal edges, and contrastive learning (Zhu et al., 2021) is adopted to learn representations by contrasting positive samples against negative ones for anomaly detection. Based on these, a combine dual behavior contrast dynamic graph anomaly detection model (CDBC-DGADM) is proposed to realize edge anomaly detection. The main contributions of the paper can be summarized as follows:
An anomaly detection model CDBC-DGADM for dynamic graphs is proposed, in which, a dual behavior learning module (DBLM) is designed to capture the features of edges fully, and an anomaly detection module (ADM) is designed to amplify the differences between normal and abnormal edges by contrastive learning. In DBLM, the role-based behavior patterns are captured by GDV, and the attribute-based behavior patterns are obtained through a graph convolutional network (GCN). Through extensive experiments on multiple real-world datasets, the effectiveness of CDBC-DGADM is shown on all evaluated datasets.
The rest of this paper is organized as follows: Section 2 introduces the related works; Section 3 presents the architecture and the details of CDBC- DGADM; Section 4 shows the experimental results; and Section 5 concludes the paper and discusses future works.
Methods of existing dynamic graph anomaly detection are mainly categorized into traditional graph analysis methods, feature extraction-based, and reconstruction-based methods.
Traditional Graph Analysis Methods
Traditional graph analysis methods usually define specific graph anomaly patterns (Ji et al., 2013; Ranshous et al., 2016). For example, Count-Min-Sketch (Ranshous et al., 2016) leverages the Count-Min sketch, a probabilistic data structure, to approximate global and local structural features of the graph, and IcLEOD (Ji et al., 2013) constructing a local substructure named Corenet for each node and detecting local evolutionary outliers by comparing these substructures between different snapshots. However, such methods rely too much on their predefined anomaly patterns and are suitable only to some specific data types.
Feature Extraction-Based Methods
To increase the scalability of detection methods and fully capture the features of dynamic graphs, feature extraction-based methods become mainstream, which can be divided into graph embedding methods and spatiotemporal feature-based methods. Graph embedding methods (Grover & Leskovec, 2016; Perozzi et al., 2014; Von Luxburg, 2007; Yu et al., 2018) capture the features of dynamic graphs by traversal methods such as random walking, DFS, and BFS firstly, then combine with classification or clustering algorithm for edge anomaly detection. However, such methods focus on structural relationships learning while neglecting temporal relationships learning, so spatiotemporal feature-based methods (Cai et al., 2021; Yang et al., 2023; Zheng et al., 2019) gradually gain attention, which captures the spatial features by GNN and the temporal features through recurrent neural network (RNN).
Reconstruction-Based Methods
The reconstruction-based method uses an autoencoder-like framework combined with GNN to learn and update node embeddings, and compute anomaly scores from reconstruction errors, for example, Transformer-based Anomaly Detection framework for DYnamic graphs (TADDY; Liu et al., 2021) and Combine Dual Behavior Contrast Dynamic Graph Anomaly Detection Model (CDBC-DGADM) (Gao et al., 2022). In recent years, contrastive learning has shown superior performance in the field of anomaly detection tasks for its ability to strength differences. For example, AddGraph (Zheng et al., 2019) widens the gap between the normal and the abnormal edges by constructing positive and negative samples, where the negative edges are based on the Bernoulli distribution.
However, according to the analysis in the Introduction section, existing methods still have the problems of lacking global views and ignoring edge differences. Therefore, CDBC-DGADM is designed to address these problems.
Methodology
Problem Definition
A dynamic graph consisting of T snapshots can be represented as
The research objective is to design the anomaly scoring function
For ease of understanding, the mathematical symbols used in this paper are summarized in Table 1.
Commonly Used Mathematical Symbols With Explanations.
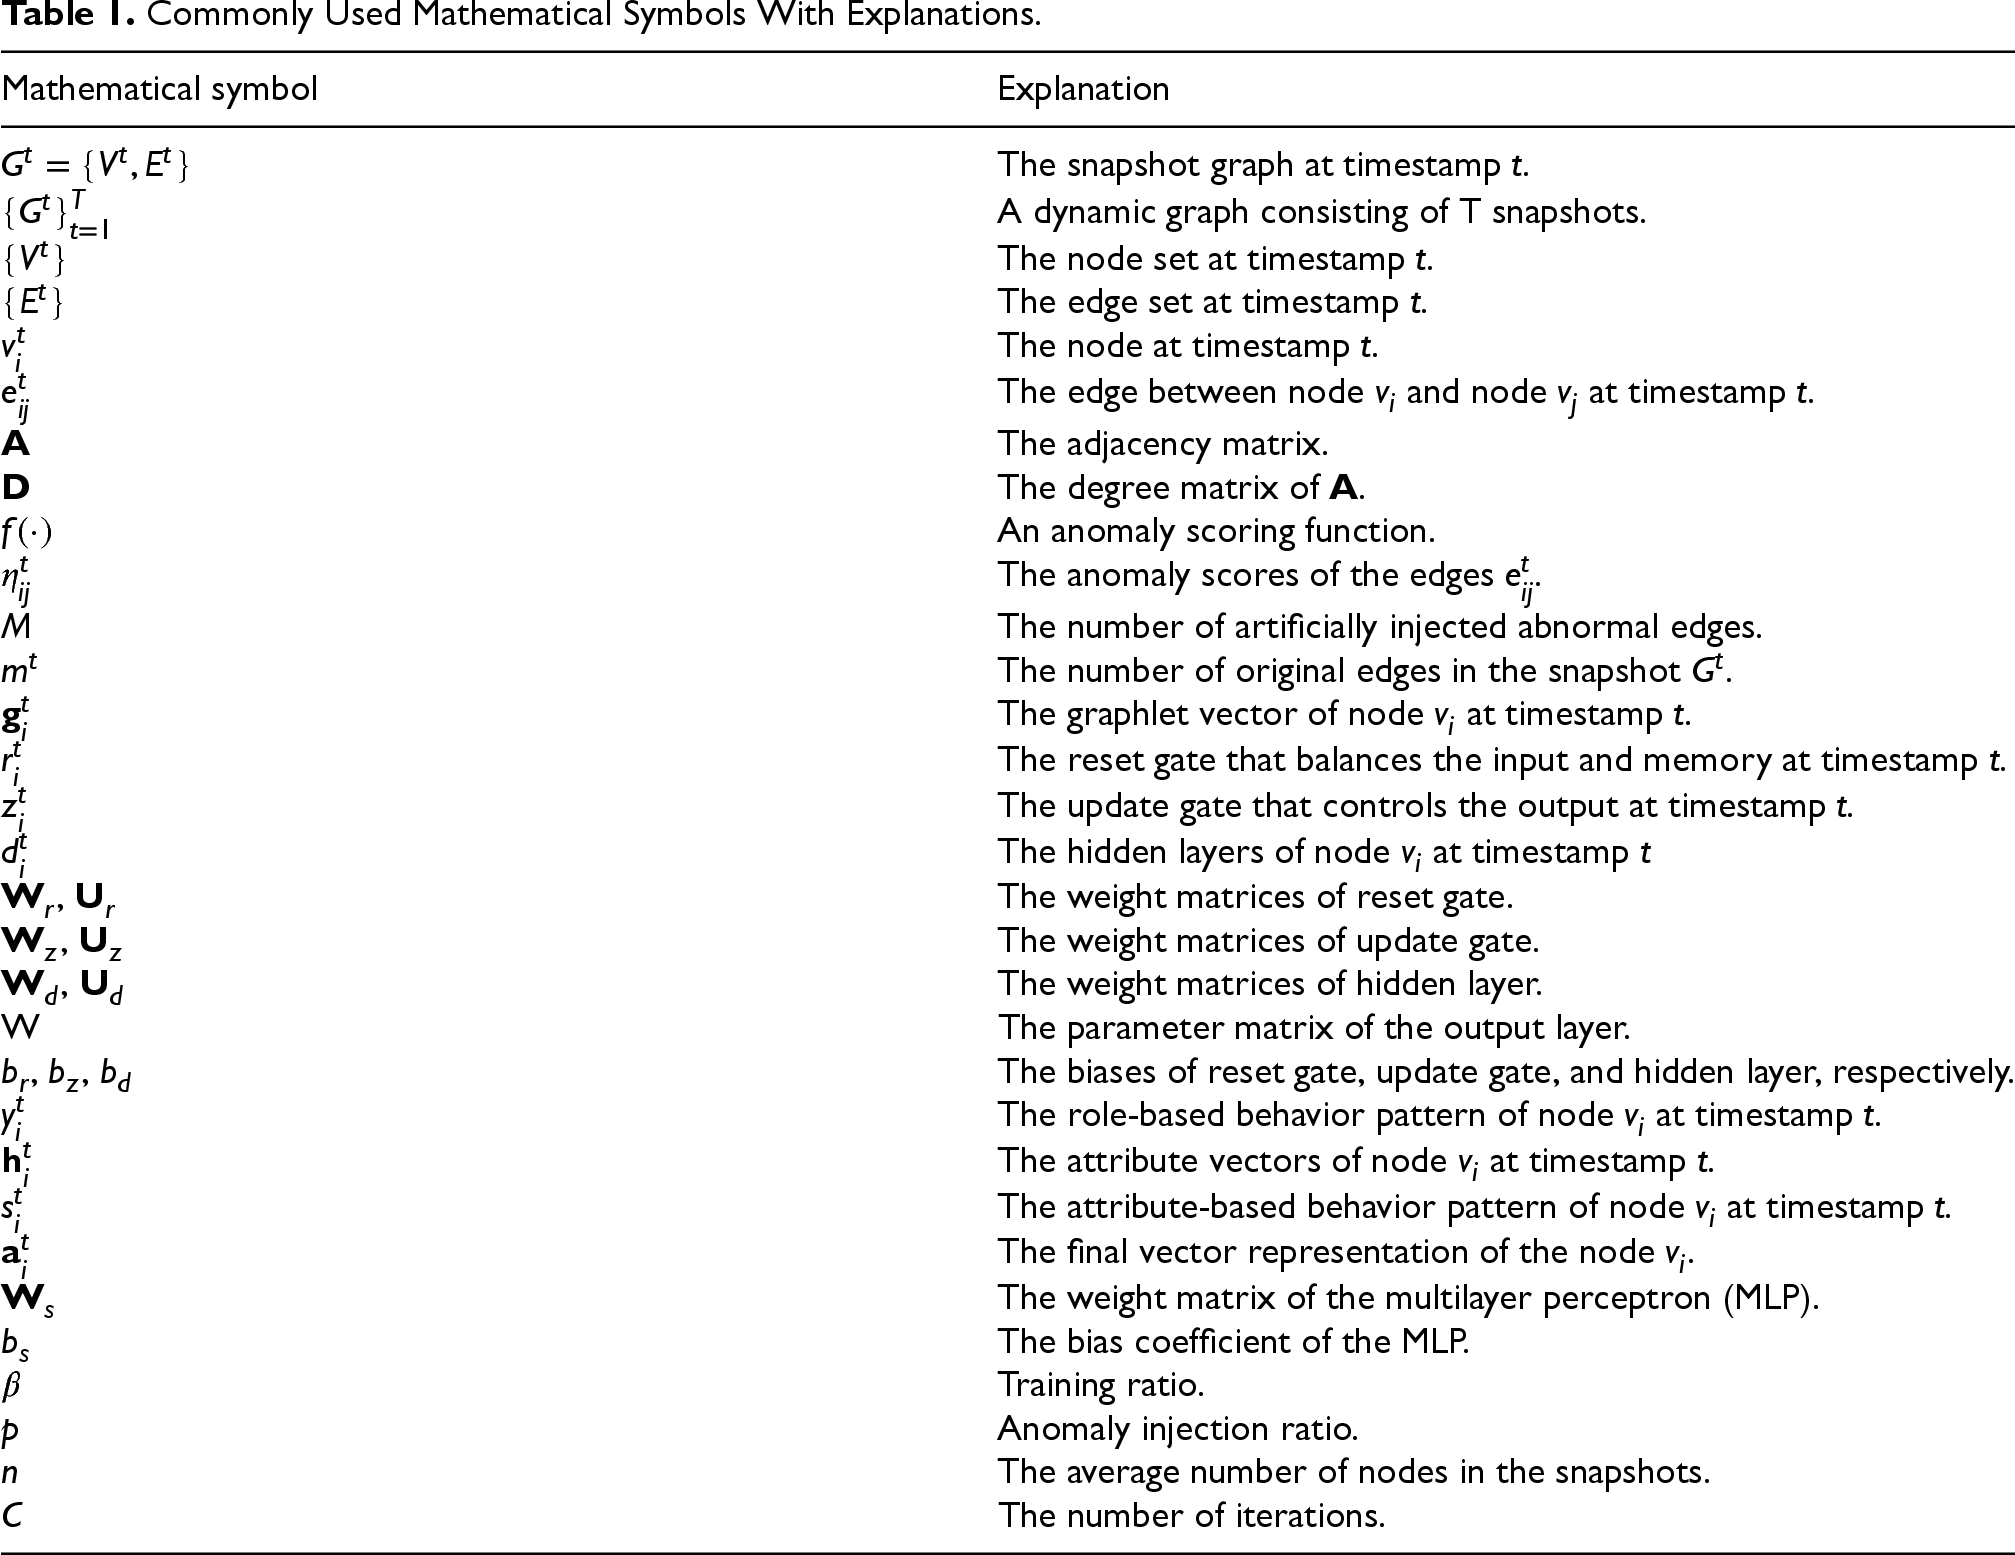
Commonly Used Mathematical Symbols With Explanations.
The framework of the CDBC-DGADM is shown in Figure 2.

The overall framework of combine dual behavior contrast dynamic graph anomaly detection model (CDBC-DGADM).
The model consists of five modules: (1) input module, (2) DBLM, (3) dynamic edge representation module (DERM), (4) ADM, and (5) output module. Among them, the DBLM can be further divided into two submodules: role-based behavior pattern learning submodule (RBPLS) and attribute-based behavior pattern learning submodule. Firstly, the input module includes a dynamic graph consisting of T snapshots. Secondly, dynamic role-based behavior patterns and attribute-based patterns of the edges are learned by DBLM and combined to form the dynamic edge representations in DERM. At last, newly generated edges are used as negative samples to calculate the anomaly score of the target edges by contrastive learning. The detailed descriptions of the modules are as follows.
In the input module, the dynamic graph consisting of consecutive snapshots
Dual Behavior Learning Module (DBLM)
This module is used to learn about role-based behavior patterns and attribute-based behavior patterns in dynamic graphs. When capturing spatiotemporal features in dynamic graphs, existing methods typically extract spatial features from neighbors in a single snapshot while capturing temporal features from consecutive snapshots (Ranshous et al., 2015; Wang et al., 2019). However, these methods only learn simple features and do not consider the complex behavior patterns of dynamic graphs. To effectively detect abnormal edges in dynamic graphs, this module learns dual behavior patterns.
Role-Based Behavior Patterns Learning Submodule
This submodule learns the role-based behavior patterns by constructing GDV to obtain a global view. Compared to the shallow structural features used in traditional methods, the GDV can capture richer and more complex local structural information, providing more context-aware and multiscale structural features of nodes. Therefore, we construct the GDV and use it as the role vector for the nodes.
Specifically, a GDV is a nonisomorphic subgraph of a graph, which is widely used to determine the role of a node in a network (Sarajlić et al., 2016; Yaveroğlu et al., 2014). This module uses the ORCA (Hočevar & Demšar, 2014) for GDV sampling. In Figure 3, four self-isomorphic orbits are included in three different subgraphs, labeled as 0, 1, 2, and 3 in turn, and the number of nodes participating in each of the four orbits is calculated separately. For example, the GDV of node
Based on the above properties of the graphlet, the research captures dynamic role-based behavior patterns. Firstly, the GDV of node 


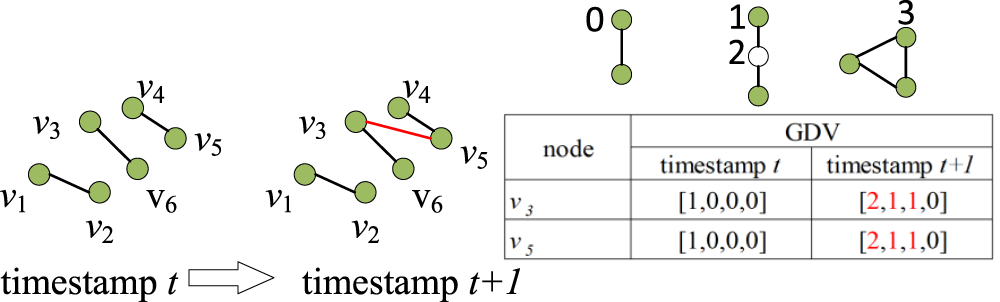
Graphlet degree vector (GDV) sampling.
The output
The submodule learns the attribute-based behavior patterns of nodes. First, node embedding is performed by some graph embedding methods (e.g., GCN and graph autoencoder), and we choose GCN to model the input graph in this subsection. Specifically, taking node 
Then follow the same steps as the RBPLS: use the attribute vector
Finally, the final vector embedding 
This module is used to generate the dynamic representation of the target edge. The specific operation involves concatenating the representations 
This module is designed to get an anomaly score of the target edge. The commonly used reconstruction-based methods (Gao et al., 2022; Liu et al., 2021) calculate the reconstruction error between different snapshots as the anomaly score, which cannot effectively distinguish normal edges from abnormal edges. To solve this problem, contrastive learning is used in this module. As shown in Figure 4, the edges present in the graph are regarded as positive examples, and the edges constructed by the abnormal edge injection strategy (Yu et al., 2018) are regarded as negative examples.
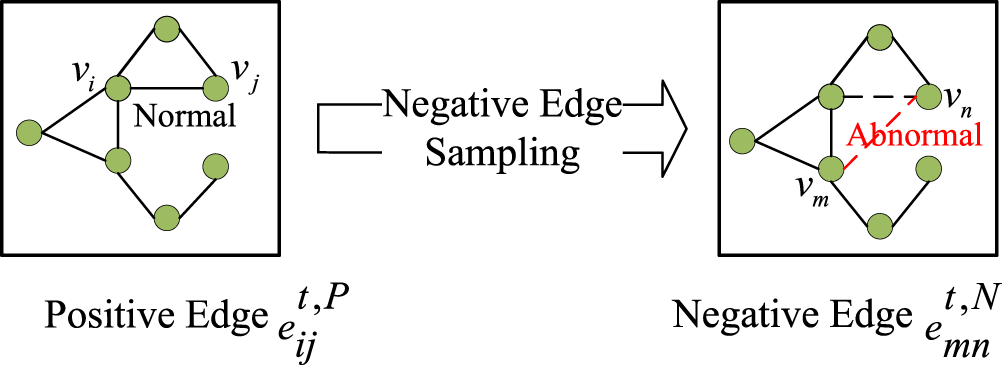
Positive and negative edge sampling.
Then, 
Finally, this module uses a binary cross-entropy (BCE) loss function to detect abnormal edge, which is represented as follows:

The larger the anomaly score of an edge is, the more likely it is to be an abnormal edge. Finally, all anomaly scores of edges are sorted in descending order, and the first M edges are considered abnormal edges.
The detailed algorithm for the model training is shown in Algorithm 1. In particular, the value of
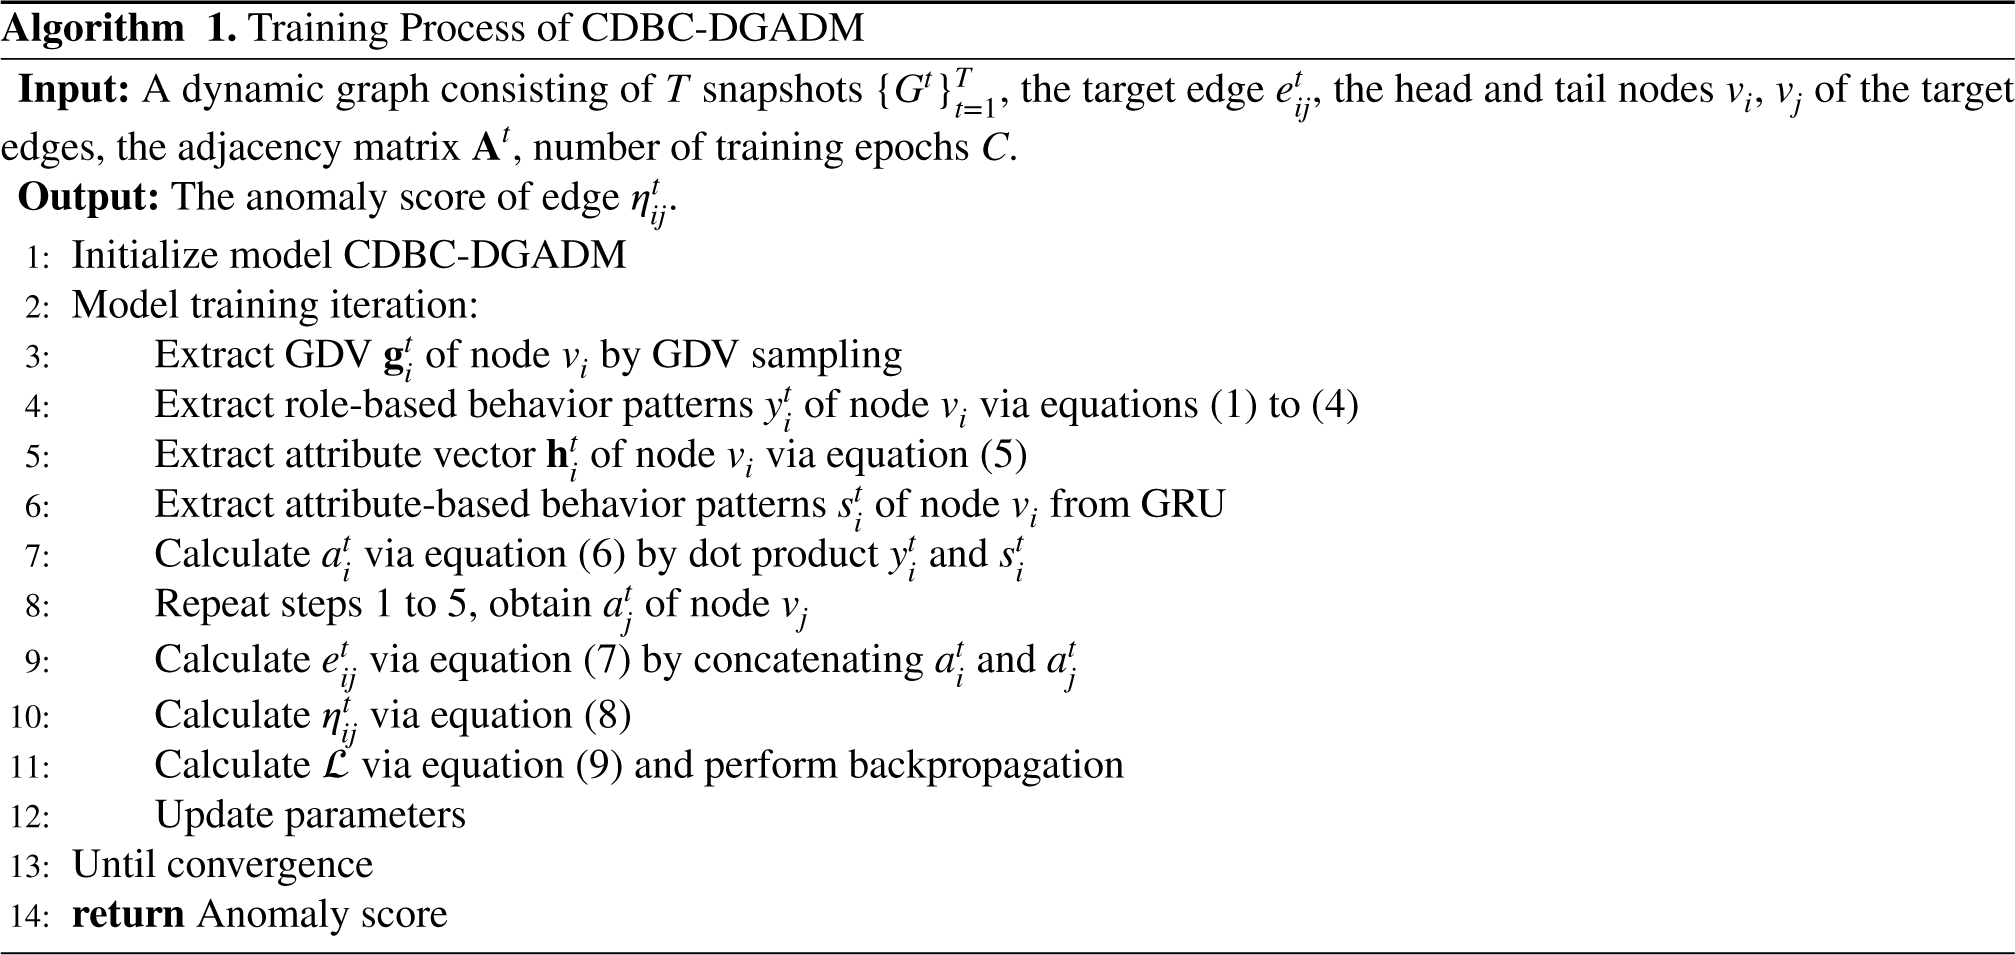
The time complexity of the model is analyzed by considering each significant component of the CDBC-DGADM separately. First, for the DERM, the time complexity is
Experiments
The effectiveness and efficiency of the model are demonstrated by conducting experiments on four publicly available datasets and analyzing the results in detail. In the experimental part, the model is evaluated by analyzing the following four questions.
Does CDBC-DGADM have better performance compared to existing models? Does the key parameters affect the efficiency of the model? How do the role-based behavior patterns and attribute-based behavior patterns in CDBC-DGADM affect the detection results, respectively? How is the computational cost of CDBC-DGADM?
Datasets
To evaluate the performance of the proposed model, four real-world dynamic graph datasets are used, listed in Table 2.
Datasets.
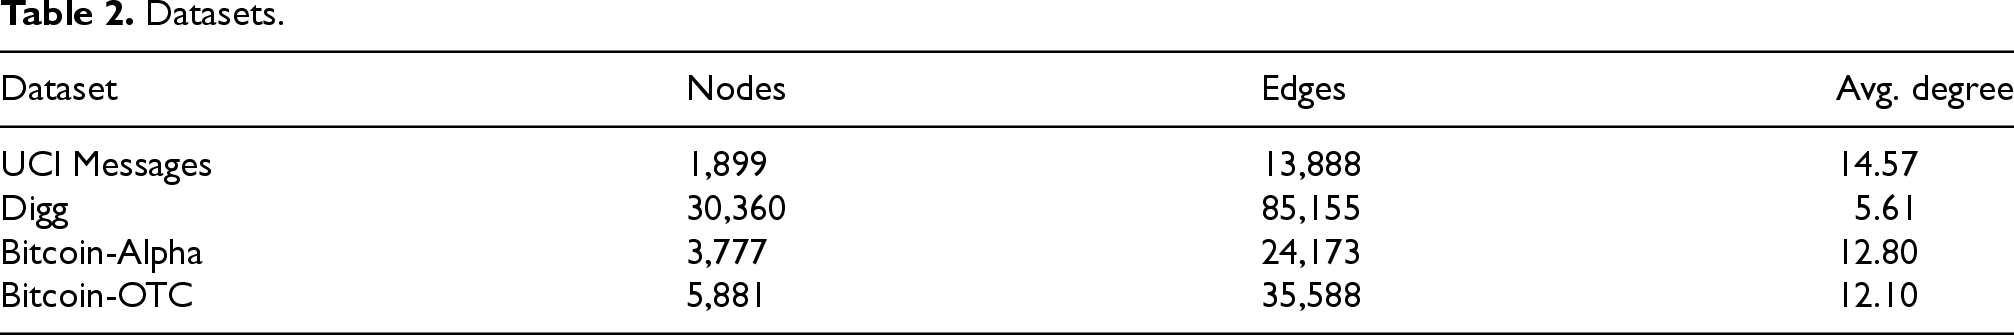
Datasets.
Firstly, in the preprocessing stage, based on the references (Yu et al., 2018; Zheng et al., 2019), duplicate edges are removed because edges with the same timestamp belong to the same snapshot.
Secondly, when choosing anomaly generation strategies for self-supervised anomaly injection, it is important to ensure that the injected anomalies are as similar as possible to real anomalies, otherwise, the results of model training and evaluation may not accurately reflect the performance in real datasets. Therefore, the type and number of injected anomalies, as well as the way of injecting anomalies, need to be carefully selected. To this end, the same anomaly generation method is used as in the reference Yu et al. (2018), for the snapshots
To further test the detection performance of the models proposed in this article, the following seven classical dynamic graph anomaly detection models are selected as benchmarks for experimental comparison:
Evaluation Metrics
Receiver operating characteristic-area under the curve (AUC; (Fawcett, 2005)) is used as an evaluation metric to measure the model’s performance. The closer the AUC is to 1, the better the performance of the method.
Experimental Settings
In the experiments, Pytorch implements the models. The experiments run on a Windows server with Intel Core i5-9300 CPU@2.90GHz and GeForce 1650.
The dimension of the GDV is set to 4, the learning rate of the Adam optimizer is set to 0.001, and the number of training rounds is set to 100 for the UCI Messages, Bitcoin-Alpha, and Bitcoin-OTC, 200 for Digg. The dimension of the hidden layer of GRU is set to 128. The snapshot size is set to 1,000 for the Bitcoin-OTC and UCI Messages, 2,000 for Bitcoin-Alpha, and 6,000 for Digg. The training ratio
Performance Comparison
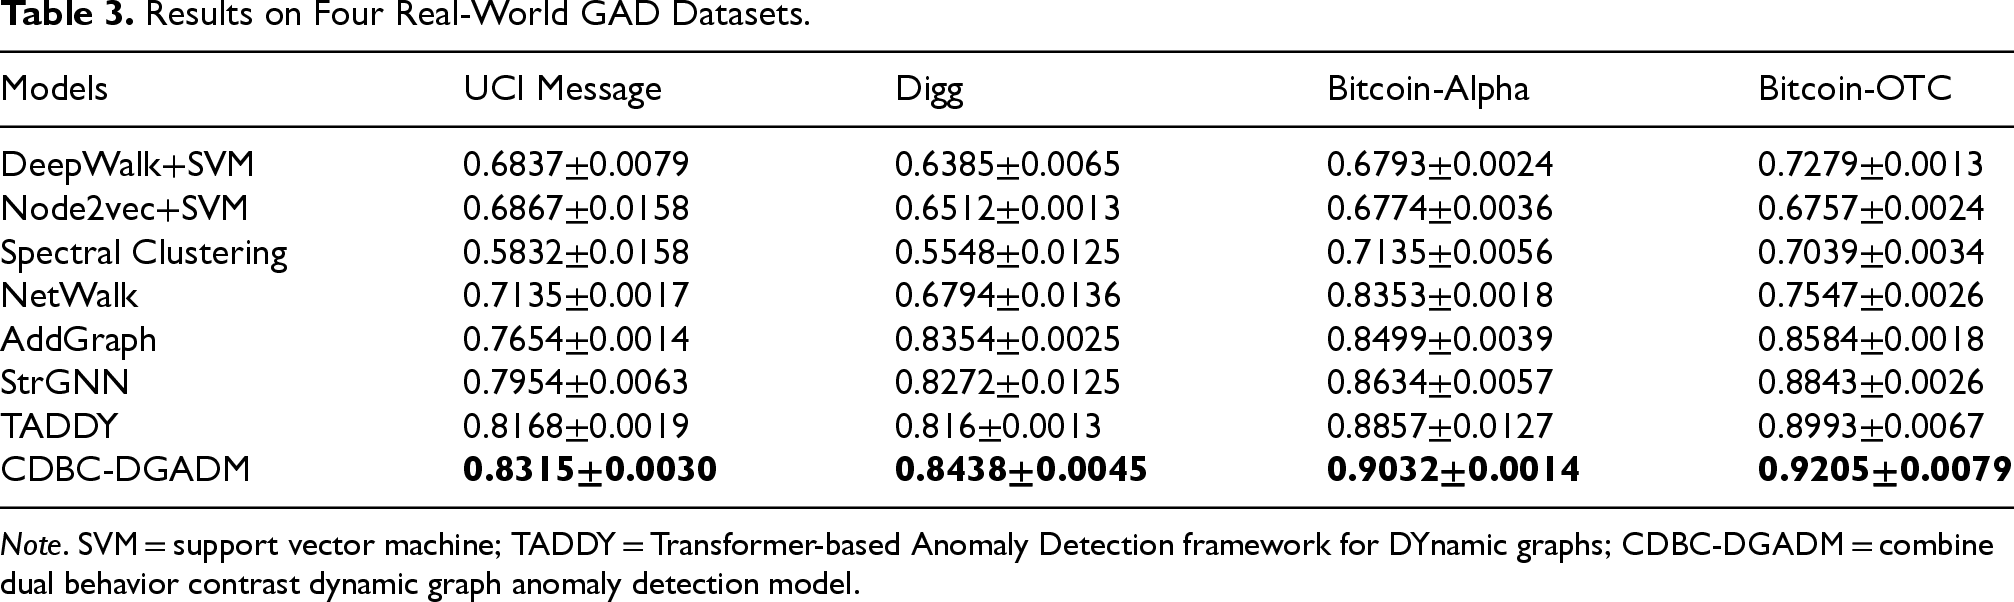
In response to RQ1, CDBC-DGADM is compared with baselines. The experimental results are summarized in Table 3, where bold indicates the optimal performance.
Results on Four Real-World GAD Datasets.
Results on Four Real-World GAD Datasets.
Note. SVM = support vector machine; TADDY = Transformer-based Anomaly Detection framework for DYnamic graphs; CDBC-DGADM = combine dual behavior contrast dynamic graph anomaly detection model.
From Table 3, it can be seen that CDBC-DGADM exhibits the best detection performance on all datasets.
Through the observation and analysis of the experimental results, the following conclusions can be obtained:
DeepWalk+SVM, Node2vec+SVM, Spectral Clustering, and NetWalk use graph embedding to learn and update the dynamic representation of nodes, which do not make full use of the node neighborhood information, and thus lead to poor results. The spatiotemporal feature-based methods such as AddGraph and StrGNN learn the behavior evolution pattern in continuous snapshots, which fully use the temporal information in the dynamic graph. The reconstruction-based method TADDY performs well because the majority of abnormal edges are indeed those that are difficult to reconstruct. However, it achieves suboptimal performance because it ignores the role-based behavior patterns of the edges. CDBC-DGADM has the highest detection accuracy because it fully learns rich role and attribute features, meanwhile, it can detect newly generated abnormal edges more efficiently by contrastive learning.
In response to RQ2, sets of parameter experiments on
Training Ratio
In our experiments, we analyze the performance of the CDBC-DGADM framework using training data with different training ratios. In Figure 5,
AUC of CDBC-DGADM on four datasets with different training ratio. Note. AUC = area under the curve; CDBC-DGADM = combine dual behavior contrast dynamic graph anomaly detection model.
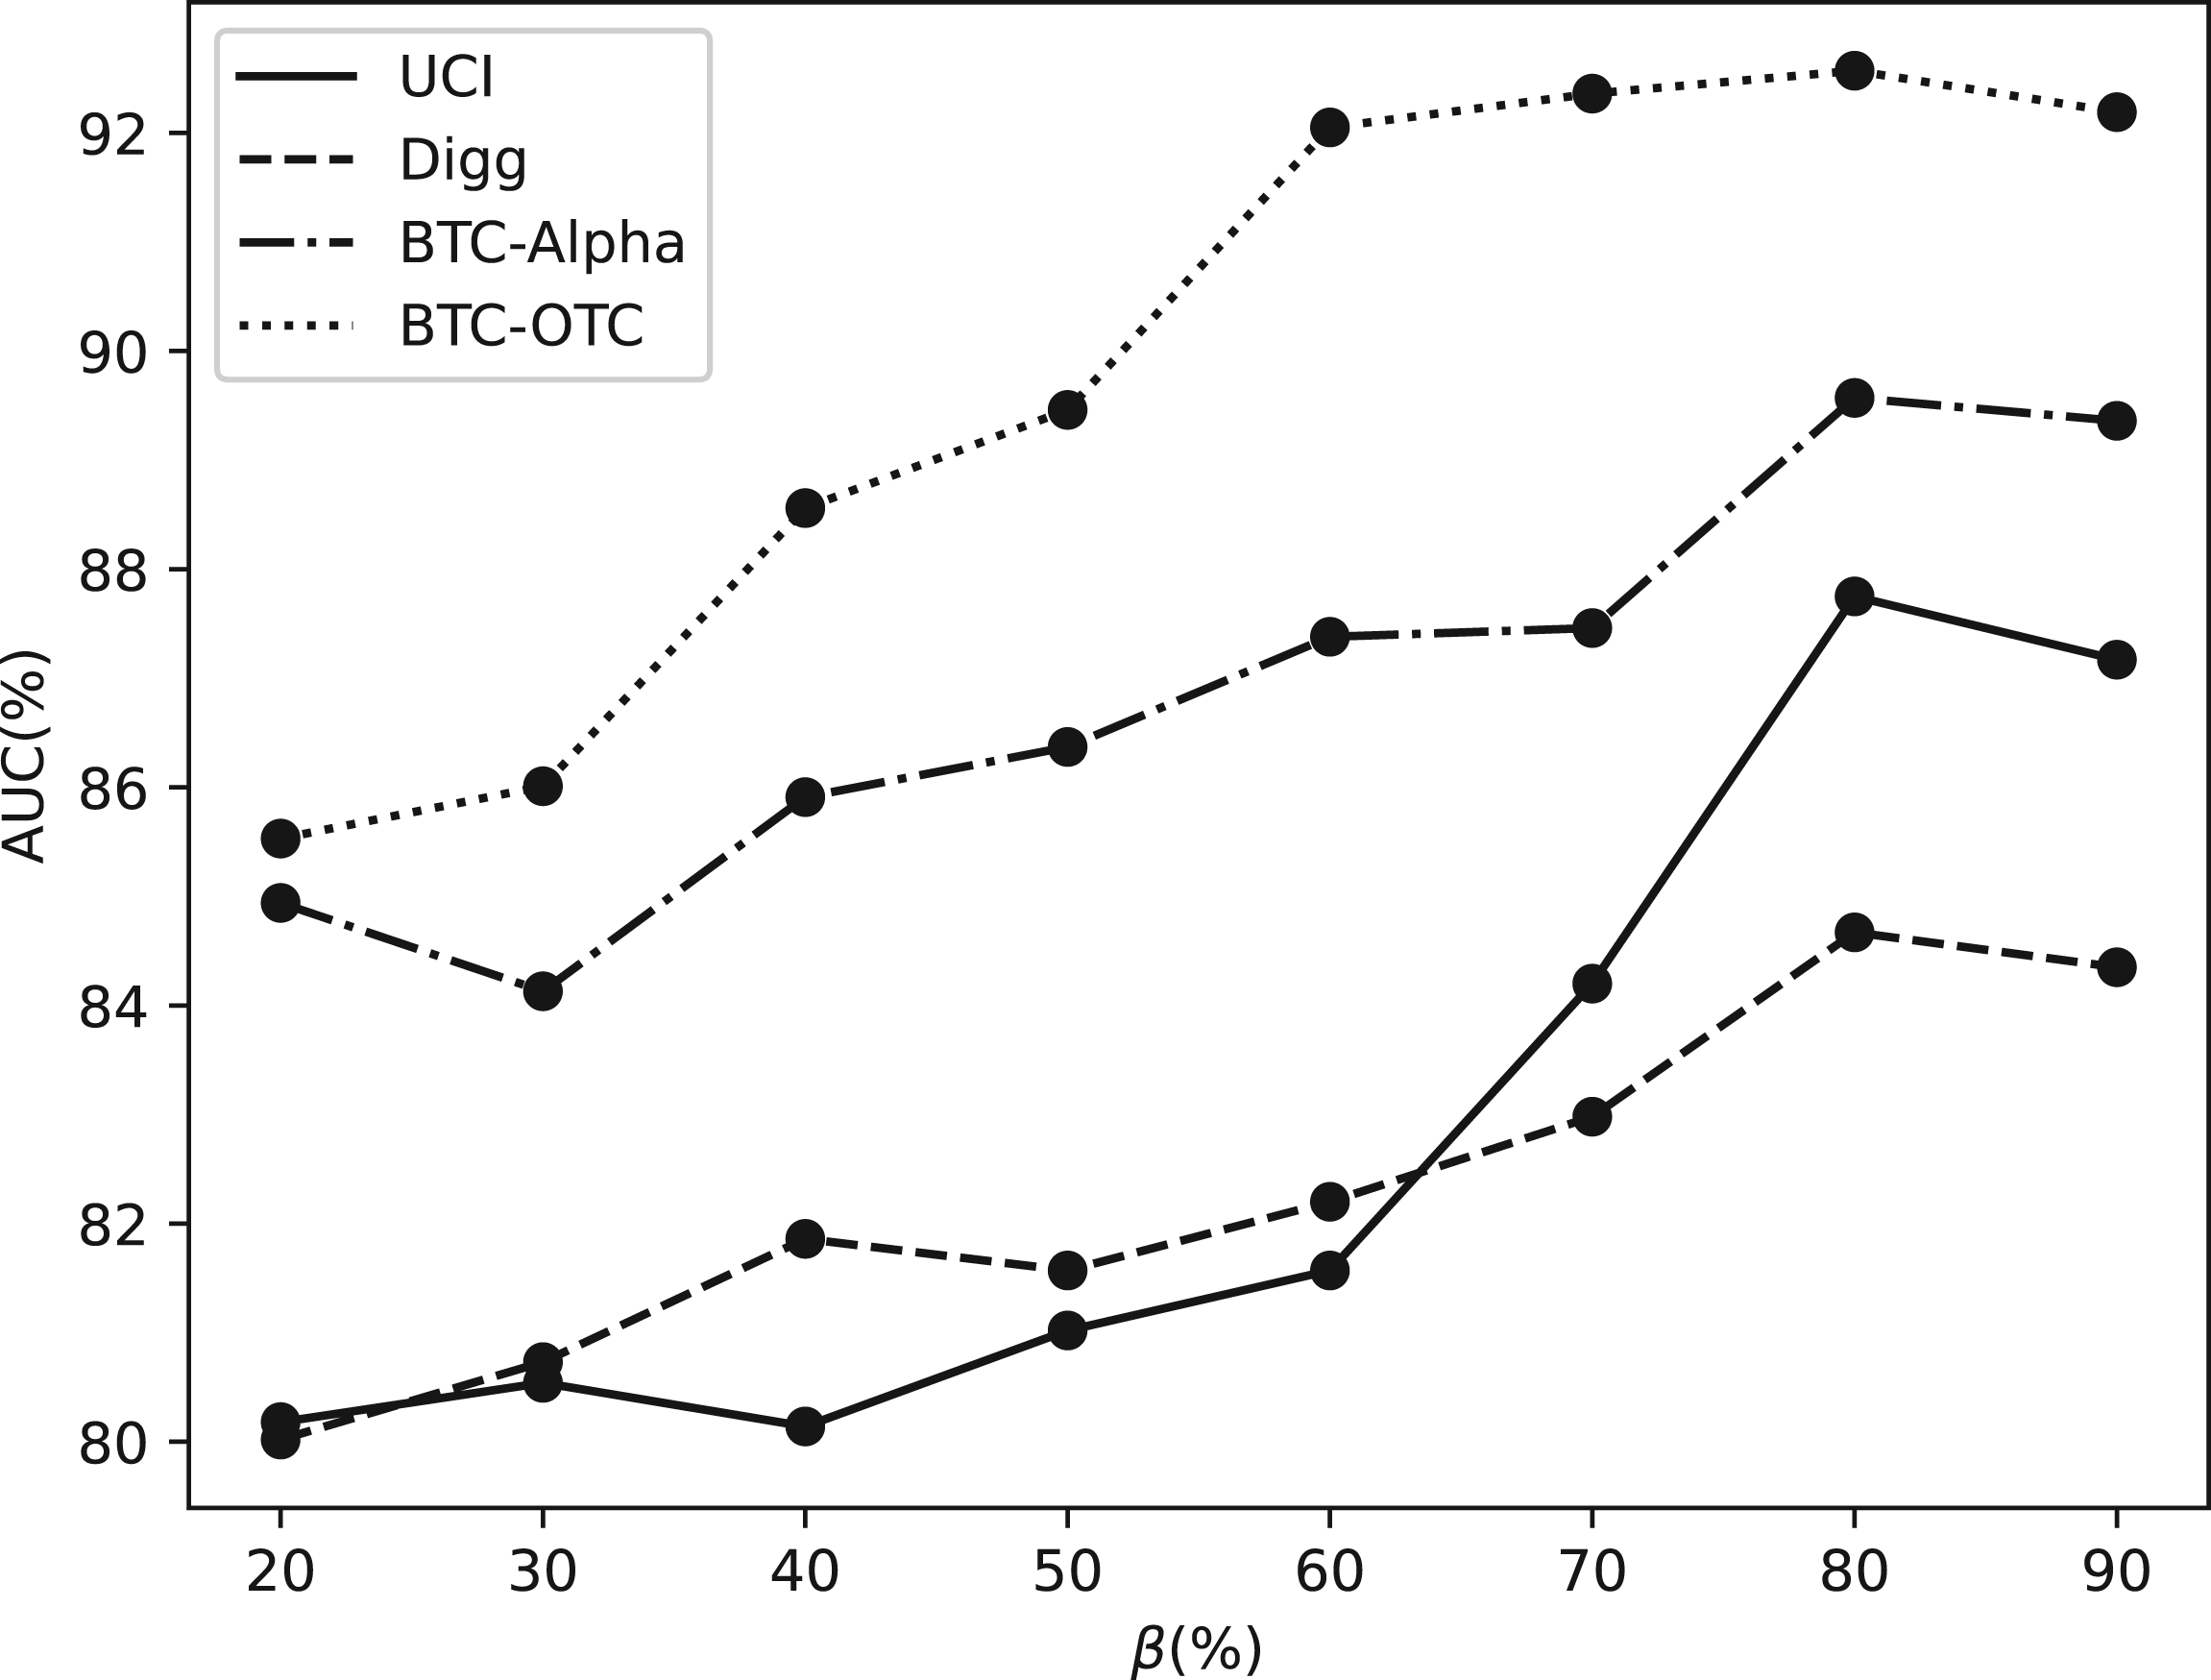
As shown in Figure 6, Data imbalance. In the graph anomaly detection task, the number of abnormal edges is much less than the number of normal edges, so injecting too many abnormal edges could lead to a decline in model performance. Noise increasing. Injecting a large amount of abnormal edges may increase the noise in the dataset. The noise data may not correspond to the actual abnormality, thus making it more difficult for the algorithm to distinguish the real abnormal edge from the noise data.
Therefore, we can also find that even if the anomaly injection ratio is (50%), the model still has a competitive performance, which proves the effectiveness of our framework.
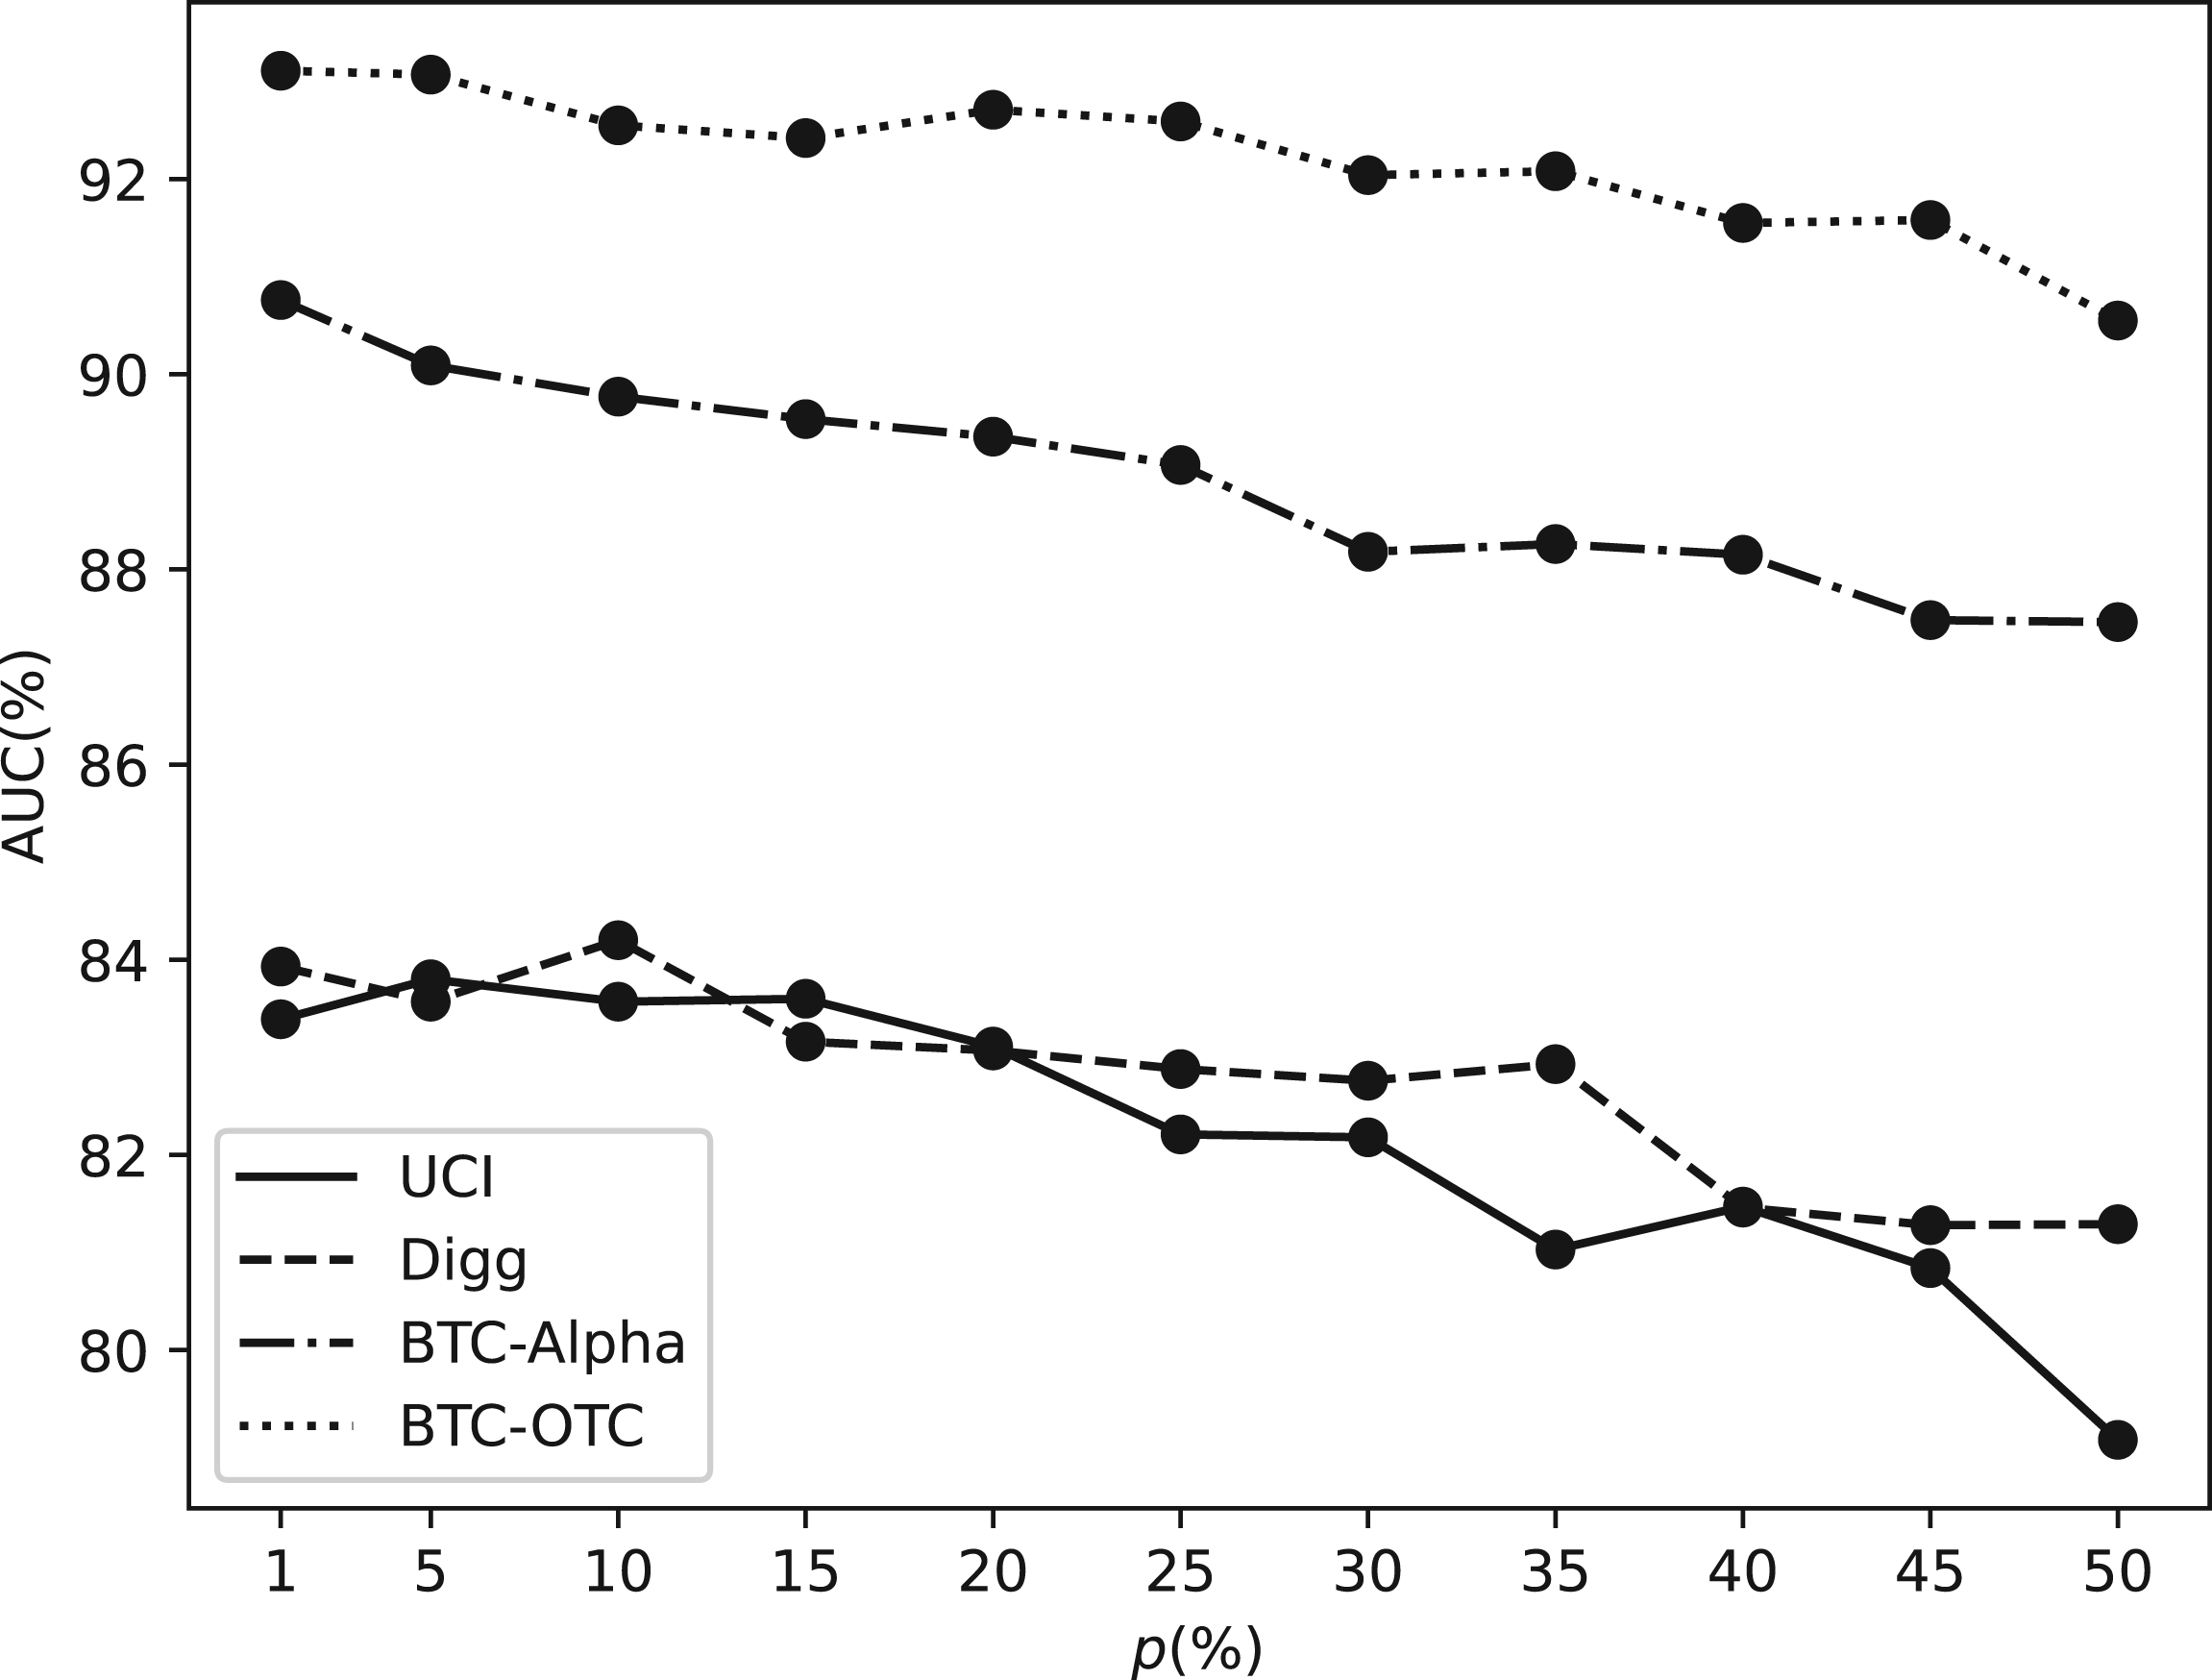
AUC of CDBC-DGADM on four datasets with different anomaly injection ratio. Note. AUC = area under the curve; CDBC-DGADM = combine dual behavior contrast dynamic graph anomaly detection model.
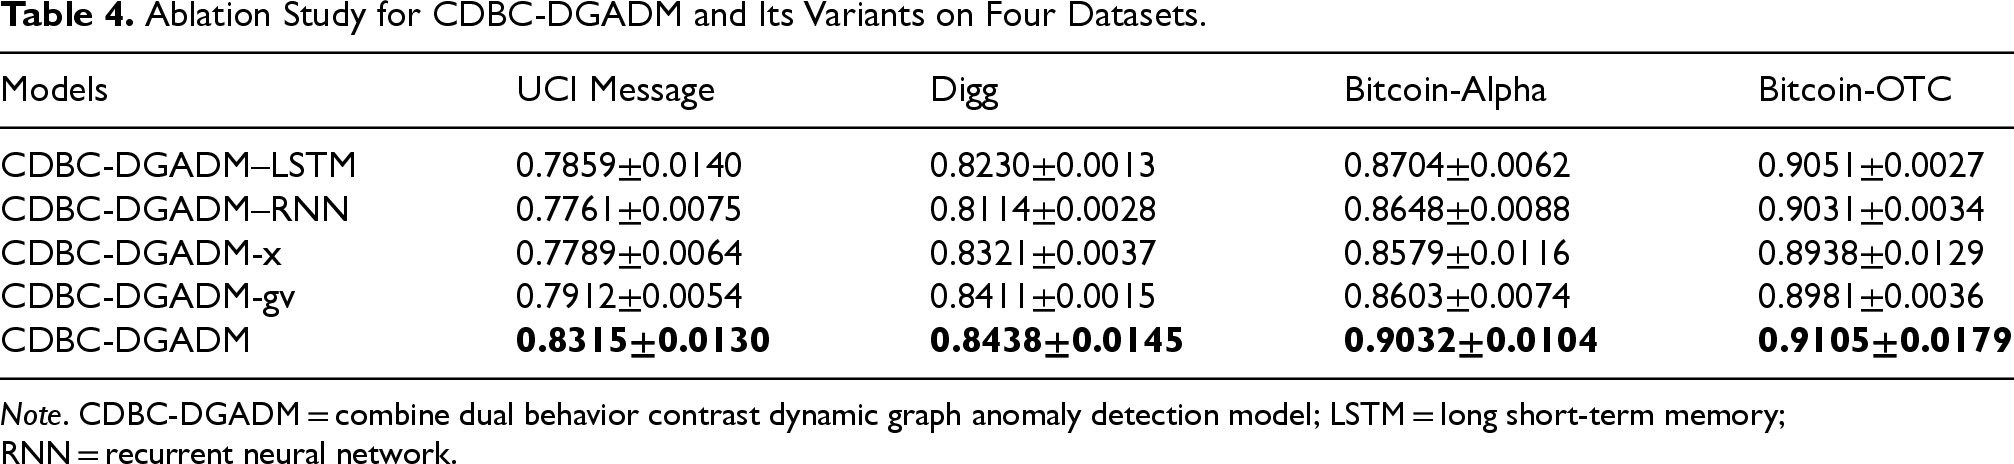
In response to RQ3, the ablation experiments are performed over the key components of CDBC-DGADM: (1) CDBC-DGADM-x experiments, using only the attribute-based behavioral module for anomaly detection; and (2) CDBC-DGADM-gv experiments, using only the role-based behavioral module for anomaly detection. Additionally, to verify the effectiveness of GRU, long short-term memory (LSTM), and RNN, ablation experiments were conducted with LSTM and RNN, namely CDBC- DGADM-LSTM and CDBC-DGADM-RNN, respectively. The results of the experiments are shown in Table 4.
Ablation Study for CDBC-DGADM and Its Variants on Four Datasets.
Ablation Study for CDBC-DGADM and Its Variants on Four Datasets.
Note. CDBC-DGADM = combine dual behavior contrast dynamic graph anomaly detection model; LSTM = long short-term memory; RNN = recurrent neural network.
By observing and analyzing the experimental results in Table 4, the following conclusions are obtained:
The CDBC-DGADM model has optimal anomaly detection performance, proving that the learning combined dual-behavior patterns can provide more comprehensive information in anomaly detection. In the social dataset UCI Messages, as well as the news network dataset Digg, the performance of CDBC-DGADM-gv is much better than that of CDBC-DGADM-x. In the trading network datasets, BTC-Alpha and BTC-OTC, the two are not significantly different. From this, it can be concluded that in networks with high socialization and strong message connections, role-based behavior patterns can provide more contextual and semantic information about the node, which can help anomaly detection. The CDBC-DGADM outperforms both CDBC-DGADM–LSTM and CDBC-DGADM–RNN across four datasets, demonstrating the superiority of GRU compared to LSTM and RNN.
In response to RQ4, the training efficiency of CDBC-DGADM is evaluated. Taking UCI Messages as an example, the running time of all methods in an epoch is recorded, and the results are shown in Figure 7.
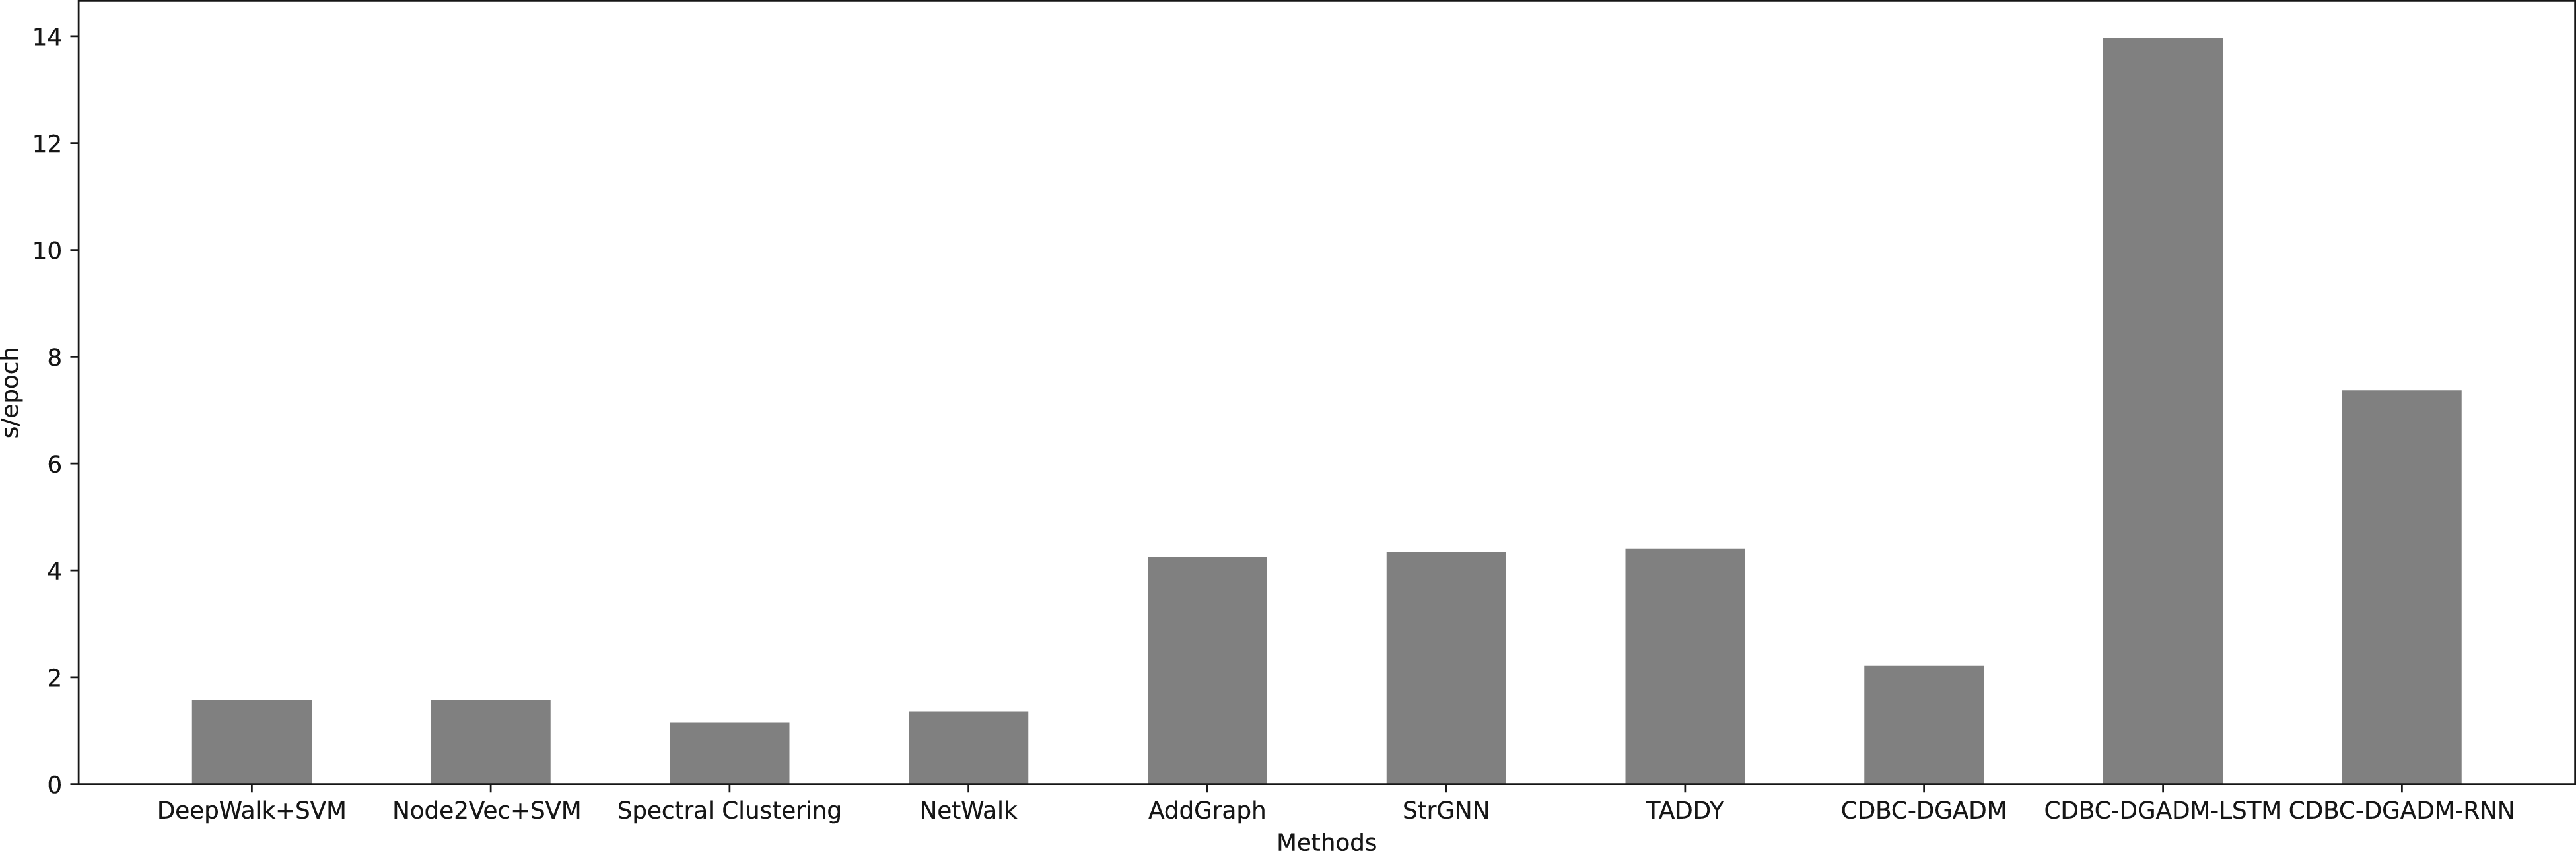
The running time of each model.
In general, traditional methods such as DeepWalk+SVM, Node2vec+SVM, Spectral Clustering, and NetWalk are more efficient, while deep learning methods such as AddGraph, StrGNN, and TADDY take longer to train. It is worth mentioning that although CDBC-DGADM shows marginal improvement in AUC on certain datasets, it requires less time, which is advantageous when training on large-scale datasets. Additionally, the GRU used in the model outperforms other sequence models, providing better efficiency at comparable accuracy levels. In conclusion, the proposed model CDBC-DGADM achieves a good balance between performance and efficiency.
Aiming at the problems that existing models in dynamic graphs only learn attribute-based behavior patterns for anomaly detection and ignore the essential differences between normal edges and abnormal edges, we proposed CDBC-DGADM to overcome the above problems. First, we study the dual-behavior learning patterns and obtain the final vector embedding by incorporating the use of GRU. Secondly, to enhance the model’s capability of targeting abnormal edges, we leverage contrastive learning to effectively distinguish and elevate the embeddings of positive and negative samples. Finally, experiments demonstrate that CDBC-DGADM achieves the best balance between performance and efficiency.
Future work includes but is not limited to incorporating human prior knowledge into anomaly detection to improve effectiveness and efficiency and applying our model to different domains (e.g., financial fraud detection or anomaly log detection).
Footnotes
Funding
The authors received no financial support for the research, authorship, and/or publication of this article.
Declaration of Conflicting Interests
The authors declared no potential conflicts of interest with respect to the research, authorship, and/or publication of this article.