
Abstract
In recent years, pervasive use of sensors in smart devices, e.g., phones, watches, medical devices, has increased dramatically the availability of personal data. However, existing research on data collection primarily focuses on the objective view of reality, as provided, for instance, by sensors, often neglecting the integration of subjective human input, as provided, for instance, by user answers to questionnaires. This limits substantially the exploitability of the collected data. In this paper, we present a methodology and a platform designed for the collection of a combination of large-scale sensor data and qualitative human feedback. The methodology has been designed to be deployed on top, and enrich functionalities of an existing data collection APP, called iLog, which has been used in large scale, worldwide data collection experiments. The main goal is to put the key actors involved in an experiment, i.e., the researcher in charge, the participant, and iLog in better control of the experiment itself, thus improving the quality and richness of the data collected. The novel functionalities of the resulting platform are: (i) a time-wise representation of the situational context within which the data collection is performed, (ii) an explicit representation of the temporal context within which the data collection is performed, (iii) a calendar-based dashboard for the real-time monitoring of the data collection context(s), and, (iv) a mechanism for the run-time revision of the data collection plan. The practicality and utility of the proposed functionalities are demonstrated in a case study involving 350 University students.
Introduction
In today’s world, digital interactions have become deeply integrated into daily life, generating vast amounts of personal data. This data, encompassing information about individual identities, preferences, activities, and interactions, is increasingly collected through digital devices, online services, and various monitoring technologies. For instance, smart devices, e.g., phones, watches, or medical devices, are equipped with numerous sensors that collect massive volumes of data about their owners. This type of data, often referred to as big data (Das & Kumar, 2013), is characterized by its vast volume, high velocity, and diverse variety, and allows for the identification of large-scale patterns and trends through advanced computational techniques. Despite its power, big data often lacks the contextual depth needed to fully understand the underlying human elements behind the numbers, that is, it fails to explain the subjective impulses that drive an individual’s actions. In contrast to the vast amount and speed of “big data”, thick data provides a qualitative description focused on human experience and behavior (Geertz, 2008). Thick data pertains to the abundant and detailed insights obtained from extensive qualitative research techniques such as ethnography, interviews, and participant observation. It prioritizes qualitative aspects such as human narratives, emotions, and cultural subtleties, i.e., it is a class of data sources that align with ethnographically collected and meticulously analyzed observational data. Building upon the two notions above, (Bornakke & Due, 2018) defines big-thick data as the convergence of big-thin data, e.g., usage analytics, sensor data, general Internet-of-Things data, with small-thick data, e.g., observations, interviews and questionnaires. The intuition is that big quantitative data, prized for its objectivity and scalability, complements the contextual richness of the qualitative insights of thick data (D’ignazio & Klein, 2023).
The notion of big-thick data was originally conceived having in mind the human-centric design of services, with the goal of blending statistical rigor with contextual relevance (Bogers et al., 2016, 2018). However, this intuition is very powerful and can be applied in almost all AI applications, and machine learning (ML) in particular. In ML, for instance, the user’s subjective interpretation of the current situation can help the machine in building a better understanding of what is going on, for instance in order to enable better human-machine interactions (Bontempelli et al., 2022) or better machine-enabled social interactions (Fausto et al., 2021; Osman et al., 2021). The integration of these two types of data facilitates the meaningful bi-directional human-machine collaboration by providing data that allows the machine to learn from human behavior and activities, as well as data that captures the human interpretation of their actions. It is not by chance that (Bornakke & Due, 2018) mentions social media and experience-sampling-method (ESM) data as early examples of big-thick data. Building upon this intuition, (Giunchiglia & Li, 2024) shows how big-thick data can be generated by integrating context-aware personal data, collected using both sensors and questionnaires, with data about the environment within which the personal data are collected, this being done by exploiting OpenStreetMap data enriched with other datasets carrying detailed information about the places involved. As shown in Giunchiglia and Li (2024), the result is a very rich dataset which, while being more focused and much smaller than the original datasets, allows to learn about and provide answers to a much richer set of questions which integrate the objective view with one or more personal subjective views of the current situation.
However, at the current state of the art, the quality of the data collected from users is a major limitation which limits the generation of big-thick data, when this is not done manually but, rather, delegated to a data collection APP. The goal of this paper is to describe a methodology and a platform that enables participants to provide high-quality personal data, as close as possible to the richness of big-thick data, while ensuring minimal disturbance to the user. The target are all the researchers who have a need for the kind of data we want to produce. At the moment we have identified at least four such groups: (i) Researchers in AI and ML with a focus on personalized services; (ii) computational social science researchers where the subjective component is key; (iii) psychology researchers and in particular those following the EMA/ESM methodology (see the related work section) and (iv) service design researchers with a focusing on the problem of designing with data. See, for instance the hackathon described in 2
The starting point of the methodology is the identification of the three key roles around which the data collection process evolves, that is: (i) The researcher, that is the person who has designed the experiment and that, during its execution, monitors its evolution, (ii) the participant to the experiment, one or more, where also the researcher can be a participant, namely the person in charge of providing data, via one or more mobile devices, the data to be collected, and, finally, (iii) the platform, collecting the data from the participants. The intuition is to develop a set of features, and corresponding mechanisms, where these three roles have increased awareness and control over the data collection process. We instantiate this intuition via four key functionalities, each building upon and extending the previous one.
A representation of the situational context within which the data collection is performed. The understanding of the local context (including the user’s physical and psychological context) is key to the idea of thick data (Geertz, 2008) and its relevance has been pointed out in most mobile applications, see, e.g., Huang et al. (2016), Intille et al. (2003), Runyan et al. (2013), Wang et al. (2014) and Zhang et al. (2021). Knowledge of the user’s physical, social, emotional, and informational states, allows to better interpret the vast amounts of sensor data collected (Chen et al., 2012), thus improving the relevance and quality of data collected (Boyd & Crawford, 2012; Davenport & Dyché, 2013). The key innovation in this paper is that we focus on the context of the data collection as such. The machine works in some kind of meta-context whose sole goal is to increase the machine / participant / researcher’s awareness of the process of data collection, as a first step towards increasing control and the quality and richness of the collected data. That is, our ultimate aim is to generate big-thick data about the process of generation of big-thick data, the former being a key enabler for the generation of the latter. A representation of the temporal context within which the data collection is performed. By this we mean that an experiment is modeled as a plan where each action, e.g., a human answer to a machine question, or a sensor data collection, or a machine answer to a human question, is associated with a set of scheduling constraints and, after execution, with a set of execution annotations, encoding information about past, present and future actions. Examples of planning constraints are, for instance, that a question can be asked within a certain time frame, and that should be asked only when at home. Examples of plan execution annotations are, for instance, that a question was not answered, of that it was answered with a delay of half an hour. To this extent, we have developed a representation language, called iLogCal, which allows to represent all the context dimensions, both temporal and situational, and to use them to condition the activation of both questions to the user and sensor data collection activation / stop. A calendar-based dashboard which allows all the three roles to focus on specific elements of the experiment temporal and situational context. One of the key aspects is that iLogCal has been defined by extending (a subset of) iCal, the Internet standard Calendar
3
A set of mechanisms for the execution-time revision of the data collection plan. The data collection plan can be revised by a single participant, within the bounds set by the researcher, or by the researcher for one or more of the participants. The plan can also be revised by the platform itself, for instance, based on a ML algorithm which has learned what are the best / worst dates for getting the answer of the best quality. The control hierarchy proceeds from the researcher, to the participants, to the platform.
These four functionalities are being implemented as part of an integrated platform, an APP, called iLog, built on top of an earlier version of iLog itself (Zeni et al., 2014). The two key core features of this earlier version of iLog are the possibility (i) of collecting sensor data from any number of sensors from one of more smart devices, and (ii) of collecting user-provided answers to questionnaires, which can be synchronic as well as diachronic. Since its first application in 2013, iLog has been used in many data collections campaigns, see, e.g., Bison et al. (2021), Giunchiglia et al. (2021), Maddalena et al. (2019) and Zeni et al. (2020). These experiments have allowed to generate an extensive set of studies, see e.g., Assi et al. (2023), Bontempelli et al. (2021), Giunchiglia and Li (2024) and Meegahapola et al. (2023), while at the same time highlighting the problems of data quality that motivate this work. This paper is a rather detailed description of the four functionalities described above and of how they are integrated, as part of a single platform, on top of the original version of iLog. This paper is structured as follows. Section 2 decribes the related work. Section 3 introduces the main features of iLog and how it was used in an experiment, described in Giunchiglia et al. (2021), carried out as part of the WeNet project (Michael et al., 2025)
5
. The description is rather concise focusing only on those aspects which relate to the four functionalities above. A detailed description of the resulting dataset (including GDPR and ethics compliance)
6
, is provided in Busso et al. (2025). Section 4 describes the situational context model. Section 5 introduces the main features of the temporal context model and iLogCal. Section 6 focuses on the monitoring process. Section 7 provides an example where the ML component improves the answer quality based on an analysis of how the temporal and situational context (and a few other parameters) influence how long a participant waits before starting to answer a question. The notions from Sections 4, 5, 6, 7 are exemplified on the experiment and dataset described in Section 3. Finally, Section 8 closes the paper.
Related Work
The intuition underlying the notion of context is very similar to that underlying the notion of big-thick data. That is, the knowledge of the local situation is key in order to provide machines with a good enough understanding of what is going on. This notion has been extensively studied and most early studies on context were in Knowledge Representation (KR) and AI, (Giunchiglia, 1993; McCarthy, 1987). Later on, Schilit and Theimer (1994) introduced the concept of context, defining it as involving “locations, identities of nearby individuals and objects, and changes to those objects.” Similarly, Brown et al. (1997) depicted context as being about “locations, varying user roles, time, seasons.” In Dey et al. (1998), Dey et al. provides a definition of context which is closely aligned with our understanding as, “the user’s physical, social, emotional, or informational states.” Dey and Abowd (Abowd et al., 1999) define the context in a more comprehensive manner. They state that “context is any information that can be used to characterize the situation of an entity. An entity is a person or object that is considered relevant to the interaction between a user and an application, including the user and applications themselves.” Existing research on the development of context-aware applications primarily concentrates on interruptions in context (Mishra et al., 2017), gathering user attention (Mehrotra et al., 2016), or enhancing the response rate of questions (Sun et al., 2021). These studies underscore the necessity of providing users with suitable times to facilitate user acceptance of information, with instances found in expert systems (Ye & Johnson, 1995) and, more recently, reccommender systems (Afolabi & Toivanen, 2019). However, so far, no work has ever concentrated on the meta-context of the process of data collection. In general, overall, there has been minimal focus on providing the user with flexibility in answering questions or in driving the sensor collection flow. Typically, the researcher’s dispatch of questions consists of a fixed schedule, with no possibility for the researcher, or participant, or the platform, to control the data collection and in particular the participant’s response activity.
Numerous systems, which leverage data from mobile devices and wearable sensors, have found applications in health monitoring, aging care (Berke et al., 2011; Lee & Dey, 2015), and the understanding of human behaviors and traits. For instance, mobile sensing has proven invaluable for health and physical activity monitoring, where accelerometers, gyroscopes, and GPS sensors are used to track users’ movements and generate insights into exercise routines, sedentary behaviors, and overall activity levels (Dunton et al., 2012; Intille, 2016; Liao et al., 2015; Rabbi et al., 2015) and in research on comprehending and forecasting human behaviors and traits (Do & Gatica-Perez, 2012; Farrahi & Gatica-Perez, 2011; Harari et al., 2016; Peltonen et al., 2020; Wang et al., 2018b). Similarly, behavioral data such as sleep patterns, social interactions, and phone usage have been utilized to detect early signs of mental health issues like stress, depression, and anxiety (Bogomolov et al., 2014; Wang et al., 2018a, 2020). Some of this work has resulted in the development of several mobile sensing frameworks designed to support the data collection and analysis. Some such examples are Campaignr (Joki et al., 2007) and Epicollect 5 (Gohil et al., 2020) which focus on customizable and scalable data collection; CenceMe (Miluzzo et al., 2008) and Social fMRI (Aharony et al., 2011) which emphasize the social context sensing; Empath2 (Dickerson et al., 2015), Emotion Sense (Lathia et al., 2013), and ESMAC (Bachmann et al., 2015) which specialize in emotion detection and behavior analysis.
Closer to our work, is AWARE (Ferreira et al., 2015), a well-established mobile sensing framework designed for the collection of passive data through smartphone sensors. While AWARE provides a broad and extensible framework for environmental and behavioral context awareness, iLog excels in comprehensive activity tracking, making it a more effective tool for personalized research contexts where user-specific logging are critical. DemaWare2 (Stavropoulos et al., 2017) is another prominent framework designed for activity recognition and contextual reasoning. It uses sensor fusion and ontologies for the detection of complex activities. While DemaWare2 excels in identifying hierarchical activities through predefined rules and ontologies, iLog offers greater flexibility. DemaWare2’s focus on predefined activity hierarchies may not be as effective in capturing more fluid or personalized data, thus limiting its applicability in dynamic, real-world settings. The Effortless Assessment Research System (EARS) (Lind et al., 2023) is designed for passive monitoring of behavioral and psychological patterns, particularly in mental health research. It emphasizes effortless data collection by minimizing the need for active user participation. While this makes EARS ideal for studies requiring low participant burden, it may miss opportunities for richer contextual insights that can be derived from active input. Beiwe Onnela et al. (2021) is a high-throughput digital phenotyping platform designed for mental health research and behavioral studies. Like iLog, it integrates passive sensing with active data collection (through surveys), allowing for personalized data collection and analysis. However, iLog offers a broader scope of application, extending beyond the mental health focus of Beiwe to include areas such as habit formation and lifestyle monitoring. Moreover, iLog stands out due to its emphasis on user engagement and ethical data collection practices, providing greater transparency and user autonomy over data sharing, which may not be as explicitly emphasized in Beiwe. RADAR-base (Folarin, 2019) is an open-source platform designed for longitudinal health studies, particularly in neurological and psychiatric research. It allows for the integration of multiple wearable sensors and mobile applications for the collection of health-related data. While RADAR-base excels in health-related contexts, iLog offers more flexibility across a broader spectrum of research domains. By combining passive sensor data with active surveys, iLog provides a richer, more personalized understanding of user behavior, mainly because of its ability to adjust data collection based on the context and the individual’s responses.
iLog At Work
The experiment that generated the data that we consider here as our motivating example involved students from the University of Trento, Italy. The experiment was conceived and designed following the mainstream approach in the Social Sciences, in particular in the development of time diaries, where the questions submitted to participants follow the HETUS standard
7
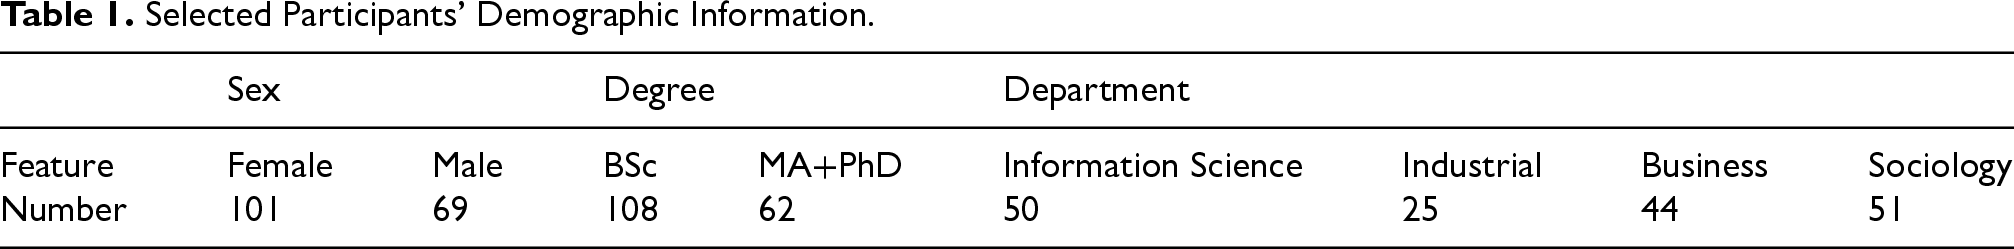
. Zeni et al. (2020) describes a large scale European level data collection experiment which was used to fine tune the methodology used in this experiment. Following this methodology, as a first step, all students were invited via email to participate in a survey. From the 5,000+ respondents, a representative sample of 350 students was selected based on their fields of study and socio-demographic characteristics. To mitigate bias and noise, in this paper we consider the data of a selection of 170 students, where the choice is motivated by considerations related to the number of answers provided and demographic characteristics, including gender, study degree, and department (see Table 1). iLog runs on the participants’ smart phones, both Android and iOS, and acts as an interface through which it is possible to capture annotations / tags / answers from participants. iLog allows for a wide range of question types (e.g., free text, fixed answers, take photo). The questions are sent at intervals defined inside the experiment plan. The experiment described here consisted of three diachronic time-diaries, with varying timings and aims:
The first diary gathered general information about the day. At 08:00 AM, the participant received two qualitative questions about sleep quality and expectations for the day. At 10:00 PM, the participants were asked (A) to rate their day; (B) to identify any problems they encountered during the day; (C) to describe how they solved them; and, finally, (D) they received a question about the COVID-19 pandemic. The second diary is a standard time diary with questions about three main activities and mood. Every half an hour for the first two weeks and every hour for the subsequent two weeks, the participants received a smartphone notification with four questions (the first three based on the HETUS standard):
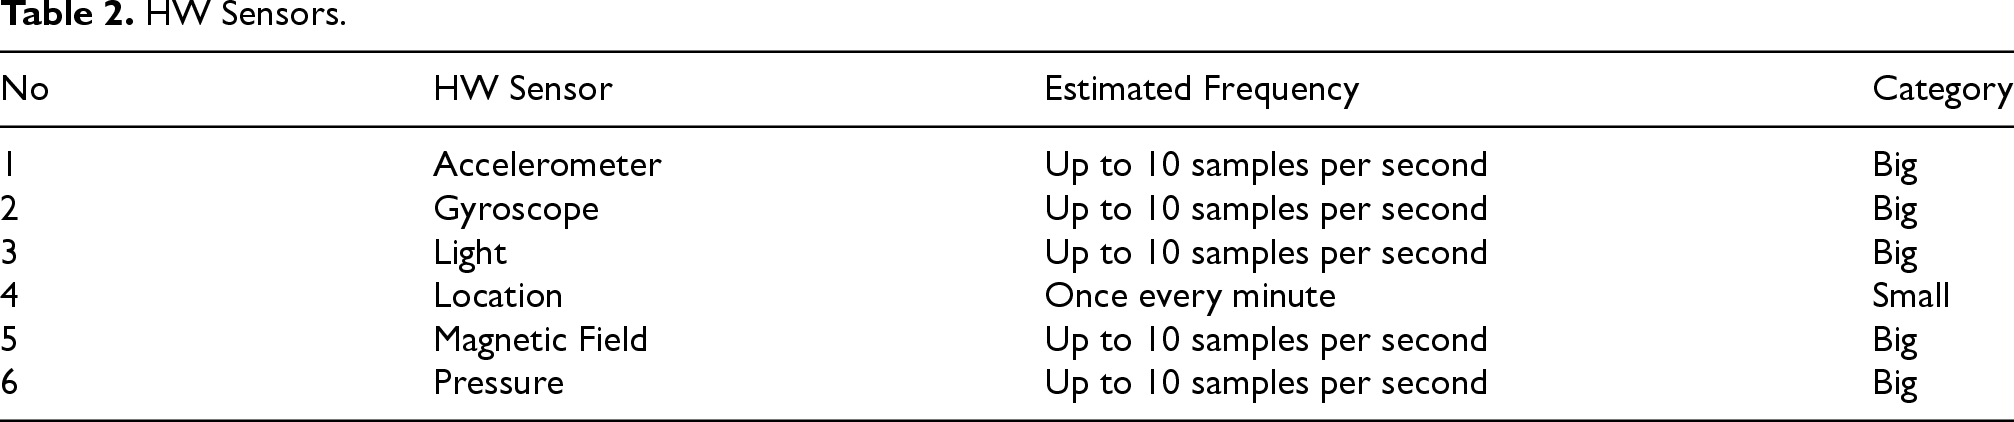
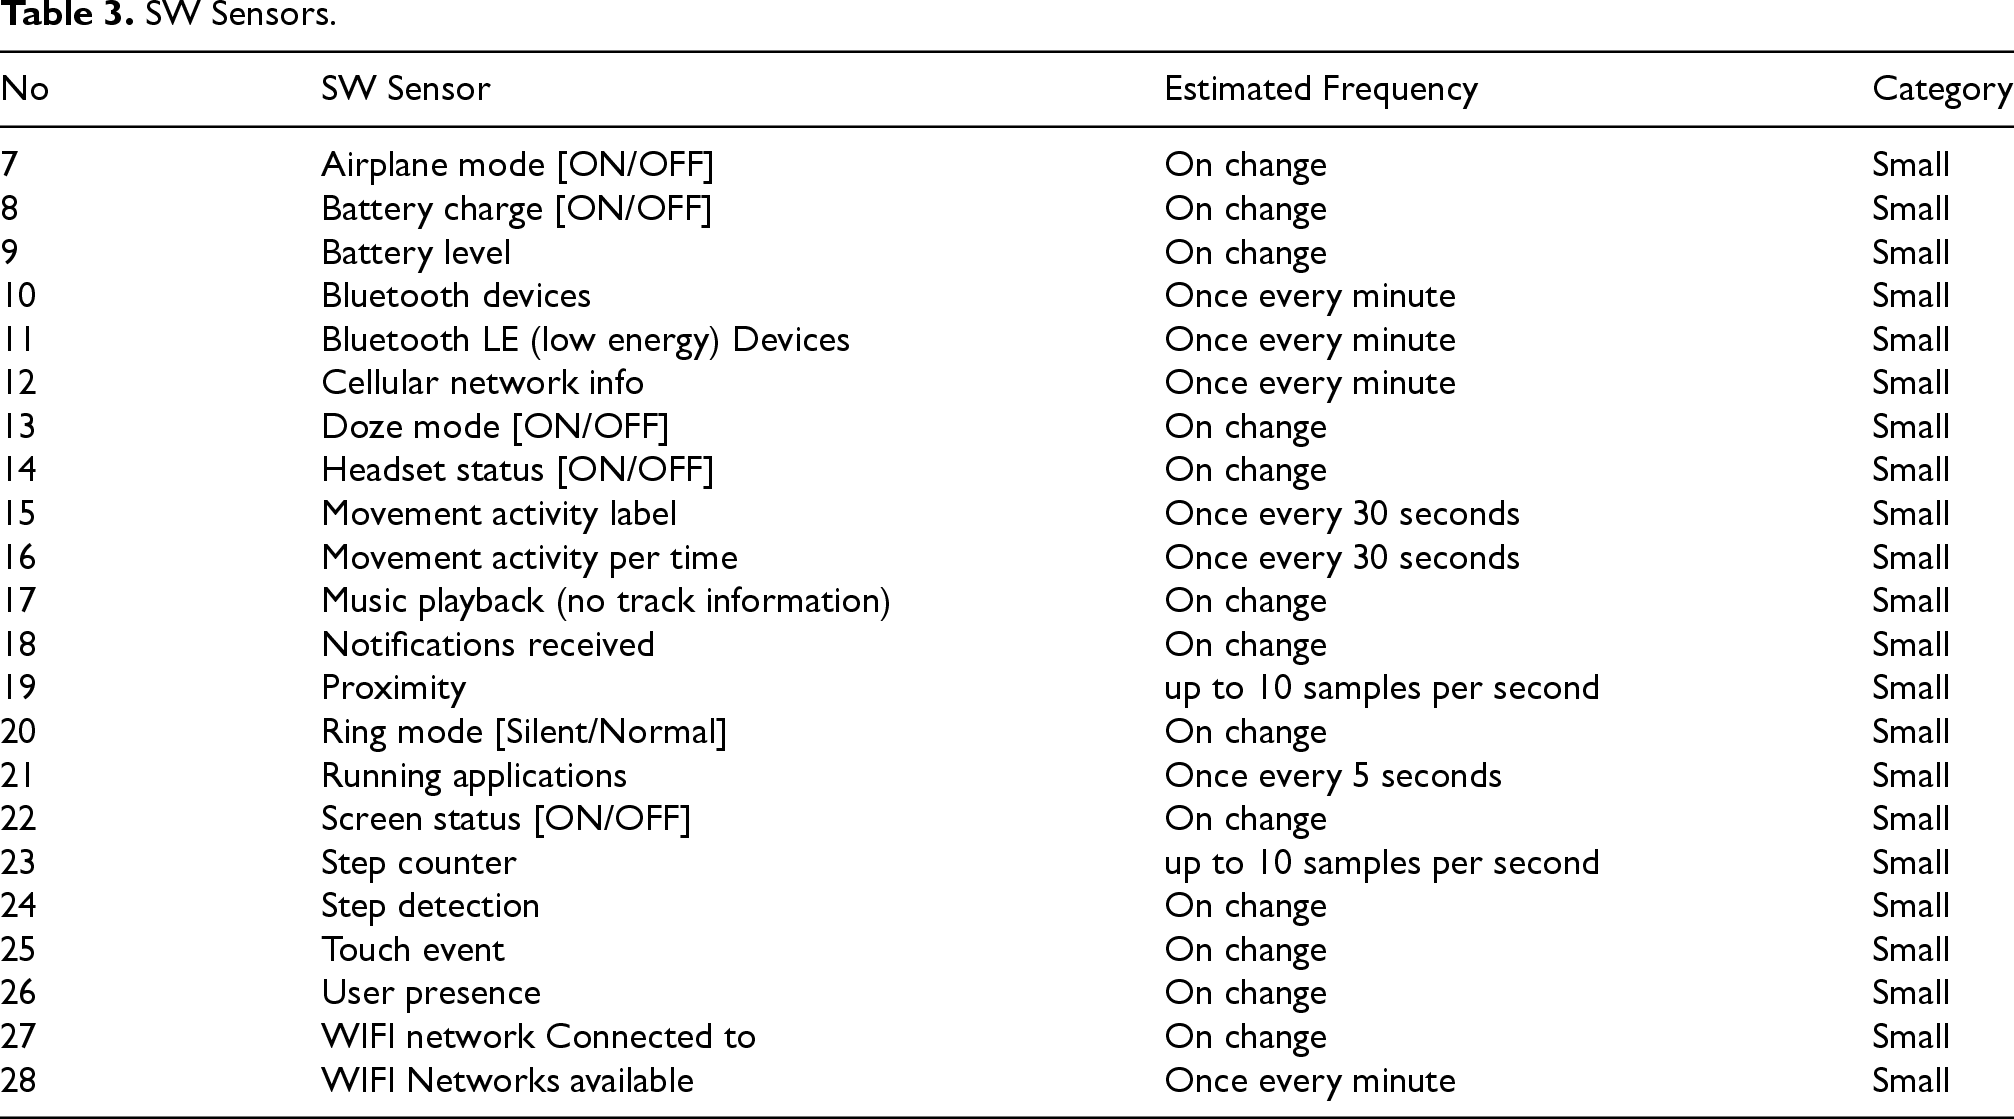
“What are you doing?” allowing for 34 different answers; “Where are you?” allowing for 26 different answers; “Who is with you?” allowing for 8 different answers (including ”being alone”); “What is your mood?” allowing for a scale of 5 levels ranging from happy to sad. In the third time diary, the participants received an additional set of questions about food and drinks. These questions were asked every two hours outside the main meal hours. Hardware (HW) sensors, the sensors typically found in smart phones, collect information about the surrounding environment. See Table 2 for the list of HW sensors collected during the experiment. Software (SW) sensors, also typically found in smart phones, collect data about the SW events involving the Operating system and the APPs. See Table 3 for list of SW sensors collected during the experiment. Question-Answering (QA) sensors collect information about the events that are associated with the question answering process. See Table 4 for list of QA sensors.
Figure 1 shows some of the questions (and pre-compiled answers) asked during the data collection. iLog automatically collects sensor data in the background without requiring user intervention. Researchers are given the flexibility to design the frequency of data collection for each single sensor. In total, iLog allows to collect data from 34 sensors which are categorized into three groups as follows:
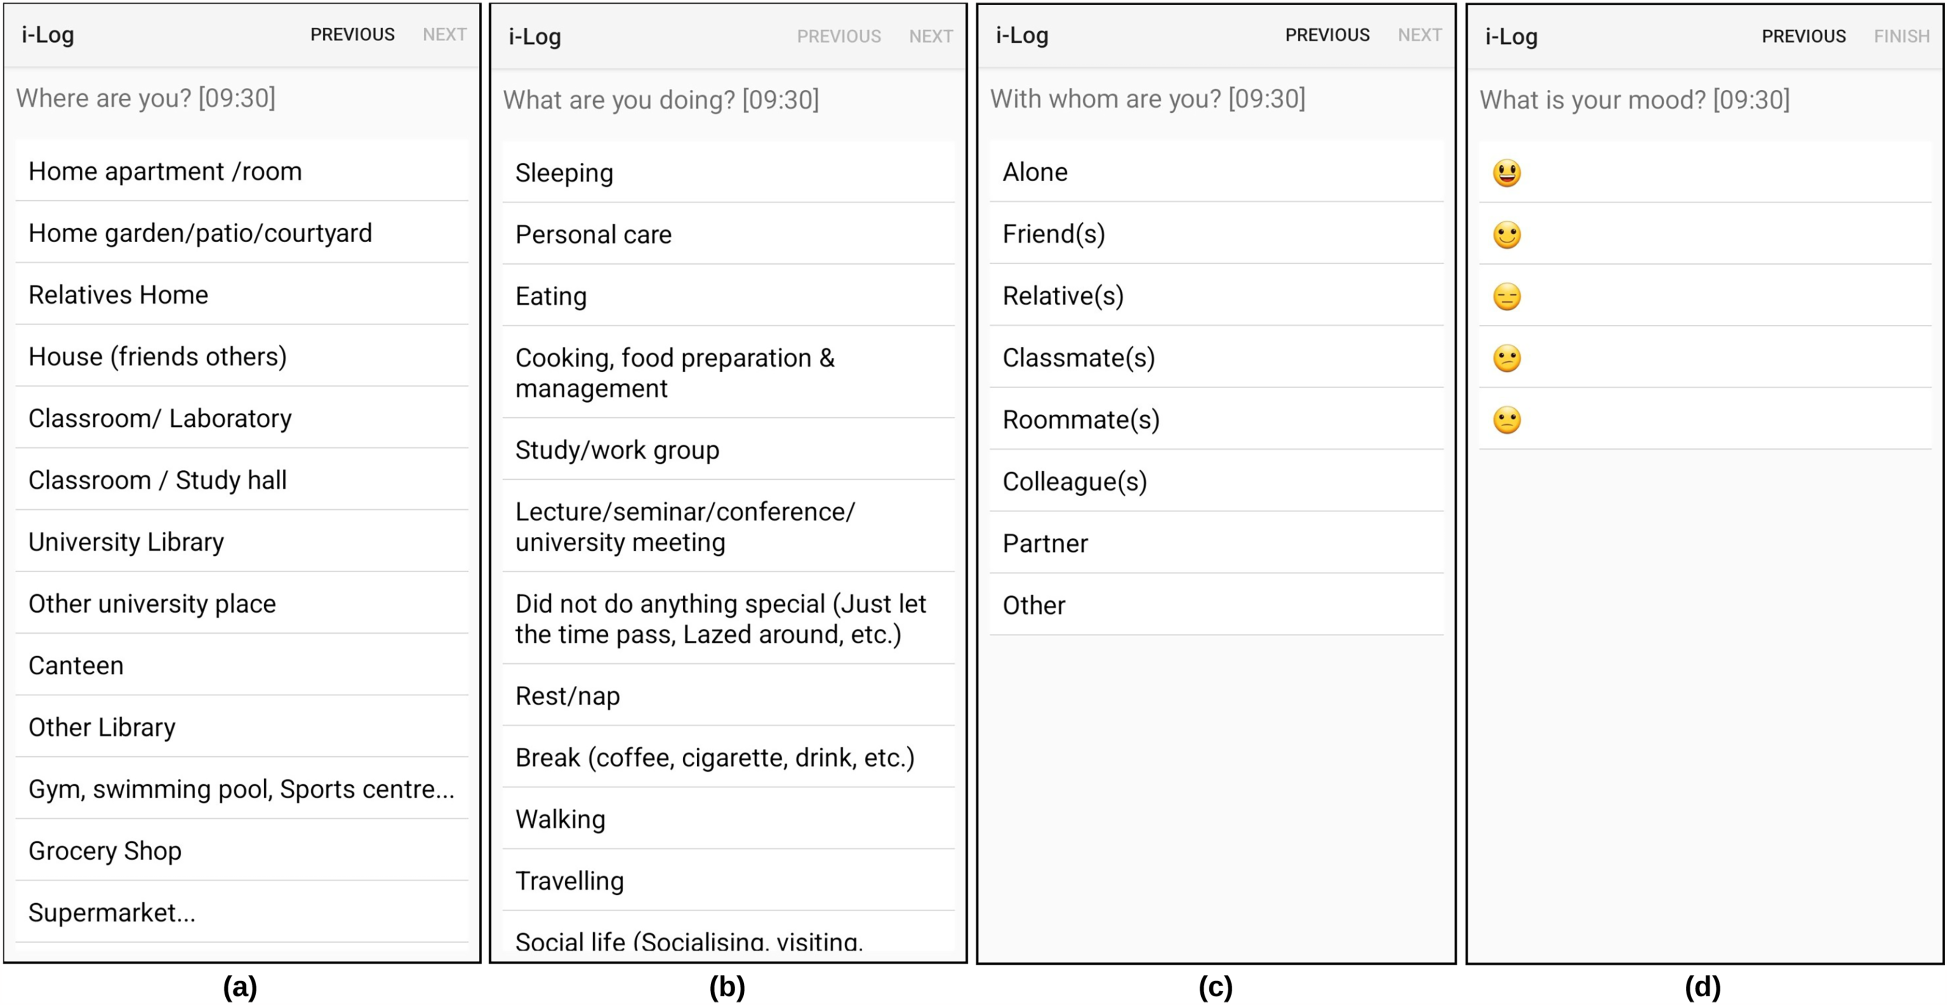
Sample Questions Captured in the WeNet Project.
Selected Participants’ Demographic Information.
HW Sensors.
SW Sensors.
QA Sensors.
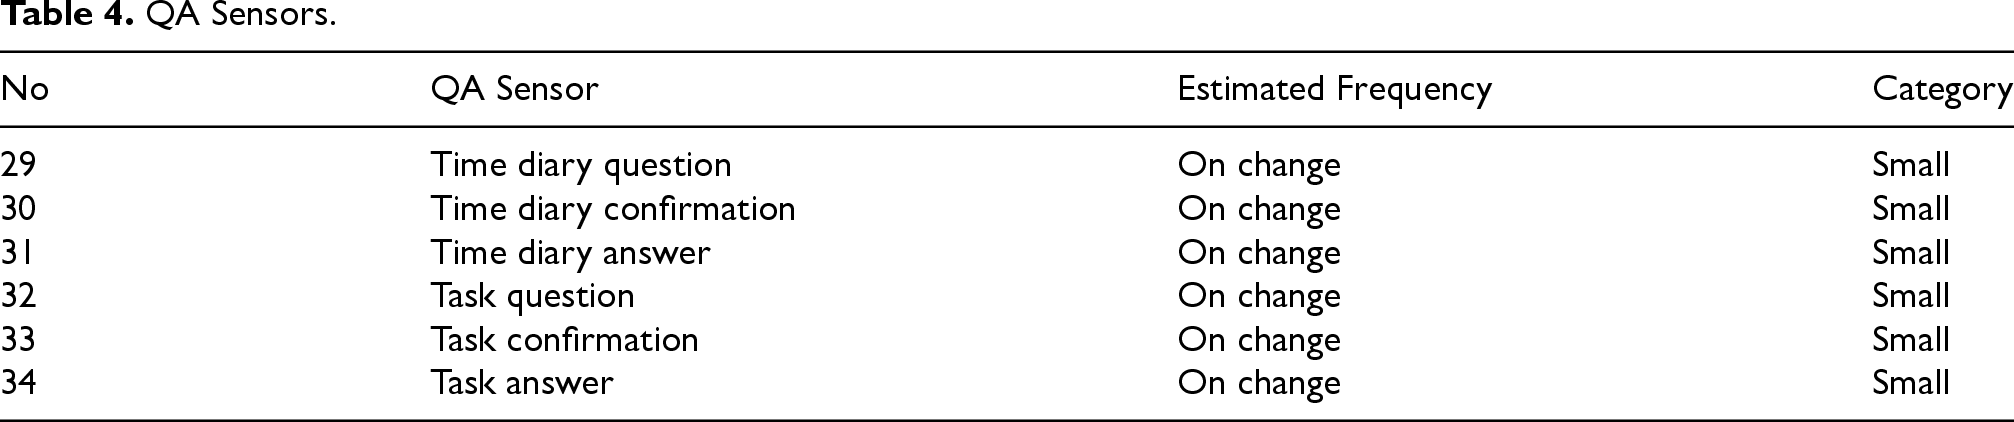
Differently from HW and SW sensors, QA sensors are specific to iLog and, as far as we know, are not found in any other data collection APP. They are the key element which enables the design and implementation of the scheduling language iLogCal described below and, therefore, of the entire data collection methodology described in this paper. Looking at Table 4, it is possible to notice two sets of QA sensors. The first set, concerning Time Diaries, is used to answer questions about the context of the experiment, while the second set, concerning additional Tasks, is used to get information about the data collection process. As an example of task, a user may be asked whether it confirms a previous answer, or if it achieved a specific task, e.g., returning back a missed phone call). Inside each set of QA sensors we have three types of sensors, as follows:
Time Diary/Task question: When a question is generated, ready for delivery; Time Diary/Task confirmation: When a question, is delivered to the device of the participant (who may then look at it in any moment after this); Time Diary/Task answer: When an answer is stored, with additional information of the difference between answer and notification time (the notification time and time defined by the researcher when the question is to be submitted to the participant).
As described in detail in Bison et al. (2024), the reaction time, also called the response time, that is, the time difference between when one receives a question and when (s)he starts filling the answer, and the notification time, also called the completion time, that is, the time taken to fill an answer, are key factors which impact the quality of an answer. Here, by the quality of an answer, we mean an answer which has been meaningfully provided (and not just dropped) and which is correct. It can be noticed that response time and completion time can be easily computed, for each question and (possibly missing) corresponding answer, from the information provided by QA sensors.
The work in Bison et al. (2024) also provides evidence of the fact that response and completion time are highly impacted by the situational and temporal contexts. iLog has various features which allow; (i) to compute this information and, even more importantly, (ii) to provide extreme flexibility about the configuration of the data collection. These two features are key, together with QA sensors, for learning about which factors influence the user behavior. Let us consider some examples. First, the researcher has a wide variety of question types to select from. This can be exploited to ask questions which are not related to the data to be collected as part of the experiment as such, but which are about the data collection process meta-context. For instance, as done in Zeni et al. (2019), under certain conditions, the participant can be asked to confirm a specific answer. Second, the possibility of configuring the data collection frequency independently for each sensor allows to collect data whose main purpose is solely that of monitoring the experiment evolution. As an example, collecting the GPS when asking a question about the current location allows iLog to validate the correctness of the answer. This idea is exploited in the work described in Giunchiglia et al. (2018); Zeni et al. (2019). The same applies to the bluetooth or to any other sensor which provides information about the situational context of the question-answering process. As another example, any question and relative answer about the current situational context is key for collecting information about the meta-context at the precise moment when an answer is provided. This idea is exploited in the work described in Bison et al. (2024) for computing the best moment for asking a question. Third, the information provided by SW sensors, if integrated with the information about the experiment temporal context, allows to understand and correlate the activities performed by participants. For instance, Giunchiglia et al. (2017b) exploits this information to correlate academic performance and social media usage, while Kasinidou et al. (2024) uses this information to detect the usage of social media during lectures.
As a conclusive remark, it is worth noticing that the amount of personal information that has been collected in this experiment and that, in general, which can be collected using iLog, is huge, thus raising important privacy and ethics related issues. The approach that we follow is based on tree main pillars. The first is that the use of iLog follows a very precise GDPR and ethics aware methodology, inspired by the approach followed in 8 . The details of how this was applied in the experiment described in this section are reported in Busso et al. (2025). The second is that our main focus is on research-motivated data collections. The third is that iLog is being redesigned to store and keep all the data in the participant’s device. Ultimately, in the next version of the platform, the participant will be in full control of the data and of how to use them for his/her own purpose. In turn this will allow for the possibility, at the moment unexplored, of increasing the participant’s self-awareness of his/her life-style and habits, as modeled as (life) sequences of situational contexts (see Section 4) and visualized by the dashboard (see Section 6). Some early ideas in this direction are provided in Li et al. (2022).
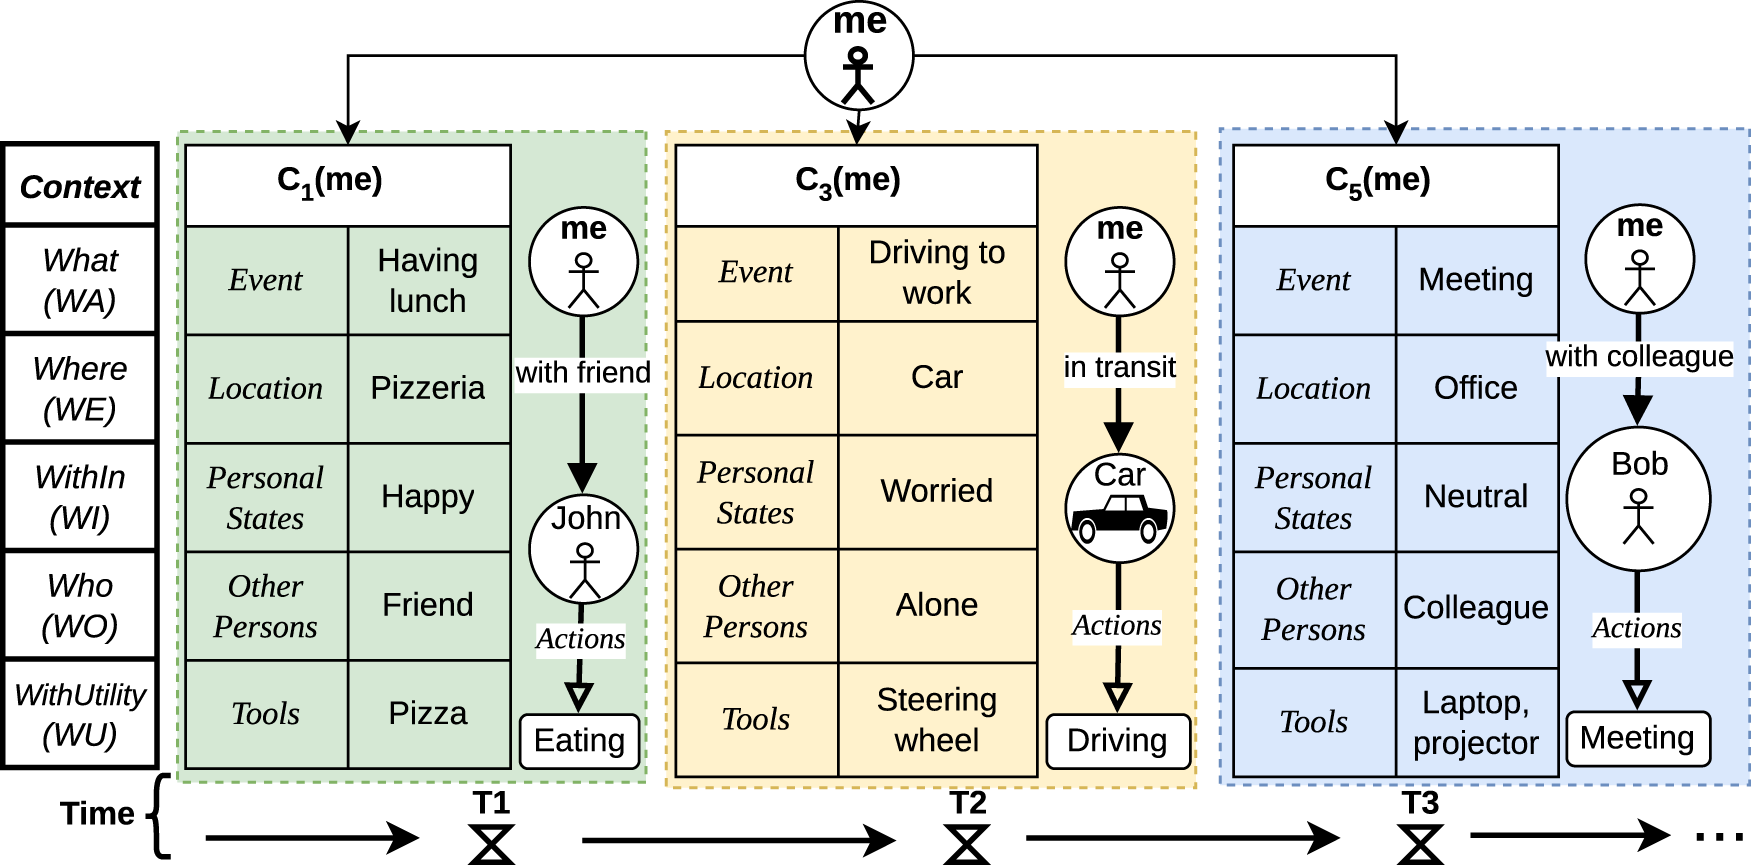
The notion of context used here is an elaboration of the notion of context first introduced in Giunchiglia et al. (2017a) and further extended in Xiaoyue et al. (2022). As a motivating example, let us consider a small portion, of the duration of around a couple of hours, of the everyday life of the students participating in the experiment described in Section 3, as represented in Figure 2. Let us call this person, me. As from Figure 2, the activities of me consist of the following:
An Example of Everyday Life Sequence.
During a first period of time T1 (green box), me is at a pizzeria having lunch with the friend, John. They are having pizza and me is happy; Then, in the following period of time T2 (orange box), me is driving to work, alone and is in a worried mood; Finally, during T3 (blue box), me is in a meeting in office with the colleague Bob and me is in a neutral mood.
Following the terminology introduced in Xiaoyue et al. (2022), what is represented in Figure 2 is a specific instance of a (small) fragment of the life of me, written as the Life Sequence of me, 
We assume that me is involved in only one personal context at the time. This models the intuition that a situational context is associated to a single location, that is, that moving from one location to another means changing context, and that, at any given moment, a person can be in only one place. A life sequence fully covers the period under consideration, but there may be elapsed times between a context and the next one in the sequence. What makes a set of contexts a life sequence is not the time sequentiality but the fact that they are functionally related by some overall motivation or purpose. Some examples of life sequences are: the lectures in a morning, which may or may not have an elapsed time in between, depending on whether the class is in different rooms, where two classes in the same room can be modeled as a single context or as the sequence of two contexts in the same location; the lectures of the same course in a semester; the editions of the same course along five years; a portion of everyday life as in Figure 2; a full day, and so on.
We model a situational context in terms of five components as follows (from now on we drop the argument me whenever no confusion arises).

where:
WE, the so-called spatial context, is a linguistic description, e.g., a label or some text provided in a formal or natural language, describing the location where me is at the moment. Information about it can be obtained from the sensor data as well as from iLog questions. In the experiment described in Section 3, the HW sensors that can be used to compute the location are, e.g., GPS or WI-FI. The name of the spatial context is the label (selected from a set of predefined ones) provided by the answer to the question “ WA, the so-called activity or event context, is a linguistic description of the activities being currently performed by me. A single context may contain one or more activities which in turn, can be performed in sequence or in parallel Li et al. (2022). Information about this can be obtained from sensor data as well as from the iLog questions. In the experiment described in Section 3, a HW sensor that can be used to know about the physical activities is, the accelerometer; whereas, a SW sensor can be used to know about the online activities a person is doing, while the QA sensors allows to know when me is involved in which question-answering activities. The name of the temporal context is the label (selected from a set of predefined ones) provided by the answer to the question “ WI, the so-called internal (activity or event) context, is a linguistic description describing the internal activities occurring inside me. Information about this can be obtained from the sensor data (e.g., heart beat, blood pressure) provided by medical devices or smart watches, as well as from the iLog questions. In the experiment described in Section 3, no sensor could provide this type of information. The only question providing this type of information was the question asking “ WO, the so-called social context, is a linguistic description describing the people, possibly none, who are with me at the moment. Information about it can be obtained from sensor data as well as from iLog questions. In the experiment described in Section 3, the HW sensors that can be used to compute the social context are, e.g., the blue-tooth or the microphone (via speaker recognition). The social context is described by the label (selected from a set of predefined ones) provided by the answer to the question “ WU, the so-called material or (tool / utensil) context, is a linguistic description, describing the tools, possibly none, which are used or usable by me. Example of tools are: the car used in a trip or the phone used in the interaction with a friend. In the experiment described in Section 3, no sensor and no question was used to provide this type of information. It could be obtained from sensor data (e.g., bluetooth, rfid, wifi) as well as from a question like “ a (sub-)KG for each context, including the internal context; a node for each entity involved, e.g., Person, Room, and Furniture; an attribute and corresponding value for each node / entity; for instance, the attributes of ME (whose context we are describing) are Name, Mood, Notification time and Answer time; an Edge for each relation between two entities; for instance, office is
The scenario in Figure 2 can be modeled by a knowledge graph (KG) (Giunchiglia et al., 2023), see Figure 3. We can identify the following components :
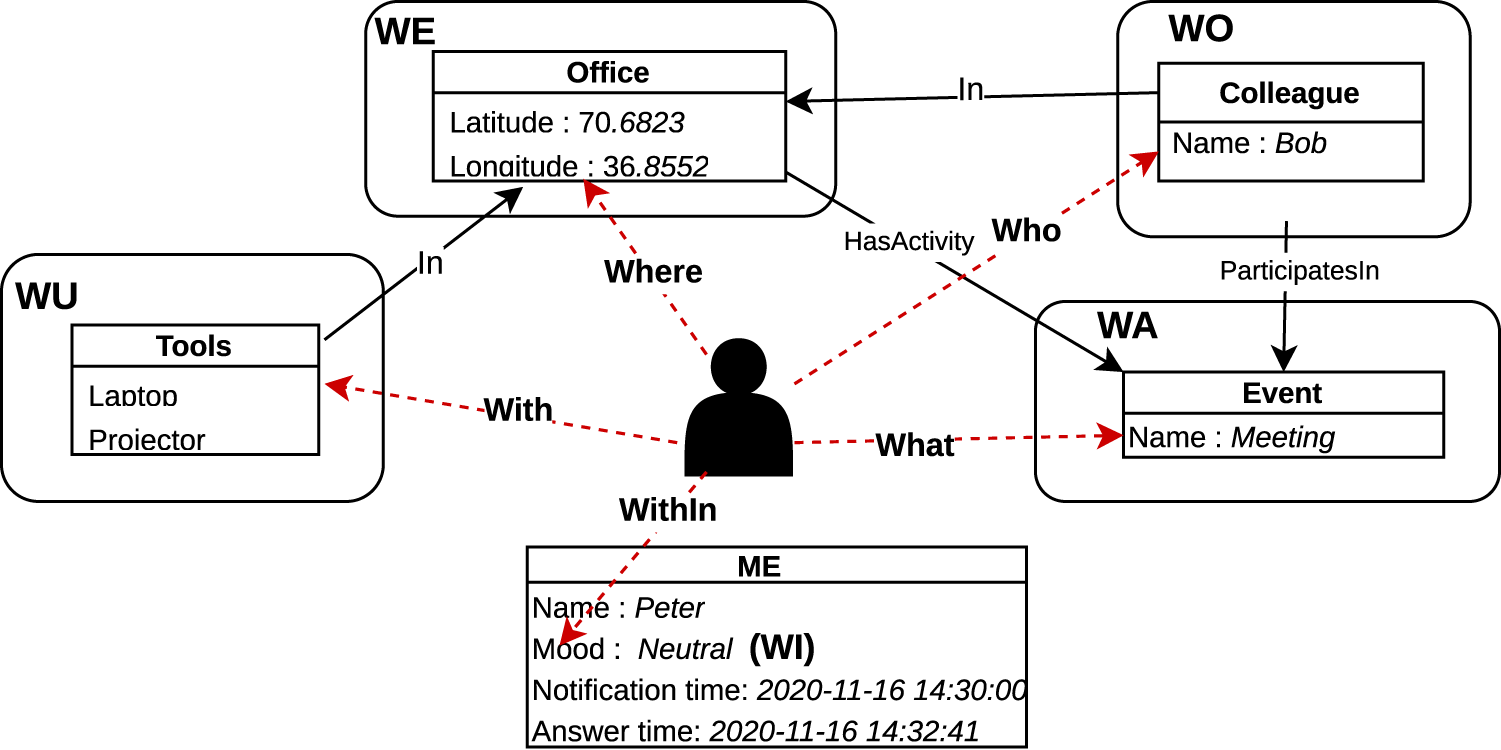
The Knowledge Graph of the Third Situation Context in Figure 2.
A Life Sequence is represented as a set of KGs. As it will be described in detail in the next section, any of the attributes and relations occurring in one or a combination of KGs can be used as a precondition enabling or disabling a question or a task of iLog.
We model the temporal context using iLogCal, a scheduling language developed on top of iCal, the iCalendar/RFC5545 (iCal) standard. Using the iCal standard provides three primary benefits, namely;
An explicit and declarative representation of the activities involved in an experiment. This, in turn, allows to easily modify, for instance via a graphical interface, the resulting schedule, e.g., for instance by eliminating questions or adjusting response times; The possibility of using the iCal Recurrence Rule (RRule) for the formulation of recurring activities; Access to advanced open-source graphical interfaces in the form of calendar-like visualizations, e.g., Fantastical Calendar
9
. The general schedule aggregating all the different components; The question answering component; The sensor data component.
iLogCal organizes the specification of an experiment in three main components, as follows:
We introduce and discuss below a snapshot of the three iLogCal components using the Extended Bachus-Naur Form (BNF) notation. We use the following conventions:Terminal symbols are written in the font of the text of the paper,
The BNF of an experiment general schedule is reported in Figure 4. We have the following observations.
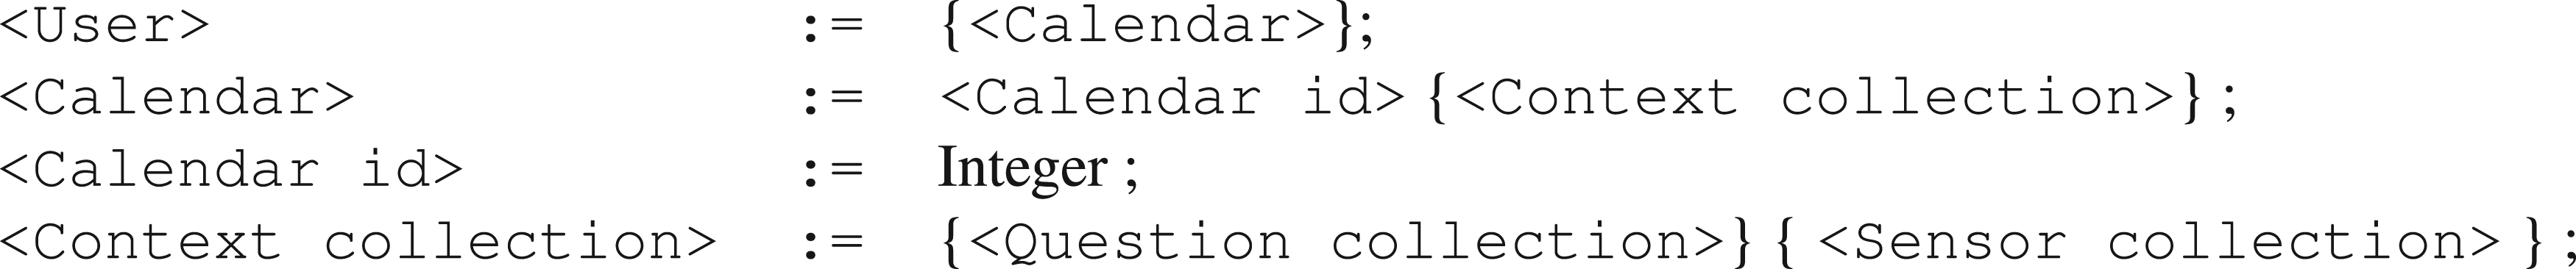
Experiment General Schedule.
A user may be associated with multiple calendars; this allows a user to participate in multiple experiments in parallel. A life sequence consists of the data collected by one of more calendars; Each calendar contains multiple context collections; this allows to have an articulated specification of an experiment, while maintaining the unity of the same experiment; Each context collection allows for any number of question collections as well as sensor collections. This facilitates the specification of multiple diverse data collections within the same context collection. Identifiers, e.g.,
As an example of instantiation of the schedule in Figure 4, the experiment described in Section 3 was organized as follows. Three calendars were created to collect data from participants. The first calendar gathered general questions about the day, the second calendar collected time diary questions as detailed in Section 3, and the third calendar compiled additional questions regarding food and drinks. Notably, all three calendars gathered the same sensor data. The researcher then decided how to use the sensor data collected from the different calendars. The details of this step are discussed in the following subsections.
The BNF of the iLogCal sensor collection is reported in Figure 5. We have the following observations.
A Each We have five possible values for
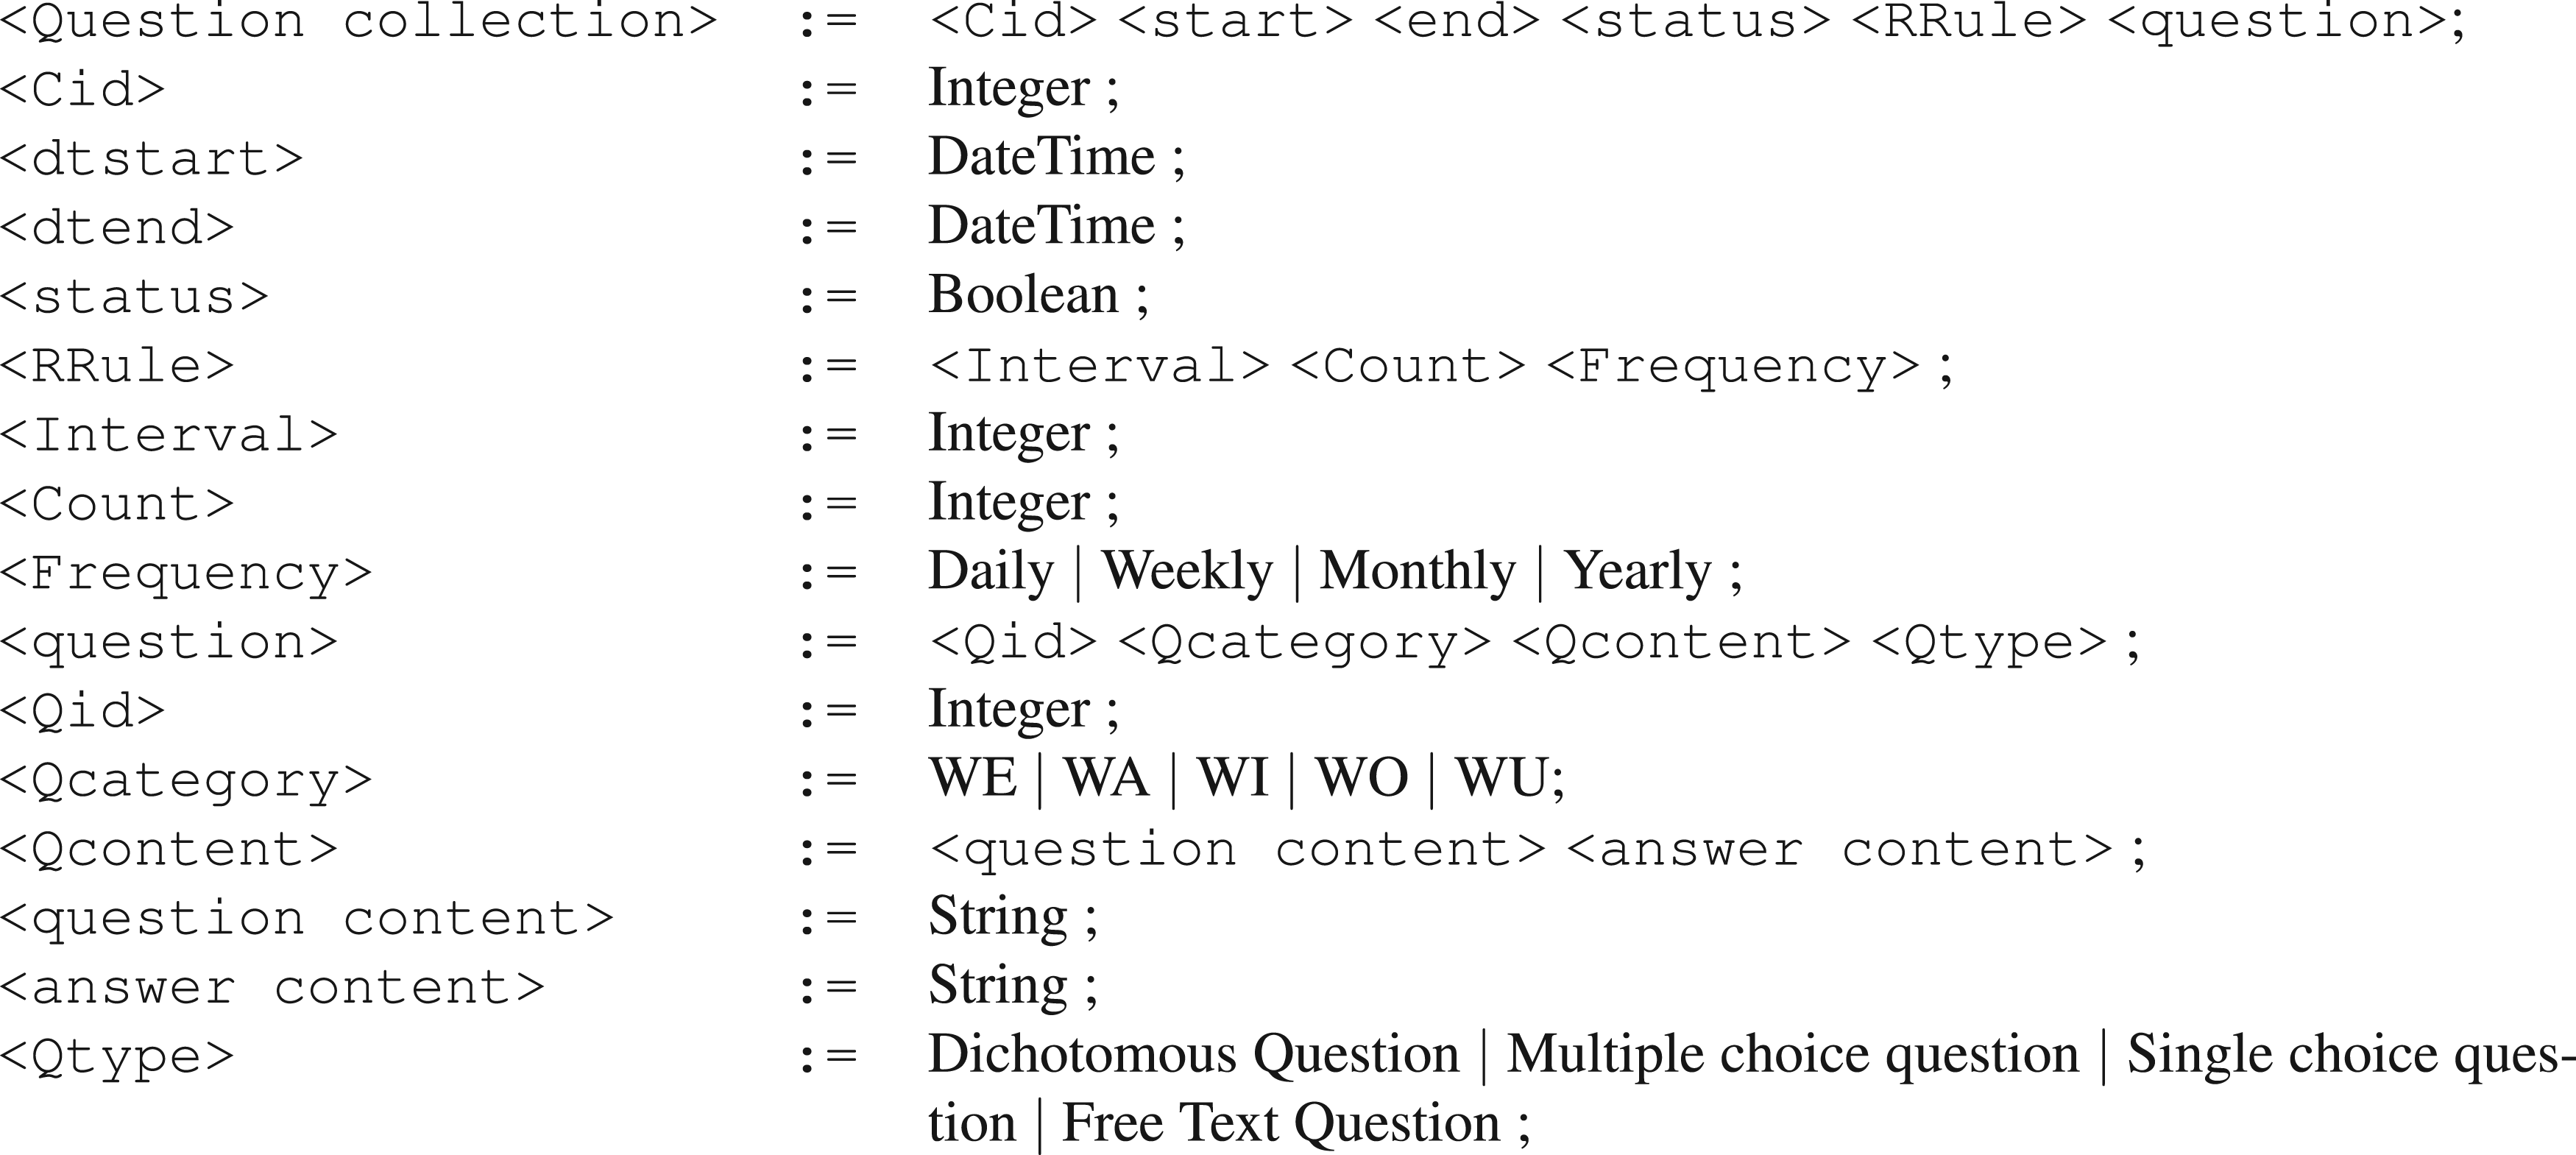
Question Collection.
We illustrate the use of the BNF in Figure 5 by applying it to the data in Figure 3. We select WA as the value for
The BNF of the iLogCal sensor data collection is reported in Figure 6. The structure is essentially the same as that used for question collections and exploits a similar set of nonterminal symbols.
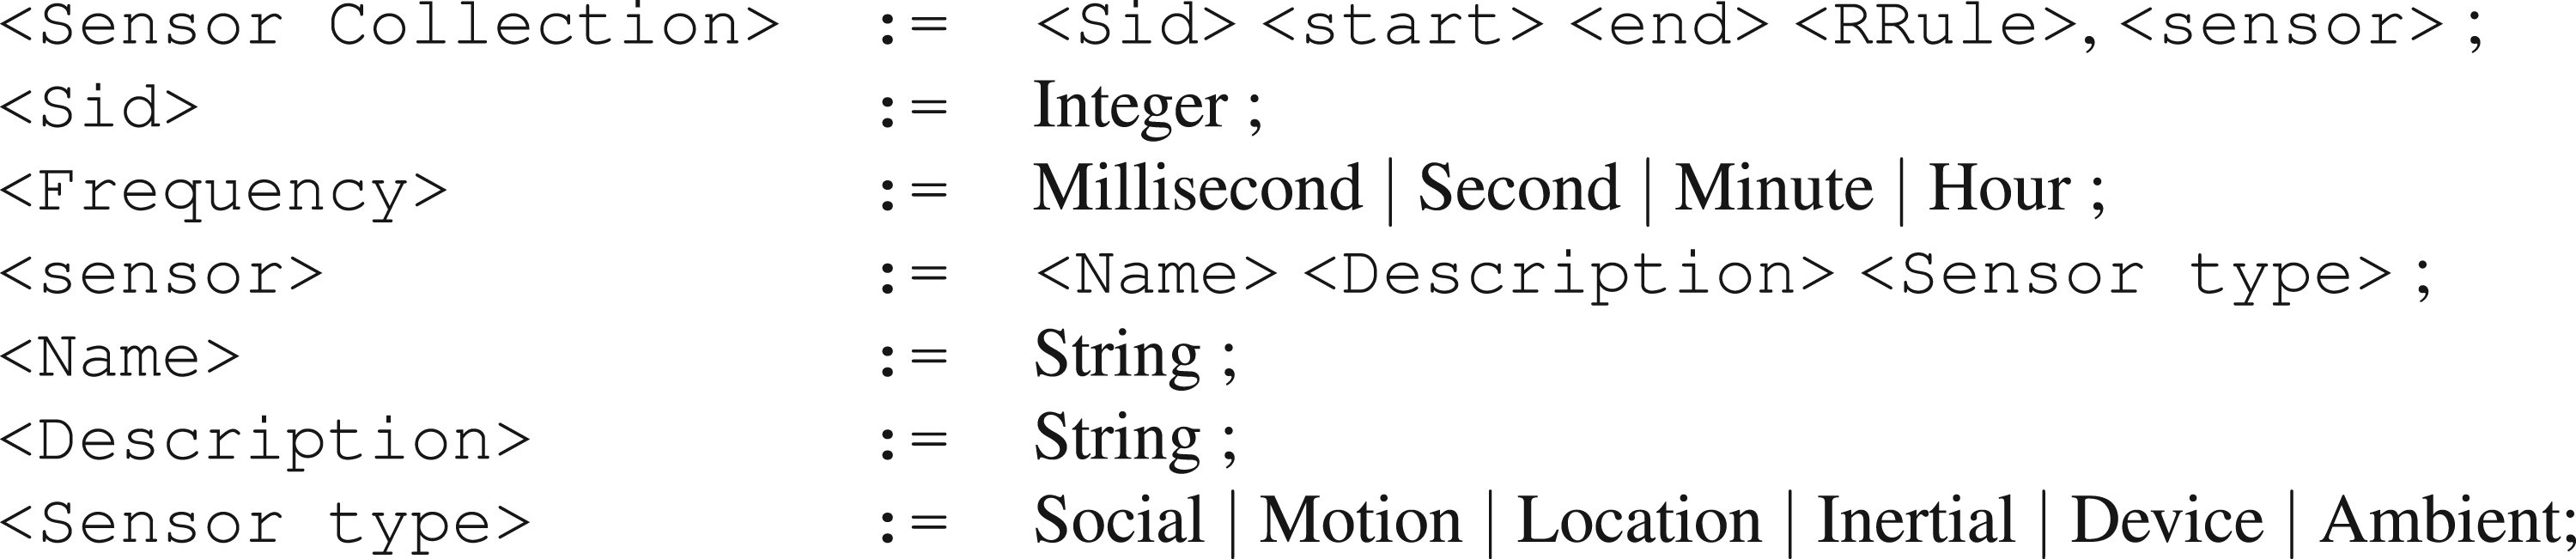
Sensor Data Collection.
Monitoring the data collection entails tracking how well an experiment is executed based on a comparison with a predefined experiment plan. The first main component for experiment control is iLog System Administration Component (ISAC), a tool which allows for the creation of the experiment plan/calendar. ISAC allows researchers; (1) to create the experiment plan; (2) to visualize the experiment Timeline where Researchers can see the entire study schedule at a glance, making it easier to plan and adjust various phases of the data collection process; and (3) to adapt the sampling frequency dynamically, thus adjusting the intervals at which data is collected or questionnaires are sent out. Figure 7 depicts ISAC when used to generate a question in the definition of the experiment plan. The information necessary includes all the elements of the BNF defined in the previous section and, in particular, name and description of the question, repetition frequency, available answer options, and scheduled day and time for sending it out. As a complement to ISAC, the platform features a component where the researcher can also set various parameters which then are use to rank the quality of the participants’ involvement in the experiment, see Figure 8. These parameters include: Maximum allowed number of unanswered questions, average maximum completion and response time. During the execution of the experiment, a participant’s performance can be ranked as
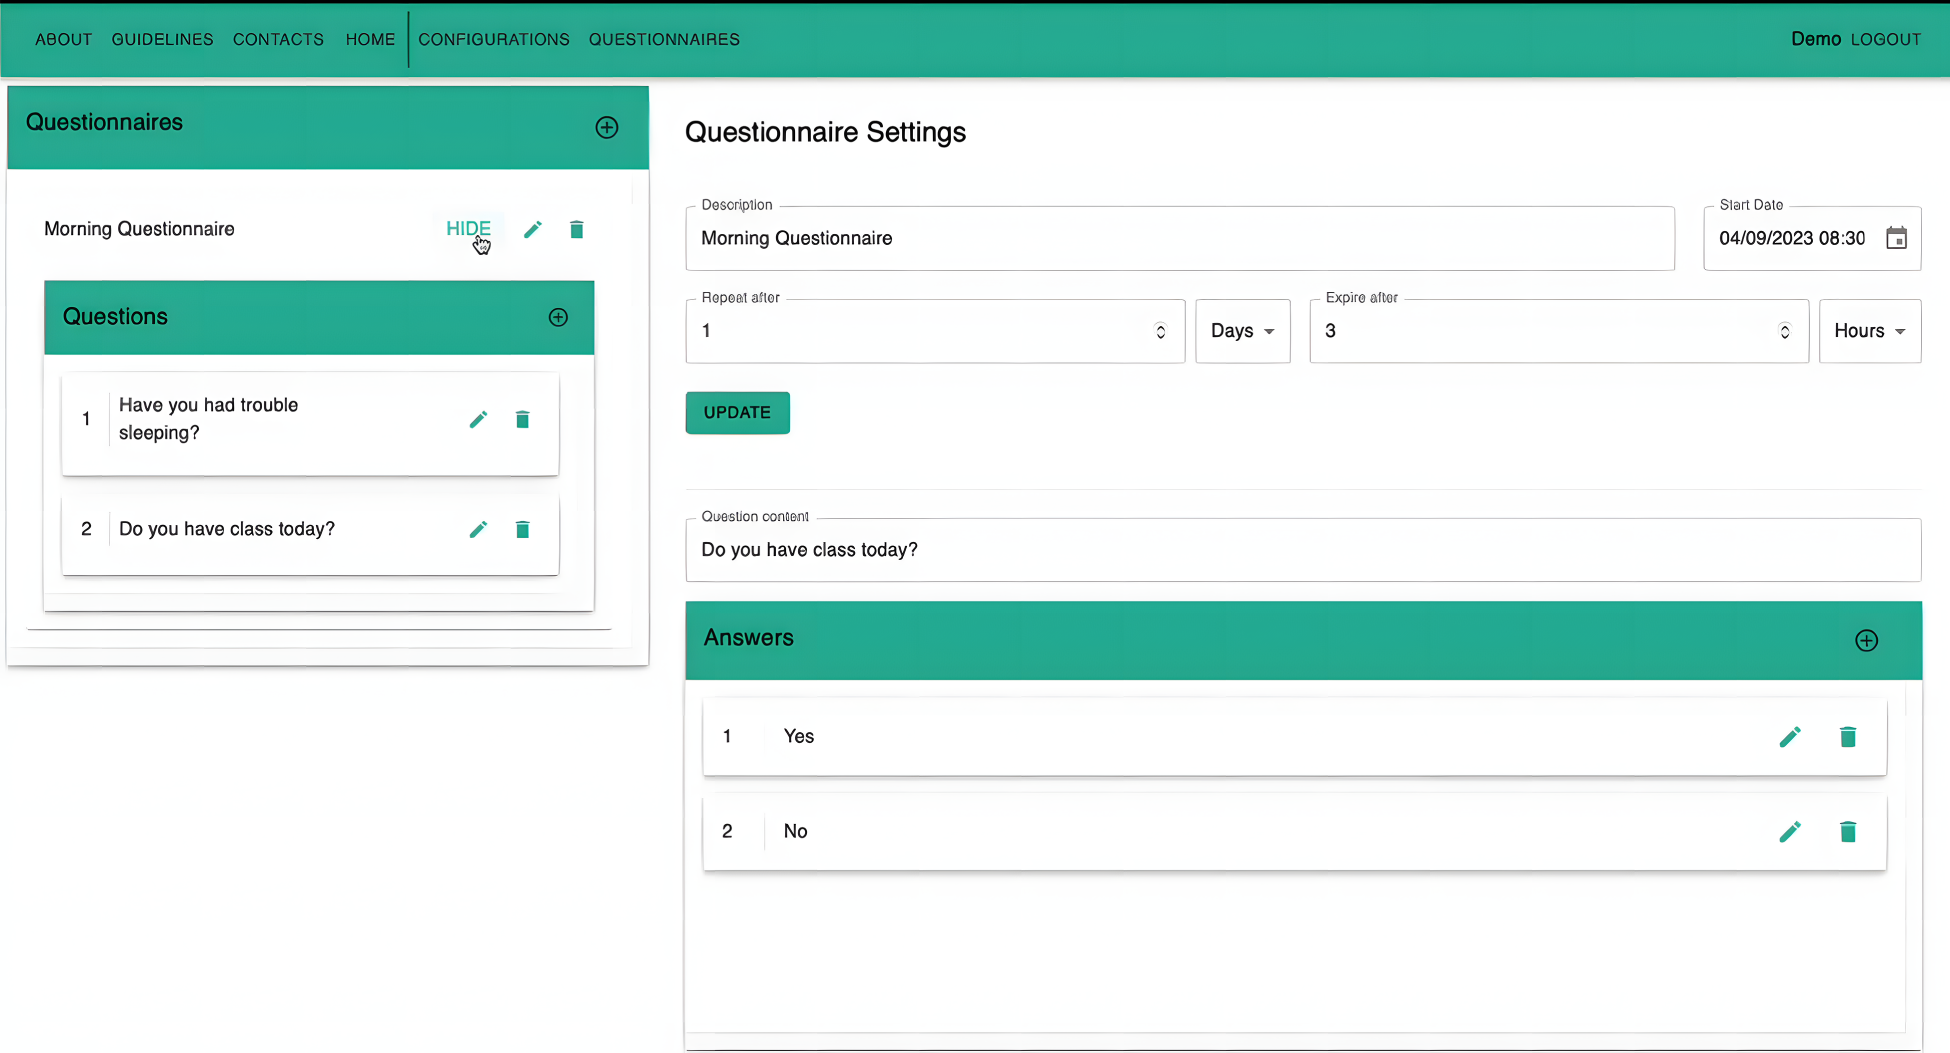
Using iLog System Administration Component (ISAC) to Generate a Question.
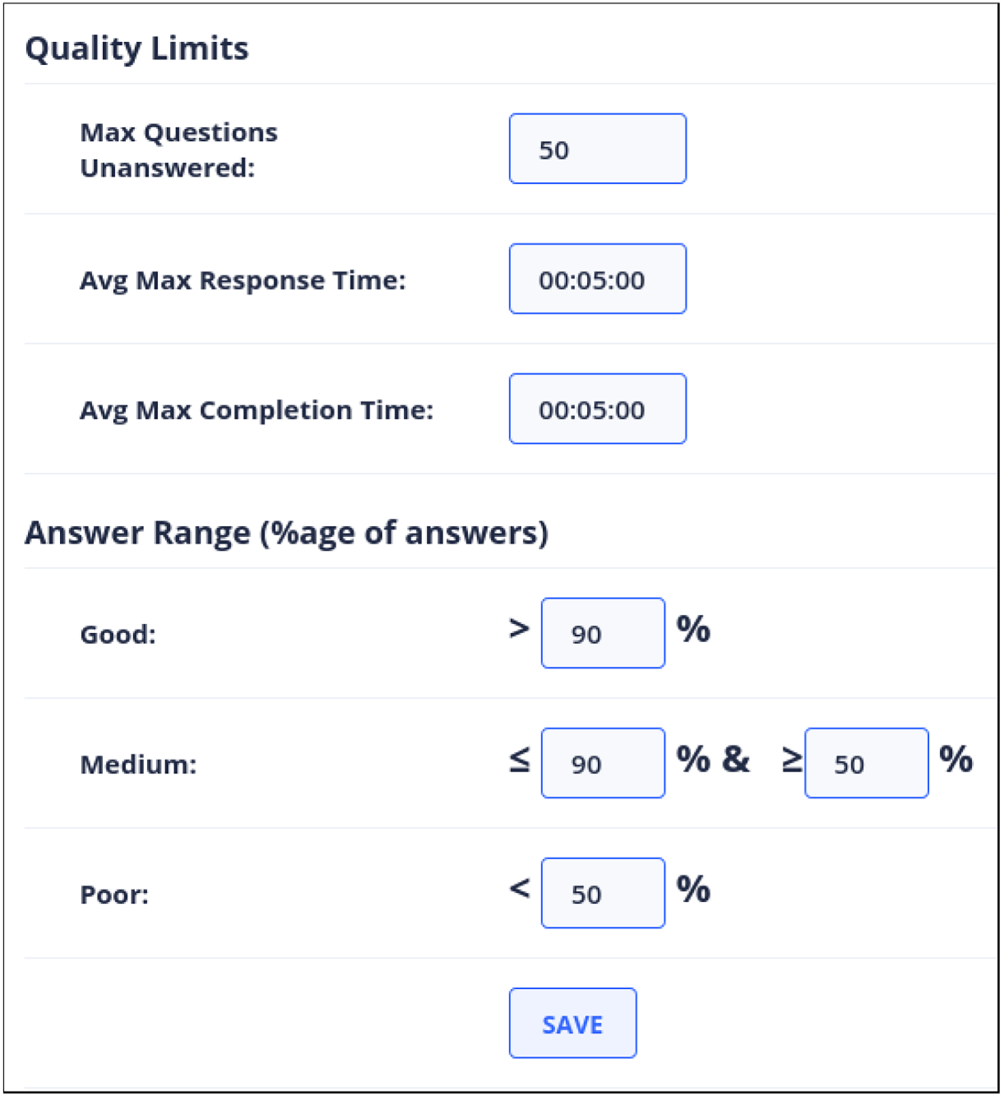
Quality Parameters Used to Rank Participants.
The second main component is a dashboard which enables researchers and participants to efficiently track the progress of the experiment execution. It provides real-time insights and control, ensuring that researchers maintain the quality and integrity of the data collection process while also supporting the participant engagement and compliance. This includes tracking both sensor data and responses to questions made by participants. Key features include:
Live Data Feeds. This module allows researchers to view the incoming data as it is collected, providing immediate visibility of the participant activity and data trends in real-time. Compliance Tracking. This module displays participant compliance rates, showing who is completing the required tasks (answering questions) and who might be falling behind. This allows researchers to quickly identify and address potential issues. Data Quality Checks. This module consists of a set of algorithms which discover possible participant misbehavior and/ or errors in the data. This is used to notify researchers and also participants so that they can take corrective actions promptly. Advanced Analytics. It incorporates data filtering techniques that enable researchers to conduct real-time data analysis, swiftly discovering trends and creating insights. Here, the user is presented with the quality parameters set by the researcher (see Figure 8). The researcher can modify them by calling the module mentioned above, while the participant can only view them. This section is a summary of the number of participants in the experiment in real time. This section is visible only to the researcher. This section reports the progress of the experiment, in terms of the number of days covered or left. Question delivery is key when monitoring an experiment. This section shows the level at which questions are being delivered to the user. For any experiment, the number of answers given affects its overall quality. The researcher is presented with an average of all the answers in the experiment, whereas participants view a summary of their answers. As with questions and answers, the sensors section helps the user understand the sensors being collected. The frequency of collection is also reported.
The main interface of the dashboard is reported in Figure 9. This is the main interface presented to the user when (s)he logs in. In 9 we can identify (left to right, top to bottom) the following elements:
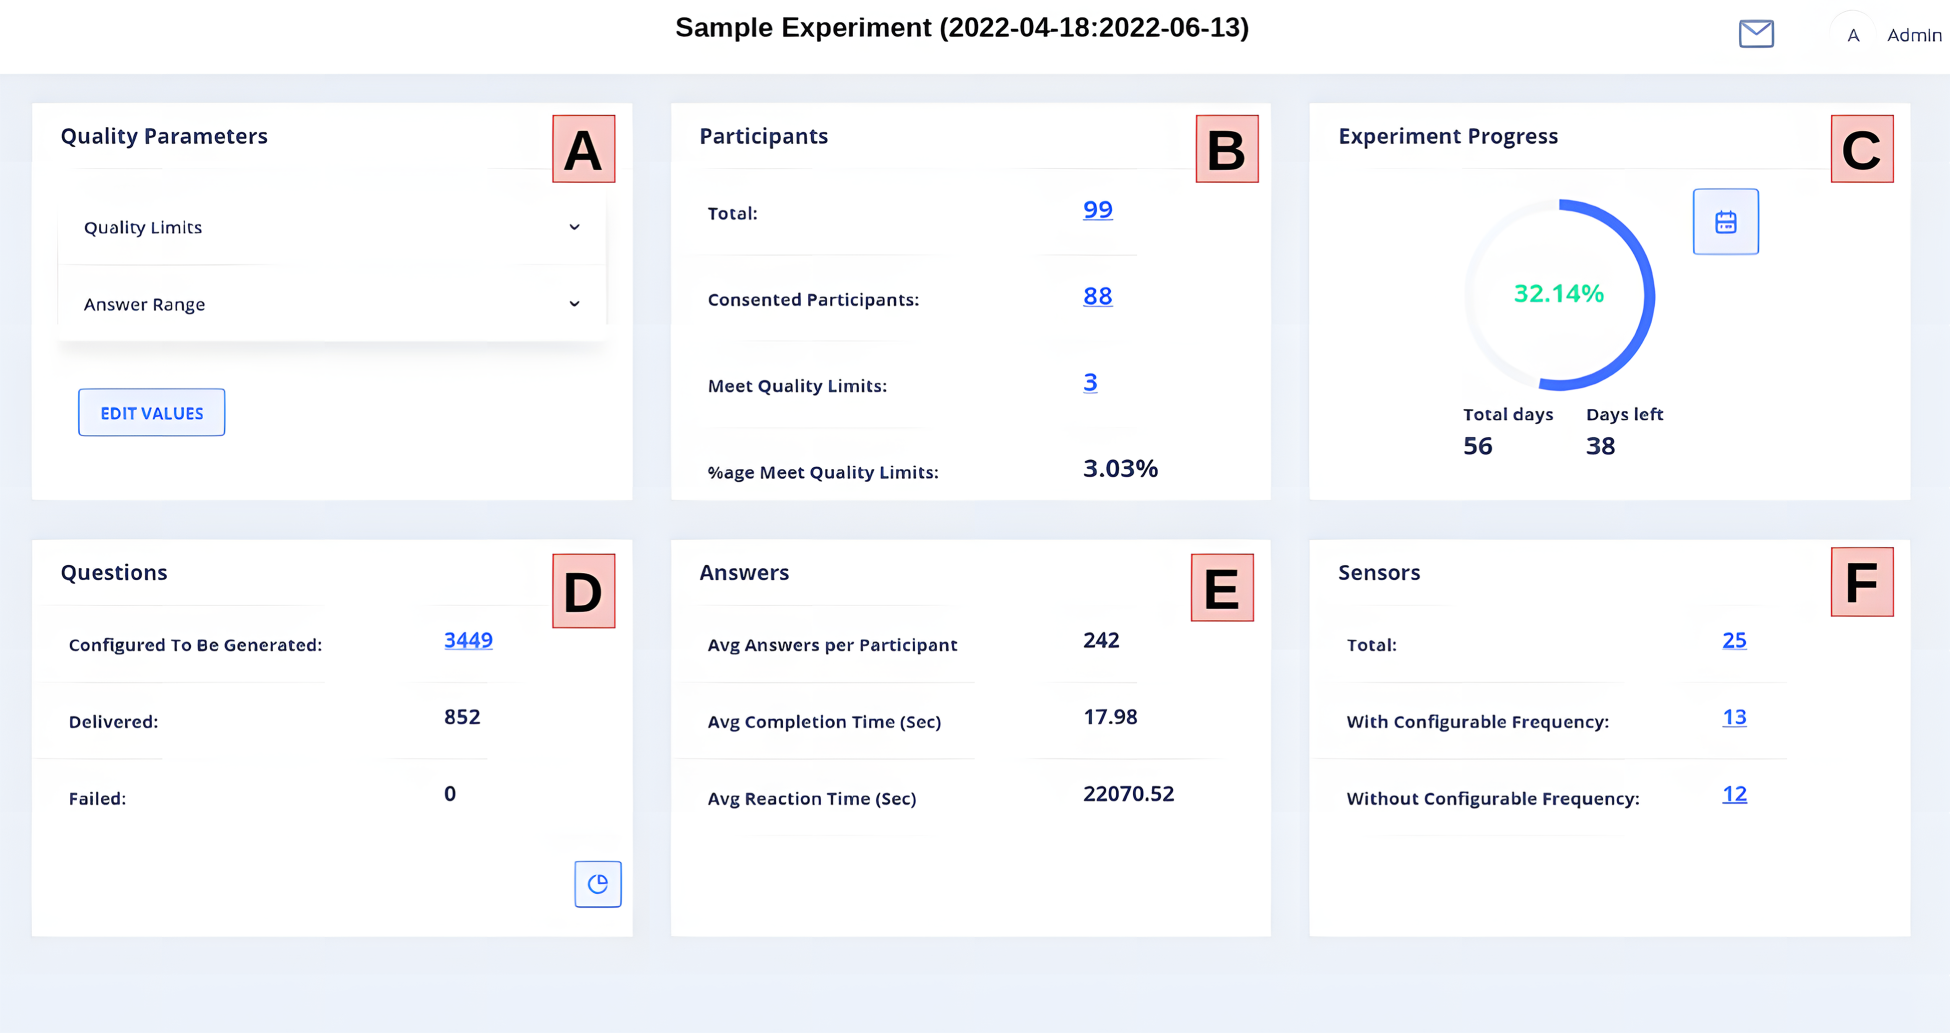
Dashboard: Summary of an Experiment.
The dashboard main view is integrated with various other additional visualizations which focus on specific aspects of the data collection. For instance, Figure 10 displays a heatmap of the participants’ responses from each experiment day, with green denoting participants with a high answer rate and yellow denoting those with a low answer rate. Participants are represented on the
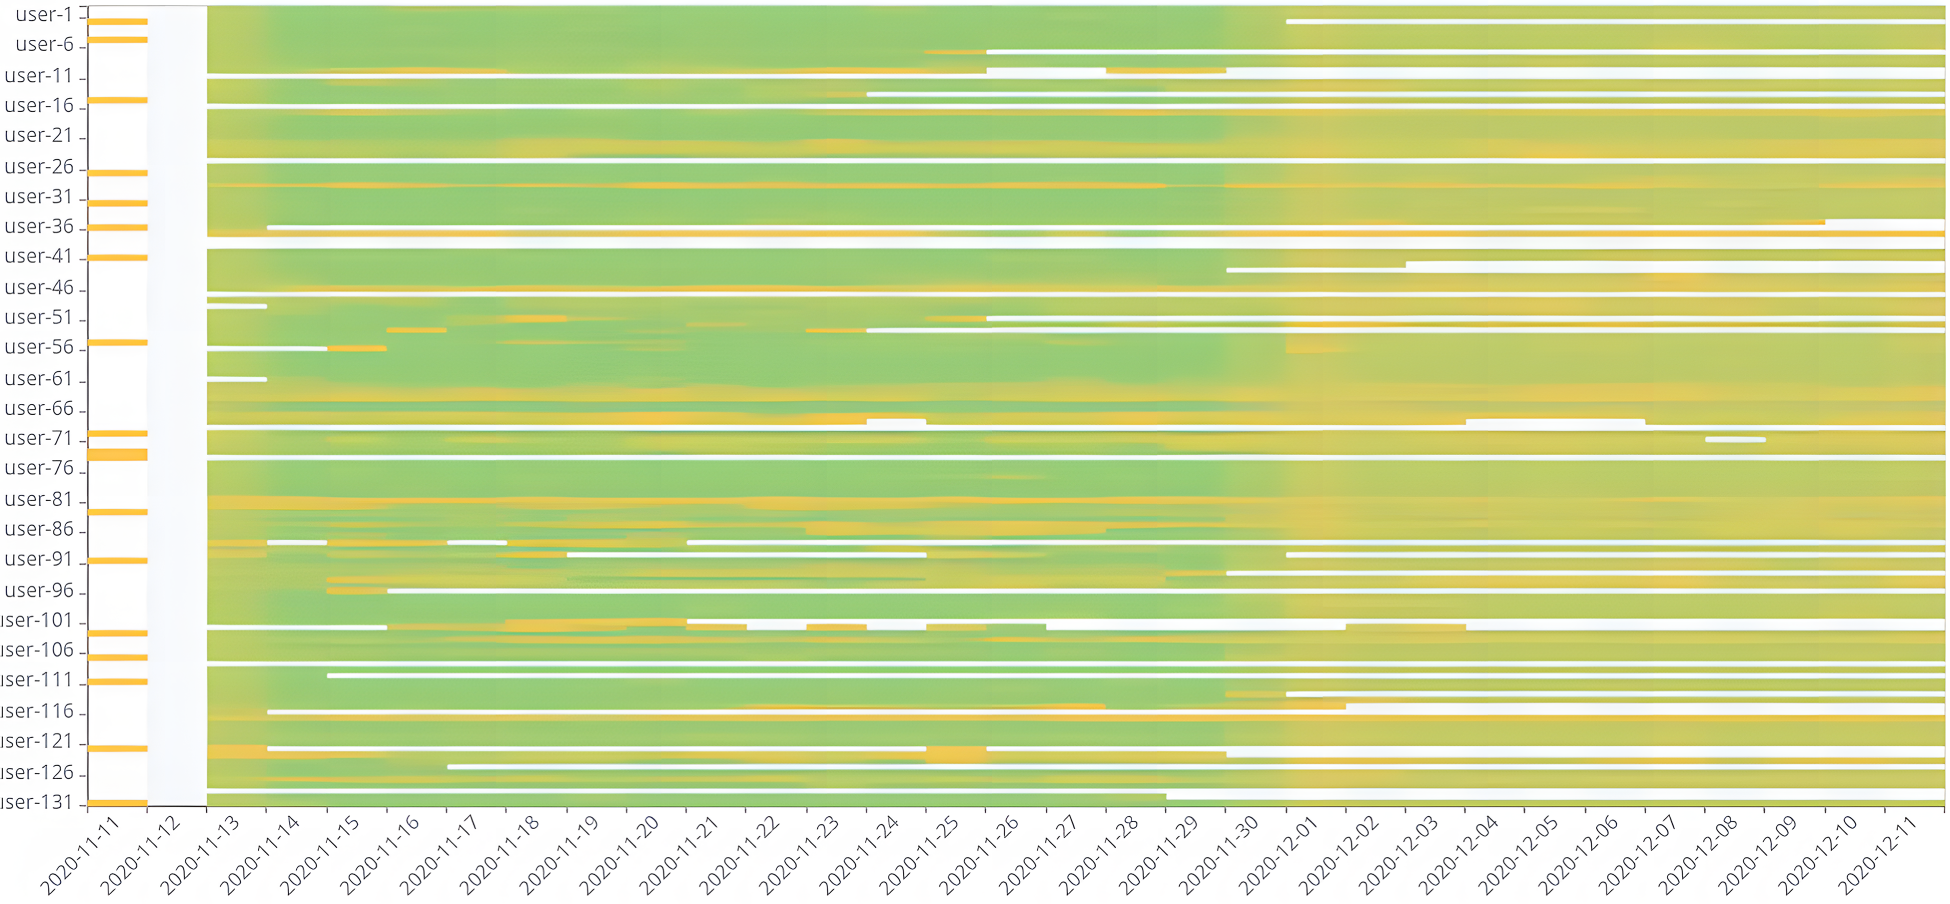
Heatmap of Participants’ Answers per Day.
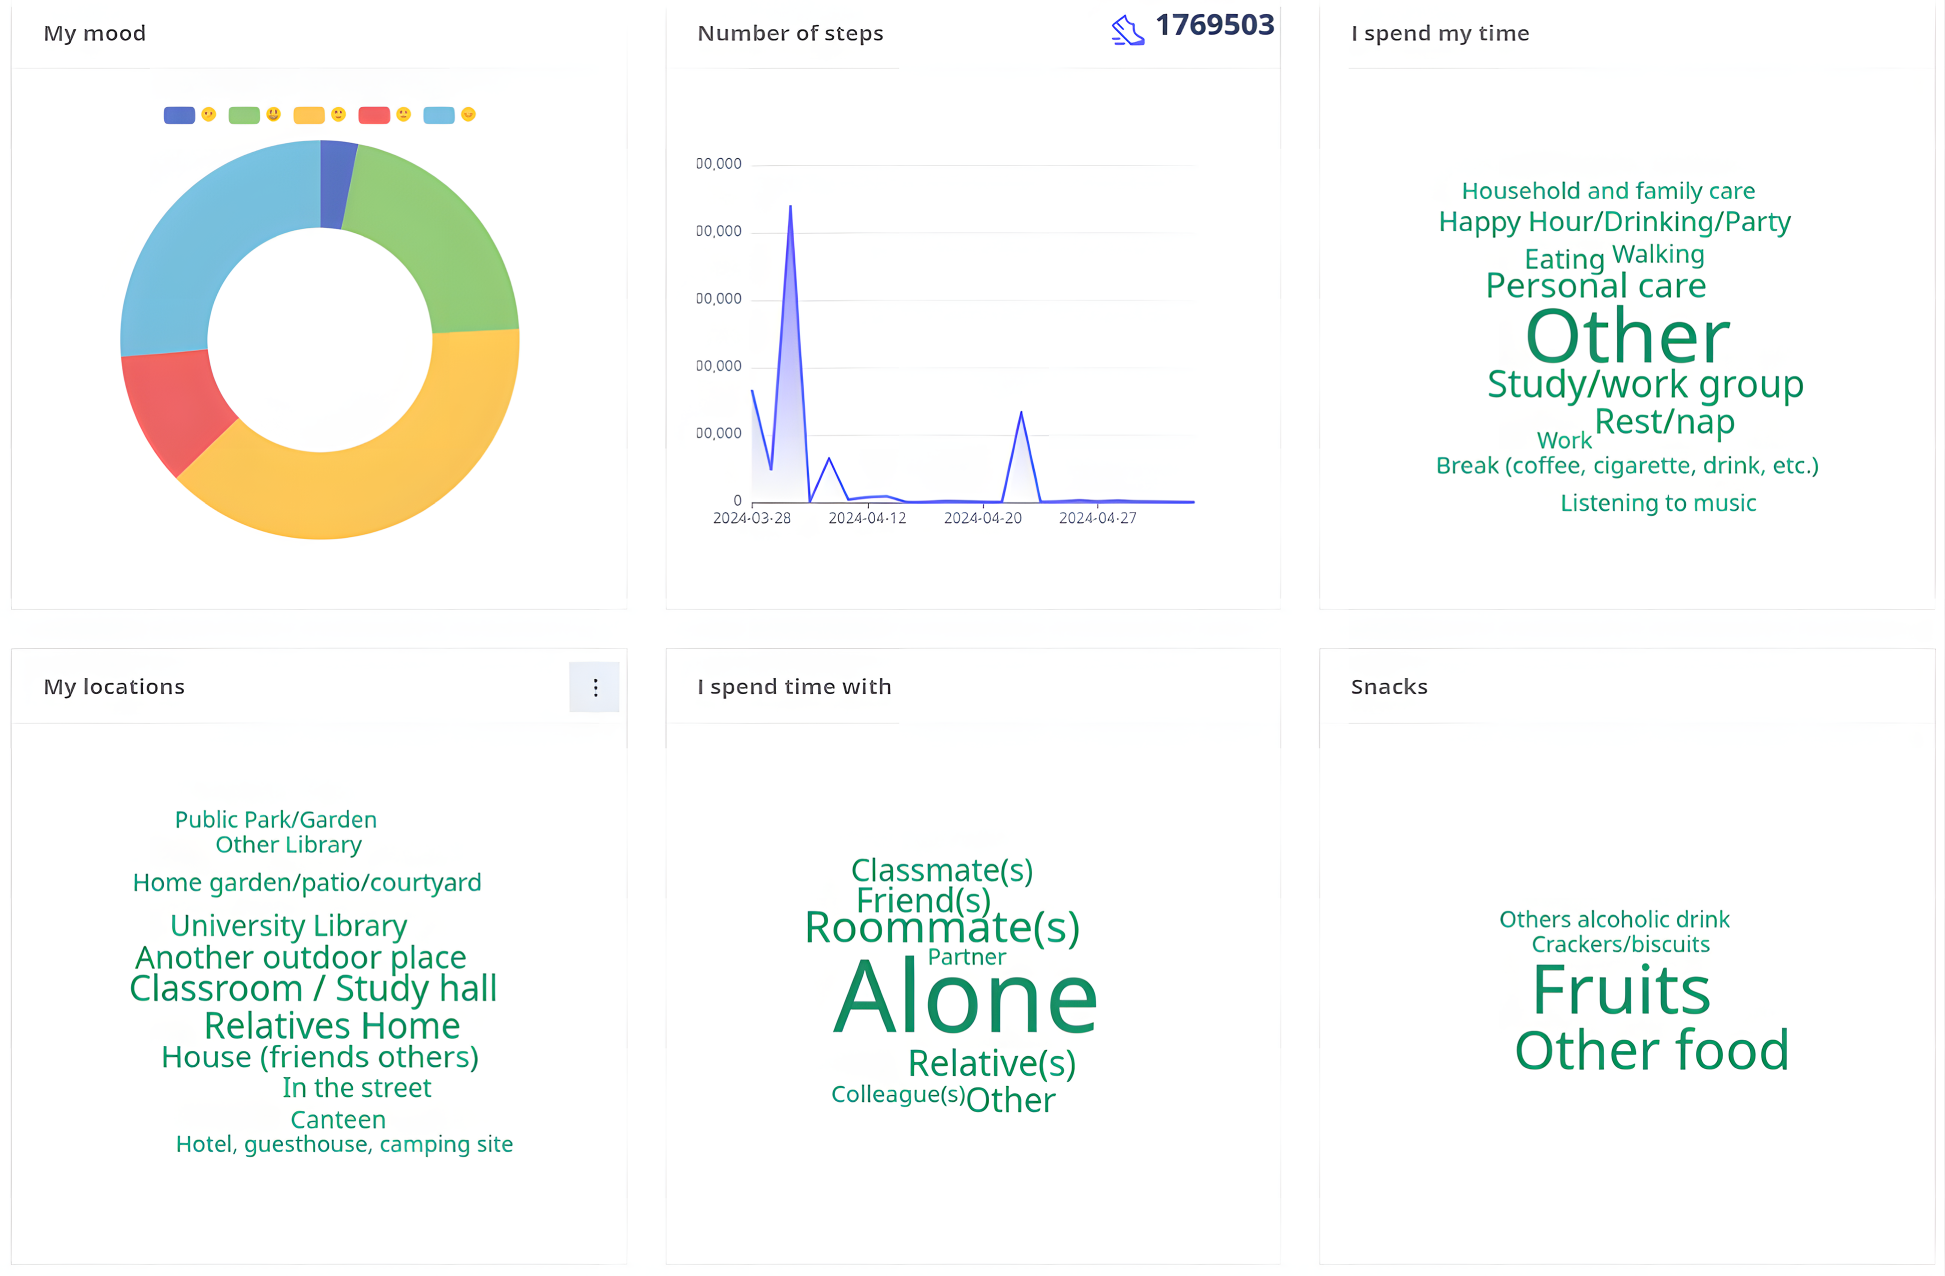
A Participant’s Data as Seen from the Dashboard.
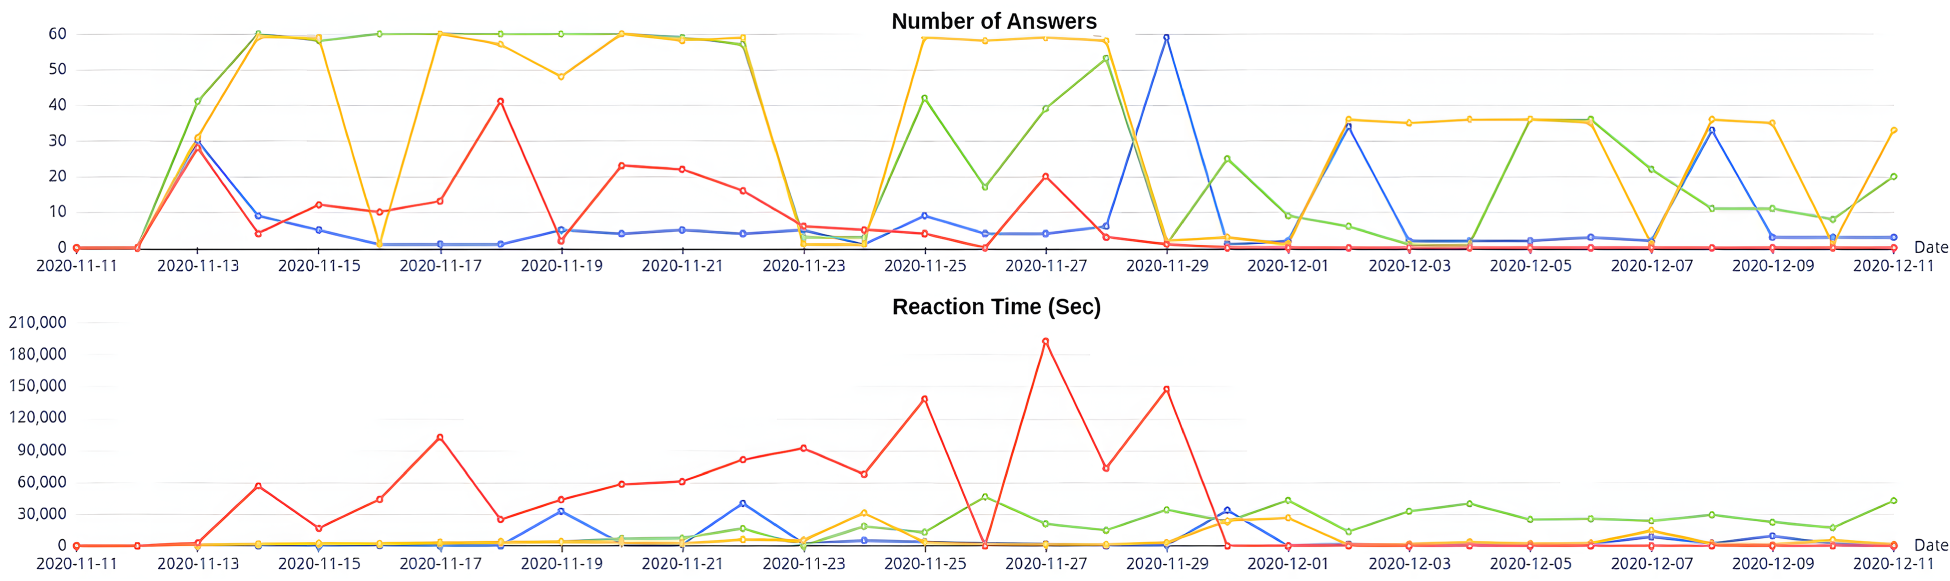
Comparison of Answering Behavior of Three Other Participants.
We are interested in collecting context information via smartphone questions. However, these questions, when asked frequently, can become intrusive, especially when they interrupt users during periods of activity or when in mobility. As a consequence, the quality of the answers from humans is not always as high as needed. Users often do not read, or do not answer, or provide wrong answers to machine-asked questions, or turn-off their data collection APP, and more; see, e.g., Bison et al. (2024); Bontempelli et al. (2020). This problem can arise from various factors (Furnham, 1986), such as recall bias, where participants do not accurately recall previous activities (Porta, 2014), missing or incorrect responses (Bison et al., 2024; Schneier, 2015). And it becomes particularly acute when one tries to scale the collection of big-thick data to (life) long, human-in-the-loop human-machine interactions (Bontempelli et al., 2022), that is, the applications which motivate the work described in this paper. To address these challenges, it is essential to develop methodologies that not only optimize the timing of questions to minimize interruptions but also improve the overall quality of the responses collected.
By answer quality, we focus here on the number of correct answers, rather than on the number of missing answers. As already mentioned in Section 3, the state of the art suggests that the quality of answers is influenced by reaction time (Bison & Zhao, 2023; Bison et al., 2024; van Berkel et al., 2019). The shorter the reaction time, the higher the quality of answers, a factor also aligned with the recall bias theory. The aim of this section is to describe a ML component, exploiting the notions of situational and temporal context described above, capable of learning when to ask a question so that to minimize the reaction time. The proposed ML algorithm exploits the following information:
Temporal context. We consider the day of the week, represented numerically from 1 (Monday) to 7 (Sunday) plus the Hour of the day. organized in four time periods: Morning (6 AM to 11 AM), Afternoon (12 PM to 5 PM), Evening (6 PM to 11 PM), and Night (12 AM to 5 AM). Situational context. We consider the answers to the three questions ”Where are you?” (the spatial context), ”What are you doing?” (the activity context), and ”Who are you with?” (the social context). Demographics. We consider information is consistently used to characterize individuals through ascriptive and acquisitive traits (Blau & Duncan, 1967). Namely, we used the gender, degree and department of each participant.
All the three dimensions above play an important role on the answer quality. As an example, we report below the statistical analysis results of the spatial context, social context, and temporal context.
For instance, as shown in Table 5, high-quality answers constitute a minor fraction of 28.87% in restaurants or pubs. In contrast, in academic settings such as classrooms or university libraries, high-quality answers constitute 52.02%. Focusing on low-quality answers, restaurants have the highest percentage of low-quality answers at 71.13%, likely due to the relaxed and enjoyable atmosphere, the participant would not pay attention to the questions, which led to incorrect answers. Friends’ houses rank third with a low-quality answer percentage of 70.24%, as visiting friends or attending social gatherings often leads to positive interactions and experiences, inducing not to focus on the smartphone questions.
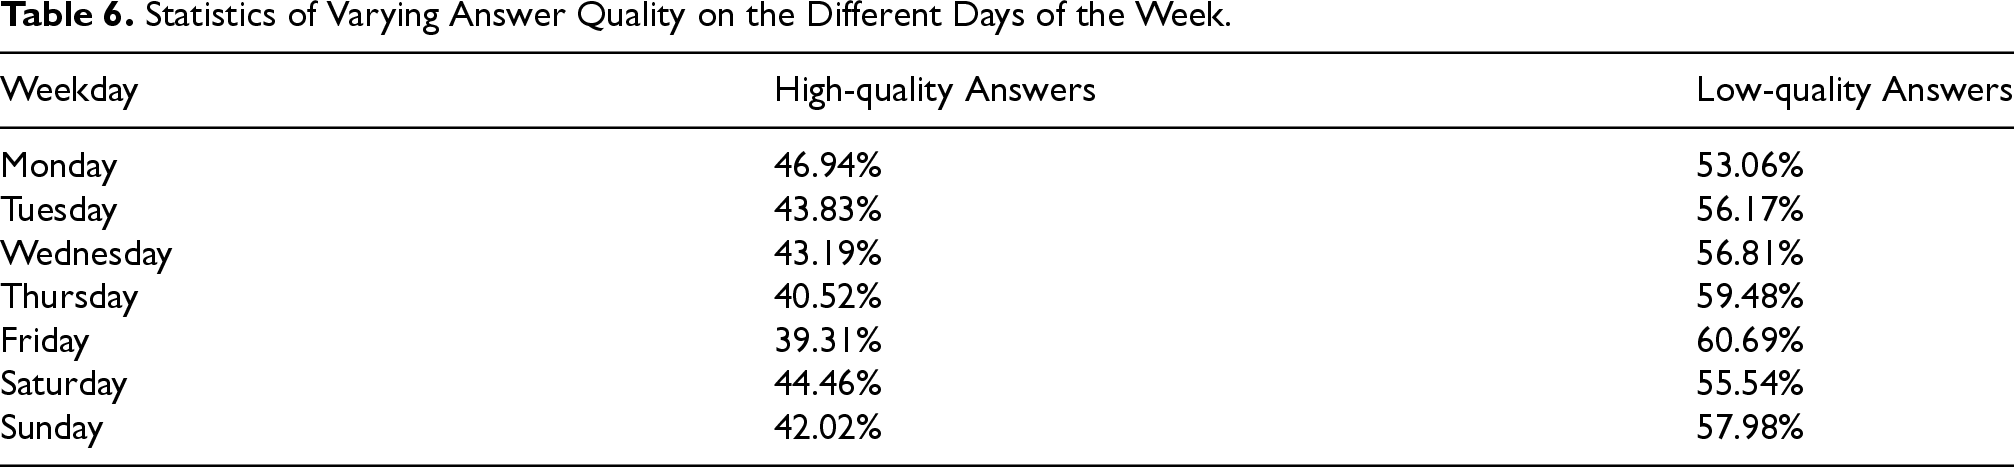
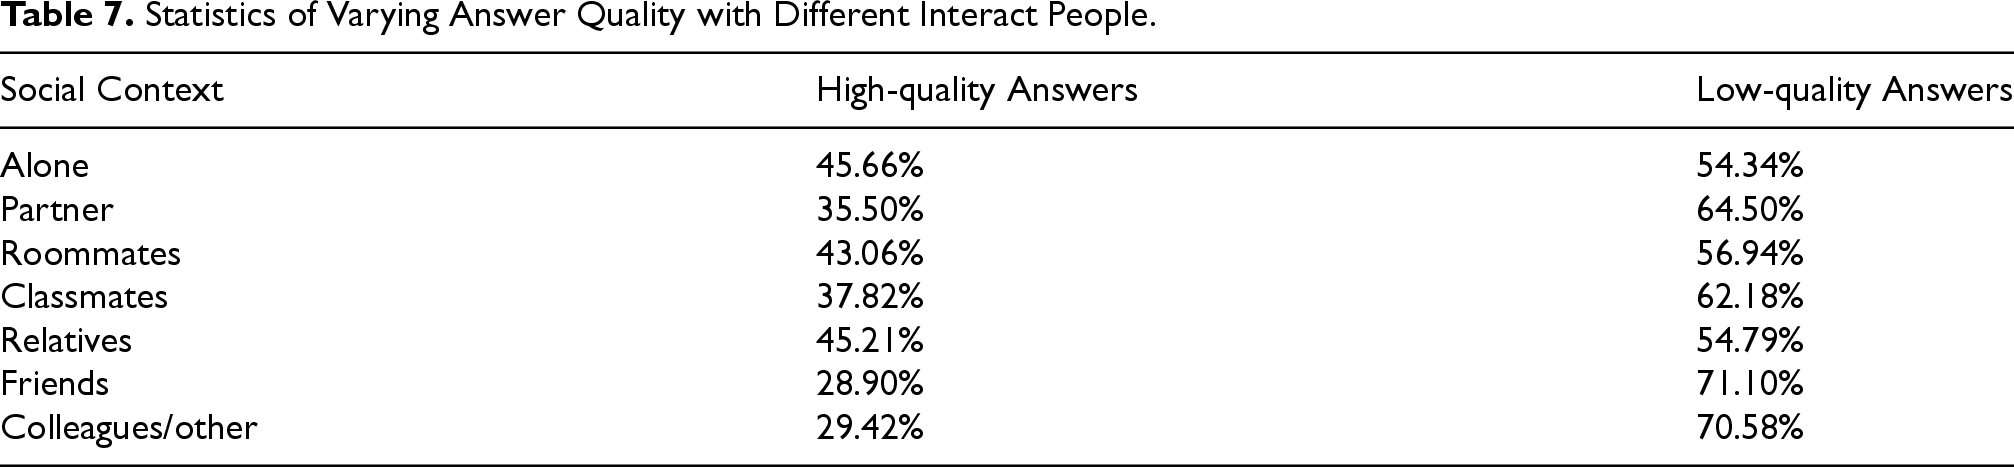
If we move to the temporal context and analyze the data collected during the 28 days of the experiment, we can distinguish various distinct patterns across different weekdays, as shown in Table 6. Specifically, high-quality answers are most prevalent on Monday (46.94%) and Saturday (44.46%), with the lowest incidence observed on Friday (39.31%). Conversely, the incidence of low-quality answers peaks on Friday (60.69%) and Thursday (59.48%). These findings suggest a correlation between the day of the week and answer quality states. Notably, the onset of the workweek and weekend (Monday and Saturday) witnesses a relative surge in high-quality answers. Similar considerations can be made for the social context, see Table 7.
Statistics of Varying Answer Quality at Different Locations.
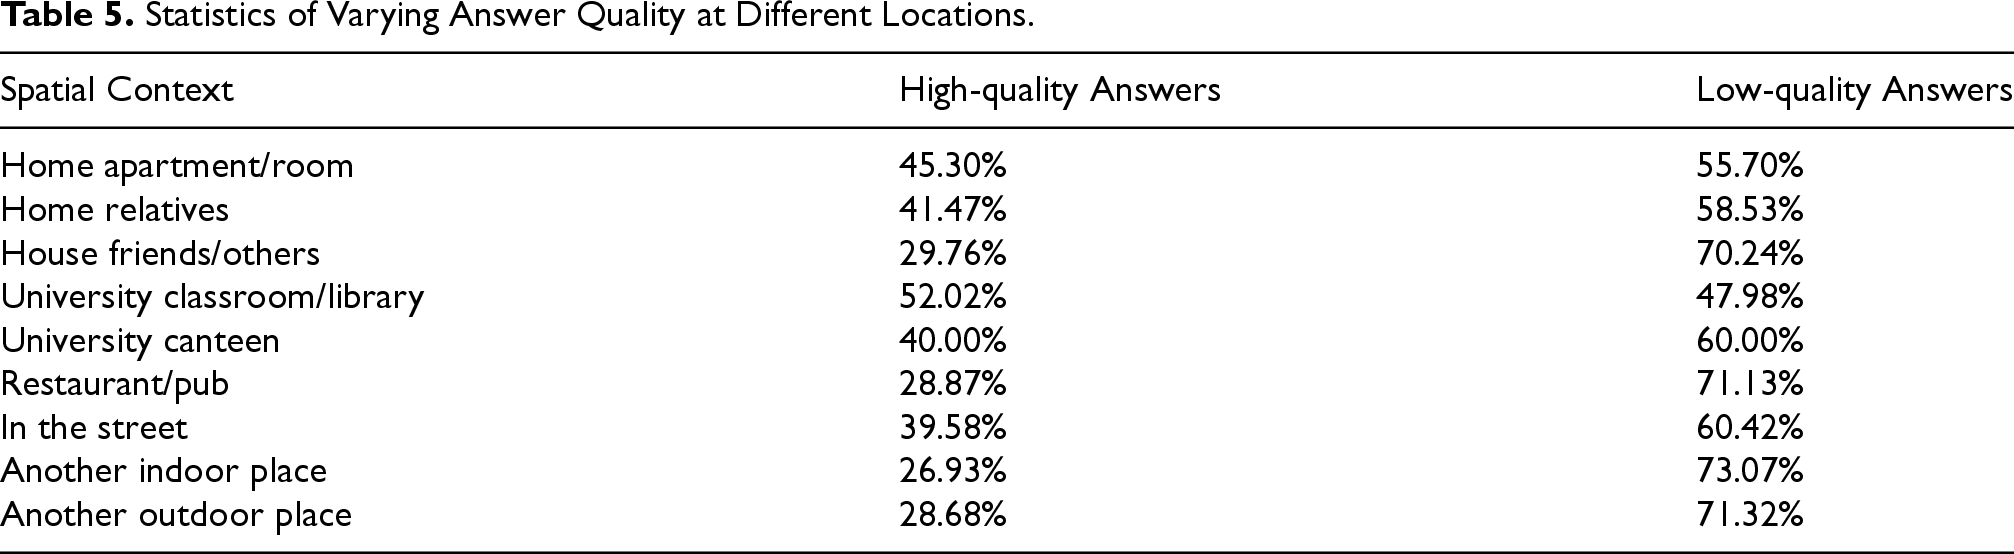
Statistics of Varying Answer Quality at Different Locations.
Statistics of Varying Answer Quality on the Different Days of the Week.
Statistics of Varying Answer Quality with Different Interact People.
As part of the flexibility that the platform provides, we can apply various ML models on the data collected. As from Table 8, in this work we have used random forests (RF), K nearest neighbors (KNN), logistic regression, support vector machines (SVM), and Gaussian Naive Bayes. The classifiers were trained using 5-fold cross-validation on the comprehensive training and testing sets for all participants, with 80% of the data allocated to the training set and the remaining 20% to the testing set. The goal was to predict whether the participant would answer the question within 30 minutes, this being the time within which the answer is most likely to be correct, as from Bison et al. (2024). As depicted in Table 8, RF surpassed the other four classifiers, achieving a prediction accuracy of 0.758. These ML results demonstrate that our component can effectively predict if the participant can answer questions within 30 minutes, thus predicting answer quality based on the context information collected through questions and sensors. The RF classifier has been selected for the next step, which was to predict the answer quality for each participant. Focusing on each specific participant, we used their first two weeks of data to train the RF algorithm and then predicted their answer quality in the subsequent two weeks. As illustrated in Figure 13, the accuracy of answer quality predictions varies for each participant. In this figure, the Participant 244 demonstrated a high prediction accuracy of 88.61%. This participant consistently provided high-quality answers during the periods identified by the algorithm. This participant was most of the time alone and at the university. Participant 30 showed a moderate prediction accuracy of 77.55%. The variability in the context information contributed to the fluctuations in answer quality. This participant always provided a lot of different context information in different places and activities, which made it hard to predict. Participant 137: Exhibited the lowest prediction accuracy of 65.89%. This participant provided a non negligible number of wrong answers, e.g., driving while being in the University classroom or in the library.
The overall conclusion is that we have a good average level of predictability which does not decay much in the worst case, with very good results in the best situations.
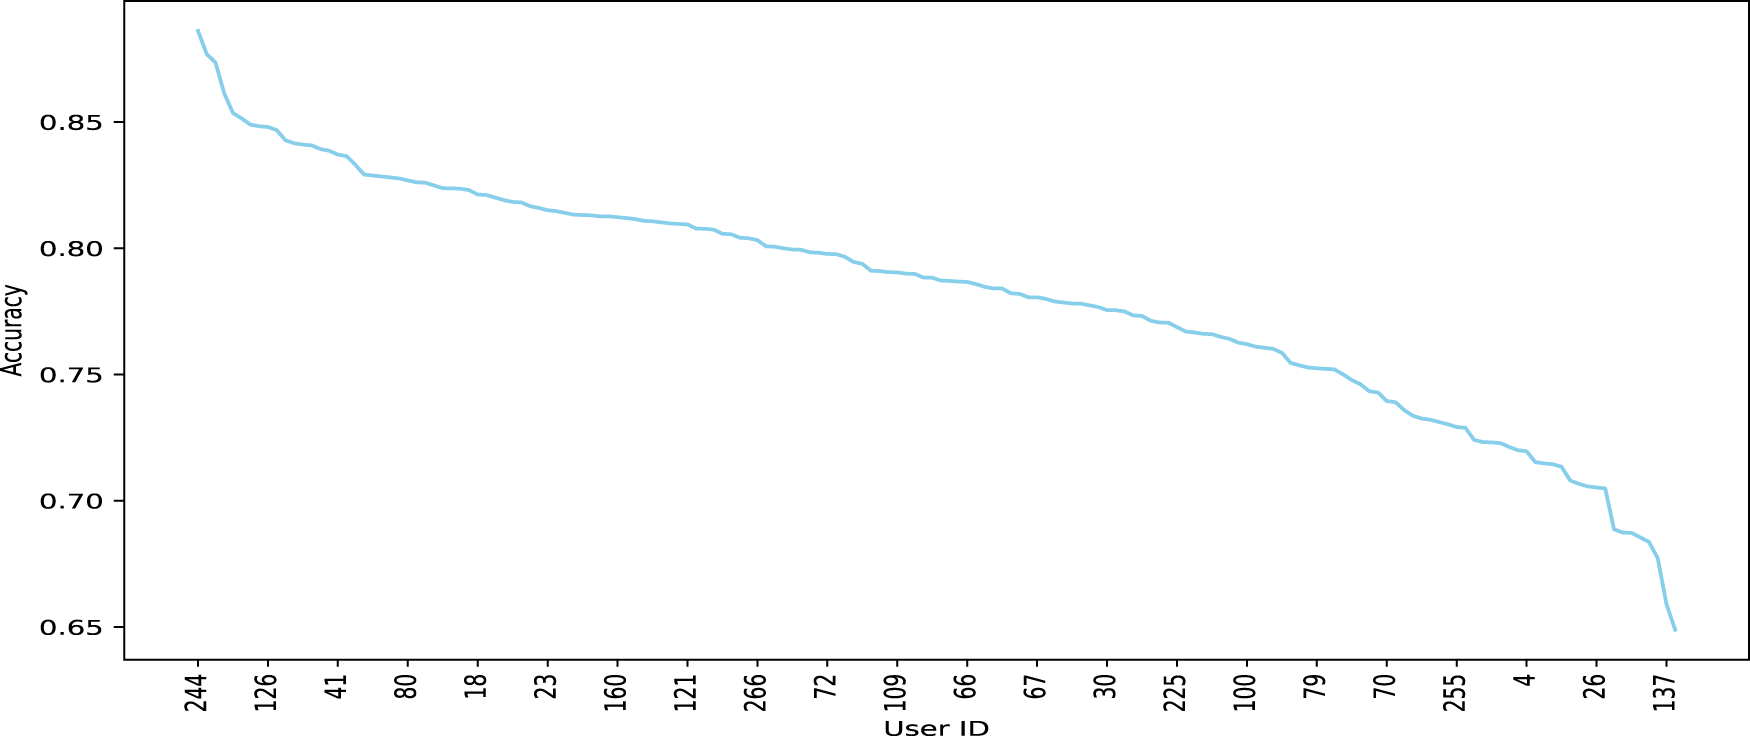
The Prediction Results of Each Participant, with Some Participant Ids Made Explicit.
Prediction Answer Quality Results of Different Machine Learning Classifiers.
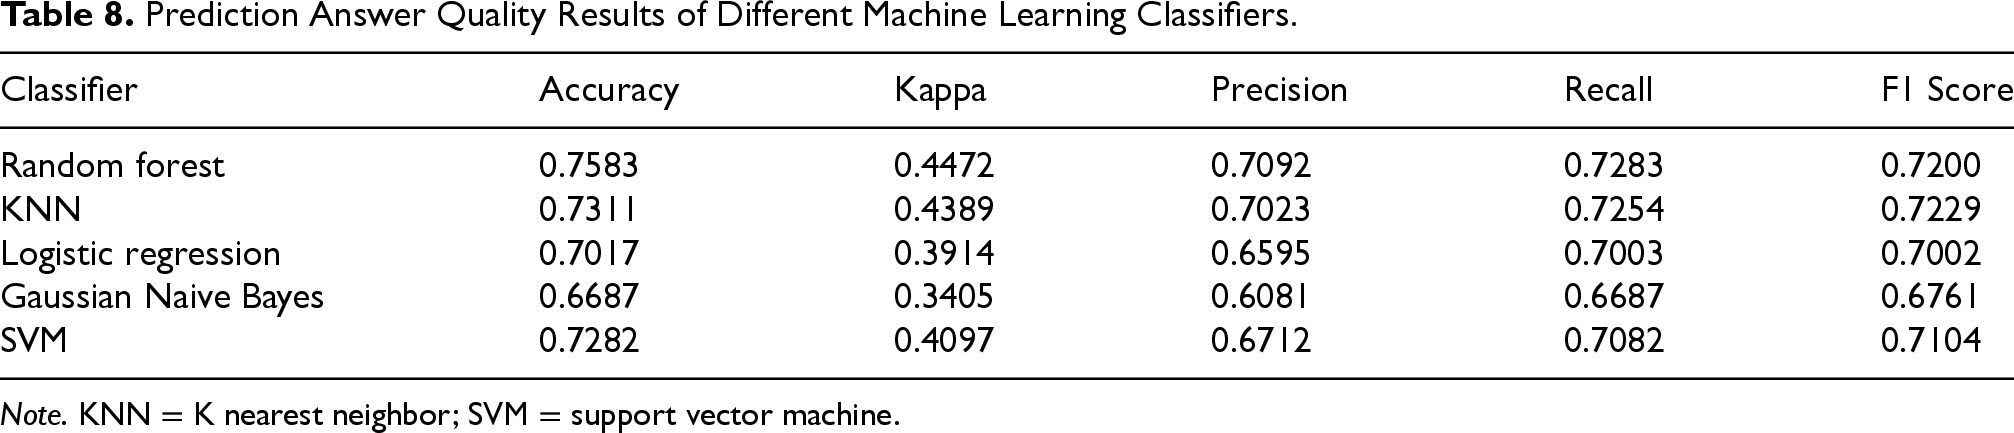
Note. KNN = K nearest neighbor; SVM = support vector machine.
This paper introduces a novel methodology and platform, an enhanced version of the iLog APP, for the collection of large-scale sensor data and qualitative human feedback. Our main contributions are as follows:
a language for modeling the situational context based on five key dimensions, that is: spatial, temporal, internal, social, and utensil; a language for modeling the temporal context, thus enabling a precise scheduling, still very flexible and modifiable during experiment execution, of the various aspects of the data collection; a dashboard component which enables both researchers and participants to edit and monitor the progress of the experiment plan as a prerequisite for enhancing the quality of the data collection; a ML component which allows the platform to infer about the best moment to take action, for instance, to ask a question.
We foresee two avenues for future research. The first is the exploration of ways to validate and verify the user responses and reduce the burden of answering questions. To address this issue, the starting point will be the work on Skeptical Learning (Zhang, 2019; Zhang et al., 2022) which allows handling of mislabeling in personal context recognition. The second is the validation of the methodology of the platform in other domains with a specific interest in health and entertainment.
Footnotes
Acknowledgment
The authors are grateful for the interactions and feedback from the people working in WeNet.
Funding
The author(s) received the following financial support for the research, authorship, and/or publication of this article: The research by Fausto, Ivan, and Leonardo were funded by the European Union’s Horizon 2020 FET Proactive project “WeNet–The Internet of us” (
Conflicting Interests
The author(s) declared no potential conflicts of interest with respect to the research, authorship, and/or publication of this article.