
Abstract
In this article, we present an approach to enrich transformers with additional information for general classification tasks given a set of relevant helper labels. We investigate whether the addition of preselected emotions as relevant helper labels can improve sentiment classification using BERT and DistilBERT. This method generates zero-shot labels like emotions for sentiment, and uses them as auxiliary text and classifier inputs to contribute to the final sentiment prediction. The approach has shown improvements in F1 score primarily for small datasets (1,000–50,000 samples). We also found that large, difficult-to-improve datasets such as the Sentiment140 dataset, with 1.6 million samples, also benefited from our approach. We tested the improvements on a smaller dataset, specifically an airline dataset comprising over 11,500 samples, and on subsamples of the Sentiment140 dataset with sizes ranging from 500 to 50,000. We conducted an ablation study on the zero-shot labels, which indicated that more labels generally improve the model. Our results show improvements in all cases over the original model for both BERT and DistilBERT when tested with added emotion inputs generated from zero-shot pretrained models.
Introduction
Natural language processing (NLP) is advancing rapidly, owing much to the development of the transformer model (Vaswani et al., 2017). This model employs an encoder–decoder architecture to process tokenized text with attention. Currently, transformers set the state-of-the-art in many NLP tasks. In this article, we propose an approach that can be generally applied to transformer models with the potential to improve NLP classification tasks in general conditioned on the selection of relevant labels to generate semantic information. Specifically, we propose a zero-shot (0-shot) approach for emotion label creation and apply this to sentiment classification to investigate whether adding more semantic information can improve the predictions. Although applicable to larger datasets, the approach notably enhances performance in smaller datasets, particularly those with 1,000 to 50,000 samples. Sentiment classification on individual samples can be employed to monitor user comments on platforms like social media, direct sales messaging, automated review scores, and more. It can also be utilized to understand the overall sentiment from a user’s history of comments or even the public sentiment on topics such as politics or world events, based on social media scraping.
Usually, sentiment classification involves predicting a positive or negative label, with some datasets including a neutral option. In our study, we solely focus on sentiment classification using positive and negative labels, since our dataset is labeled for binary classification. While our approach uses emotions to improve sentiment classification, it has the potential to be extended in general by carefully selecting relevant labels for the task. For instance, one might use a hierarchical approach to utilize simpler emotions to help generate more complex ones, or combine writing style, publication type, and sentiment to predict the topic, or use advertisement styles, phishing indicators, and requests for links/payments/personal information to detect spam. This methodology can also apply to emotions/sentiment for predicting review ratings or urgency in customer support contexts, among other applications.
Our approach uses unsupervised 0-shot generated data making our approach widely applicable. Our article also focuses on inserting additional information using helper labels like emotions generated in an unsupervised fashion. Emotion classification aims to predict emotion labels for text rather than a general sentiment. Emotions such as joy, anger, neutral, disgust, fear, sadness, and surprised are commonly used among other less common emotions like love, hate, worry, and relief. Relevant datasets can be found at the following sources 1 2 3 4 (Chatterjee et al., 2019; Demszky et al., 2020; Saravia et al., 2018). Emotion classification datasets are often limited in size and suffer from extremely unbalanced labels, as well as the subjective interpretation of complex emotions by labelers. Many datasets feature only a handful of emotions and typically assign just one emotion per sample (see datasets for common emotion label usage (see footnotes 1 to 4) (Chatterjee et al., 2019; Saravia et al., 2018) (with perhaps a small exception to GoEmotions Demszky et al., 2020), but text can have a variety of emotions, each at different levels.
For emotions, the benefit of our approach is having a consistent and cost effective labeling entity. In terms of consistency, human labelers can classify the text differently from one another based on their interpretation of the emotions involved or their own reactions towards the text. The key difference lies in the writer’s intent, as seen in tasks like reviews, threat detection, and sarcasm, versus the reader’s interpretation, like in sentiment analysis and toxicity detection. Ambiguity can exist in layers, such as the variance between individual readers’ perceptions of the emotions involved, the distinction between the reader’s perception and the writer’s actual intent (and the reader’s interpretation of that intent), and foundational emotions present within the subject matter discussed (similar to a baseline of emotions). Although emotion ambiguity is not inherently incorrect, it presents challenges in modeling that, we believe, require a greater level of consistency.
The complexity of emotions makes it impractical to rely solely on datasets labeled with a single emotion. For instance, we explored an emotion dataset (in footnote 4) generated using the approach of Saravia et al. (2018), which includes single-labeled emotions: sadness, joy, love, fear, and surprise. We can find several instances of mislabeled text, however, some notably suffer from the previously mentioned ambiguity regarding reader’s interpretation vs the writer’s intent such as “i hate it when i feel fearful for absolutely no reason [FEAR]”. In this case, the label “anger,” reflecting the writer’s intent, was not available, while the reader’s interpretation might consider “sadness” over the chosen “fear” that is the baseline foundational emotion of the subject matter. In our perspective, a more effective approach to emotion labeling requires multiple labels per sample, a broad range of available emotions, and a varying degree of emotion representation in part of or the entire sample. For example, foundational emotions from the subject matter could be expressed at a low level while emotions from the reader’s interpretation can be represented at higher levels (we refer to this as levels of association). The inherent cause for existing problems in the single-labeled datasets is likely the cost associated with having human labelers create several emotion labels with varying levels of association at a large scale. Thus our proposed approach can help mitigate these issues using an automated labeling system.
We aim to improve sentiment predictions using fuzzy emotion labeling by incorporating them as tabular data inputs to transformers using 0-shot models. 0-shot models are often inaccurate and lose utility with their fuzzy low quality labels. On the other hand, transformers are pretrained on extremely large amounts of data. We utilize transformers and their pretrained abilities for 0-shot knowledge to embed information to our tasks. By improving emotion labeling to accommodate multiple emotions and a range of emotion levels, without restricting which emotions we can use, we can apply these labels to sentiment classification. Moreover, we improve on the speed and cost associated in label creation compared to human labelers. This allows the model to consider a broad spectrum of emotions when directly classifying sentiment. Furthermore, auxiliary helper labels can be applied generally to classification tasks on any transformer.
Previous Works
Transformers have advanced NLP significantly since the original article “Attention Is All You Need” (Vaswani et al., 2017). The transformer uses attention and self-attention mechanisms in order to detect and model dependencies and similarities between input words that are used to construct a dynamic embedding of all the words. Unlike recurrent neural networks (RNNs), the model has a pre-set input sequence length, and is generally trained using significantly larger datasets and models. Despite these drawbacks, transformers have outperformed RNNs considerably. Transformers in general are composed of a large number of parameters with a tendency to increase over time from 110 to 345 million parameters in BERT (Devlin et al., 2018) (depending on architecture) up to 175 billion parameters with GPT-3. Recently, while not the main goal for some models, another tendency focuses on reducing parameter sizes and efficiency like with Reformer Kitaev and Levskaya (2020), RoBERTa Liu et al. (2019), and DistilBERT Sanh et al. (2019). We advocate for the continued trend of working with smaller transformers to ensure accessible models for all. Therefore, our objective is to enhance the accuracy of transformers without increasing their size. Our approach is versatile and can be applied to any transformer by adding more text inputs. To validate the approach, we test it on relatively compact models. Our results are illustrated using BERT, which has 12 encoders and approximately 110 million parameters, and we include tests on DistilBERT, which boasts a smaller architecture (about 40% smaller than BERT).
We apply our method of including additional text information in the input for sentiment classification. Sentiment classification poses a challenge due to the way humans express themselves in style and meaning. Naseem et al. (2020) addressed these challenges by combining embeddings from several models such as character LSTM Lample et al. (2016), GloVE Pennington et al. (2014), Stanford’s parts of speech (POS) parser (Klein & Manning, 2002, 2003), Lexicon (Cambria et al., 2018; Hu & Liu, 2004; Hutto & Gilbert, 2014; Kiritchenko et al., 2014; Mohammad et al., 2013; Tang et al., 2014), ELMo Sarzynska-Wawer et al. (2021), and BERT Devlin et al. (2018).
Zimbra et al. (2018) evaluated several state-of-the-art methods, illustrating the difficulty of modeling sentiment, with most approaches which score below 70% on an average over five sentiment datasets. Each dataset is domain-specific, including pharmaceuticals, retail, security, technology by Sanders (2011), and telecommunications. The datasets were appraised by human annotators via Amazon Mechanical Turk and labeled at the tweet level for sentiment (Zimbra et al., 2018).
Transformers like BERT (Yin et al., 2020) have been deployed for sentiment classification tasks, utilizing a two-layer attention system applied to the BERT encoder’s output. There are also examples of BERT being applied for multilingual sentiment tasks (Antoun et al., 2020; Arid Hasan et al., 2020; Palomino & Ochoa-Luna, 2020).
Our work embeds 0-shot generated tabular data into transformers to provide additional information. There have already been some works involved in embedding tabular data into a transformer model. Kiela et al. (2019) used the idea of embedded tokens to add pooled outputs from a ResNet He et al. (2015) model into a transformer allowing it to process both text and associated images. Similarly, Lu et al. (2019) also embed image information by using a Fast(er) R-CNN (Ren et al., 2016) to produce features, but the features are added to the embeddings of the text. They mask regions of interest and provided them as added features to custom “[IMG]” tokens allowing the model to predict information about these masked regions. Our approach is largely inspired by this methodology, which inspired us to test the incorporation of additional information into a transformer. Drawing from the concept of creating extra tokens to embed information directly into the text input of a transformer (we have also experimented with inputs to the classification layer), we believe this approach is especially compatible with transformers. This is primarily because the attention calculated between the custom tokens and the text can directly influence the model’s comprehension of both, facilitating a focus on the task from the very outset of model input. However, for the model to understand the relationship between custom tokens and the text, we allowed it to train the custom tokens from scratch alongside the sentiment task.
Custom tokens are generated from a 0-shot model. This distinct feature differentiates our approach from others, enabling general-purpose use of any model for a variety of classification tasks. For instance, the approach by Yu et al. (2019) leverages the next sentence feature of BERT by supplying auxiliary inputs after the [SEP] token, which is specific to BERT structures. In their approach, they embed sentences like “what is the result?” with two possibilities, positive and negative, focusing on a single label. This method aligns with HuggingFace’s Wolf et al. (2019) 0-shot pipeline using next-sentence prediction. Consequently, we can generate multiple labels for a wide variety of tasks (or multiple tasks) using this pipeline, benefiting from next sentence predictions (Yu et al., 2019), and applying this information in direct classification. While these labels may not be as precise as those from task-dedicated models (as evident in our results), our approach nonetheless enhances the performance of transformers. Moreover, it allows for the creation of our own tabular dataset for any auxiliary task, which can be input as custom tokens.
Methodology
Our approach is a two step process. The first uses a 0-shot model to generate the task-specific helper labels from probabilities, in our case emotion labels for our sentiment task. Next, we evaluate two auxiliary input designs, one by using additional custom embeddings for the transformer, and another by concatenating probabilities to the classifier. Our approach is designed to manage a range of emotional inputs for every helper label by utilizing multiple embeddings per-label, each corresponding to a specific level of emotion. Adding raw probabilities to the text is not useful to the model and limiting embeddings to a binary class loses information. We adopt an approach to use multiple embeddings per emotion and test the addition of direct classifier inputs.
Emotion classification can be considered a more difficult task than sentiment classification, but the flow of information from emotions to sentiment might help decide between positive or negative sentiment compared to trying the reverse using sentiment to predict specific emotions. In the case of the reverse task, one could use other helper labels such as emotions that are not part of the final task as auxiliary inputs.
In our tests, we generate 63 helper labels which were randomly selected using a 0-shot model, as detailed in Table 3. The selection of 63 emotions far exceeds most (if not all) datasets despite being an arbitrary number. Each label was manually chosen from a presumably long list of emotions that we believed could be expressed in text, however should still be available in the vocabulary of the 0-shot model. While there is no limit to the number of emotions we could choose from, barring BERT’s maximum input length of 512 that also has to include the text, we limited our experiments to 63 emotions to incorporate all information in the text samples while including all popular emotions used from various datasets. We also want to clarify that the approach depends on the pre-selection of labels and that, while we did not observe this in our tests regarding emotions and sentiment, a proper selection of labels may be required to improve tasks in general. It is also worth noting that we illustrate the change in accuracy when selecting subsets of emotions (powers of 2 minus 1, 15/31/63), with results suggesting that more emotions improve accuracy. Therefore, although 63 is an arbitrary number, we demonstrate the positive trend of increasing the number of emotions in text through ablation studies, as shown later in Table 4. Based on this result, the choice in number of labels can be decided based on training resource limitations. For example BERT’s specific limitation is in its quadratic attention mechanism, however other models like Reformer, with a vastly larger input size and faster attention mechanism, may allow for a greater number of emotions.
Comparison to Original BERT (ID O).
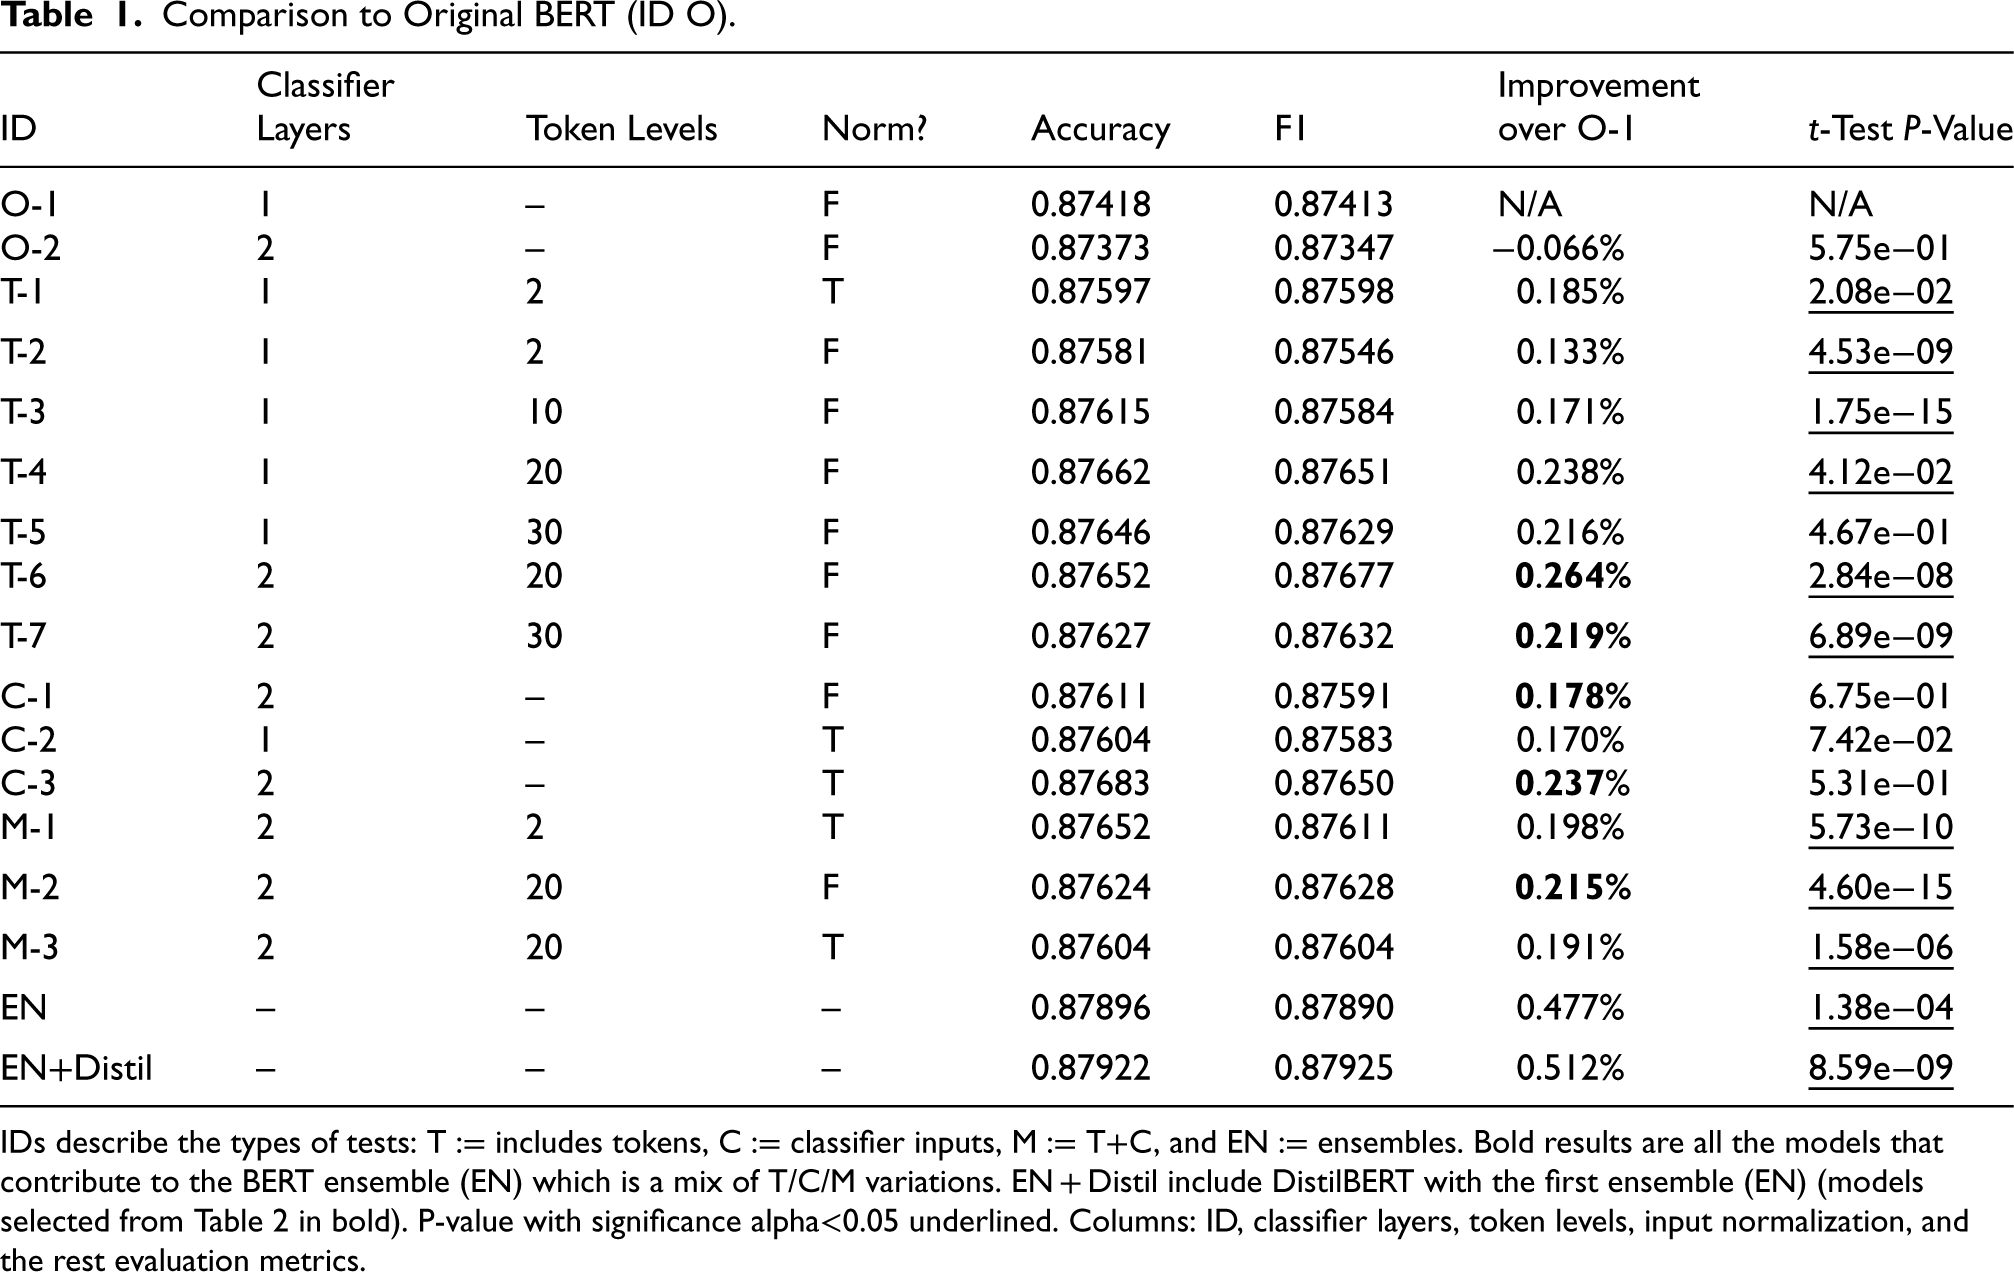
Comparison to Original BERT (ID O).
IDs describe the types of tests: T := includes tokens, C := classifier inputs, M := T+C, and EN := ensembles. Bold results are all the models that contribute to the BERT ensemble (EN) which is a mix of T/C/M variations. EN + Distil include DistilBERT with the first ensemble (EN) (models selected from Table 2 in bold). P-value with significance alpha<0.05 underlined. Columns: ID, classifier layers, token levels, input normalization, and the rest evaluation metrics.
Comparison to Original DistilBERT.
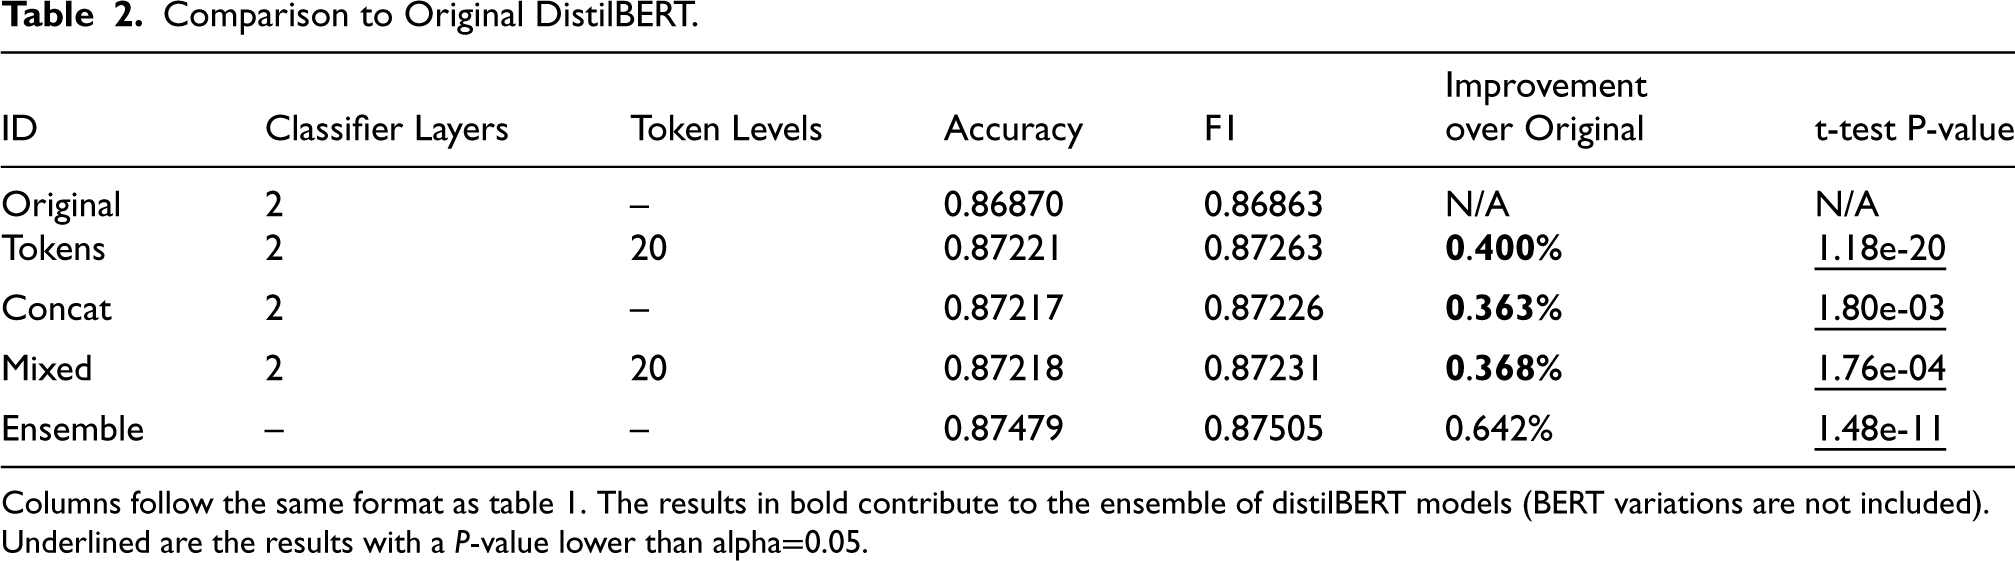
Columns follow the same format as table 1. The results in bold contribute to the ensemble of distilBERT models (BERT variations are not included). Underlined are the results with a P-value lower than alpha
Results for the Sentiment140 Dataset Using the 0-shot HuggingFace Pipeline Where we use the Predictions of the Individual Emotion to Classify the Dataset.
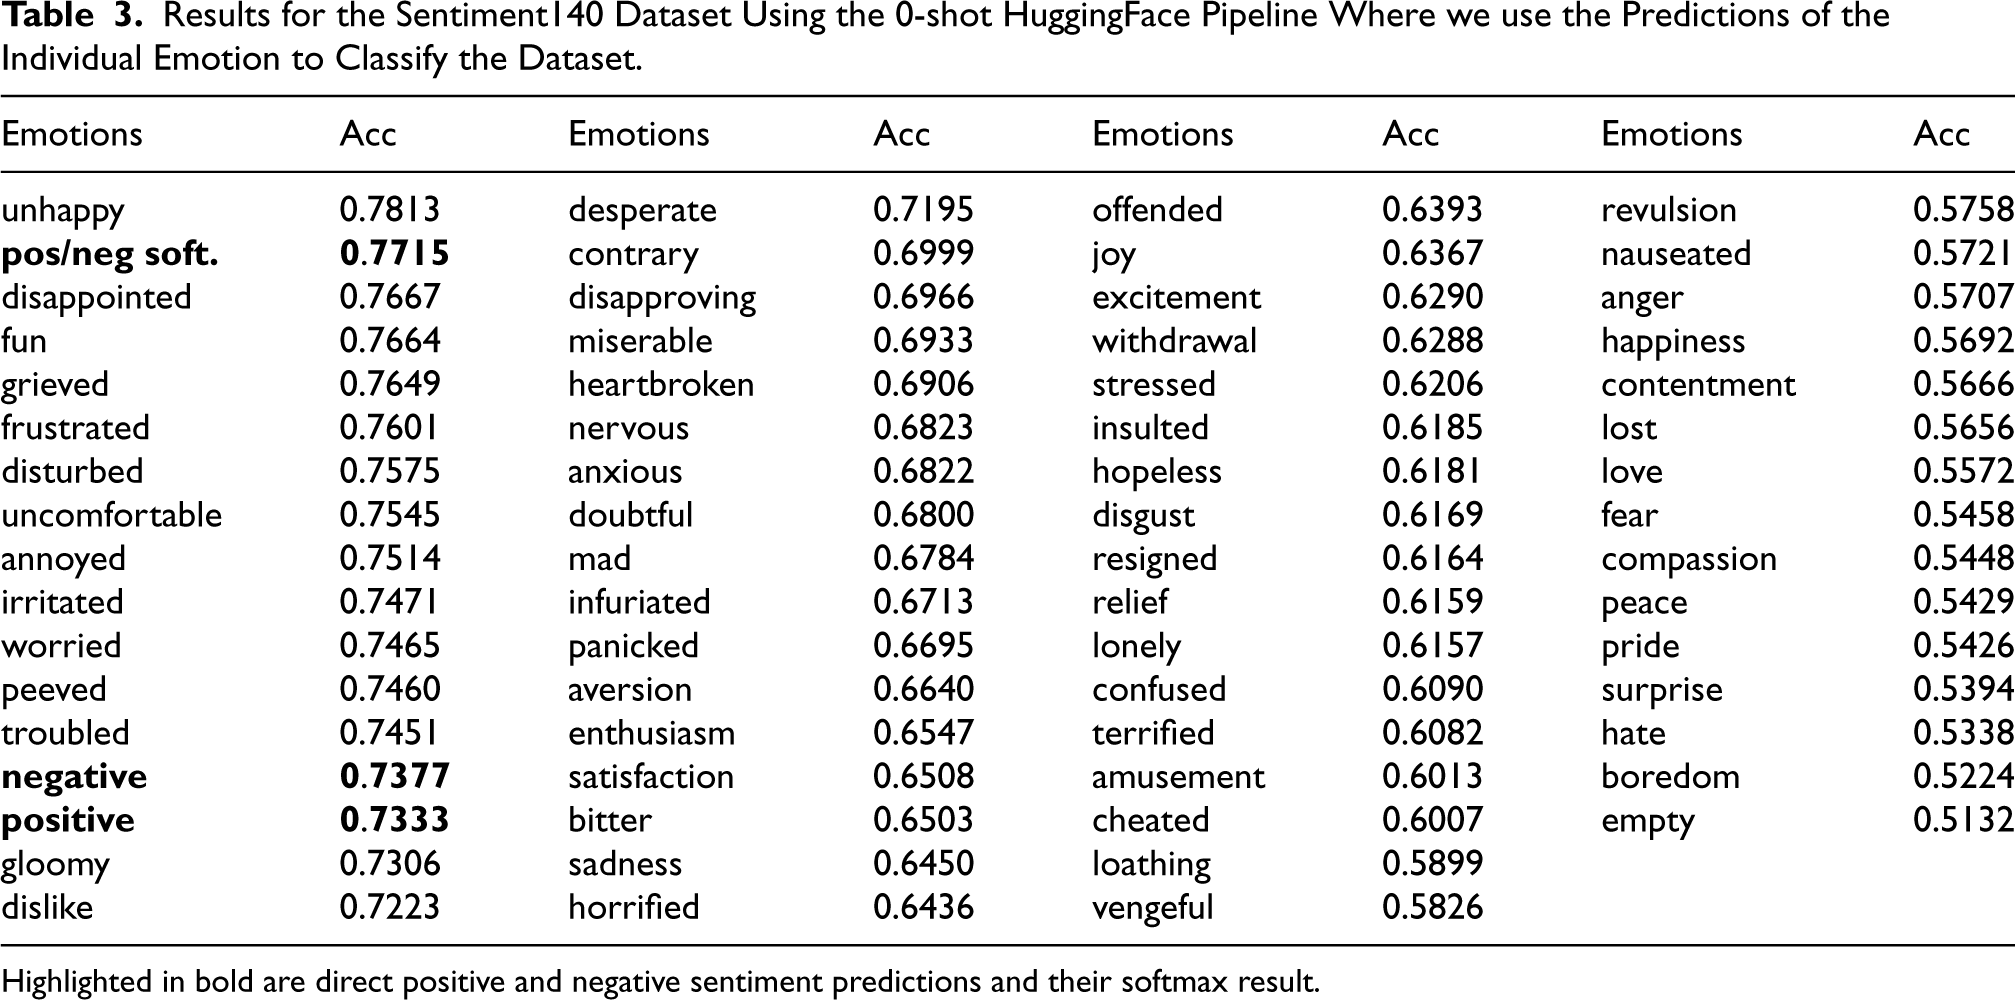
Highlighted in bold are direct positive and negative sentiment predictions and their softmax result.
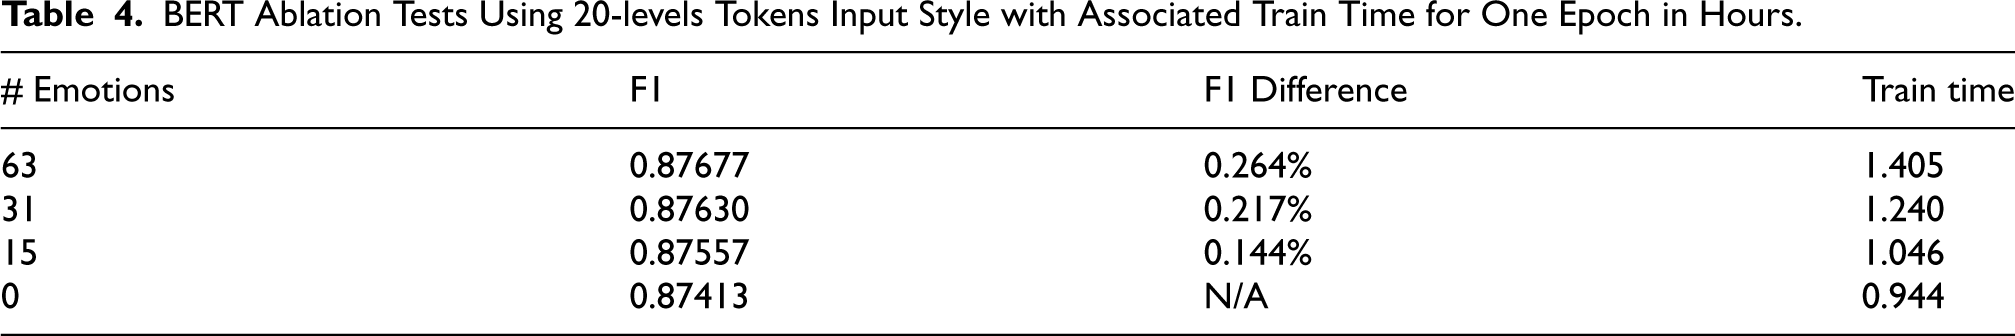
BERT Ablation Tests Using 20-levels Tokens Input Style with Associated Train Time for One Epoch in Hours.
To train and evaluate our approach, we use two datasets, one small and one large. The first is a small dataset called US-Airline sentiment from crowdflower. 5 The dataset consists of tweets mentioning US airlines and are labeled for sentiment. There are 2363 positive samples, 9178 negative samples and 3099 neutral samples. We removed the neutral samples as a decision to keep consistency with the rest of our data and tests, leaving us with 11,541 samples. Due to the imbalance in classes, we removed most of the negative samples to match the size of the positive class giving us 4726 samples which performed better than oversampling. Note that we chose this dataset for its small size to evaluate the effect of smaller datasets on our approach (in addition to artificially downsizing the larger dataset we test).
We explored cases where we oversampled the positive-labeled samples, specifically testing duplication of positive samples by factors of two, three, four, and five. We found that each increase in duplication resulted in greater overfitting and led to poorer overall performance. Conversely, downsampling the negative samples does not pose the same risk of overfitting, despite the loss of data, and the resultant smaller dataset aligns with our aim of testing a smaller dataset for our approach. Potential future work could involve employing data augmentation techniques to address this issue, possibly leveraging recent advancements in generative AI.
The second dataset we use to evaluate our approach is our main source for the majority of our tests. The dataset is called Sentiment140 (Go et al., 2009) and it is used for the purpose of small and large dataset classification. The binary sentiment labeled dataset consists of 1.6 million with an even class distribution. It does have a test set but it only contains under 500 samples and a third label (neutral) not present in the 1.6 million training set. Given the small size and improper labeling, we have chosen to use a train/valid/test split on the 1.6 million samples for consistent datasets. For both the Airline and Sentiment140 datasets, the split was decided as 20% test and 80% train/validation, which was then split using 15% validation of the remaining training set (thus 12% validation and 68% training). The goal for the choice was to create a large test set, then we reduced validation size to avoid a great loss in training data.
We chose the Sentiment140 dataset because it is the largest tweet sentiment dataset with a general purpose topic (not specific to reviews or categories). The samples were scraped from twitter and include separate user-specific information. We discard user information and simply use the tweet text for sentiment classification. We do not alter the text in any way like removing links, user mentions or symbols, we use the dataset as it is presented. We tested the entire dataset and random small subsets.
Finally, we also create extensions to these datasets using our 0-shot labeling approach to generate over 60 emotion categories for each sample. These are appended to the dataset columns and kept consistent throughout all tests after generation. The emotions are independently generated per sample due to the nature of using a 0-shot model.
Data Pre-Processing
We chose a random set of many emotions related to positive and negative sentiment. Considering a broad range of emotions for each sample enriches the depiction of the varied feelings a person may express. Datasets like those generated from crowdflower and from CARER (Saravia et al., 2018) assign a single emotion for each sample which can become ambiguous to the model when more than one emotion is present. Moreover, they limit the number of labels of up to 12 popular emotions, with an other category which does not help with sentiment.
We use the HuggingFace transformer library (Wolf et al., 2019) to load a 0-shot pipeline. They use a natural language inference (NLI) method which considers a premise and hypothesis in order to predict whether the hypothesis holds. We kept the default hypothesis format “This example is { }” where { } gets replaced with the respective emotion, and the premise is the original sample. Each emotion gets a raw probability for whether the hypothesis follows the premise not adjusted with softmax. Each emotion subsequently receives a raw probability predicted by the model, signifying the likelihood that the hypothesis adheres to the premise. While we have the option to adjust all the predicted emotion probabilities of a sample using softmax to normalize them, we choose not to apply this step because we want independent scores for each emotion. At this stage the model simply processes the text as “[CLS] premise [SEP] hypothesis [SEP]” and produces a probability for entailment. We used 4 Nvidia P-100 GPUs to predict on 1,000 samples per batch to generate the probabilities.
We further preprocess the probabilities into ranges, reflecting levels of association with the sample. We cannot feed tokens into the model using raw probabilities, and using binary levels is restrictive. In this case, we experiment with two approaches, the first is to evenly divide the space into the desired range of N segments, and the second is to normalize the labels across the dataset prior to division. The normalization is particularly useful for rare emotions, for example, without normalization, some emotions like unhappy appear in 51.14% of the Sentiment140 dataset, whereas emotions like empty appear 97.89% of the time. As demonstrated by empty, some helper labels are prone to overgeneration when considering a strict binary threshold; however, with normalization the emotion can be tuned to include more diversity. Labels such as empty can overgenerate due to a number of reasons like ambiguity, context, inaccuracies in the 0-shot model, or being inherently uninformative. However, while normalization increases dataset diversity, it incurs a small cost where we lose unique cases where rare emotions are applicable to the samples (or not). Therefore, we evaluated our models with and without normalization.
We introduce “levels of association” to categorize emotions based on their predicted probabilities. We use the term “N-levels” where N represents the number of distinct levels of association for each emotion. For example, consider the emotion ‘‘unhappy’’ with a predicted probability of 0.75. If we’re working with 3-levels:
Level 0: “[unhappy_0]” for probabilities below 1/3 Level 1: “[unhappy_1]” for probabilities between 1/3 and 2/3 Level 2: “[unhappy_2]” for probabilities 2/3 and above
Given our example, the token “[unhappy_2]” would be assigned since 0.75 is greater than 2/3. Furthermore, normalization plays a vital role in assigning these levels. Assume unhappy has a max of 0.99 and a min of 0.40 present in predictions, then we adjust the raw probability through normalization. Continuing with our example, the adjusted probability becomes
Instead of tokens, we tested raw text using the model’s pretrained embedding and english negations to toggle the emotion’s association, like “happy” and “not happy.” We found that this did not help the model. For example, these keywords bloat the number of tokens used per emotion, like the keyword “embeddings,” which directly tokenizes to 4 tokens {’em’, ’##bed’, ’##ding’, ’##s’}. The negation adds more bloat, but also shifts the remaining emotions’ positional embedding. Finally, the raw text loses its original meaning when repurposed into emotion auxiliary inputs and could introduce bias due to its presence in the text. Creating embeddings as auxiliary inputs to represent emotions at multiple levels of association alleviates these drawbacks in three ways. First, by using just a single embedding per emotion; second, by keeping a consistent positional embedding; and finally, by maintaining the original meaning of the respective emotion keyword.
Incorporating Generated Emotions Into Transformers
In this section, we describe the model designs which incorporate the generated emotion information. We specifically tested our models using BERT and DistilBERT, but the approaches can be used on any transformer architecture. We use the following optimization parameters: momentum set to (0.8, 0.7), and discriminative weight decay using (1e
We use the Python libraries Transformers (Wolf et al., 2019) and FastAI (Howard et al., 2018) to load BERT, including the vocabulary and 0-shot pipeline. Using FastAI, we tokenize the entire training, validation, and test set. Finally, the dataset assembled in FastAI, consisting of sample texts with embedded emotion tokens, sentiment targets, and final classifier emotion inputs, is loaded for processing.
The helper label tokens are prepended in the same position to the sample text using its level of association as our tokens approach (T). Prepending (rather than appending) the tokens is important to keep the labels in a consistent position in the text for the positional embedding, similar to how the [CLS] classifier token is always in the same position. Appending would alter token positions based on text length. In preliminary testing, this method showed worse performance, which we suspect is due to slight overfitting on unique sample emotion positions. The transformer can process the custom embedding and positional embedding to score the emotions against the text in the attention layers.
As an additional experiment, we input the emotion probabilities to the classifier appended to the transformer output as our concatenation approach (C). This is followed by either one or two fully connected layers with 200 neurons finalized with an output layer for the sentiment probability. We evaluated both T and C, and a mix of the two, called M. See Figure 1 for a diagram of the full model.
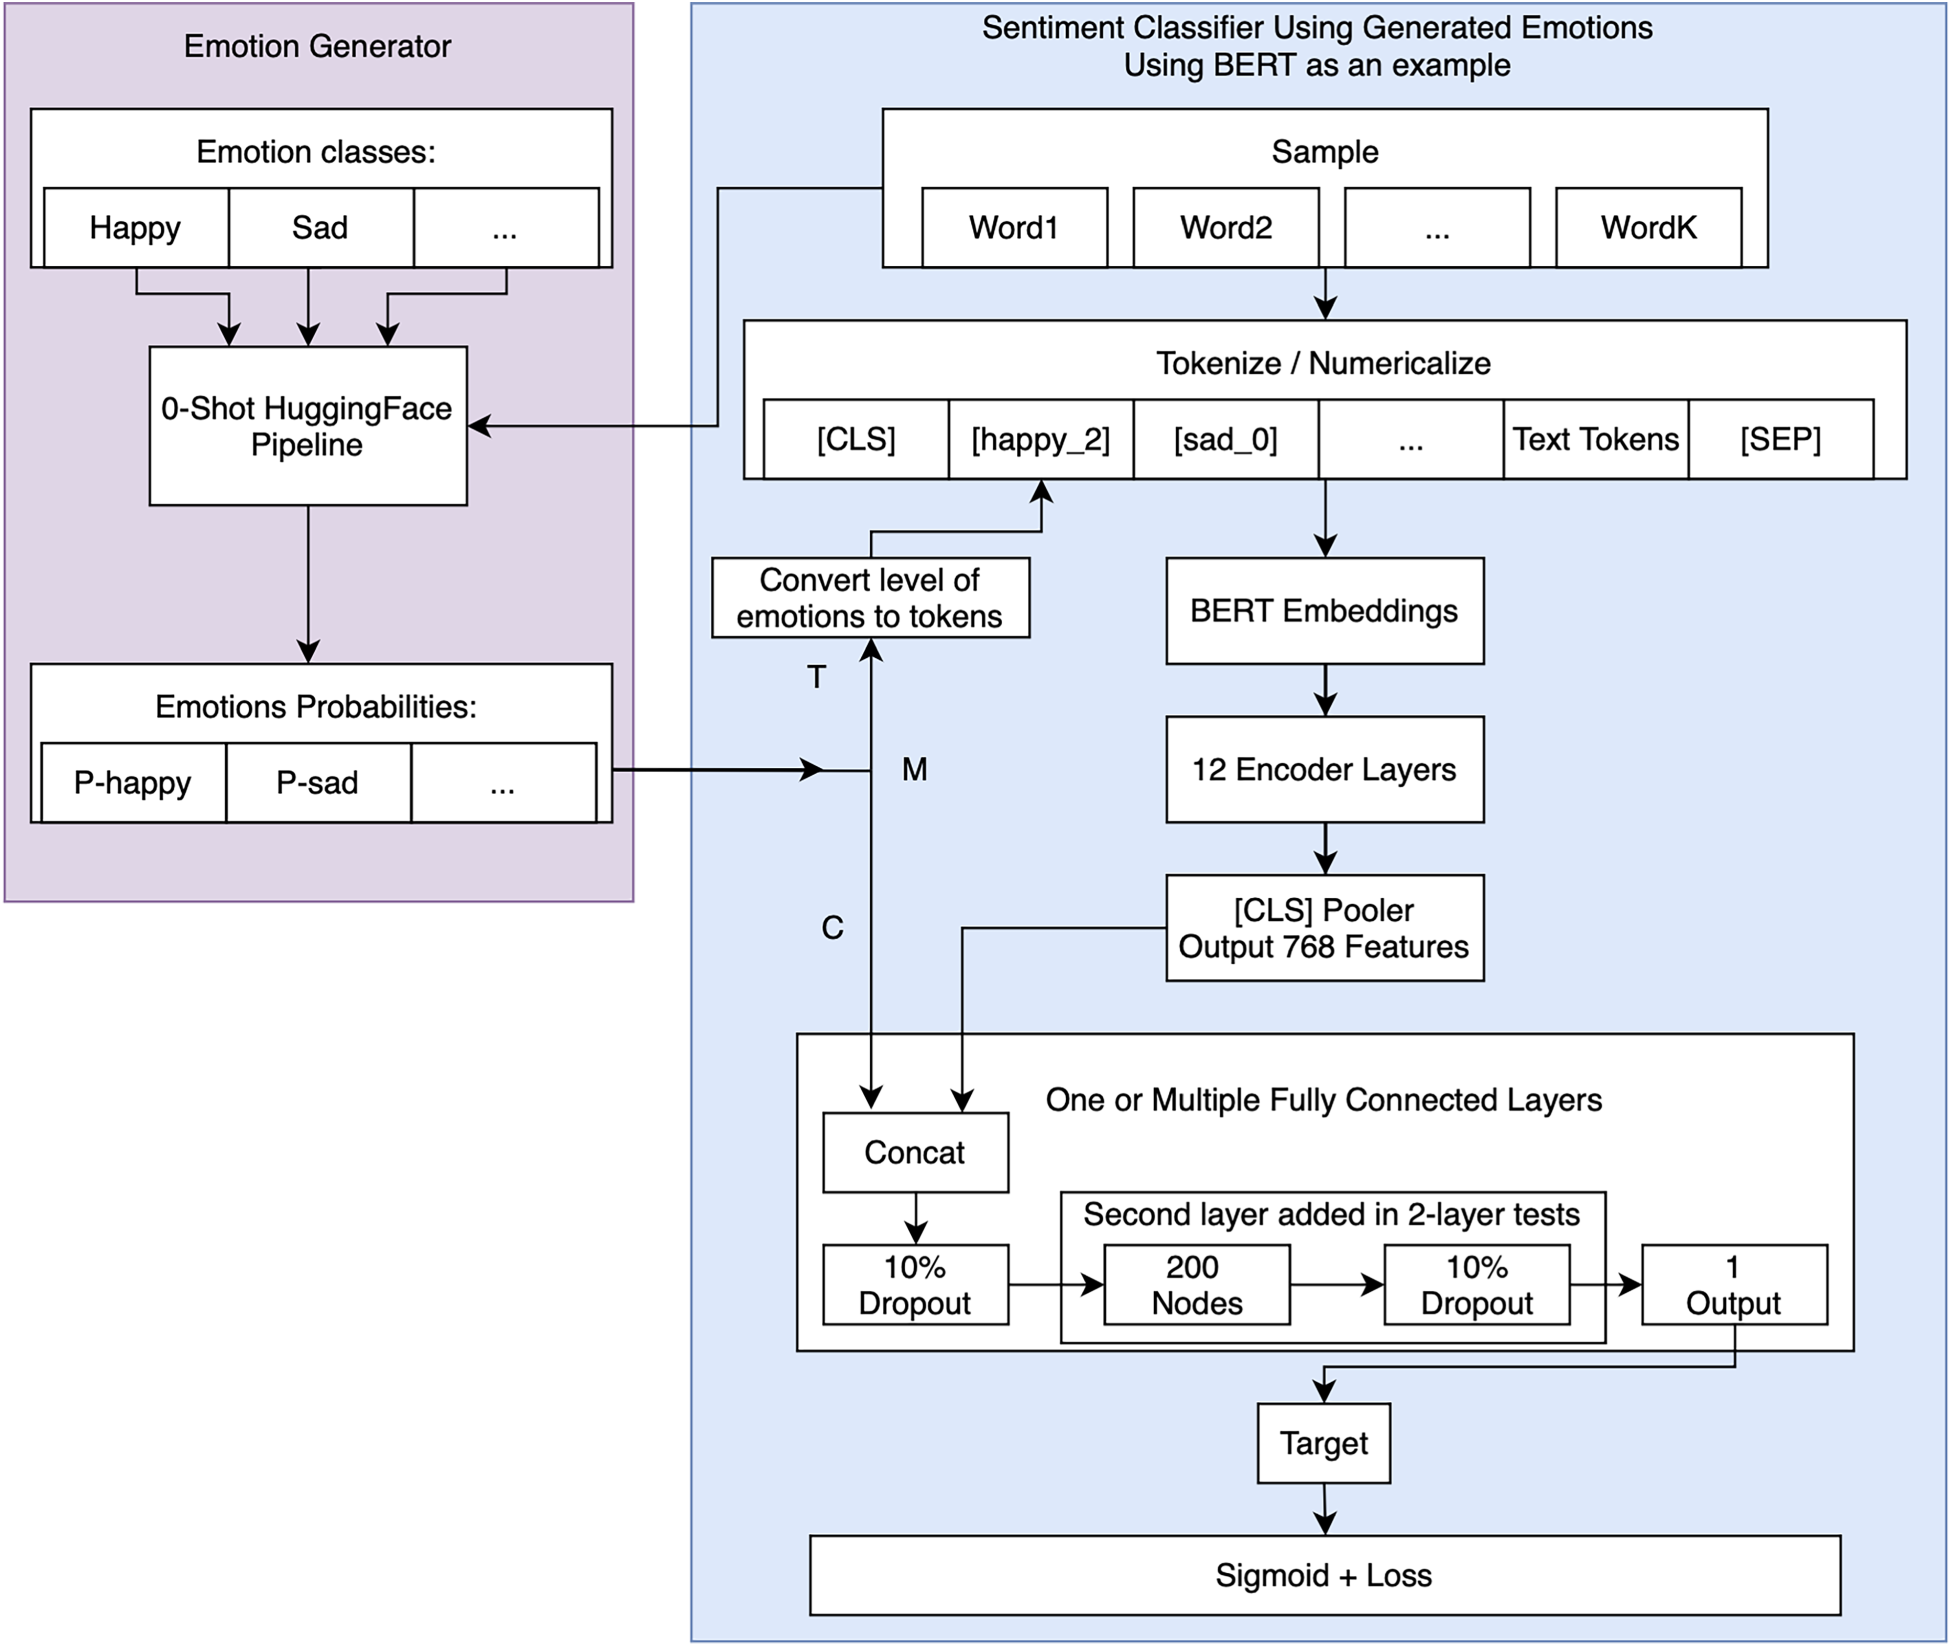
Diagram of the approach. Emotion probabilities are fed into the text input of the encoder for the token approach (T). They can also be fed into the classifier concatenated with the encoder output (C). Our approach is tested with both possibilities or a mix of the two (M).
In this section, we present the results by first showing a diverse experimentation on the large Sentiment140 dataset (1.6M samples) shown with statistical significance. The results incorporate ensembles, one of which is a combination of tested BERT variations (later defined as T/M/C for tokens, classifier, and Mixed tokens/classifier input), another is a combination of similarly tested DistilBERT models, and finally, a combination of all BERT and DistilBERT variations from the previous two ensembles. The ensemble results add to the statistical significance by improving accuracy without changing the model itself, but by using alternative label inputs and varying levels of association of helper labels. Then, we evaluate the effect of using a greater number of emotions on accuracy. Finally, we present greater accuracies on smaller datasets like US Airline and subsets of Sentiment140 (500–50,000 samples) to show the optimal dataset size range for our approach. In addition to our results, we also compare with other approaches. We trained all of our models with the same parameters on the same data using a test size of 20%, a validation size of 12%, and a training size of 68%. The runtime to train each model ranged from 3 to 4 hours on 4 Nvidia P-100 GPUs and a batch size of 100.
We compared different combinations of emotion embeddings to the original BERT transformer without any additional information (see Table 1). These results are specific to the Sentiment140 dataset and do not present anything on the Airline dataset. Columns in order: ID is the model test ID we refer to in text, Classifier Layers is the number of classification layers used, Token Levels is the token input format for the number of levels per emotion, “Norm?” is whether we have normalized the generated emotion data, Accuracy and F1 are performance metrics of the model/test on the Sentiment140 dataset, Improvement over O-1 is a comparison to the original model as a percentage difference, and finally t-test (P-value) is the significance of each result. The table shows five sections: ‘O’ for original, ‘T’ for token inputs, ‘C’ for classifier concatenation, ‘M’ for a mix of ‘T’ and ‘C’, ‘EN’ for BERT ensemble, ‘EN + Distil’ for BERT ensemble in addition to DistilBERT models. The fifth section (EN) comprises an ensemble of all models highlighted in bold in their improvement column. Another ensemble (EN + Distil) includes the same BERT models and additional DistilBERT models trained with emotions highlighted in bold in Table 2. On the same problem, we also compare the DistilBERT model’s results using the best emotion inputs we found for BERT (see Table 2). We include the same five sections as in Table 1 and the ensemble is all DistilBERT models highlighted in bold (BERT variations not included in this result).
We tested each model using Accuracy and F1, and show the difference (improvement) over the original BERT (Table 1) or DistilBERT (Table 2) model. We include a Wilcoxon non-parametric t-test P-value score for each model. Notably, the 2-layer original BERT (ID O-2) has a P-value of 0.57459, which is much greater than alpha
To summarize the results in Tables 1 and 2, we found that adding emotions regardless of the input style has a statistically significant improvement over the original model for both transformers. The best improvement for Sentiment140 was achieved using the 20-levels tokens (T) with a systematic improvement of 0.264% and 0.400% for BERT and DistilBERT, respectively. The concatenation of emotion probabilities does not improve nearly as much as with the token models, but we see an improvement over the original models. Inserting information directly into the classifier likely underperforms compared to the tokens approach. This may be because the models can learn embeddings for each emotion and apply attention to enhance emotion utility. Using normalization shows a greater improvement within the concatenation tests (C), but not for tokens inputs. The attempt at mixed tests (M) show an improvement as well, but averaged out between the improvement provided by tokens and concatenation individually. This could suggest the model relies too heavily on the classifier emotion inputs when provided. Additionally, the ensemble of just BERT models shows an improvement of 0.477% over the original BERT. The ensemble of just the three DistilBERT models using added emotions improves over the original BERT model by 0.092% while improving the original DistilBERT model by 0.642%. Finally, the ensemble of the selected BERT and DistilBERT models show our highest improvement of 0.512% over the original BERT model. Due to the gradual improvements of the various ensembles using simple alterations in emotion association levels we find this provides a better sense of significance in the results.
We wanted to provide details on the amount of information each emotion contributes towards the final sentiment goal in the Sentiment140 dataset. Table 3 gives a full list of all emotions used and their ability to classify the sentiment140 dataset using the 0-shot labels after normalization. We have a set of emotions associated with negative sentiment (e.g., frustration, irritation, annoyance) and those associated with positive sentiment (e.g., joy, relief). During predictions, we utilize the direct probability of positive-sentiment emotions while inversely applying the prediction of negative-sentiment emotions. This is because the predictive objective of negative-sentiment emotions (where 1 denotes negative and 0 denotes positive) opposes our general sentiment task (where 1 signifies positive and 0 signifies negative). We also included the 0-shot model’s ability to classify the dataset using classes “positive” and “negative” along with their softmax classification. The labels “positive” and “negative” are generated by the 0-shot model in the same manner as the emotions. Similarly, we assess their ability to classify the dataset by comparing them to the actual positive and negative labels in the Sentiment140 dataset. The results of this test show that none of the 0-shot predictions comes close to the accuracy of the original BERT or DistilBERT models for direct sentiment classification with unhappy at 78.13% accuracy, roughly 8-9% below BERT or DistilBERT’s performance. In this case, we can see the model does not rely on the emotions for classification but can benefit nonetheless.
Next, we evaluate the use of emotions in an ablation test. We gathered a list of emotions selected from the top of Table 3 which most closely resembles the final target (positive/negative). We used the top 15 and top 31 emotions as subsets for training, comparing these against the full set of emotions and the original model without emotions. We present the results in Table 4 which shows the reduction of the number of emotions (even choosing the best) correlates to the reduction of accuracy using the best 20-levels token model.
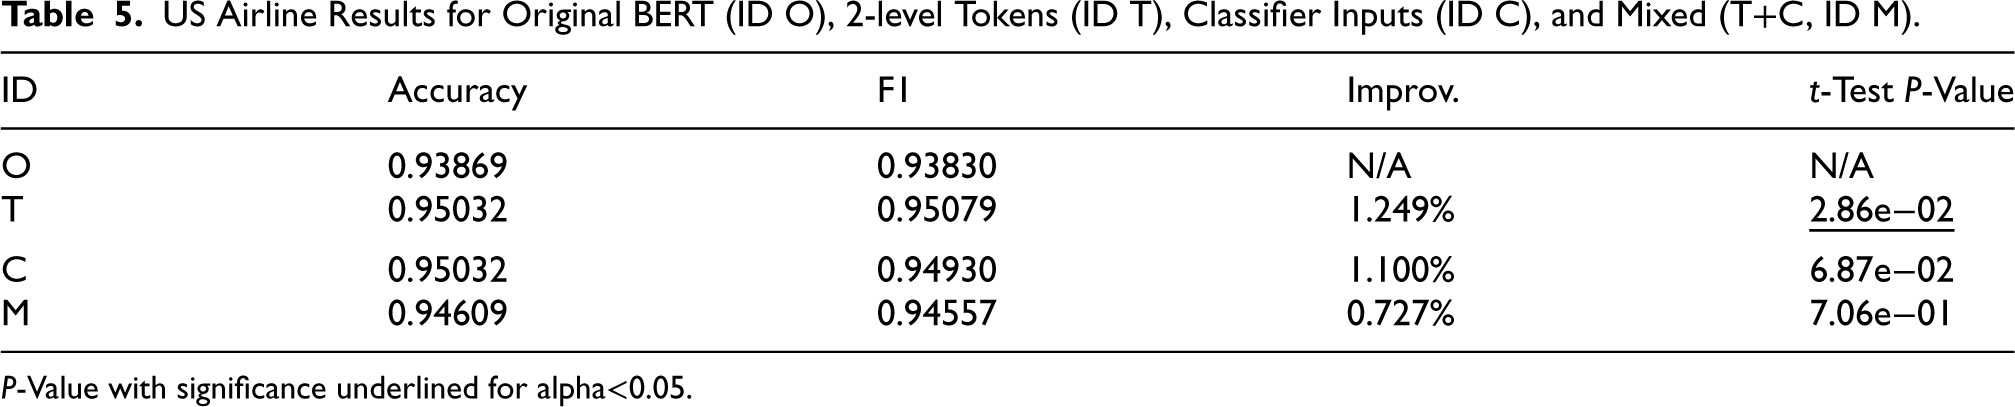
We then tested a small dataset, the US Airline sentiment dataset, with results presented in Table 5 for the original BERT, BERT with the 2-level token approach (T), BERT with concatenated classifier inputs (C), and BERT with a mix of tokens and concatenated inputs (M), all using 2 classification layers. We see an improvement of 1.249% with 0.95079 F1 in the 2-level token (T) approach over the original BERT. With nearly 5000 training samples in this dataset, the runtime to train each model took roughly 5-10 minutes on 4 Nvidia P-100 GPUs. For comparison with other approaches, Rani and Gill (2020) achieve 87.422% accuracy using an ensemble of Naive Bayes, svmRadial, C5.0, and a DictionaryBased Classifier. Umer et al. (2020) use a CNN-LSTM combined model with 82.0% accuracy and 83.0 F1.
US Airline Results for Original BERT (ID O), 2-level Tokens (ID T), Classifier Inputs (ID C), and Mixed (T+C, ID M).
US Airline Results for Original BERT (ID O), 2-level Tokens (ID T), Classifier Inputs (ID C), and Mixed (T+C, ID M).
P-Value with significance underlined for alpha<0.05.
Because of the greater improvement shown in US Airline, we tested subsets of Sentiment140. We use our best 20-levels token BERT model by reducing the training set size to a range of 500 to 50,000 samples. Note that the size of the test set remains the same as in all other tests. As indicated in Table 6, our approach yields the most significant benefits for datasets containing 10,000 to 25,000 samples, though improvements are also observed in the broader range of 1,000 to 50,000 samples. Even with as few as 1,000 samples, we observe an improvement, although accuracy diminishes at 750 and 500 samples, likely due to slight overfitting on auxiliary inputs.
Small Dataset Tests Randomly Subsampled from Sentiment140.
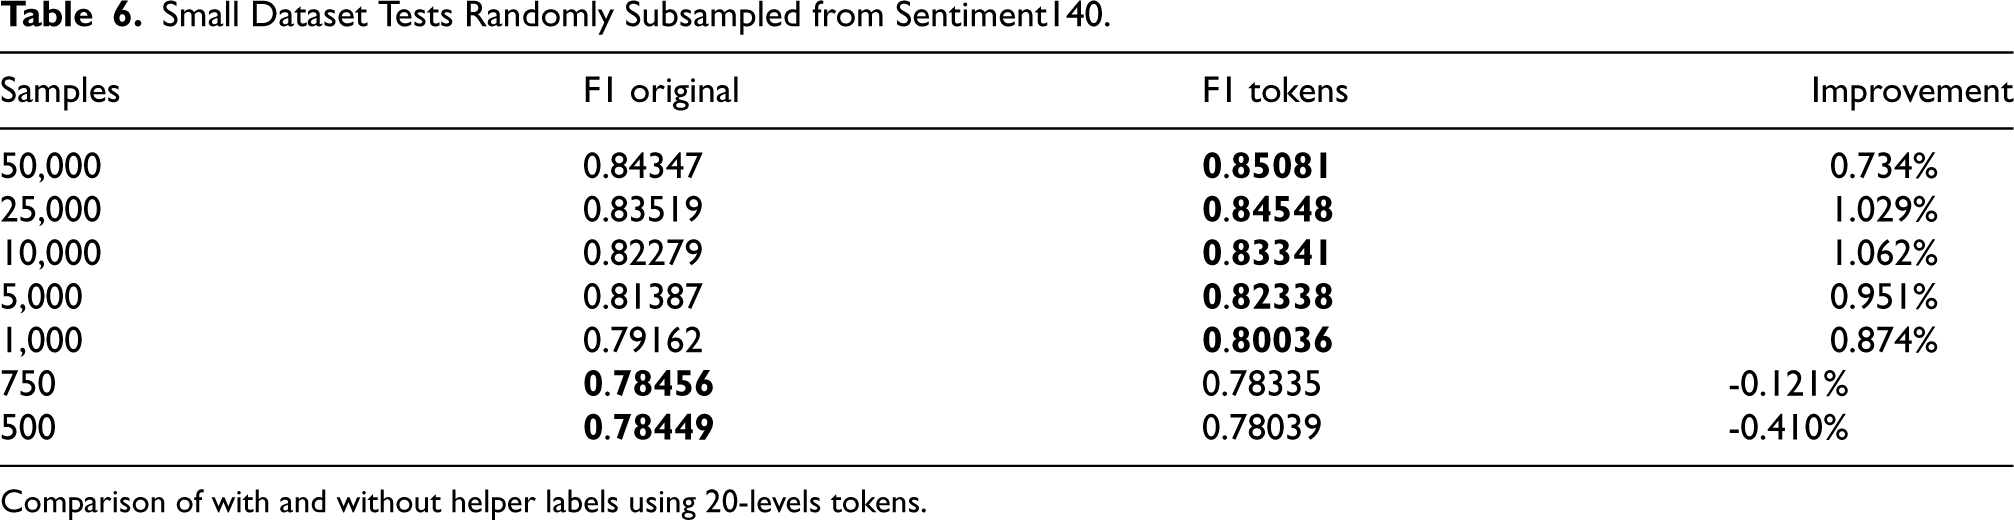
Comparison of with and without helper labels using 20-levels tokens.
In Table 6, at 750 samples, we notice the accuracy of the original model is nearly identical to the top performing 0-shot emotions from Table 3 and is no longer improved with emotions as input. This suggests the model may be relying too heavily on emotion inputs for predictions. Additionally, as presented earlier in Table 3, the 0-shot model underperforms task-specific models by at least 10% when using the full dataset and benefits from auxiliary inputs, like in Tables 1 and 2. From this, we can infer that auxiliary inputs should not surpass the original model in accuracy. This ensures that the model extrapolates sentiment from both the emotions and the sample text, rather than relying solely on emotion inputs and neglecting the text.
Performance of the 0-shot model and its trained counterpart is connected, with three observable accuracy trends: (1) “weak labels + strong model,” (2) “equivalent labels/model,” (3) “strong labels + weak model.” In the first scenario, a strong model (original) with added weak labels only slightly outperforms the original model due to limited task-related information. The second scenario shows equal performance between labels and the model. This indicates a significant contribution of information by the labels, without surpassing the model’s performance. This trend emerges when we reduce the number of samples, weakening the model to match the weak labels’ performance, which results in higher performance gains (Tables 5 and 6). The final scenario presents stronger labels than the model, risking overfitting and reliance on emotion inputs for sentiment classification.
To summarize the three scenarios and trends, Table 6 shows that reducing the number of training samples worsens accuracy, increasing 0-shot label dependence and potential overfitting. As training data expands, reliance on 0-shot labels diminishes, improving performance. However, as training data surges, the usefulness of weak labels diminishes.
To compare with other approaches applied on Sentiment140, Tago et al. (2019) uses a selection strategy for dates and users achieving 77.6% accuracy. Wang et al. (2020) reports accuracies of several models using a 70/30 train-test split for the following models: 82.00% multilayer LSTM using embeddings, 77.98% SVM, 76.44% Logistic Regression, 76.52% Multinomial Naive Bayes, and 77.67% using an ensemble. In all approaches, models struggle to achieve high accuracy, showing only minor differences in results. This holds true even for complex models, such as the multilayer LSTM with embeddings. Imran et al. (2020) claim to have state-of-the-art (SOTA) with 0.824 F1 on the dataset using an LSTM on a 10% test set, outperforming previous SOTA using a convolutional neural network (CNN) with a variety of embeddings including BERT embeddings. We currently have 0.87925 F1 using an ensemble, while also achieving 0.87677 F1 from a single BERT model, using 20% test, 12% validation and 68% training. We nearly have SOTA in Sentiment140, but a recent approach, known as TweetBERT Qudar and Mago (2020), claims much greater accuracy.
Authors of TweetBERT Qudar and Mago (2020) have shown a great improvement in tweet classification, especially in the Sentiment140 and US Airline datasets used in this article, unfortunately with little information on the evaluation of the datasets. The authors use a mix of models in a BERT architecture to continuously pretrain on a vast number of tweets, about 680 million tweets or more. The continuously pretrained BERT presents a much better understanding of tweets with reported accuracies of 95.18% and 92.99% on Sentiment140 and US Airline, respectively. Since our approach is general for any transformer and tested for BERT, emotions embedded as tokens for this pretrained TweetBERT model could likely benefit from our approach and improve the Sentiment140 benchmark.
The TweetBERT model was recently released on June 1st, 2022. We loaded the model into a HuggingFace BERT architecture. We noticed they limited their model to 130 tokens compared to the standard 512, which would be the equivalent space of 382 additional emotions we could embed into the model. They used a special filter which removes all punctuation, quotes, special characters, words less than 3 characters, and filters based on stemmed and stop words.
We tested a standard BERT model using this filter and found that it degrades accuracy by a large margin. Thus we decided to test TweetBERT with and without the filter on the Sentiment140 dataset using the same train/validation/test split as in our tests. We also included the advanced hyperparameter tuning we implemented on our models. The standard TweetBERT model using their filter achieves 82.179%, and without their filter achieves 82.478% (+0.299%). Unfortunately, this is the best result we could reproduce with their model which does not match their article. We applied our 20-levels token approach to the TweetBERT model and achieved 83.822% using their filter and 84.457% without their filter for a total improvement of +1.979% (no-filter to no-filter comparison).
Conclusion and Future Work
In conclusion, we presented an approach to embed tabular emotion helper labels to text classification tasks for the general transformer architecture, tested on sentiment classification with models BERT and DistilBERT. We evaluated several configurations of the approach with statistical significance on the Sentiment140 dataset with over 1.6 million samples. We selected the optimal configuration that shows a systematic improvement for BERT and DistilBERT with statistical significance. This configuration achieves 0.87677 F1 using BERT, or 0.264% improvement over the original, while the same configuration improves DistilBERT by 0.400%. To further show significance in the result, we show that an ensemble of the same models using different configurations of helper labels can achieve 0.477% improvement for BERT-specific ensemble and 0.642% in DistilBERT-specific (now surpassing the original BERT).
With this information, we focused our approach on small datasets showing even greater improvements. The approach shows optimal performance for dataset sizes between 1,000 and 50,000 samples. Ablation tests demonstrate that, in general, increasing the number of helper labels also improves performance. We find an improvement for the 11,500 sample US Airline dataset of +1.249%, or achieving 0.95079 F1. When subsampling the Sentiment140 dataset, we show consistent improvements up to 1.062% for ranges between 1,000 and 50,000 samples.
Our model configurations tested show a statistically significant improvement over a direct classification without additional information. These results are therefore promising for the possibility to improve accuracy of most text classification tasks by adding additional semantic information generated using 0-shot generated with pre-trained models. The main interests of our approach are its independence from the model used, its simplicity and its semantic improvement to accuracy/F1 scores, especially using a small training set.
In the future, we plan to continue research using 0-shot models and the possibility to incorporate more 0-shot information in our classification models. We plan to apply our approach to other sentiment datasets and explore its effectiveness. Additionally, we aim to expand datasets with more data and labels through an automatic system, enhancing general article classification tasks beyond just sentiment analysis. However, this approach is not confined to emotion and sentiment tasks and can be tested on various datasets, such as ratings, toxicity, spam detection, etc. The methodology could also be intriguing for integrating general information into articles for summary (or generative) tasks where the model might lack training to comprehend referenced or external material. Rather than incorporating all referenced material in the original input article, we could use a reference embedding, either pretrained or derived from referenced materials, enabling the model to interpret these embeddings for more accurate summary content. Lastly, the approach can also be adapted for general data augmentation by creating new labels for text classification tasks. For instance, we have a set of emotions associated with positive or negative sentiment, which can be combined to create a general positive/negative sentiment label for new text. As demonstrated in the TweetBERT’s paper, more pretraining can lead to higher accuracies. Thus, pretraining on fuzzy sentiment labels (generated by a 0-shot model for unlabeled content) could enhance our original task with the Sentiment140 dataset.
Footnotes
Funding
Natural Sciences and Engineering Research Council of Canada (NSERC) grant number 08.1620.00000.814006.
Conflicting Interests
The authors declared no potential conflicts of interest with respect to the research, authorship, and/or publication of this article.