
Abstract
With the advancement of technology, the demand for healthy eating has increased, making food classification a research hotspot. Existing deep learning-based food image classification models demonstrate high accuracy but require substantial computational resources, limiting their use on resource-constrained devices. In this study, a lightweight convolutional neural network model named MSNet for food classification is proposed. MSNet mainly consists of M Blocks and S Blocks. The M Block uses improved depthwise convolution to reduce the computational cost of conventional convolutions, and the S Block uses channel shuffle techniques to enhance feature information flow between channels without increasing additional computation, effectively capturing relationships between different channel features. Experimental results on three benchmark datasets (ETHZ Food-101, Vireo Food-172, and ISIA Food-500) show that MSNet achieves top-1 accuracies of 86.24%, 87.98%, and 65.70%, with model sizes of 13.8 MB, 15.9 MB, and 25.4 MB, respectively, outperforming mainstream models in terms of computational efficiency. Further quantization produces two MSNet-Lite variants with competitive model size, while maintaining high accuracy and significantly improving inference speed. Additionally, visualization analysis indicates that MSNet effectively extracts essential features of food images, offering good interpretability and generalization across datasets of varying complexity. The proposed MSNet model provides a feasible solution for practical deployment in food classification tasks on mobile and embedded devices.
Keywords
Introduction
In recent years, with the popularization of mobile devices and the development of the internet, image recognition technology has become an important research direction in the field of computer vision. This is particularly true for food image recognition, applications such as restaurant billing systems, nutritional analysis, and dietary recommendation systems demand efficient and accurate food image recognition algorithms. Convolutional neural networks (CNNs) have shown excellent performance in image recognition tasks, with some neural network models surpassing human-level classification capabilities due to their large number of parameters and computational complexity (He et al., 2015). Food image classification, as an important field in computer vision, faces multiple challenges. Firstly, the diversity and variability of foods make classification difficult, as even the same food can exhibit significantly different visual features due to different cooking methods, plating, or shooting angles (Ciocca et al., 2016). Secondly, food images are often taken in complex backgrounds and varied lighting conditions, which further complicates recognition (Liu et al., 2016). Additionally, while traditional deep learning models perform well on large-scale datasets, their substantial number of parameters and computational costs make real-time applications on resource-constrained mobile devices and embedded systems challenging (Bianco et al., 2018). These issues necessitate the development of lightweight food image classification models.
Lightweight CNNs have aimed to reduce model parameters and computational cost while maintaining model performance, becoming an effective solution to the above challenges. Models such as the MobileNet series, ShuffleNet series, and EfficientNet have significantly reduced computational complexity and memory usage by designing more efficient convolution operations and network structures. For example, MobileNetV3 effectively reduces the computational cost and parameter count by introducing depthwise separable convolutions and inverted residual structures (Howard et al., 2019). ShuffleNetV2 reduces memory access cost through channel shuffle operations, improving computational efficiency (Ma et al., 2018). The EfficientNet series employs a compound scaling method to simultaneously scale the network’s depth, width, and resolution according to task requirements, achieving lower computational cost while maintaining high accuracy (Tan & Le, 2019). However, these methods are developed for general image recognition tasks, and there is still room for improvement in accuracy and efficiency for the food image classification task.
In this study, a lightweight CNN model named MSNet specifically for food image classification tasks is proposed. MSNet mainly includes M Blocks and S Blocks, achieving efficient model compression and acceleration by incorporating improved depthwise separable convolutions and channel shuffle operations. Specifically, M Block, derived from MobileNetV2, reduces computational cost through depthwise separable convolutions; S Block, derived from ShuffleNetV2, enhances feature diversity and information flow through channel shuffle operations. Additionally, the MSNet model is quantized to generate the MSNet-Lite models, further reducing model size and computational complexity. Experiments on the Food-101 dataset demonstrate that MSNet significantly reduces computational resource requirements while maintaining high recognition accuracy.
The main contributions of this study are as follows:
A lightweight CNN model MSNet is proposed, specifically designed for efficient food image classification. By integrating improved depthwise separable convolutions and channel shuffle operations, MSNet achieves substantial compression and acceleration while preserving robust feature extraction capabilities across diverse food categories. A quantization strategy is applied to MSNet, resulting in two MSNet-Lite variants. These quantized models significantly reduce model size and computational complexity, making them suitable for deployment in resource-constrained environments, while maintaining competitive accuracy across different datasets. Extensive experimental evaluations are conducted on three datasets (ETHZ Food-101, Vireo Food-172, and ISIA Food-500) demonstrating MSNet’s superior performance. The results indicate that MSNet outperforms existing models in terms of accuracy, robustness, and computational efficiency, with good interpretability.
Related Work
Food Image Classification
Food image classification is an important application of deep learning in the field of computer vision. With the establishment of large-scale labeled food image datasets and the rapid development of deep learning models, significant progress has been made in this area. Researchers have leveraged the powerful feature extraction capabilities of CNNs to achieve efficient recognition of food images (Fakhrou et al., 2021; Khan et al., 2019; Liu et al., 2021). To enhance the model’s ability to recognize details in food images, attention mechanisms have been integrated into CNNs, allowing the model to focus on critical parts of the images (Abiyev & Adepoju, 2024; He et al., 2022). Additionally, multitask learning strategies have been applied to food image classification, simultaneously predicting the type and nutritional attributes of food, thereby enhancing the model’s predictive capability (Liang et al., 2020). Despite these advancements, the diversity and complexity of food images, such as different cooking styles, plating methods, and shooting conditions, continue to pose challenges for classification tasks. To address these issues, researchers have adopted techniques such as region segmentation (Chen et al., 2020), transfer learning (Li et al., 2020), data augmentation (Aguilar et al., 2021), and data generation (Chen et al., 2024; Han et al., 2023) to improve the model’s generalization ability and accuracy.
These studies indicate that deep learning, particularly CNNs, has vast application prospects in food image classification. Significant progress has been made, especially in the areas of attention mechanisms, generative adversarial networks, and multitask learning.
Lightweight Image Classification Models
Lightweight image classification models are a crucial research direction in deep learning, particularly for resource-constrained mobile and embedded devices. These models aim to reduce computational load and model size while maintaining or even improving classification accuracy. In recent years, with the rapid development of mobile devices and Internet of Things technology, research on lightweight models has garnered significant attention. For example, Howard et al. (2017) proposed MobileNetV1, which uses depthwise separable convolutions to significantly reduce computational complexity. They later improved upon this with MobileNetV2, introducing inverted residuals and linear bottlenecks to further enhance performance and efficiency (Sandler et al., 2018). Beyond the MobileNet series, some researchers have explored different lightweight strategies. ShuffleNetV2 optimizes memory access patterns through channel shuffle operations (Ma et al., 2018), while SqueezeNet reduces model parameters using
In the domain of lightweight food image recognition, several researchers have proposed classification models and systems. Oliveira et al. (2014) embedded a complete food recognition system in a mobile device based on a multiranking classification approach. Kawano and Yanai (2015) proposed two food recognition methods suitable for mobile devices in terms of processing time, memory efficiency, and classification accuracy. Pouladzadeh and Shirmohammadi (2017) developed a system for automatically detecting multiitem foods, which can run on mobile phones.
The aforementioned research indicates that lightweight models have practical application potential in food image recognition, enabling efficient food image classification on resource-constrained devices. However, there is still room for improvement in classification accuracy and efficiency.
Methodology
Overview of MSNet Model
In this study, a lightweight CNN classification model for food images is proposed, primarily consisting of an end-to-end neural network named MSNet. The input of MSNet is a preprocessed food image, and the output is the food category label. The main structure of MSNet, as shown in Figure 1, includes conventional convolution modules, seven M Blocks, and two S Blocks. The M Block is derived from MobileNet, where “PW Conv” denotes pointwise convolution and “DW Conv” denotes depthwise convolution. The S Block is derived from ShuffleNet, which contains two branches: one with convolution operations and the other without. The results of the two branches are concatenated and then subjected to a channel shuffle operation before being output.
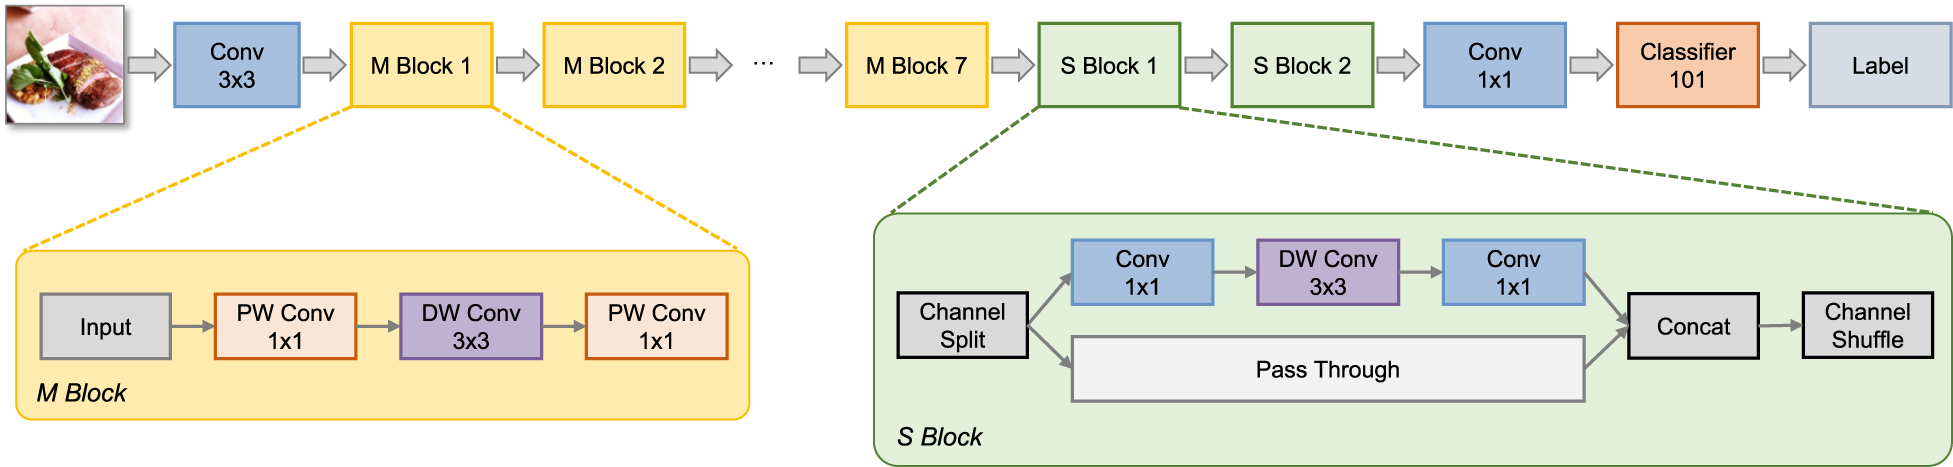
Overview of the proposed MSNet.
The M Block aims to reduce the number of parameters and computational complexity of CNNs while ensuring that the model’s performance remains largely unaffected. The M Block decomposes conventional convolution operations into two independent suboperations: DW Conv and PW Conv. DW Conv independently processes each input channel, while PW Conv linearly combines the output from each DW Conv to generate the final feature map. This decomposition strategy allows the model to achieve higher computational efficiency while maintaining performance.
Depthwise Convolution (DW Conv)
Before introducing DW Conv, it is essential to review conventional convolution. For an input of


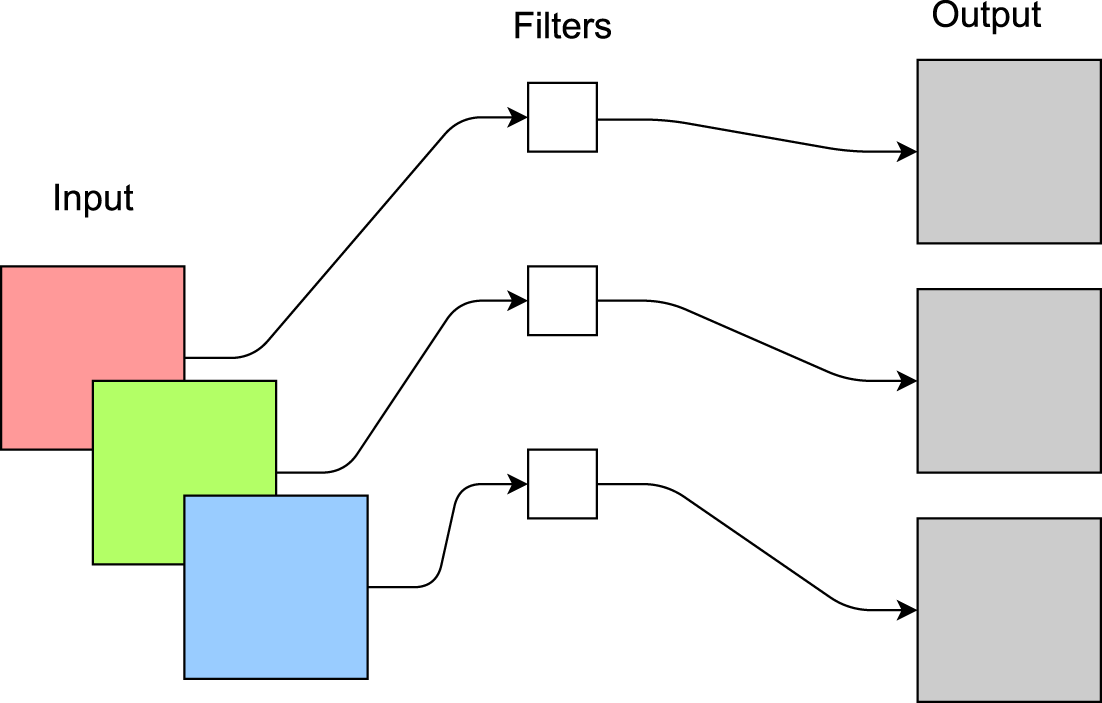
Diagram of depthwise convolution operation.
Compared to traditional convolution operations, the number of kernels equals the number of input channels, reducing the computational cost to
As illustrated in Figure 3, PW Conv uses

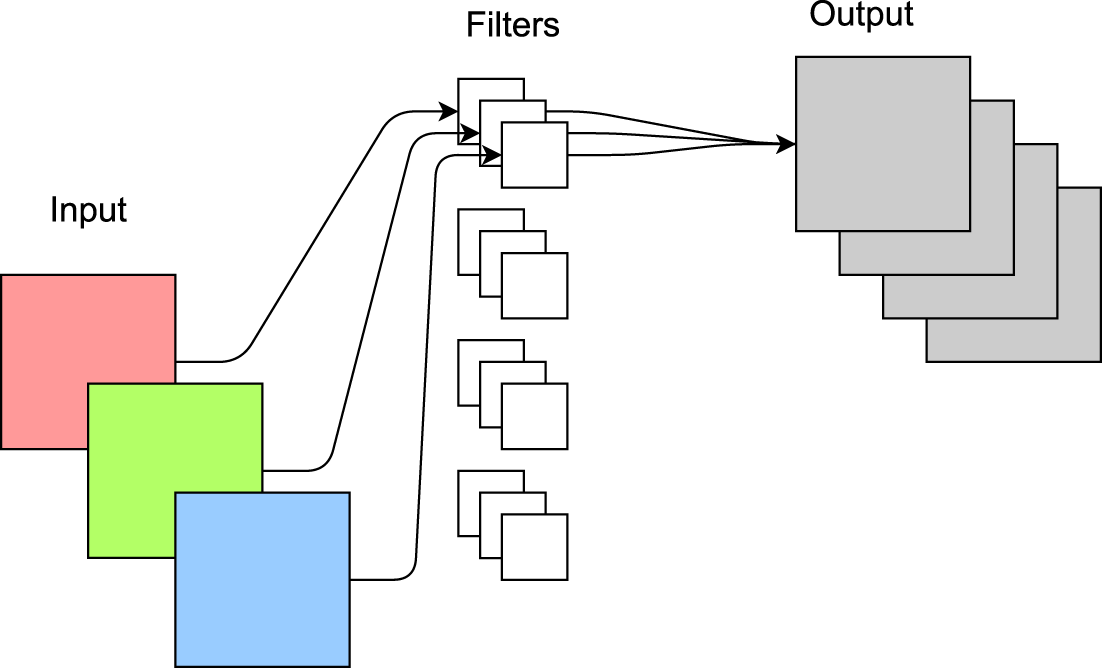
Diagram of pointwise convolution operation.
Compared to conventional convolution, the computational cost is reduced to
The combined computational cost of depthwise separable convolution, compared to conventional convolution, is given by equation (4):

The S Block is inspired by the core structural elements of the ShuffleNetV2 model (Ma et al., 2018), achieving efficient model compression and acceleration. Firstly, the S Block divides the input features into two parts, maintaining the same number of input and output channels for each part. One part undergoes no operations to reduce parameter count and computational complexity, while the other part uses grouped convolutions to lower memory access costs. The S Block also introduces the channel shuffle operation, which rearranges the feature maps to increase feature diversity and enhance model performance. As shown in Figure 4, the channel shuffle operation enables the model to better capture relationships between different features without significant additional computational costs, thereby improving the model’s representational capacity.
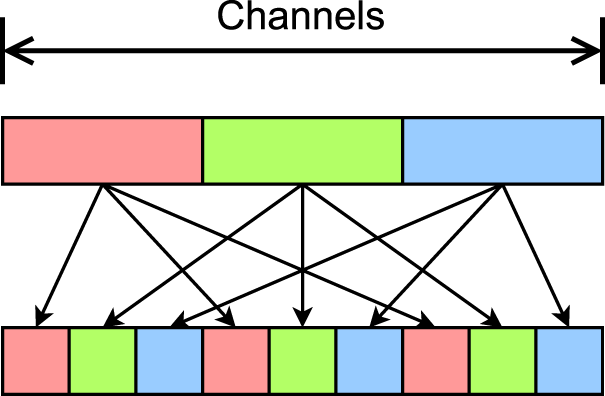
Conceptual diagram of the channel shuffle operation.
The structure of MSNet is carefully designed with computational constraints in mind. However, in its practical implementation, there remains redundancy in computational precision. To address this, we introduce MSNet-Lite, a more lightweight version of MSNet, achieved through quantization techniques. The CNN model in this study mainly employs static quantization, a model optimization technique that quantizes weights and activations posttraining. Unlike dynamic quantization, static quantization’s parameters (such as scaling factors and zero points) are precomputed using a calibration dataset and remain unchanged during inference.
The core idea of MSNet-Lite is to use fewer bits to represent weights and activation values, thereby reducing the model’s size and improving inference speed. During quantization, the original floating-point values are mapped to a smaller range, typically 8-bit integers, with an additional 16-bit floating-point method applied in this study. This process requires a calibration dataset to determine the optimal quantization parameters, ensuring high accuracy is maintained. Static quantization is primarily applied during the final deployment stage of deep learning models, particularly in performance-constrained environments such as embedded systems. By employing static quantization, memory usage, and hardware requirements are significantly reduced, allowing efficient execution of deep learning models on such devices. The specific quantization process is as follows.
Calibration Phase
A calibration dataset is used to perform forward propagation through the model, recording the maximum, minimum, and distribution of activation values at each layer. These statistics are used to compute the quantization parameters, such as the scaling factor and zero point. The scaling factor maps floating-point values to the quantized range, and the zero point ensures that the floating-point zero value is accurately represented after quantization. The calculation methods for these parameters may vary depending on the quantization tools and frameworks used. In this study, we consider factors such as the maximum and minimum activation values and the quantization bit width. Additionally, to enhance computational efficiency, we fuse adjacent modules, further optimizing the quantization process.
Quantization Phase
In the quantization phase, the calculated quantization parameters are used to quantize the model’s weights and activations (Liang et al., 2021). Firstly, the weights are quantized using equation (5):

Next, if activation quantization is performed, it follows a similar process as weight quantization. The same quantization parameters are used to quantize the activations, which are dynamically generated during inference. Ensuring that the activations are quantized using the calibration phase-determined parameters guarantees consistency between activation and weight quantization.
Model conversion involves replacing the original model’s parameters and activation values with their quantized counterparts to generate the quantized model. This process may involve serialization and deserialization of the model, depending on the quantization tools and frameworks used. The primary advantages of static quantization include significantly reducing model size, improving inference speed, and lowering energy consumption, enabling the MSNet-Lite models to run efficiently on resource-constrained devices. Additionally, static quantization enhances the model’s privacy and security, as the quantized model is more resistant to reverse engineering attacks.
Experiments
Datasets
In this study, we use three datasets for experimental evaluation in food image classification: ETHZ Food-101 (Bossard et al., 2014), Vireo Food-172 (Chen & Ngo, 2016), and ISIA Food-500 (Min et al., 2020). These datasets offer a broad spectrum of food categories and diversity, providing a comprehensive benchmark to evaluate the performance of different image classification algorithms.
ETHZ Food-101
The ETHZ Food-101 dataset, created by Bossard et al. (2014), contains 101 different types of food, with each type represented by 1,000 images, totaling 101,000 images. These images were taken under various environments, angles, and lighting conditions, providing excellent data diversity and posing a significant challenge for image recognition. The purpose of the ETHZ Food-101 dataset is to promote the development of food image recognition technology and serve as a benchmark for evaluating different image recognition algorithms. The food types in the dataset cover various culinary styles and cultural backgrounds, including food from Asia, Europe, and America. As shown in Figure 5, there are 100 samples from the ETHZ Food-101 dataset.
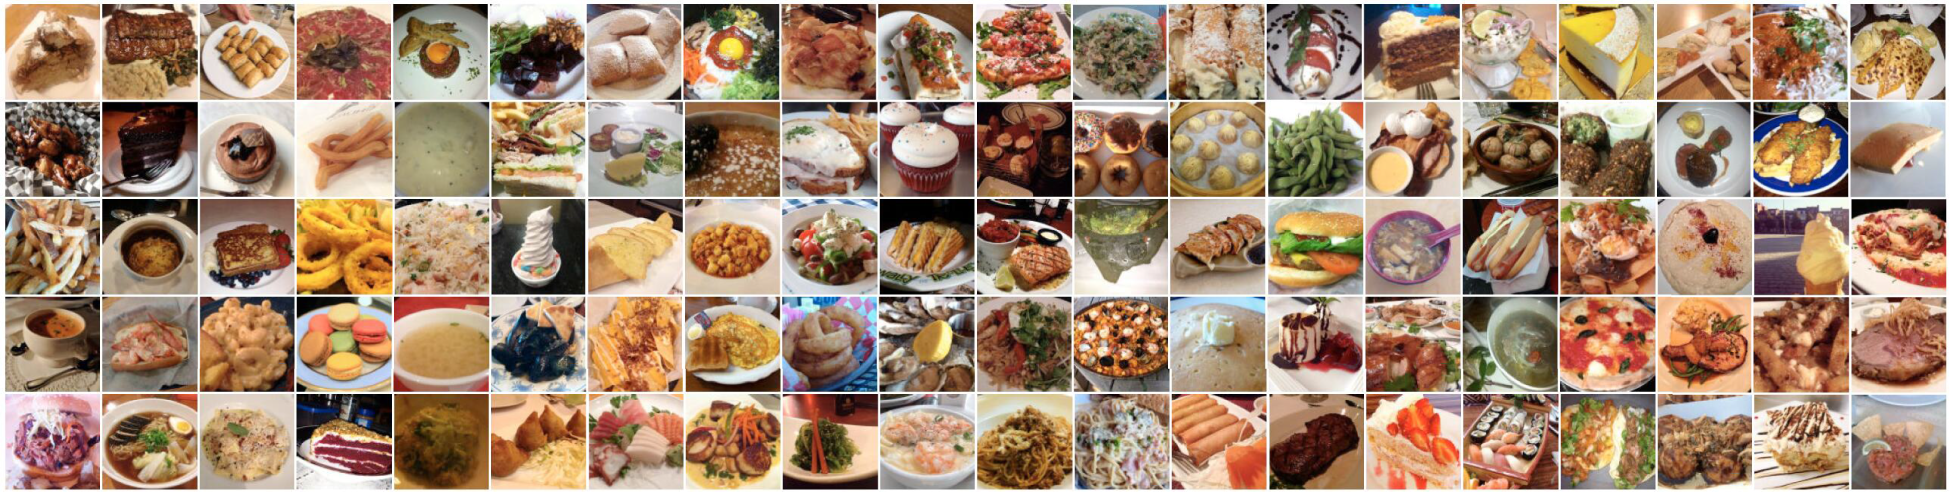
Example images from the ETHZ Food-101 dataset.
The Vireo Food-172 dataset expands upon the diversity of food categories by including 172 classes, with approximately 110,241 images (Chen & Ngo, 2016). This dataset captures a wide range of foods from both Western and Asian cuisines, offering a complex challenge due to its increased class diversity and class imbalance. Vireo Food-172 dataset is particularly challenging for classification models because it includes visually similar dishes, such as those with similar garnishes or sauces, requiring the model to distinguish subtle differences. A sample of the images from the Vireo Food-172 dataset is shown in Figure 6, illustrating the variety of foods included in the dataset.
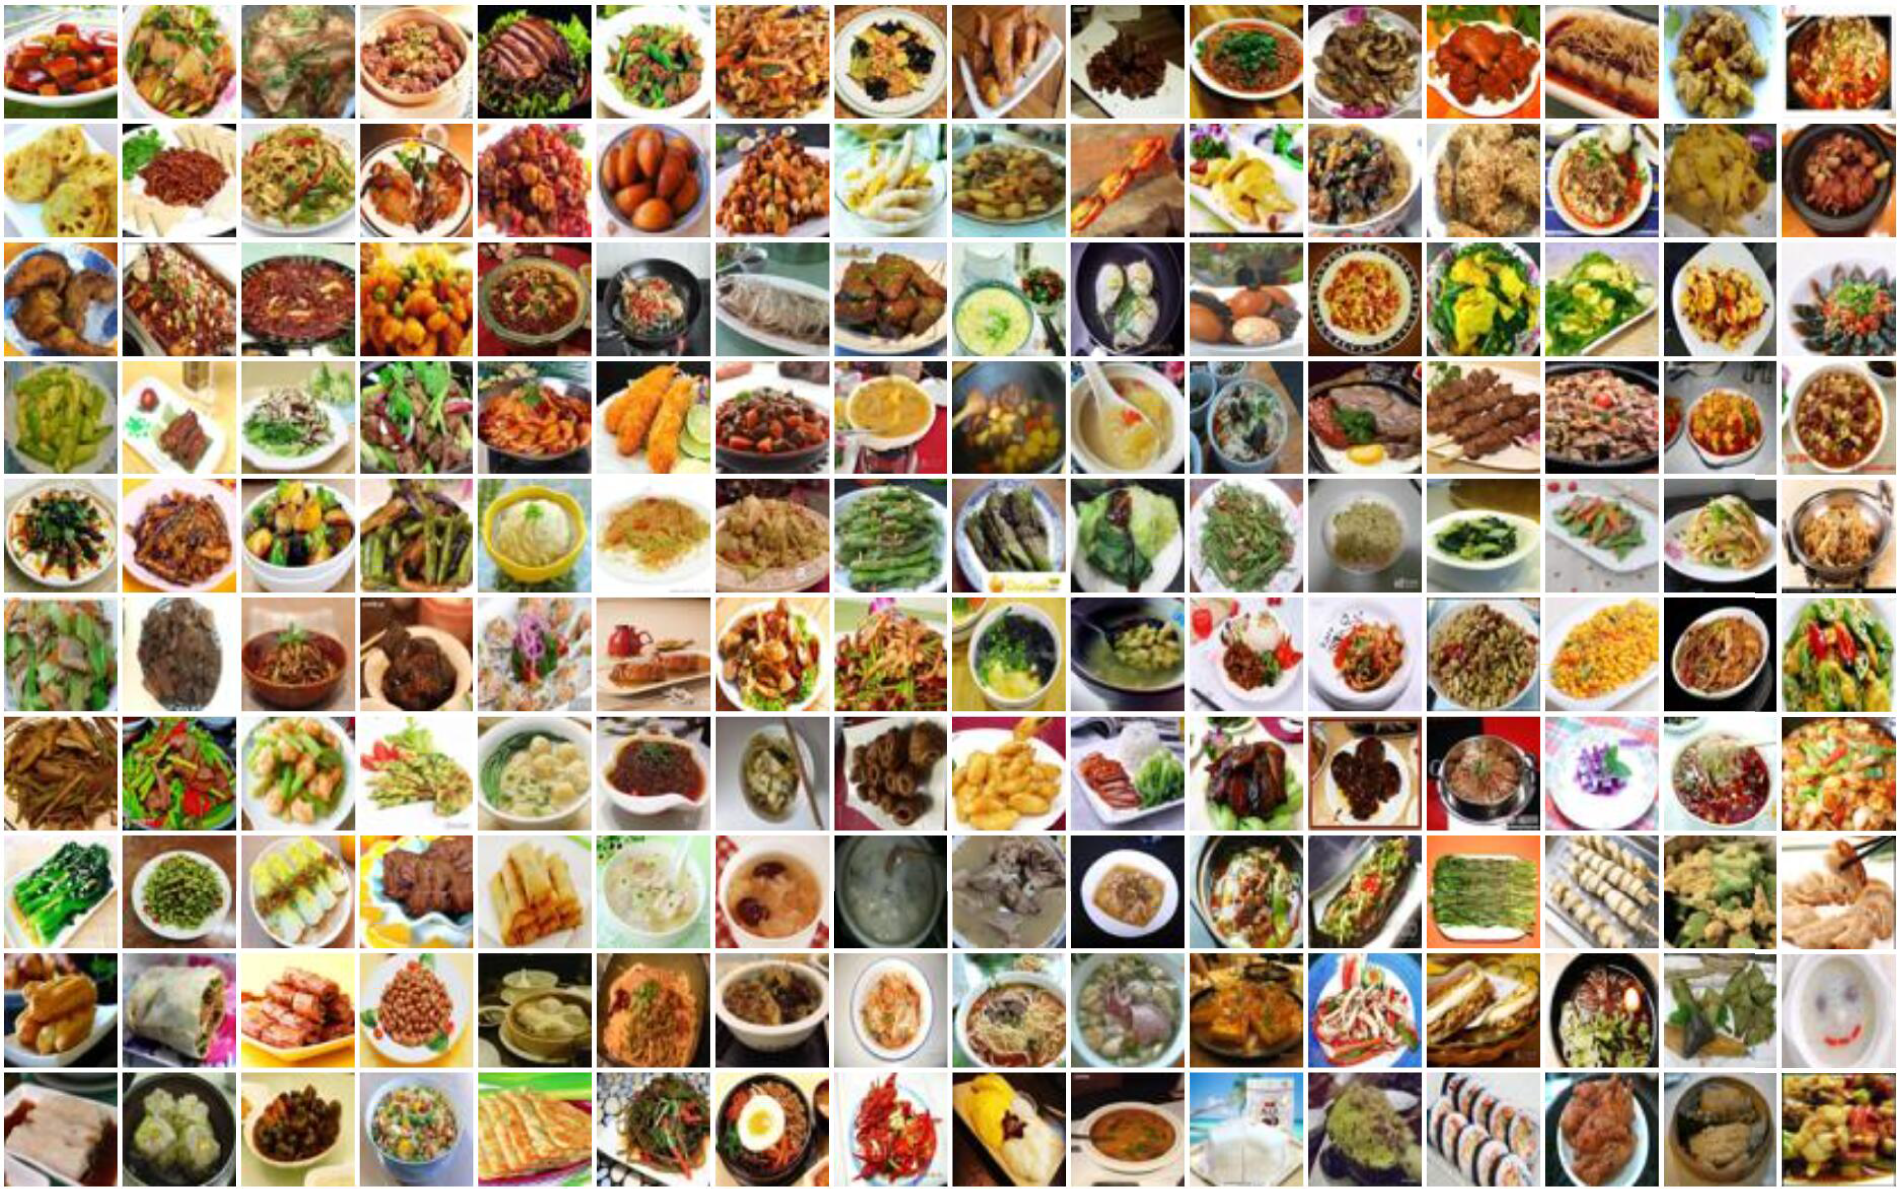
Example images from the Vireo Food-172 dataset.
The ISIA Food-500 dataset is a large-scale dataset for food classification tasks, featuring 500 different food categories and over 399,726 images (Min et al., 2020). This dataset provides extensive diversity, encompassing a wide range of food items from various regions, preparation methods, and presentation styles. Due to the large number of categories, ISIA Food-500 dataset serves as a comprehensive benchmark for models, especially for fine-grained food classification tasks where cross-cultural and culinary diversity is essential. This dataset is ideal for evaluating the scalability and adaptability of models in handling diverse and large-scale food classification challenges. Figure 7 shows a selection of images from the ISIA Food-500 dataset, highlighting its broad coverage of food types.
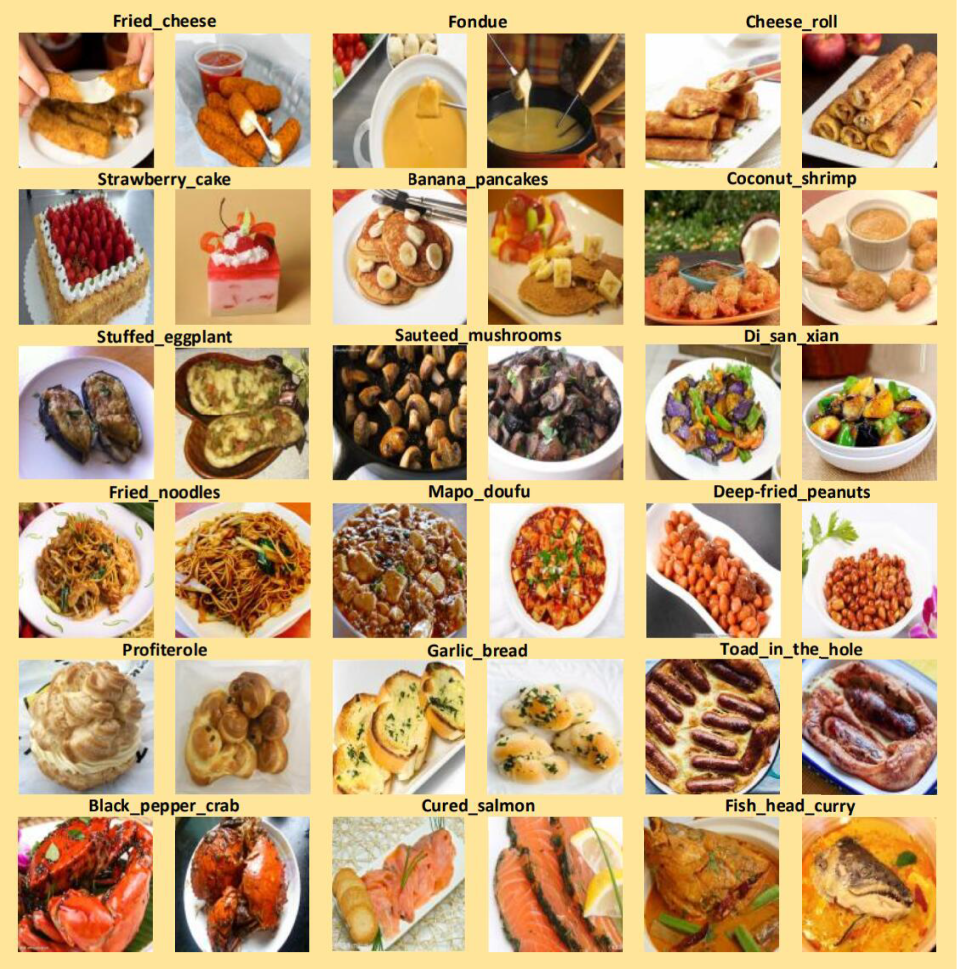
Example images from the ISIA Food-500 dataset.
Together, the ETHZ Food-101, Vireo Food-172, and ISIA Food-500 datasets form a diverse and comprehensive foundation for evaluating food image classification models. By leveraging these datasets, our study is able to assess the model’s robustness, adaptability, and generalization across both small- and large-scale food image datasets. All the datasets allow for a broader evaluation of the model’s performance across culinary styles, regional specialties, and various environmental conditions.
Table 1 provides a comparison of the basic information of the three datasets. In the following sections, we use the term “Short name” to refer to these three datasets.
Comparison of the Three Food Datasets.
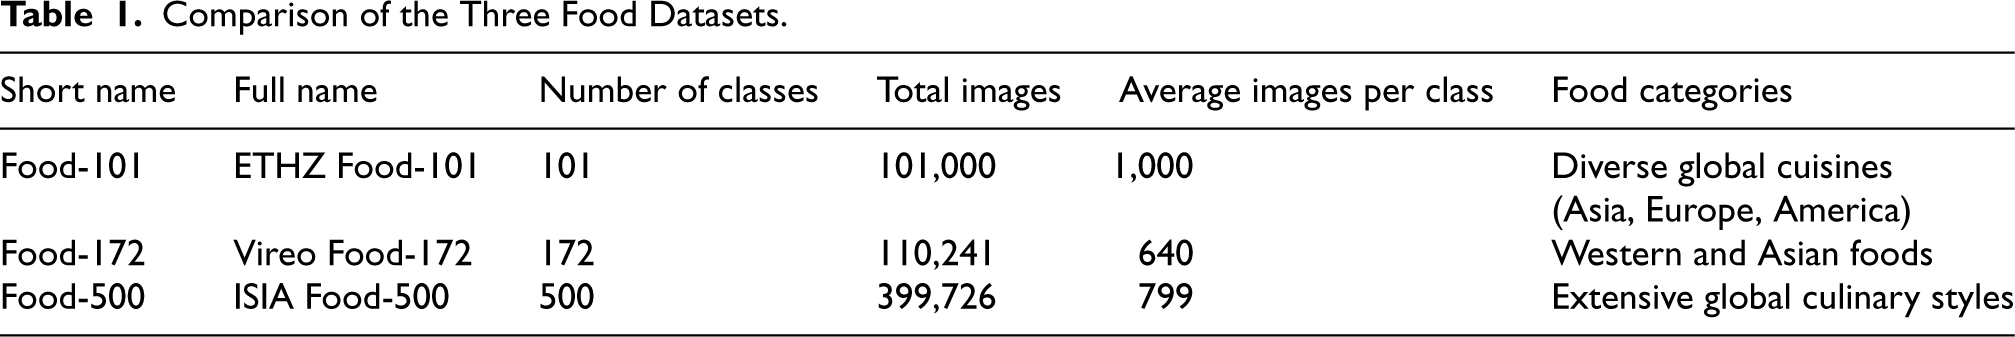
Comparison of the Three Food Datasets.
In this study, we use two common classification evaluation metrics: top-1 accuracy and top-5 accuracy. The two metrics comprehensively evaluate the model’s performance in food image classification tasks.
Top-1 Accuracy
Top-1 accuracy is one of the most commonly used classification evaluation metrics. It represents the accuracy of the model’s predicted category being exactly the same as the actual category. Specifically, for each test image, if the top-ranked predicted category matches the actual category, the prediction is considered correct. Top-1 accuracy can be defined by equation (6):

Top-5 accuracy is another common evaluation metric, considering the top five possible categories predicted by the model. Specifically, for each test image, if the actual category is among the top five predicted categories, the prediction is considered correct. Top-5 accuracy can be defined by equation (7):

The Micro-F1 score is a commonly used evaluation metric in multiclass classification tasks, particularly advantageous in scenarios with imbalanced class distributions. This metric aggregates the contributions of all classes by counting each correctly classified instance equally, regardless of its class. To compute Micro-F1, both micro-precision and micro-recall are first calculated, as shown in equations (8) and (9):


Once 
The Macro-F1 score, in contrast to Micro-F1, assesses the model’s performance across all classes individually by giving each class equal importance, regardless of its frequency. To compute Macro-F1, we first calculate precision and recall for each class 


The Macro-F1 score offers insights into the model’s performance for each class individually, making it more sensitive to performance variations across classes, especially for minority classes. In the context of food image classification, the Macro-F1 score evaluates how well the model handles less frequent or harder-to-classify food items, thereby providing a balanced view of classification accuracy across diverse food categories.
Although the Food-101 dataset has good diversity, including food types, colors, shooting environments, and exposures, necessary preprocessing is still required. The preprocessing mainly includes size normalization, numerical normalization, and image augmentation.
Size normalization To ensure that the images input to the CNN have a uniform size, we scale all images to a fixed size. In this study, we choose to scale the images to Numerical normalization To accelerate convergence and stabilize the training process, we perform numerical normalization on the image pixel values. Specifically, we linearly map the image pixel values from the original range of Given that food images are a type of natural image, adopting normalization parameters from a general natural image dataset such as ImageNet enhances the model’s general applicability. This approach ensures that the preprocessing techniques can be applied not only to Food-101 dataset, but also to other food-related datasets, increasing the model’s adaptability across various contexts. Image augmentation To increase the diversity of the dataset and improve the model’s robustness, we adopt the following image augmentation techniques. Specific operations include random cropping, flipping, rotating, brightness adjustment, and contrast adjustment. These augmentation methods can simulate different shooting conditions and environmental changes, enabling the model to better adapt to real-world variations. The image augmentation techniques used in this study are as follows:
Random cropping: Randomly crop a subregion from the original image and scale it to the target size. This operation can generate features from different perspectives. Flipping: Randomly flip the image horizontally. This is suitable for most food images as they generally do not have significant directionality. Rotating: Randomly rotate the image within a certain range to simulate different shooting angles. Brightness and contrast adjustment: Randomly change the brightness or contrast of the images to enhance the model’s adaptability to different lighting conditions.
By applying these preprocessing techniques, which are consistent with general image preprocessing methods, the model gains improved robustness and adaptability to variations common across natural image data. This consistency allows for broader applicability, as the preprocessing methods used here can be directly transferred to other food image datasets, enhancing the model’s versatility in food-related tasks.
The hardware and software environment used in this study is as follows: CPU: Intel Xeon Platinum 8352V @ 2.10 GHz; Memory: 128 GB; OS: Ubuntu 20.04; GPU: RTX 3090 (24 GB); CUDA version: CUDA 11.8; Python version: 3.8; and PyTorch version: 2.0.0.
In the experiments, various optimization strategies were used to ensure the effectiveness of the training and the convergence of the model.
Optimizer
We chose the Adam optimizer to optimize the model’s parameters. The Adam optimizer is a first-order gradient-based optimization algorithm that combines the advantages of AdaGrad and RMSProp, allowing for adaptive learning rate adjustments. It performs well in handling sparse gradients and nonstationary objectives, making it suitable for MSNet training tasks.
Loss Function
To measure the difference between the model’s predictions and the actual labels, we used the cross-entropy loss function (Shore & Gray, 1982). Cross-entropy loss is a commonly used loss function for classification problems and is effective in handling multiclass food image classification tasks, performing well with imbalanced data.
Learning Rate Scheduling
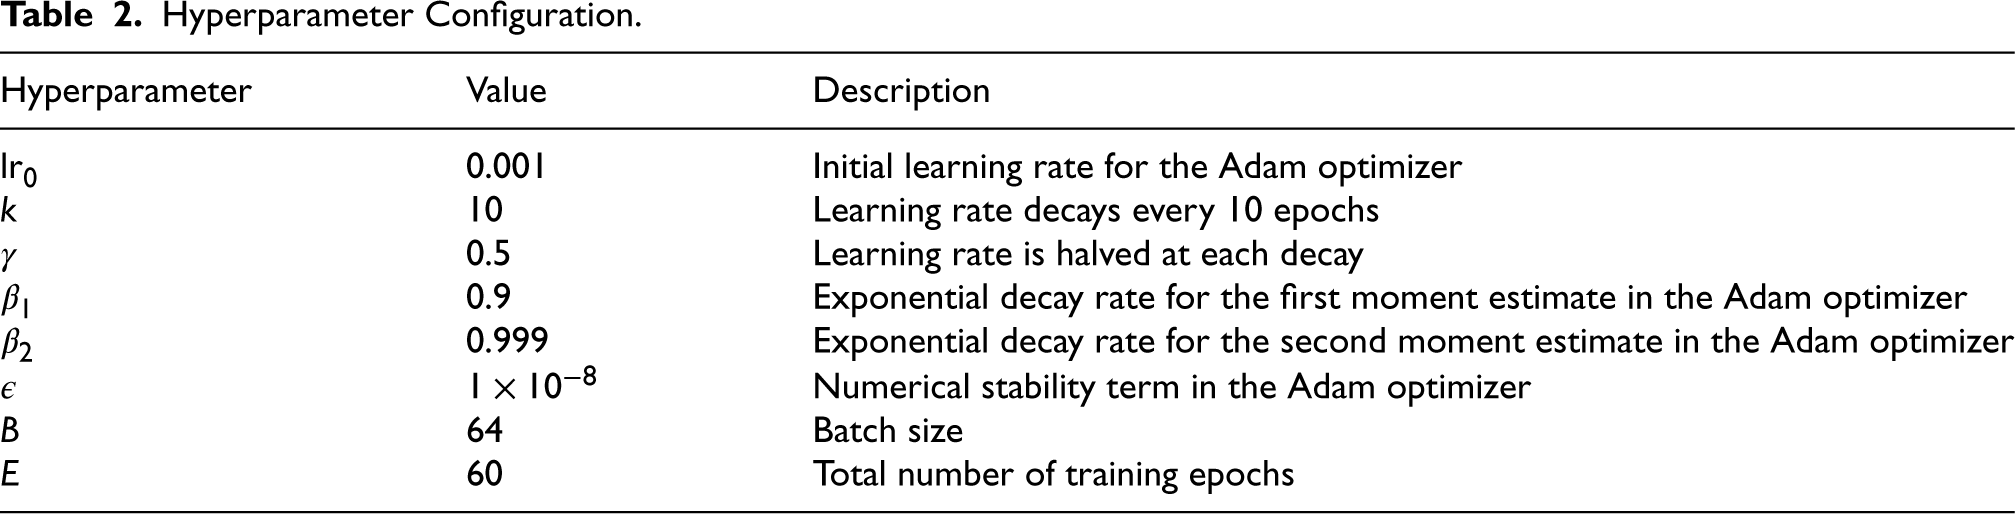
The learning rate is one of the most important hyperparameters during training. We employed a learning rate decay strategy. Specifically, we used the StepLR learning rate scheduler, which decays the learning rate by 50% every 10 epochs.
The learning rate schedule can be denoted as equation (15):

The hyperparameters used in this study are shown in Table 2.
Hyperparameter Configuration.
In this study, we use the PyTorch framework to quantize the MSNet model trained on the Food-101 dataset. First, ensure that the model is trained and in evaluation mode. Then, specify the quantization type and parameters, including the scaling factor and offset. Next, use equation (5) to convert the model into a quantized version.
The quantization precision for the model is determined as INT8 and FP16. Integer quantization uses the commonly known quantization library FBGEMM. FBGEMM is an open-source high-performance core library from Facebook, focusing on optimization for inference (Khudia et al., 2021). Specifically optimized for low-precision, FBGEMM supports small-batch efficient low-precision general matrix multiplication operations, which are core computations in deep learning models. Additionally, FBGEMM includes techniques to minimize accuracy loss, such as row-wise quantization and outlier-aware quantization.
Then, the model’s training set is used to calibrate the quantization parameters, determining the original floating-point values’ mapping to quantized low-precision values, minimizing accuracy loss due to quantization. After calibration, the model is converted into a quantized version.
While quantizing to INT8, we also perform a higher precision quantization, adopting FP16 precision. The FP16 quantized model, though larger than the INT8 model, offers advantages in terms of testing time and model size compared to the FP32 model, with minimal accuracy change. Given that embedded processors can now execute FP16 operations, the FP16 model has practical application significance.
Experimental Results
The experimental results of this study are shown in Tables 3 to 5.
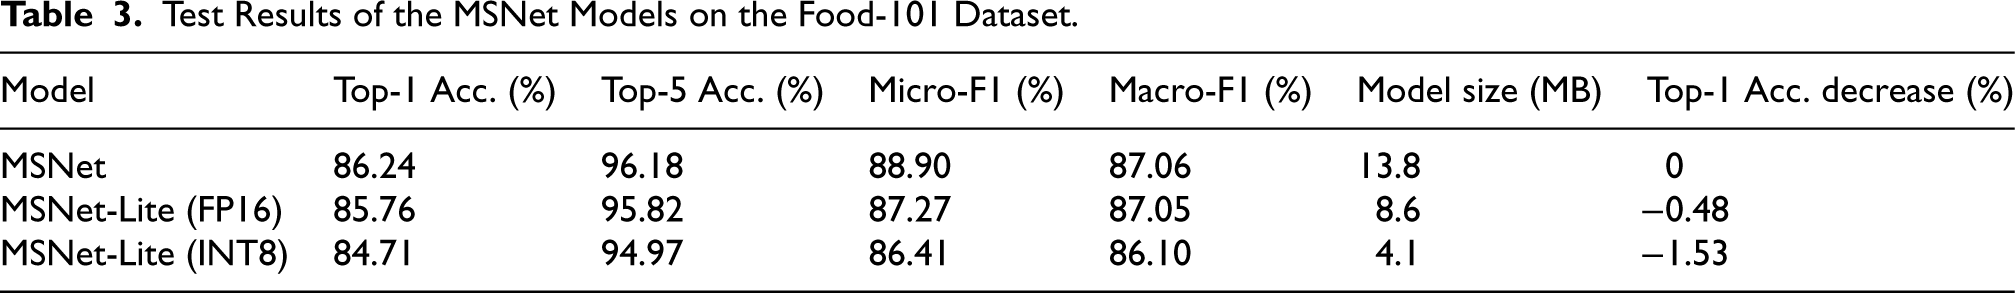
Test Results of the MSNet Models on the Food-101 Dataset.
Test Results of the MSNet Models on the Food-101 Dataset.
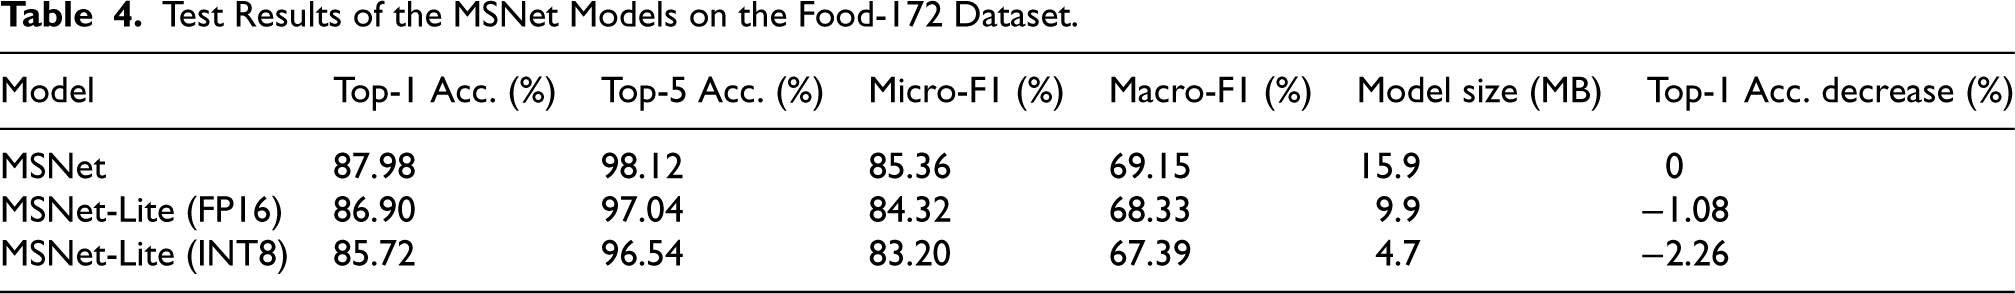
Test Results of the MSNet Models on the Food-172 Dataset.
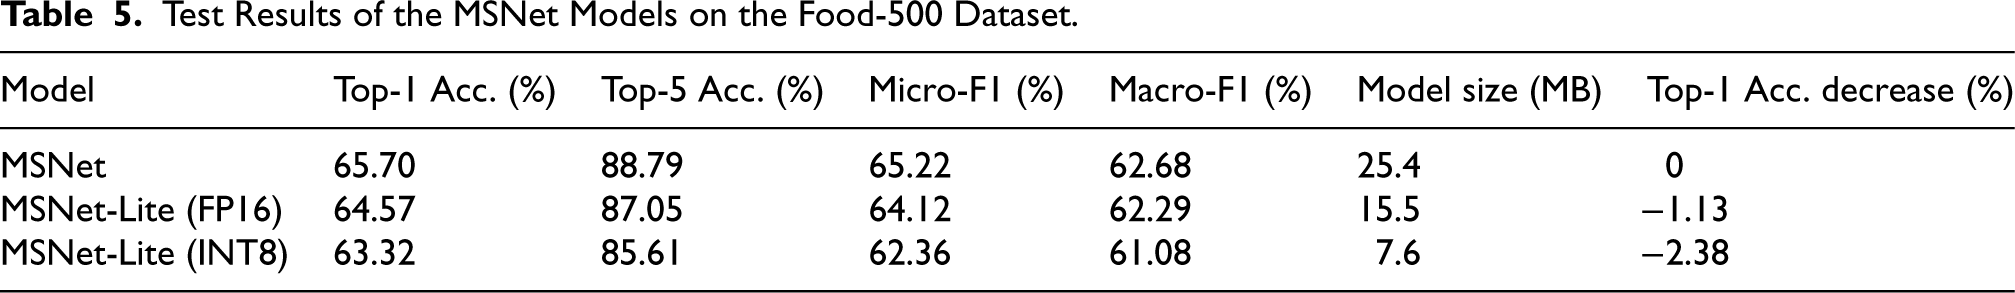
Test Results of the MSNet Models on the Food-500 Dataset.
As shown in Table 3, the MSNet model achieves a top-1 accuracy of 86.24% with a model size of 13.8 MB, which is considered lightweight on the Food-101 dataset. By further quantizing the MSNet model, the MSNet-Lite (FP16) and MSNet-Lite (INT8) models significantly reduce in size. MSNet-Lite (FP16) has a model size of 8.6 MB with a compression ratio of 62.32%, and top-1 accuracy decreases by only 0.48%. MSNet-Lite (INT8) has a model size of 4.1 MB with a compression ratio of 29.71%, and top-1 accuracy decreases by 1.53%.
In Table 4, we observe the performance of the MSNet series models on the Food-172 dataset. The original MSNet model achieves a top-1 accuracy of 87.98% with a model size of 15.9 MB, slightly larger than its Food-101 dataset counterpart due to the increased complexity needed for more diverse classes. Quantization reduces the model size significantly: MSNet-Lite (FP16) compresses the model to 9.9 MB with a top-1 accuracy reduction of 1.08%, while MSNet-Lite (INT8) further reduces the model to 4.7 MB, with a top-1 accuracy decrease of 2.26%. These results show that MSNet can maintain robust performance on a larger and more complex dataset even when quantized. Although accuracy decreases slightly with increased compression, the tradeoff is acceptable, making MSNet-Lite models suitable for applications where both storage efficiency and classification of a wider range of food types are required.
Table 5 presents the results on the Food-500 dataset, which is the most challenging dataset in this study due to its large number of food categories. The original MSNet achieves a top-1 accuracy of 65.70% with a model size of 25.4 MB. On this dataset, quantization has a more noticeable impact on accuracy. MSNet-Lite (FP16) achieves a top-1 accuracy of 64.57% with a model size of 15.5 MB, reflecting a decrease of 1.13%. MSNet-Lite (INT8), while reducing the model size to 7.6 MB, experiences a top-1 accuracy decrease of 2.38%. This result highlights that while quantization reduces model size, the accuracy loss becomes more pronounced on datasets with higher complexity and finer-grained distinctions among classes.
These results demonstrate that model quantization can significantly reduce model size and storage requirements with acceptable accuracy loss, making it well-suited for food image recognition applications. The smallest model is only 4.1 MB, making it compact enough for deployment in embedded environments.
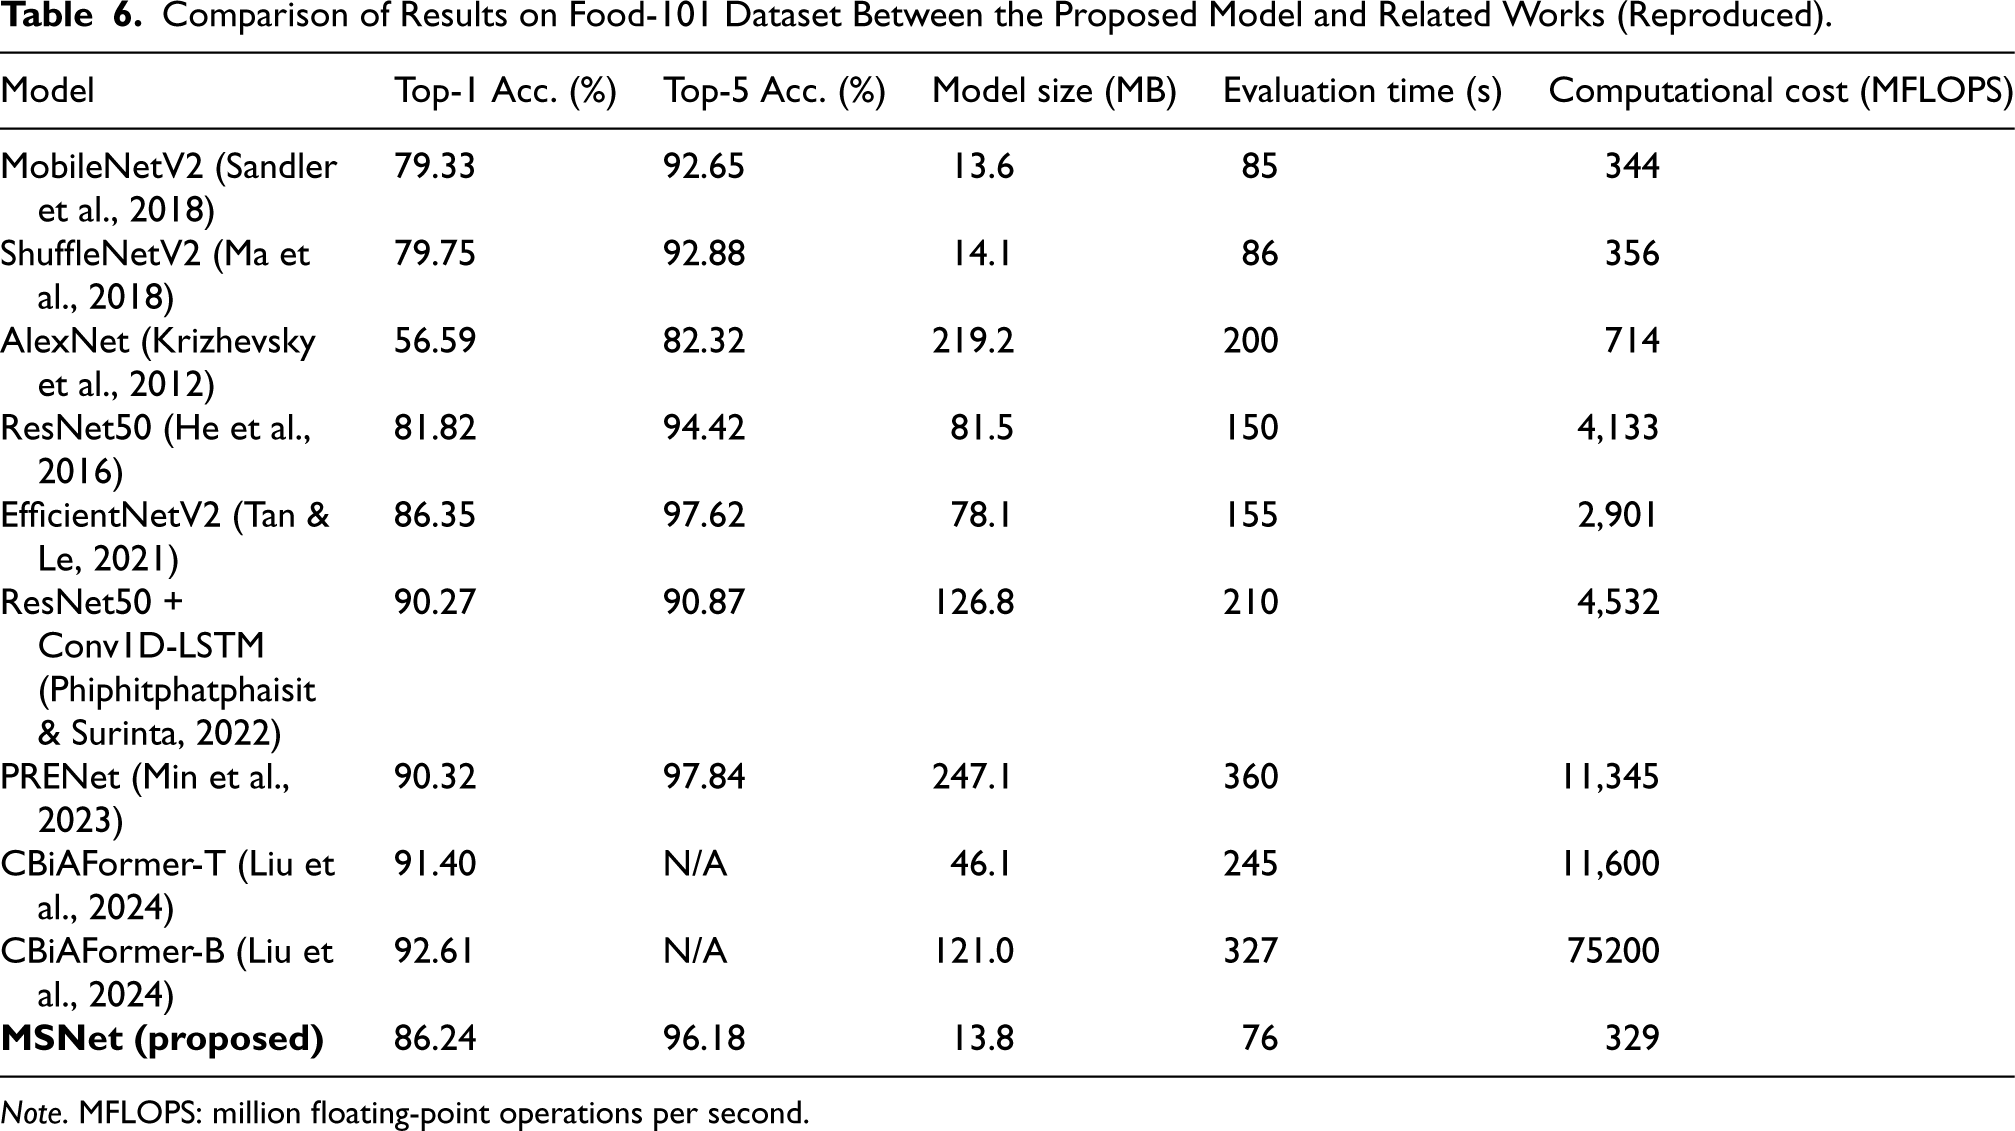
We compared the performance of the proposed MSNet model with mainstream CNNs. The results on the Food-101 dataset are shown in Table 6.
Comparison of Results on Food-101 Dataset Between the Proposed Model and Related Works (Reproduced).
Comparison of Results on Food-101 Dataset Between the Proposed Model and Related Works (Reproduced).
Note. MFLOPS: million floating-point operations per second.
We compared the performance of classical and recent models on the Food-101 dataset. As shown in Table 6, when comparing MSNet with MobileNetV2 and ShuffleNetV2, we can conclude that MSNet improves both top-1 and top-5 accuracy. This improvement is primarily due to the enhancements in the network structure, which help to improve feature diversity and information flow. When comparing MSNet with the classical AlexNet, MSNet’s accuracy is significantly higher, and its model size is much smaller, with lower computational cost. This improvement demonstrates the advancements in deep neural networks over the years and highlights MSNet’s lightweight advantages. When comparing MSNet with ResNet50, we observe that ResNet50’s accuracy is slightly lower than MSNet’s, but its model size and computational cost are substantially larger, at 81.5 MB and 4,133 million floating-point operations per second (MFLOPS), respectively. This indicates that while ResNet50 is a classic network structure, it is not well-suited for lightweight food image classification tasks on mobile devices. In the comparison with EfficientNetV2, although EfficientNet’s accuracy is slightly higher, its model size and computational cost are significantly larger, at 78.1 MB and 2,901 MFLOPS, respectively. This suggests that EfficientNet’s performance gains come at the expense of increased model size and computational cost, and it does not exhibit significant efficiency advantages over MSNet. Lastly, comparing MSNet with more recent models such as ResNet50+Conv1D-LSTM, PRENet, and CBiAFormer, we see that these models achieve high accuracy on the Food-101 dataset, with accuracies ranging from 90.27% to 92.61%. However, their parameter sizes and computational costs are so large that they are not feasible for lightweight devices. In contrast, MSNet, while slightly less accurate, maintains a significant advantage in being deployable on lightweight machines.
In summary, MSNet achieves a good balance between accuracy, model size, and computational efficiency, making it an efficient lightweight model. Compared to other models, MSNet maintains high accuracy while having a smaller model size and computational cost, making it highly suitable for applications on mobile and embedded devices.
To further compare with the state-of-the-art models, we reviewed related works on three datasets and presented the comparison in Table 7. The results indicate that all existing models have higher computational costs than our proposed MSNet. For instance, GSNet-2.0 and AFNet-2.5 have computational costs of 1,051.2 and 892 MFLOPS, respectively, while MSNet requires only 329 MFLOPS on the Food-101 dataset, which is significantly lower. On the more challenging Food-500 dataset, models such as GL-Swin achieve higher top-5 accuracy (89.17%) compared to MSNet (88.79%) but with an extremely high computational cost of 9,091 MFLOPS. In contrast, MSNet maintains reasonable accuracy with only 598 MFLOPS, showcasing its suitability for large-scale, complex datasets while remaining computationally feasible for lightweight deployment. Furthermore, based on the described model structures and implementations in the literature, we estimate that models without specified computational costs (e.g., Swin-B+PSD, DenseNet161+PSD, and RD-FGM) also likely have higher computational costs than MSNet. Overall, MSNet achieves a good balance between computational efficiency and accuracy, maintaining relatively high Top-1 and Top-5 accuracy with much lower computational costs.
Comparison of Results on Three Datasets Between the Proposed Models and Recent Works.
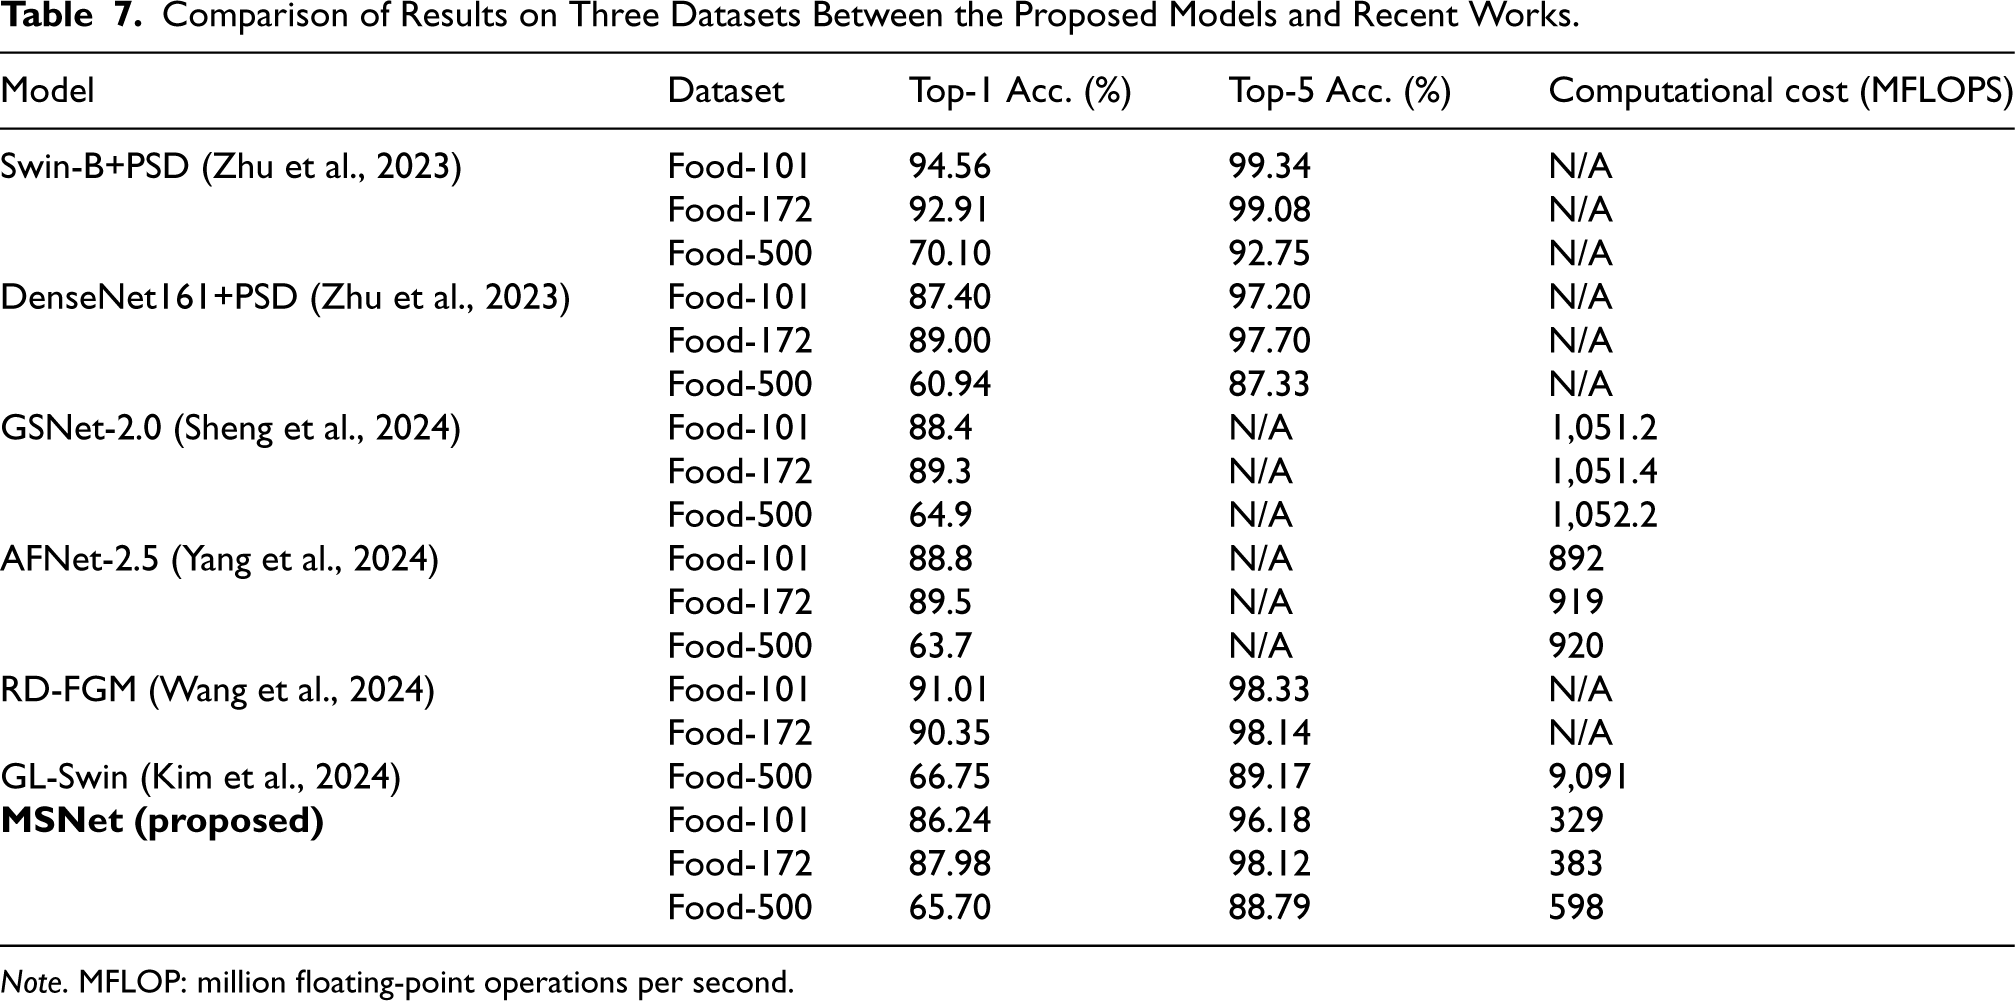
Note. MFLOP: million floating-point operations per second.
Semantic Feature Analysis
We used t-distributed stochastic neighbor embedding (t-SNE) to analyze the semantic features extracted by MSNet. As a popular nonlinear dimensionality reduction technique that projects high-dimensional data onto a two-dimensional plane, t-SNE preserves the local structure of the data (Van der Maaten & Hinton, 2008). This method is widely used for visualizing high-dimensional data. The basic idea of t-SNE is to learn a low-dimensional representation of data by minimizing the Kullback–Leibler divergence between the probability distributions in the original high-dimensional space and the embedding space. This ensures that the local structure of the data in the embedding space is as close as possible to its local structure in the original space, thereby preserving the local similarity of the data.
Due to the large number of categories in the Food-101 dataset, it is not feasible to display the full visualization. Therefore, we randomly selected two slices for semantic feature analysis, as shown in Figures 8 and 9. The beef salad and caprese salad in Figure 8, and the hamburger and hot dog in Figure 9, have similar appearances, so they are also close in the figures, further demonstrating the semantic validity of the features extracted by the MSNet model.
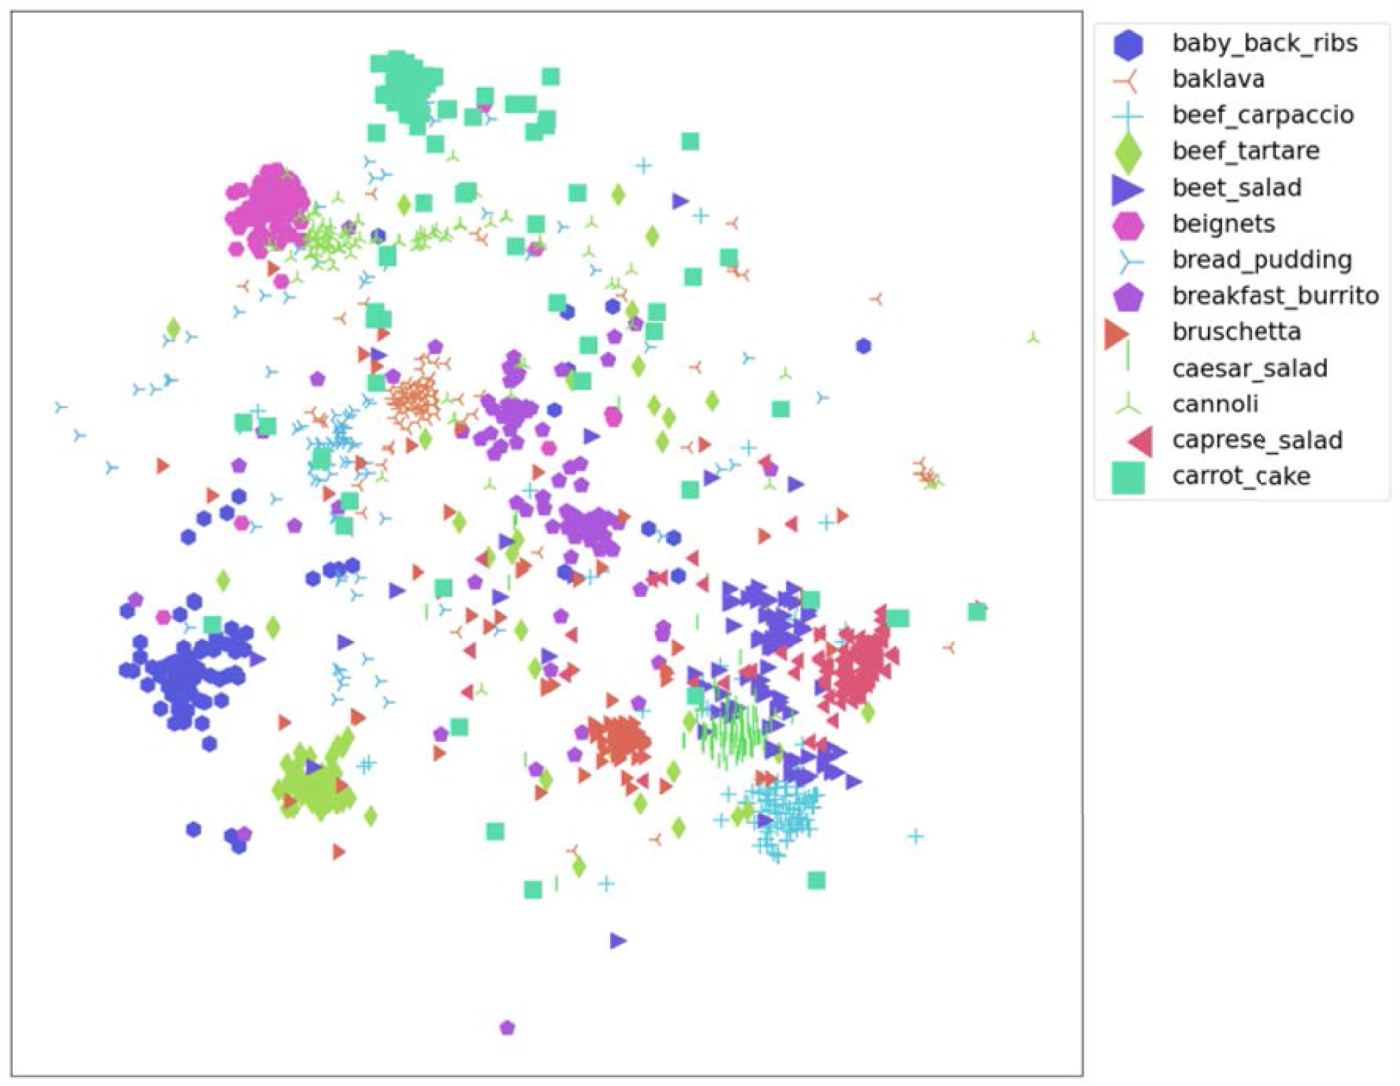
Semantic feature map extracted by MSNet (Slice 1).
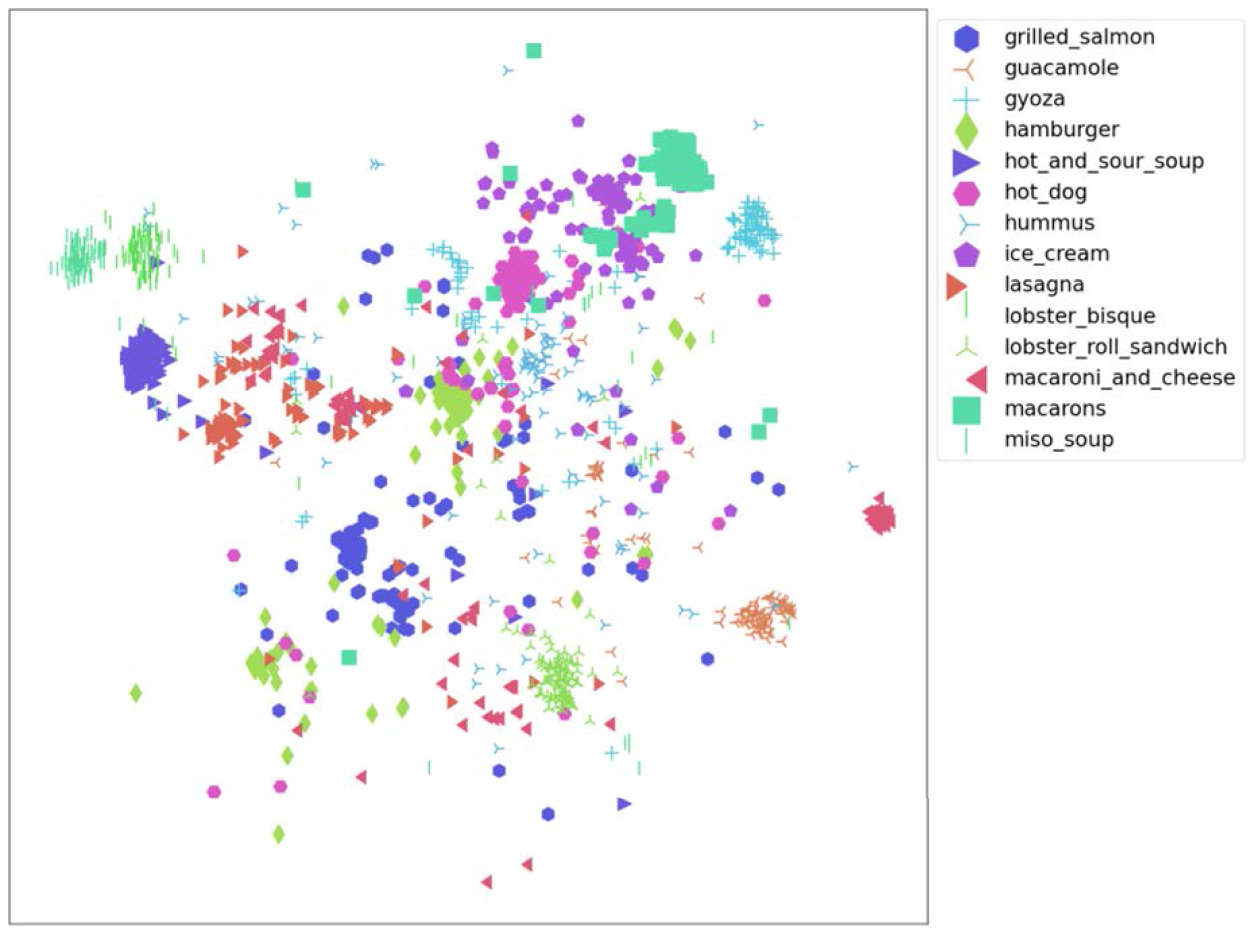
Semantic feature map extracted by MSNet (Slice 2).
Feature heatmap analysis is used to show the attention of CNNs on specific targets in the input image at different feature map layers. The heatmap usually uses color intensity to indicate attention on each pixel, with warmer colors representing higher attention.
We used Gradient-weighted Class Activation Mapping++ (Grad-CAM++) to generate heatmaps. Grad-CAM++ is a technique for interpreting deep learning model predictions (Chattopadhay et al., 2018). It allows us to visualize which areas of the model contribute most to the prediction. Grad-CAM++ is an improved version of Grad-CAM, enhancing visualization accuracy by considering more high-level features and finer spatial information. As shown in Figure 10, the Grad-CAM++ analysis results for the proposed model indicate that MSNet can correctly focus on the food subject to be identified, demonstrating the clear semantic capabilities of the proposed model. For instance, in the first image, the hotspot focuses on the foie gras in the foreground and largely ignores the background goose meat; in the fourth image, the model effectively extracts the complete features of the edamame, rather than just partial information.
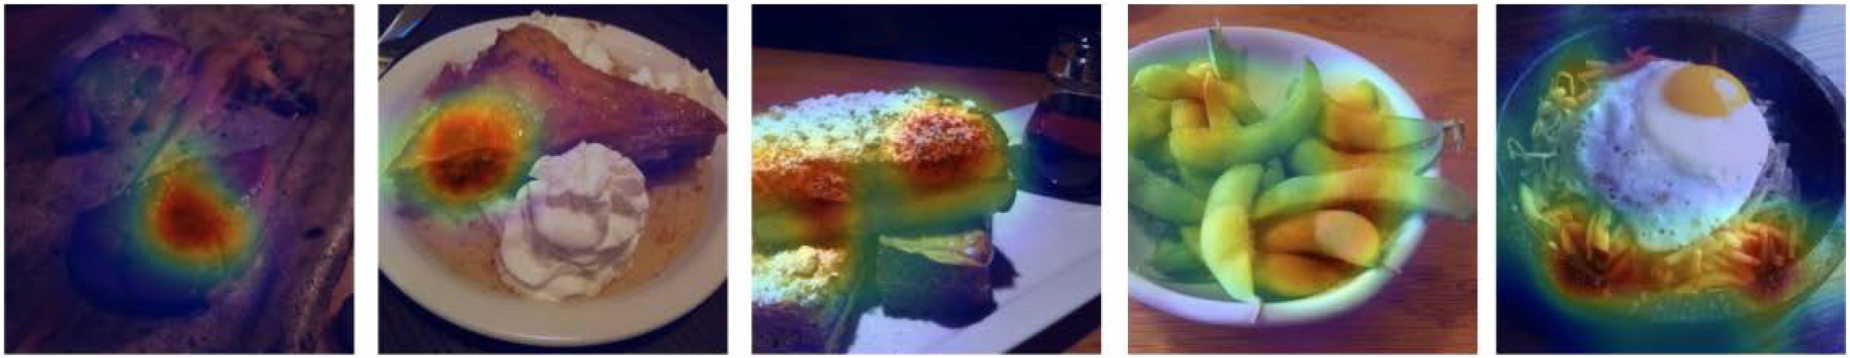
Feature heatmap analysis results of MSNet.
For comparison, we also plotted the feature heatmap of MobileNetV2, as shown in Figure 11. Compared to MobileNetV2, MSNet’s feature extraction capability has also improved. The proposed model extracts feature more explicitly, such as broadly capturing the features of the entire salad in the last column, rather than limiting it to part of the food.
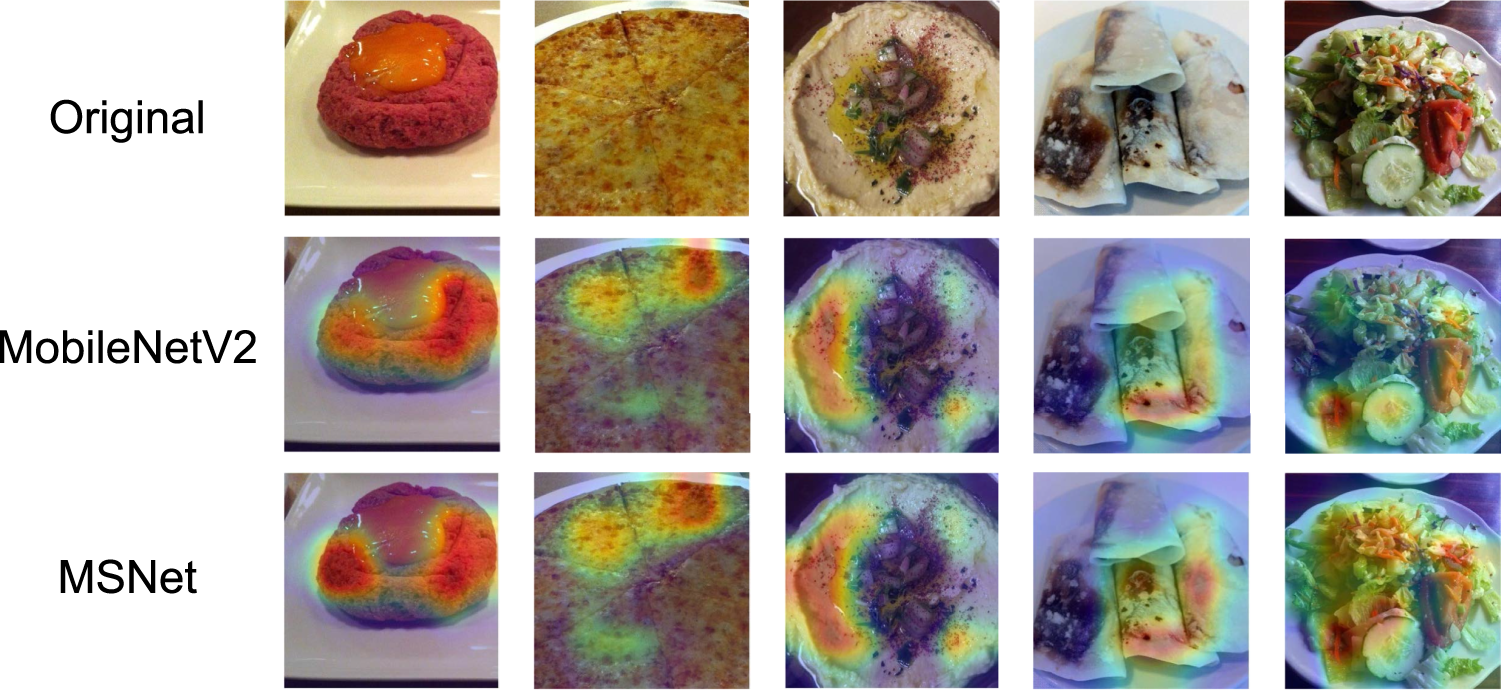
Feature heatmap comparison with MobileNetV2.
GradientShap is a method for interpreting deep learning model predictions, based on gradient computation and the core principle of Shapley values. Shapley values, from game theory, measure each player’s contribution to the cooperative game’s payoff (Kokhlikyan et al., 2020). In GradientShap, Shapley values are used to assess the contribution of each input feature (pixel) to the model output, indicating each pixel’s importance to the model’s prediction.
The results of gradient feature analysis are shown in Figure 12. We can observe the distinct shapes of the main features of the cake, indicating that the edges, corners, and textures of the image are very clear. These prominent gradient shapes allow us to easily observe whether the model accurately extracts the object’s feature information during the prediction process, enhancing the interpretability of the model’s predictions. The analysis of gradient features further validates the effectiveness of the proposed model.
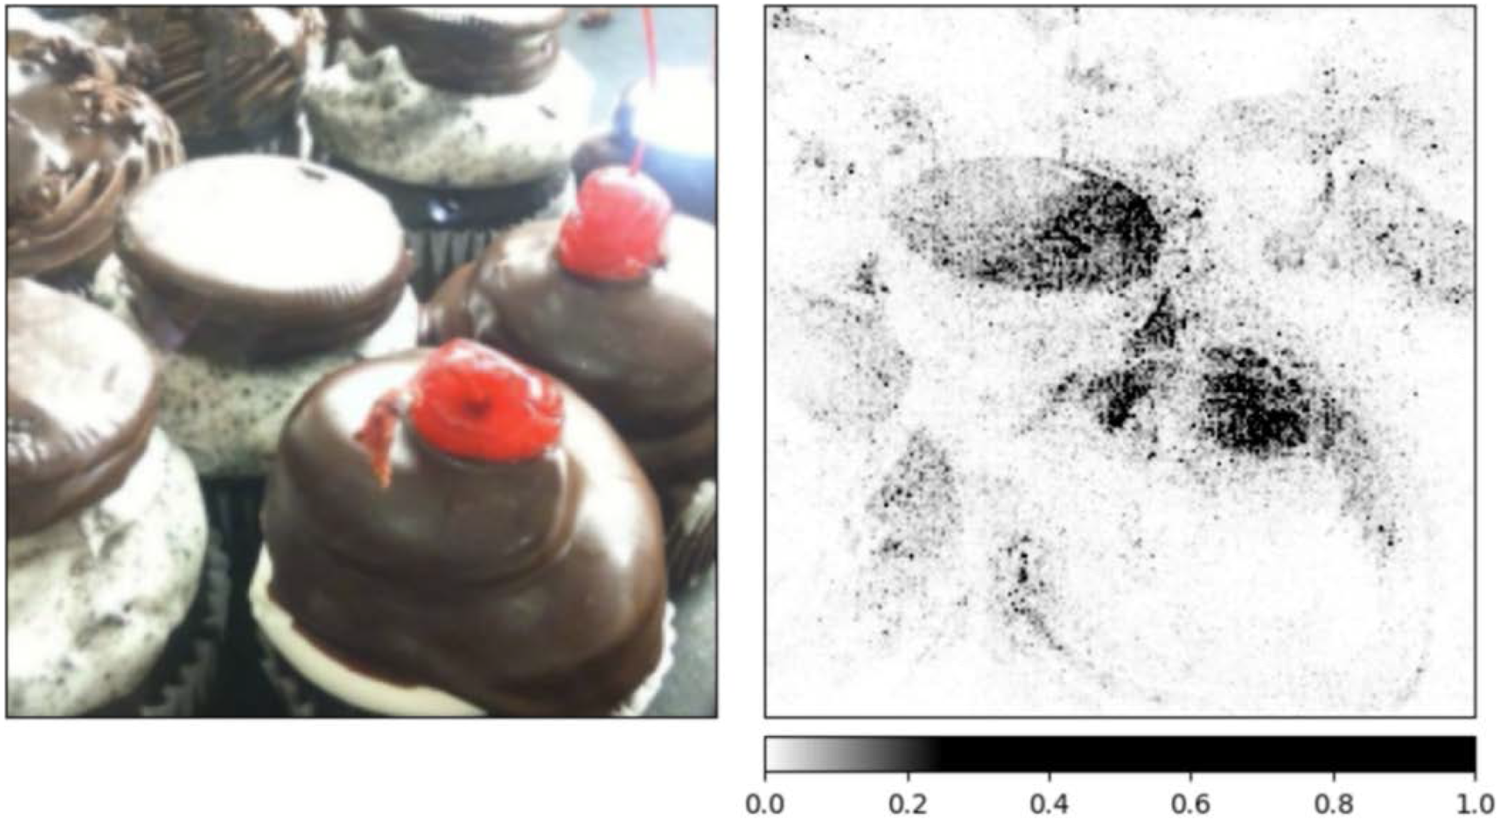
Gradient features extracted by MSNet.
To evaluate the contributions of different components in the MSNet model, we conducted an ablation study by removing specific blocks and comparing the performance of the modified models on three datasets: Food-101, Food-172, and Food-500. We examined the impact of removing the M Block and the S Block on the model’s accuracy.
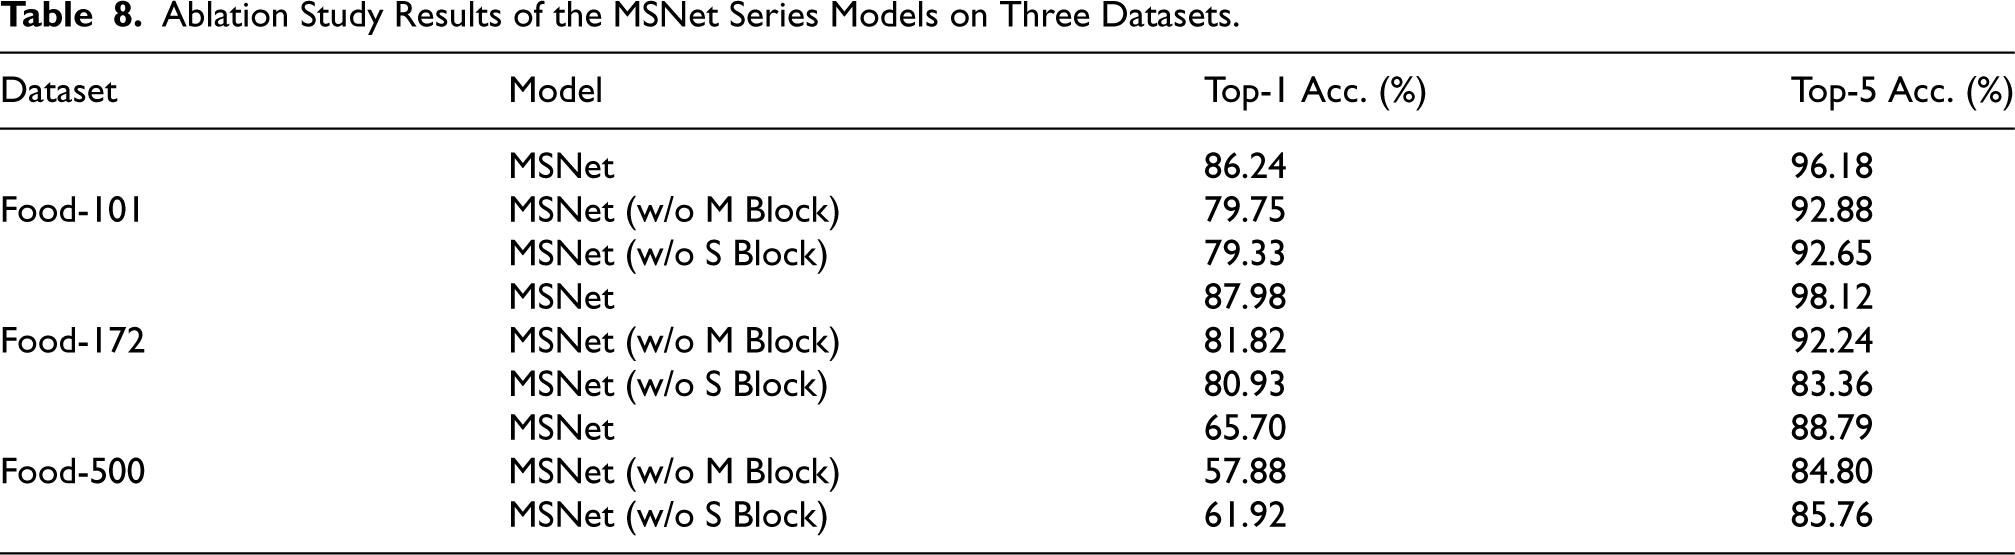
Table 8 summarizes the top-1 and top-5 accuracy results of the original MSNet model and its variants without the M and S Blocks.
Ablation Study Results of the MSNet Series Models on Three Datasets.
Ablation Study Results of the MSNet Series Models on Three Datasets.
On the Food-101 dataset, the original MSNet achieved a top-1 accuracy of 86.24% and a top-5 accuracy of 96.18%. However, when the M Block was removed, the top-1 and top-5 accuracy dropped to 79.75% and 92.88%, respectively, indicating a substantial performance decrease. Similarly, removing the S Block led to a top-1 accuracy of 79.33% and a top-5 accuracy of 92.65%. These results highlight the importance of both the M Block and S Block in capturing crucial features for accurate classification of Food-101 dataset.
For the Food-172 dataset, MSNet achieved a top-1 accuracy of 87.98% and a top-5 accuracy of 98.12%. Removing the M Block led to a reduction in top-1 accuracy to 81.82% and top-5 accuracy to 92.24%. Removing the S Block resulted in a top-1 accuracy of 80.93% and a top-5 accuracy of 83.36%. These decreases suggest that both blocks are essential for effectively generalizing to the more diverse classes in Food-172 dataset.
On the more challenging Food-500 dataset, MSNet achieved a top-1 accuracy of 65.70% and a top-5 accuracy of 88.79%. After removing the M Block, the top-1 and top-5 accuracy dropped to 57.88% and 84.80%, respectively. Similarly, removing the S Block resulted in a top-1 accuracy of 61.92% and a top-5 accuracy of 85.76%. These results indicate that both blocks contribute to capturing the fine-grained details necessary for distinguishing among a large number of classes in the Food-500 dataset.
In summary, the ablation study demonstrates that both the M Block and S Block play critical roles in the MSNet architecture. Removing either of these blocks leads to a notable decline in performance across all three datasets, underscoring their importance in extracting relevant features for food image classification.
Despite the promising performance of the MSNet model in food image classification tasks, certain limitations should be acknowledged.
The proposed model focuses on lightweight design, it does not achieve the highest performance in terms of accuracy. However, the proposed model prioritizes practical application scenarios, offering an efficient model architecture along with two quantized versions to cater to different deployment needs. In real-world applications, a balance between classification accuracy and computational complexity must be considered. The proposed model is specifically designed and trained for food image classification, and may not generalize well to other types of images. This specialization enhances its performance for food-related tasks but limits its applicability to nonfood image domains. The model’s performance decreases significantly when applied to highly diverse and large-scale datasets, as shown in the results on the Food-500 dataset. This indicates that the model may struggle to capture the fine-grained details necessary to distinguish between visually similar food items, especially when the number of classes is large and the interclass variation is minimal.
Conclusion
In this study, we proposed a lightweight CNN model, MSNet, specifically designed for food image classification. By utilizing optimized depthwise separable convolutions and channel shuffle operations, MSNet achieves a notable reduction in model sizes and computational costs while maintaining robust classification performance. Experimental results on three benchmark datasets—the Food-101, Food-172, and Food-500—demonstrate the model’s effectiveness, with top-1 accuracies of 86.24%, 87.98%, and 65.70%, and model sizes of 13.8 MB, 15.9 MB, and 25.4 MB, respectively. Further quantization produced two MSNet-Lite variants in FP16 and INT8 precision, reducing the model sizes to 8.6 MB and 4.1 MB on Food-101, 9.9 MB and 4.7 MB on Food-172, and 15.5 MB and 7.6 MB on Food-500, with minimal accuracy loss, making MSNet adaptable for deployment on resource-constrained devices such as mobile and embedded platforms.
Compared to existing models, MSNet achieves a balanced tradeoff between accuracy and computational efficiency, making it well-suited for real-world applications. The model demonstrates robustness and generalizability across datasets of varying complexity, effectively capturing essential features of food images. Future work will focus on enhancing MSNet’s structure to improve both accuracy and efficiency, as well as exploring deployment strategies to fully leverage its lightweight design in diverse practical applications.
Footnotes
Acknowledgements
We would like to thank Ruqi Ma for help with the preliminary experiments. Special thanks to Hongxiang Food Co., Ltd for its support.
Funding
The authors disclosed receipt of the following financial support for the research, authorship, and/or publication of this article: This work was supported in part by the National Natural Science Foundation of China under Grant No. 62302197, the Zhejiang Provincial Natural Science Foundation of China under Grant No. LQ23F020006, the Jiaxing City Science and Technology Project under Grant No. 2024AY40010, and the China Postdoctoral Science Foundation under Grant No. 2024M752366.
Declaration of Conflicting Interests
The authors declared no potential conflicts of interest with respect to the research, authorship, and/or publication of this article.