
Abstract
Aiming at the shortcomings of most current anomaly detection models, such as low detection accuracy and poor generalization performance, this paper proposes a few-shot anomaly detection model based on a convolutional multidimensional attention module to achieve feature registration (abbreviated as RCM-FSAD), which enhances the model’s perception of the overall image perception ability, using spatial transformer network to obtain the spatial transformation features of the image, improving the sensitivity of the relevant features, so that the whole model learns the commonality between the categories, and enhancing the generalization ability of the model. The spatial transformations and local structures of the input data are captured by deformable convolutional networks v2 to ensure the spatial invariance of the input data. The model is trained with only normal samples to accomplish anomalous regions’ localization and anomaly detection. On the challenging MVTec AD dataset, the unsupervised model not only improves the anomaly detection accuracy but also shows better generalization compared to current state-of-the-art unsupervised anomaly detection methods.
Keywords
Introduction
Anomaly detection, also known as outlier detection, is a data analysis method that detects “differences” between normal samples by comparing them with each other to determine whether there is an anomaly or not, and further identifies anomalous subregions in the image (Xie et al., 2023). Due to its high efficiency and accuracy, it is widely used in various fields such as industrial anomaly detection (Bergmann et al., 2019), medical image analysis (Fernando et al., 2021), and video surveillance (Liu et al., 2018). In the field of computer vision, anomaly detection of images covers two main tasks: anomaly detection and anomaly localization. Anomaly detection focuses on the overall image anomalies for image-level judgment and classification; while anomaly localization judges pixel-level anomalies of an image and pinpoints the location of the anomalies. Currently, due to the variety of anomaly samples and the relatively limited number of anomalies in practical applications, this poses a considerable challenge for the anomaly detection task.
With the rapid development of deep learning technology, there are numerous deep learning-based methods for image anomaly detection, and the common methods mainly include classification-based, few-shot-based, and feature registration-based methods. A common solution for classification-based methods is to model the distribution of normal samples to identify abnormal samples. To achieve this goal, Bergmann et al. (2020), Defard et al. (2021), and others proposed a strategy where separate models are trained for different classes of objects. However, this one-class-one-model scheme may lead to an increase in memory consumption, especially when the number of classes increases. Moreover, this strategy may not be applicable when the normal sample has more categories.
Few-shot-based approaches mainly utilize few-shot in training to provide limited normal image data for each category (Fengping and Peng Yunfa, 2022). Sheynin et al. (2021) proposed few-shot learning to improve the performance of a model when dealing with few-shot data by learning shared features across categories. This can be achieved through transfer learning (Jiang et al., 2022), meta-learning, or generative adversarial networks (Goodfellow et al., 2014). These methods try to exploit the commonalities between classes to enhance the generalization ability of the model and thus achieve better results in few-shot anomaly detection tasks. In addition, to address the imbalance problem of few-shot datasets, He and Garcia (2009) proposed using resampling techniques to adjust the number of samples from different categories so that the model can better learn the data from a few categories. Gupta et al. (2020) proposed to use a weighted loss function of the samples from different categories to give more importance to the few categories. However, the above methods do not utilize the commonalities between categories, which can affect the effectiveness of the model in learning for the minority category.
Feature registration-based methods mainly rely on the steps of feature extraction, feature matching, geometric transformation modeling, and registration optimization to ensure registration between different images, making anomalies easier to detect and analyze in images. Huang et al. (2022) proposed to implement a generic anomaly detection model using feature registration, capable of shared learning across multiple categories and can be generalized to new categories. However, deformations and rotations in the image affect the accurate registration of the features, resulting in a model that is less robust to these changes in appearance, thus affecting the performance of anomaly detection.
In general, the problems of the above methods mainly lie in the uneven distribution of data samples, the failure of few-shot learning to fully utilize the commonalities between categories, and the poor robustness of feature registration. Techniques such as variability convolution, few-shot learning, and attention mechanisms are now widely used in the anomaly detection task of images. Small-sample learning can provide the model with richer anomaly data and image features, variability convolution makes the model capture the changing features more efficiently, and the attention mechanism focuses on recognizing the important features in the data. In addition, feature registration techniques help to improve the recognition of critical features and may reduce the effect of noise on the model. Therefore, this paper proposes a class-independent detection model based on a multidimensional convolutional attention module (MAM) and feature registration as a class-independent detection model for less sample anomaly detection (RCM-FSAD), the model can be mainly divided into two parts: feature extraction and anomaly detection and localization, the features contain structural and distributional features, and the anomaly judgment is mainly realized through the decoder to achieve the segmentation and localization of anomalous images.
The main contributions of this paper are summarized below:
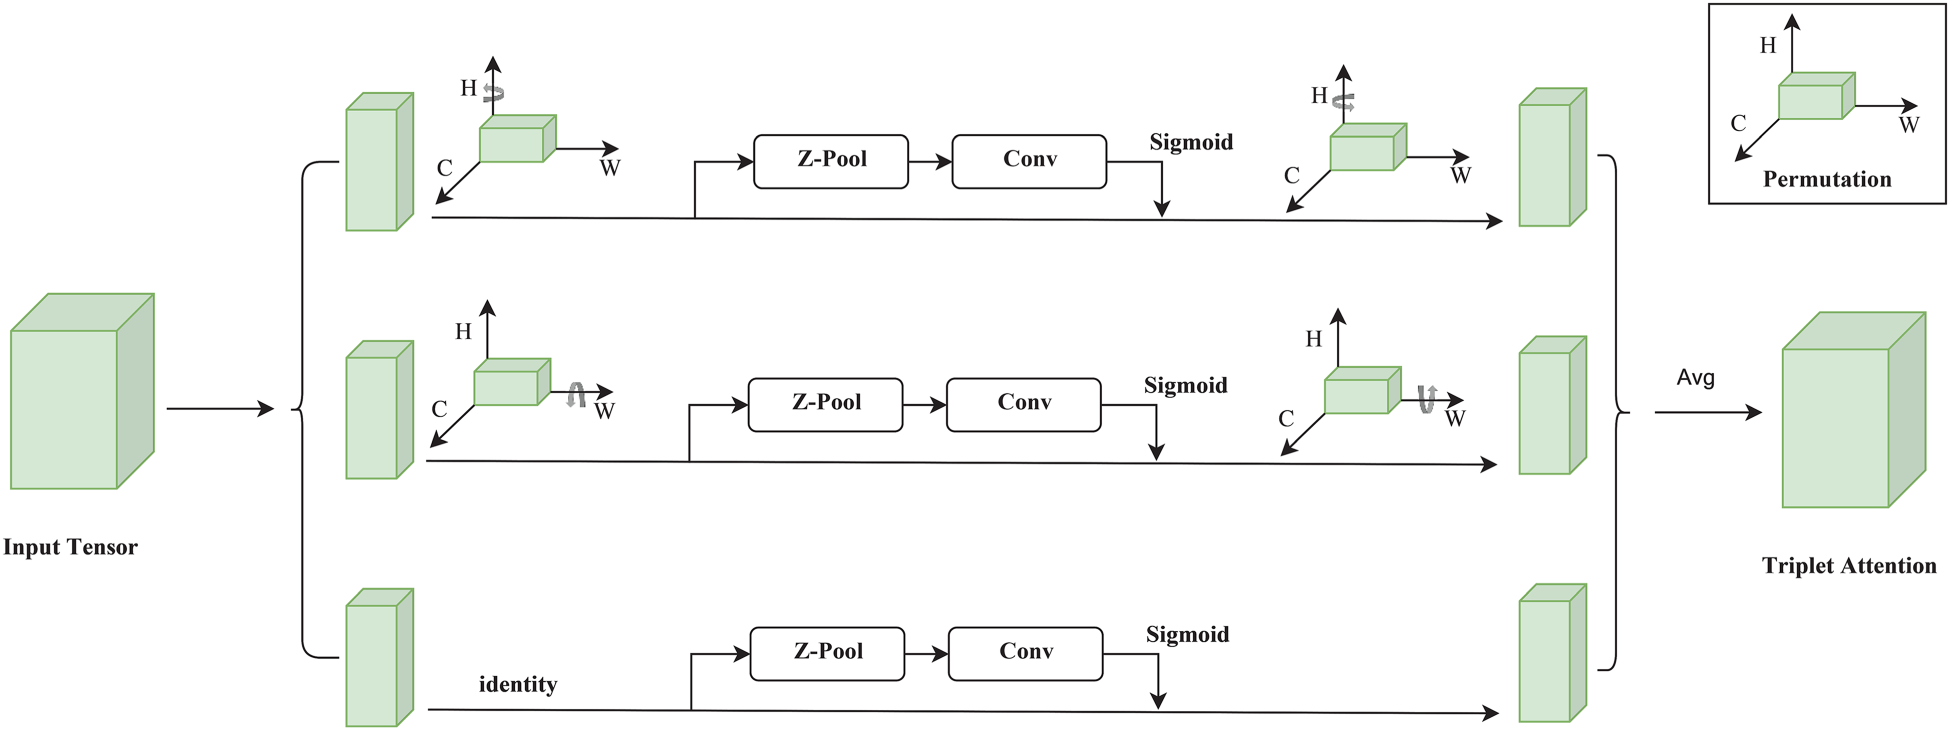
Aiming at the problem of how to learn the commonality between categories when based on a few-shot model. A MAM is proposed, which combined with the feature registration technique makes the model pay deeper attention to the pixel regions in the image that play a decisive role in the classification, enabling the model to learn the commonalities between categories during training and reducing the problem of poor data generalization. Aiming at the problem of poor feature-based alignment robustness and difficulty in effectively capturing the changing features. A twin network trained based on variability convolution v2 (deformable convolutional network v2 [DCNv2]) is proposed, which improves the expressive ability and adaptability of the model, enabling the model to better handle complex image data and improve the performance and generalization of the task. Aim at the problem of one class and one model based on the small amount of anomaly sample data for classification. A multidimensional spatial generalized anomaly detection model (RCM-FSAD) is proposed, where all the classes only need to train a unified model with a small number of samples. The model first feeds normal images into a pretrained feature extraction network for feature extraction. Next, the extracted features are ensemble-trained by feature registration to learn a universal feature representation. Schematic structure of the TAM. Note. TAM = triplet attention module. Schematic diagram of the detailed process of the TAM . Note. TAM = triplet attention module.
Convolutional Tripletbasis Attention Module
Dosovitskiy et al. (2020) proposed the transformer self-attention mechanism, initially applied to aligned text with remarkable results. Later, researchers began to explore the introduction of attention mechanisms in computer vision tasks and convolutional neural networks (CNNs) to enhance network performance (Fraga et al., 2021). For example, models such as SENet (Hu et al., 2018), convolutional block attention module (CBAM; Woo et al., 2018), and bottleneck attention module (BAM; Park et al., 2018) have been proposed to compute attention from different perspectives, such as channel, space, and receptive field. Although these methods significantly improve performance, they cannot solve the cross-dimensional interaction problem.
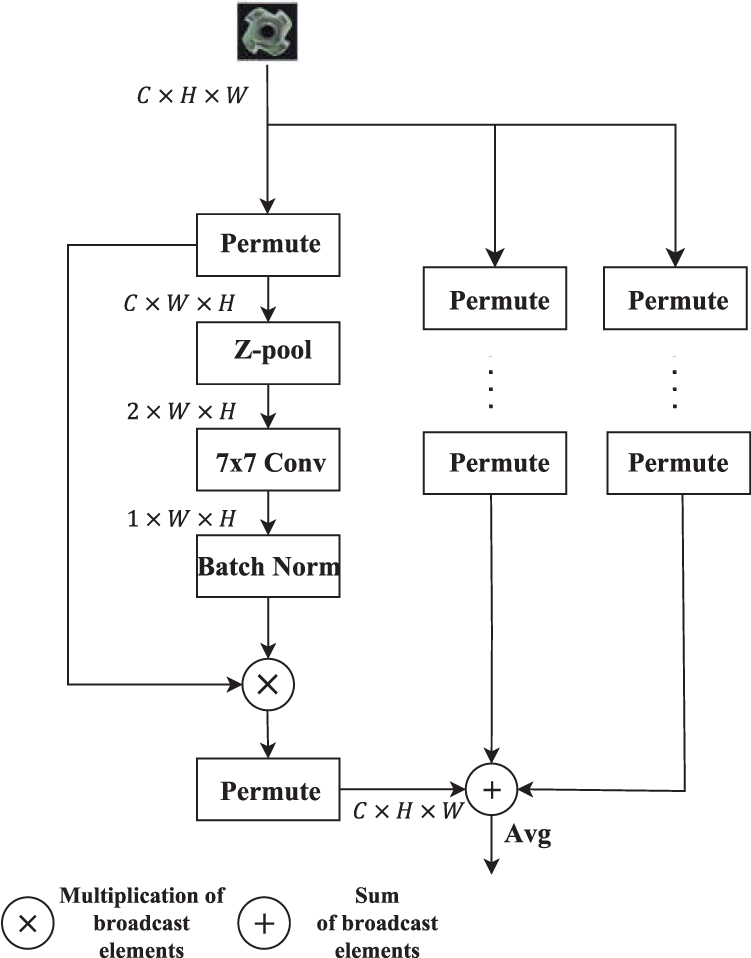
For this reason, Misra et al. (2021) proposed the triplet attention module (TAM), which not only reduces the computational cost of the model, but also eliminates the indirect correspondence between the channels and the weights, and achieves significant results in terms of efficiency and multidimensional correlation, as compared to previous attention methods. The structure of the TAM is shown in Figure 1.
The TAM contains three main branches as shown in Figure 2, two of which are used to capture cross-channel interactions between the channel C dimension and the spatial dimension width/height; the two branches are rotated counterclockwise along the height/width (H/W) axis at the input and clockwise along the H/W axis at the output
Z-pool: is responsible for reducing the zero dimensions of the tensor to two dimensions by connecting the average and maximum pool features in that dimension. It preserves the rich representation of the actual tensor and reduces its depth to alleviate the subsequent computation, as in equation (1).

Dai et al. (2017) proposed a deformable convolutional network v1 (DCNv1), the core idea of which is to improve the model’s ability to adapt to changes in object geometry. Although DCNv1 spatially extracts features that are more consistent with the image structure, its computational region may be far beyond the region of interest, which leads to features being affected by irrelevant image content. To overcome this problem, Zhu et al. (2019) proposed DCNv2, which enhances the network’s ability to focus on relevant image regions. The modeling capability is further enhanced by integrating deformable convolution more comprehensively within the network while introducing a modulation mechanism and training strategy that extends the scope of deformation modeling. The modulation process in DCNv2 can be expressed as follows:

Jaderberg et al. (2015) introduced a learnable spatial transformer network (STN), which is a microscopic module that can be embedded into existing CNN architectures. The STN allows a neural network to automatically perform spatial transformations on feature maps conditional on the input feature maps without additional training supervision or modification of optimization methods. One of the key advantages of STNs is the ability to learn the spatial transformation parameters of a picture or feature without labeling key points. By learning these parameters, STNs can spatially align the input picture or learned features, thus reducing the impact of objects on classification, localization, and other tasks due to geometric transformations such as rotation, translation, scale, and distortion.
STN is more accurately called spatial transformer layer (STL), which is a layer in the network, and STL can be added between any two layers and is usually used in CNNs. As shown in Figure 3, the STN model consists of three main components: the localization network, the grid generation module, and the sampler. The localization network is responsible for generating spatial transformation parameters that describe the input image U, such as translation, rotation, and scaling. The grid generation module uses these parameters to generate a regular grid of sampled grid points that can be used to geometrically transform the input image U. Finally, the sampler uses the generated grid to interpolate with the input image to obtain a transformed image, which is then mapped onto the original image U to obtain the output V.
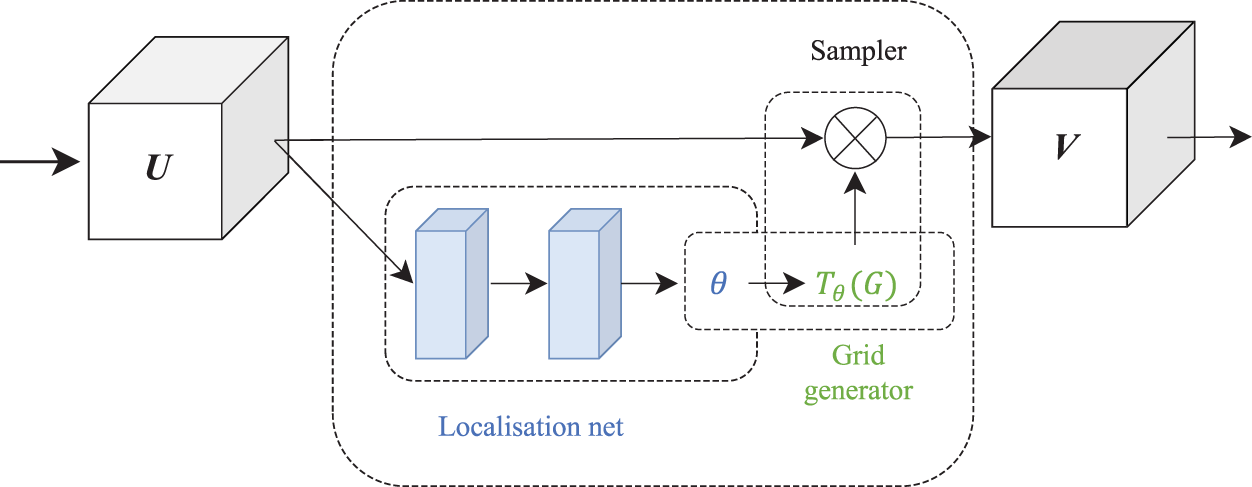
Schematic diagram of spatial transformer network structure.
The few-shot anomaly detection model (RCM-FSAD) based on the MAM and feature registration proposed in this paper is shown in Figure 4
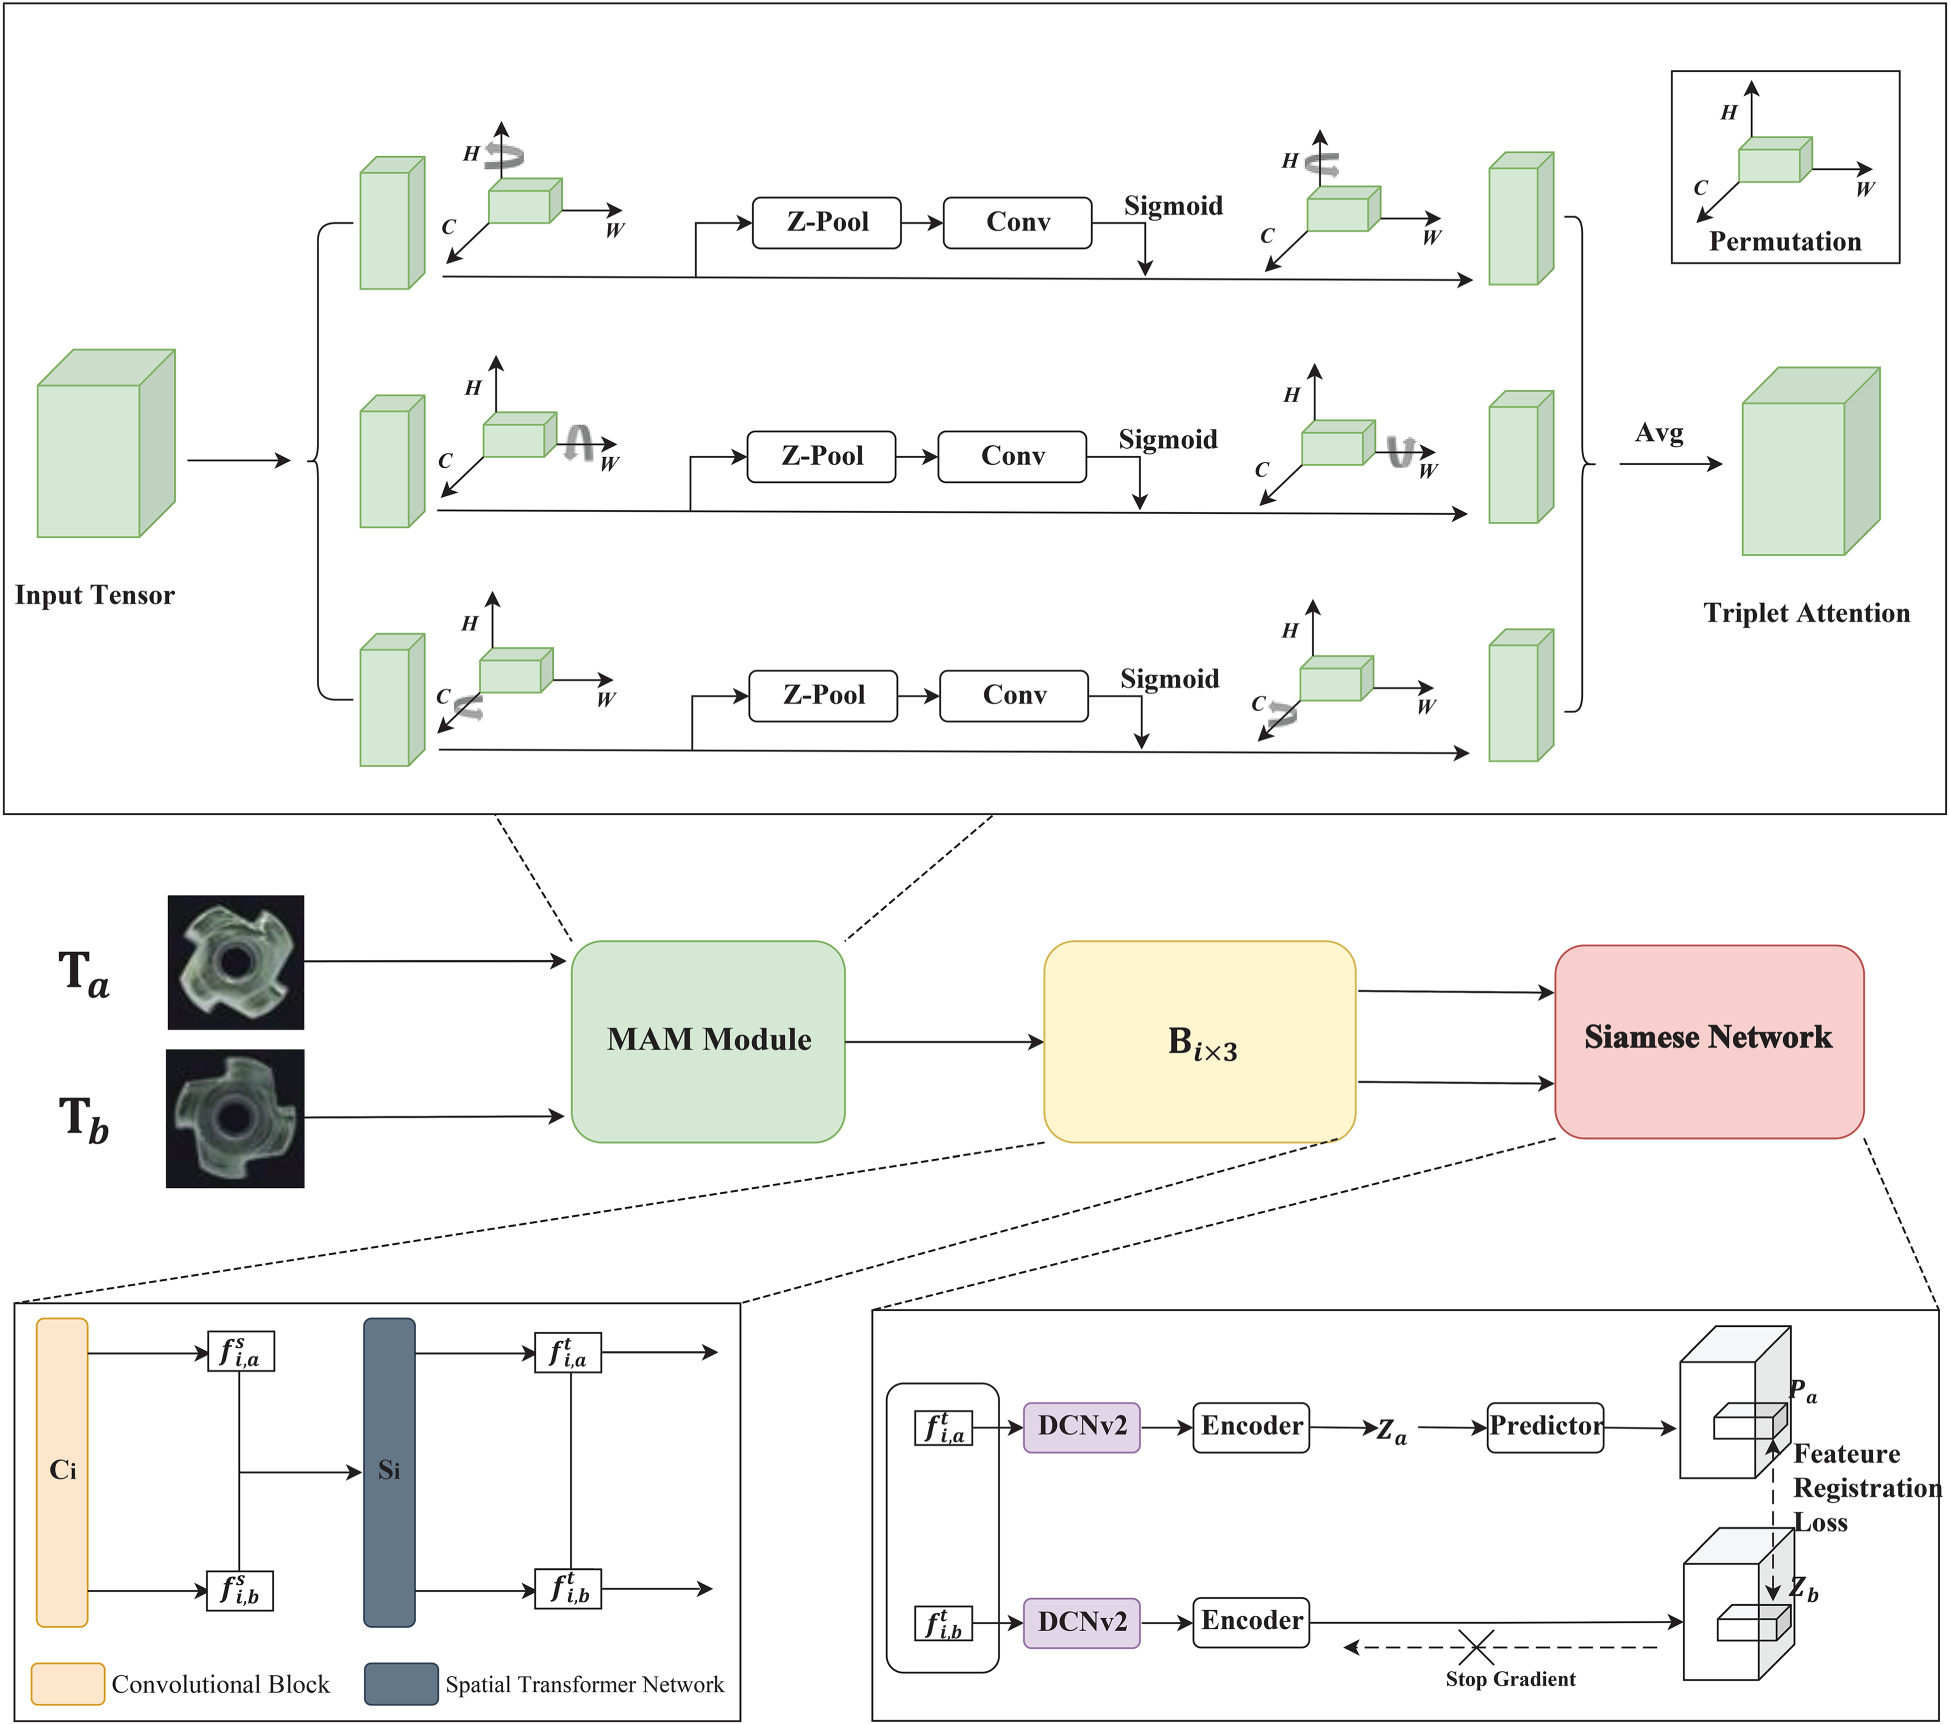
RCM-FSAD model architecture.
The RCM-FSAD model is mainly composed of a feature optimization module, a feature extraction and transformation module, and a Siamese network. In this model, the MAM is firstly utilized to focus more finely on specific regions or features in the input data to improve the model’s ability to perceive key information. Secondly, through the feature extraction and transformation module
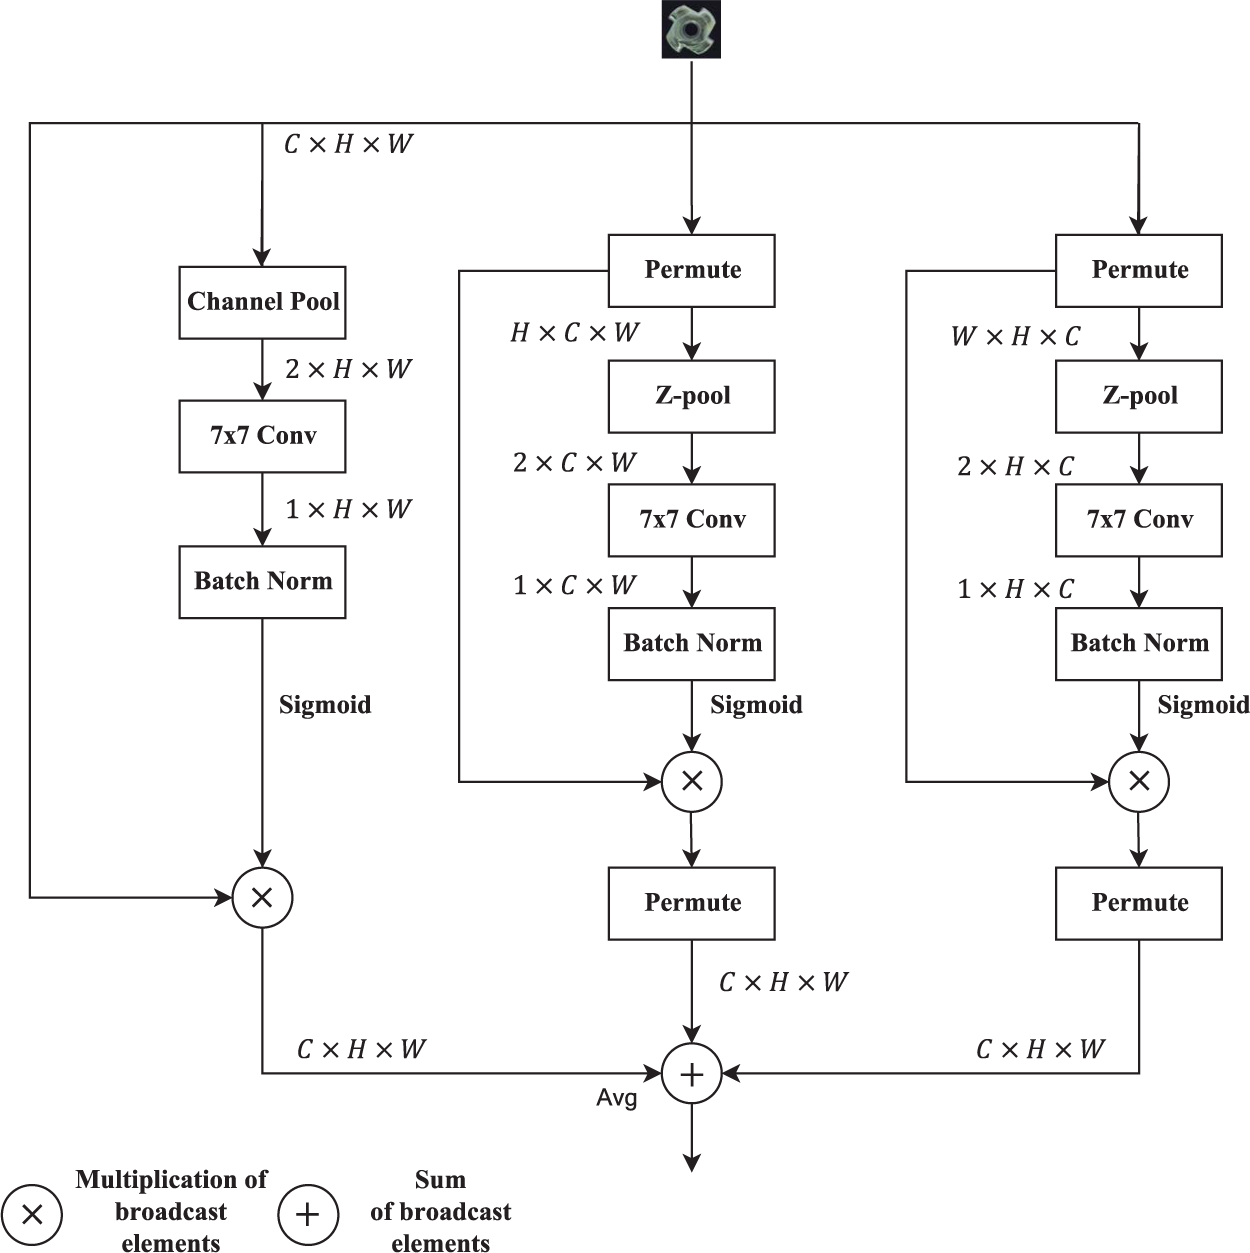
This paper draws on the literature (Misra et al., 2021); since TAM only focuses on the interaction between spatial width and height in practice, although this helps to improve the model performance, it is relatively limited in dealing with the interactions in the channel dimensions and fails to adequately capture the complex dependencies between different channels. In order to solve this problem, we introduce the MAM as a feature optimization module, which enhances the model’s ability to express features by extending the functionality of the TAM, effectively solving the problem that the TAM fails to adequately capture the complex dependencies between different channels.
Based on TAM, MAM constructs interactions between channel dimensions, with the input X of the first branch rotated counterclockwise along the C-axis
Schematic diagram of the detailed process of multidimensional attention module.
From the input tensor


Randomly select images of the same category in training set

Schematic diagram of Siamese network structure.
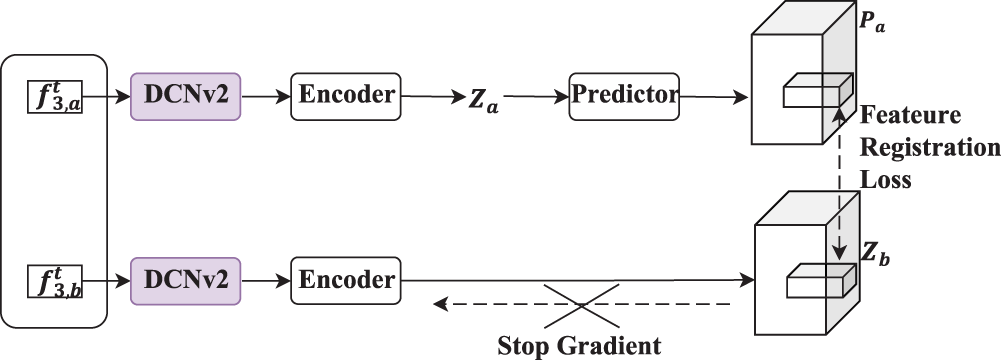
The Siamese network is a parameter-sharing neural network applied to multiple inputs. To avoid the problem of gradient computation collapse, inspired by SimSiam Chen and He (2021), in this paper, the feature encoder is designed as a Siamese network. In Siamese networks, it is crucial to accurately capture the spatial transformations and local structure of the input data, and DCNv2 has strong spatial transformation adaptation, which makes it better able to compare the similarity between input pairs in twin networks, which is crucial for the task of such networks. By introducing a dynamic convolutional kernel, DCNv2 is better able to handle rotational, translational, and other transformations of the input data, improving the network’s invariance to these transformations.
The overall Siamese network structure is shown in Figure 6. Given the pairwise extracted features


After obtaining the alignment features, the distribution estimation model is used to fit the alignment feature distribution of the supported image to obtain the feature distribution model; the specific process is:
Divide the supported image into an

In the inference process, test samples that are beyond the normal distribution are considered anomalies. For each test image, this paper uses the anomaly rating function to calculate the Mahalanobis distance matrix between the alignment features of the image to be tested, and the feature distribution model, and the Mahalanobis distance matrix composes the anomaly score matrix, through which the anomaly score matrix indicates the anomalous region in the image to be tested, so as to realize the anomaly detection. Mahalanobis distance matrix

Datasets and Evaluation Indicators
To effectively evaluate the RCM-FSAD anomaly detection model, experiments are conducted in this paper using the MVTec AD dataset (Bergmann et al., 2019), which is a widely used dataset for surface anomaly detection tasks. The dataset includes real images from 15 different categories, 3,629 images for training and validation, and 1,725 images for testing. The training set contains only normal images without defects. The test set contains both various defective images (abnormal) and defect-free images (normal). There are only a few images per new category, an average of 5 per category, giving 73 different defect types. The resolution of all images ranges from
Evaluation metrics commonly used in anomaly detection tasks, including image-level area under receiver operating characteristic (AUROC) and pixel-level AUROC, are selected in this paper to accurately evaluate the RCM-FSAD anomaly detection model’s performance. These two metrics are used to measure the effectiveness of the model in overall anomaly detection and anomaly localization, respectively.
The AUROC in the evaluation index is the area surrounded by the true positive rate (TPR)–false positive rate (FPR) curve (receiver operating characteristic [ROC]), the ROC curve is obtained by changing the threshold value of classification, which in turn gets a series of (TPR, FPR) points, and then according to the threshold value from small to large to get the points plotted as the TPR–FPR curve (TPR, the number of correctly predicted samples of positive samples accounted for the proportion of the true samples, FPR, the number of samples incorrectly predicted as positive samples as a proportion of true and negative samples), which is called the ROC curve, and then the area enclosed by the curve is calculated, and when the area is larger, it indicates better performance, that is, the larger the AUROC, the better the performance is. The output of the AUROC is a numerical value between 0 and 1, and usually the closer it gets to 1 means the better the performance of the classifier, and the closer it gets to 0.5 means that the classifier’s effect is similar to random guessing.
Implementation Details
The model is designed to be a unified model, but independent training is used to enhance the model’s ability to recognize features from each category during training. This model uses ResNet18 as the backbone network. The encoder contains three
Comparison With Other Methods
To validate the effectiveness and superiority of RCM-FSAD, it is evaluated against several mainstream deep learning-based anomaly detection methods in terms of anomaly detection and anomaly localization, respectively.
Anomaly Detection
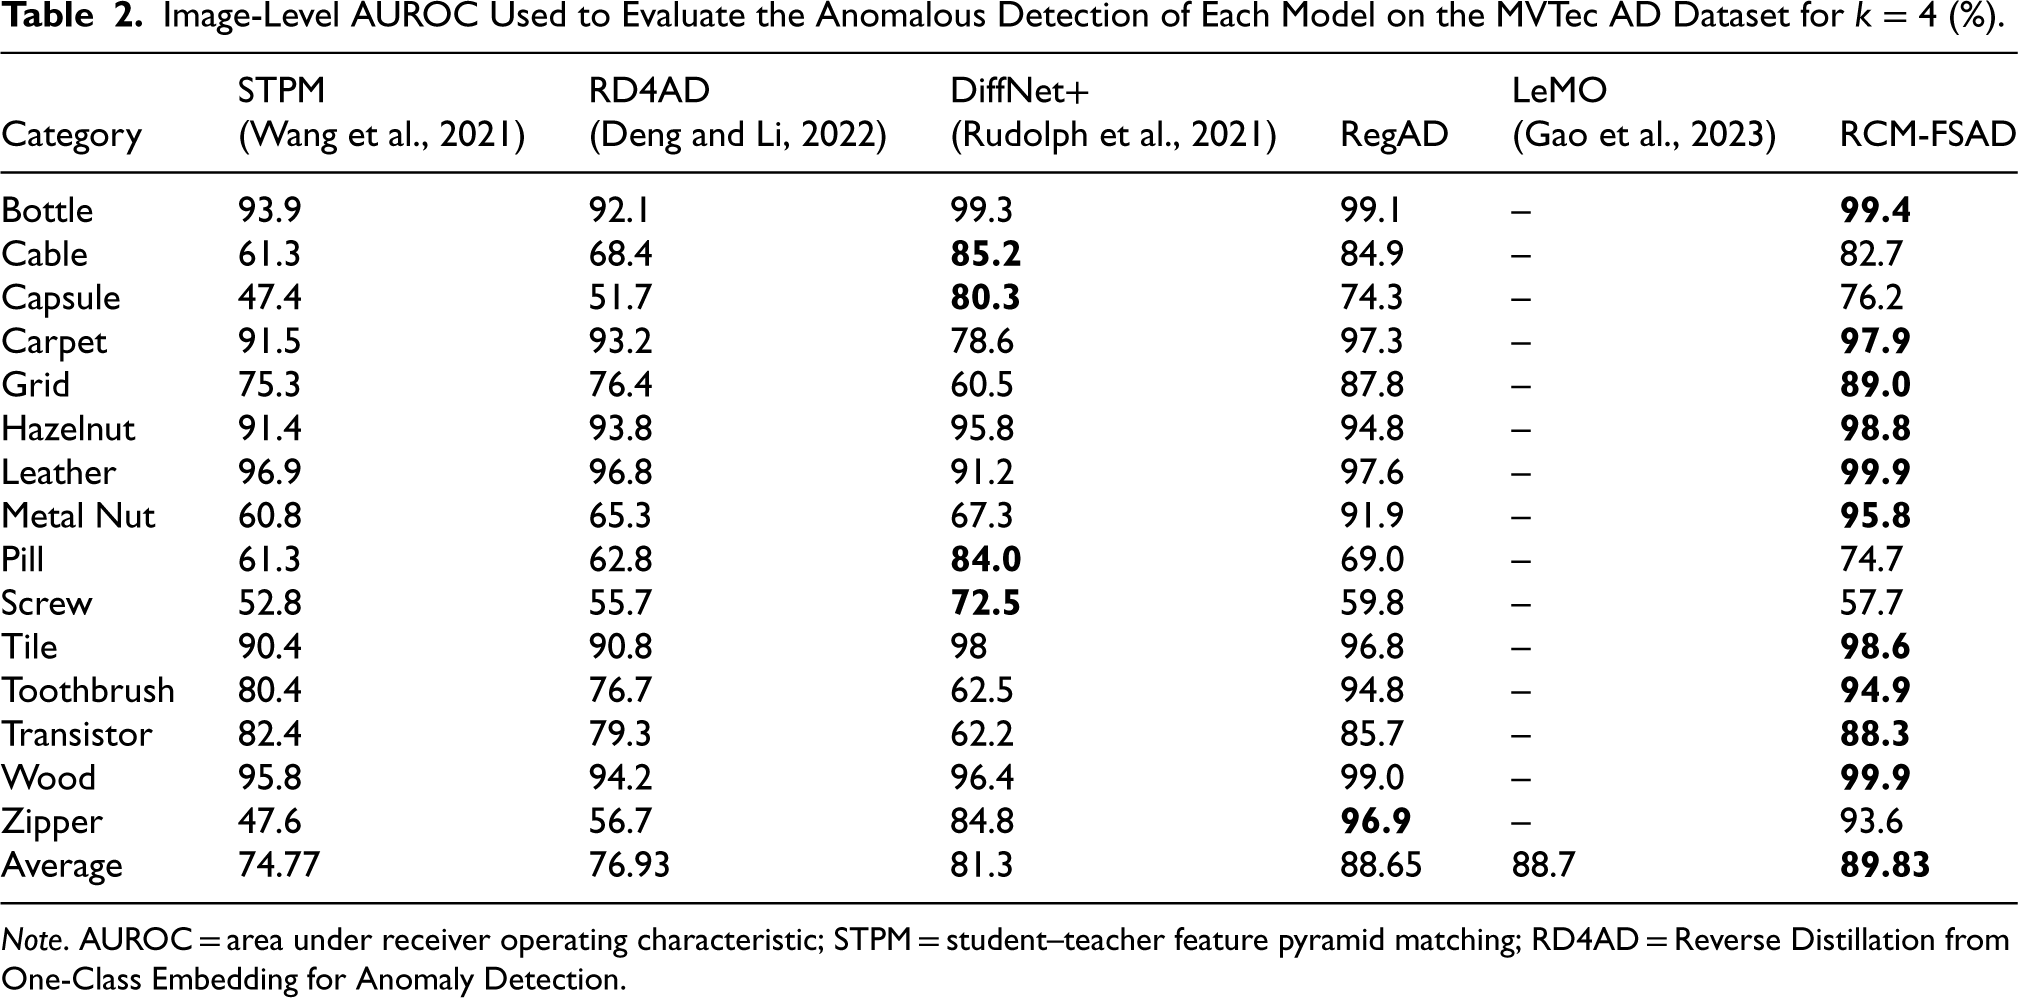
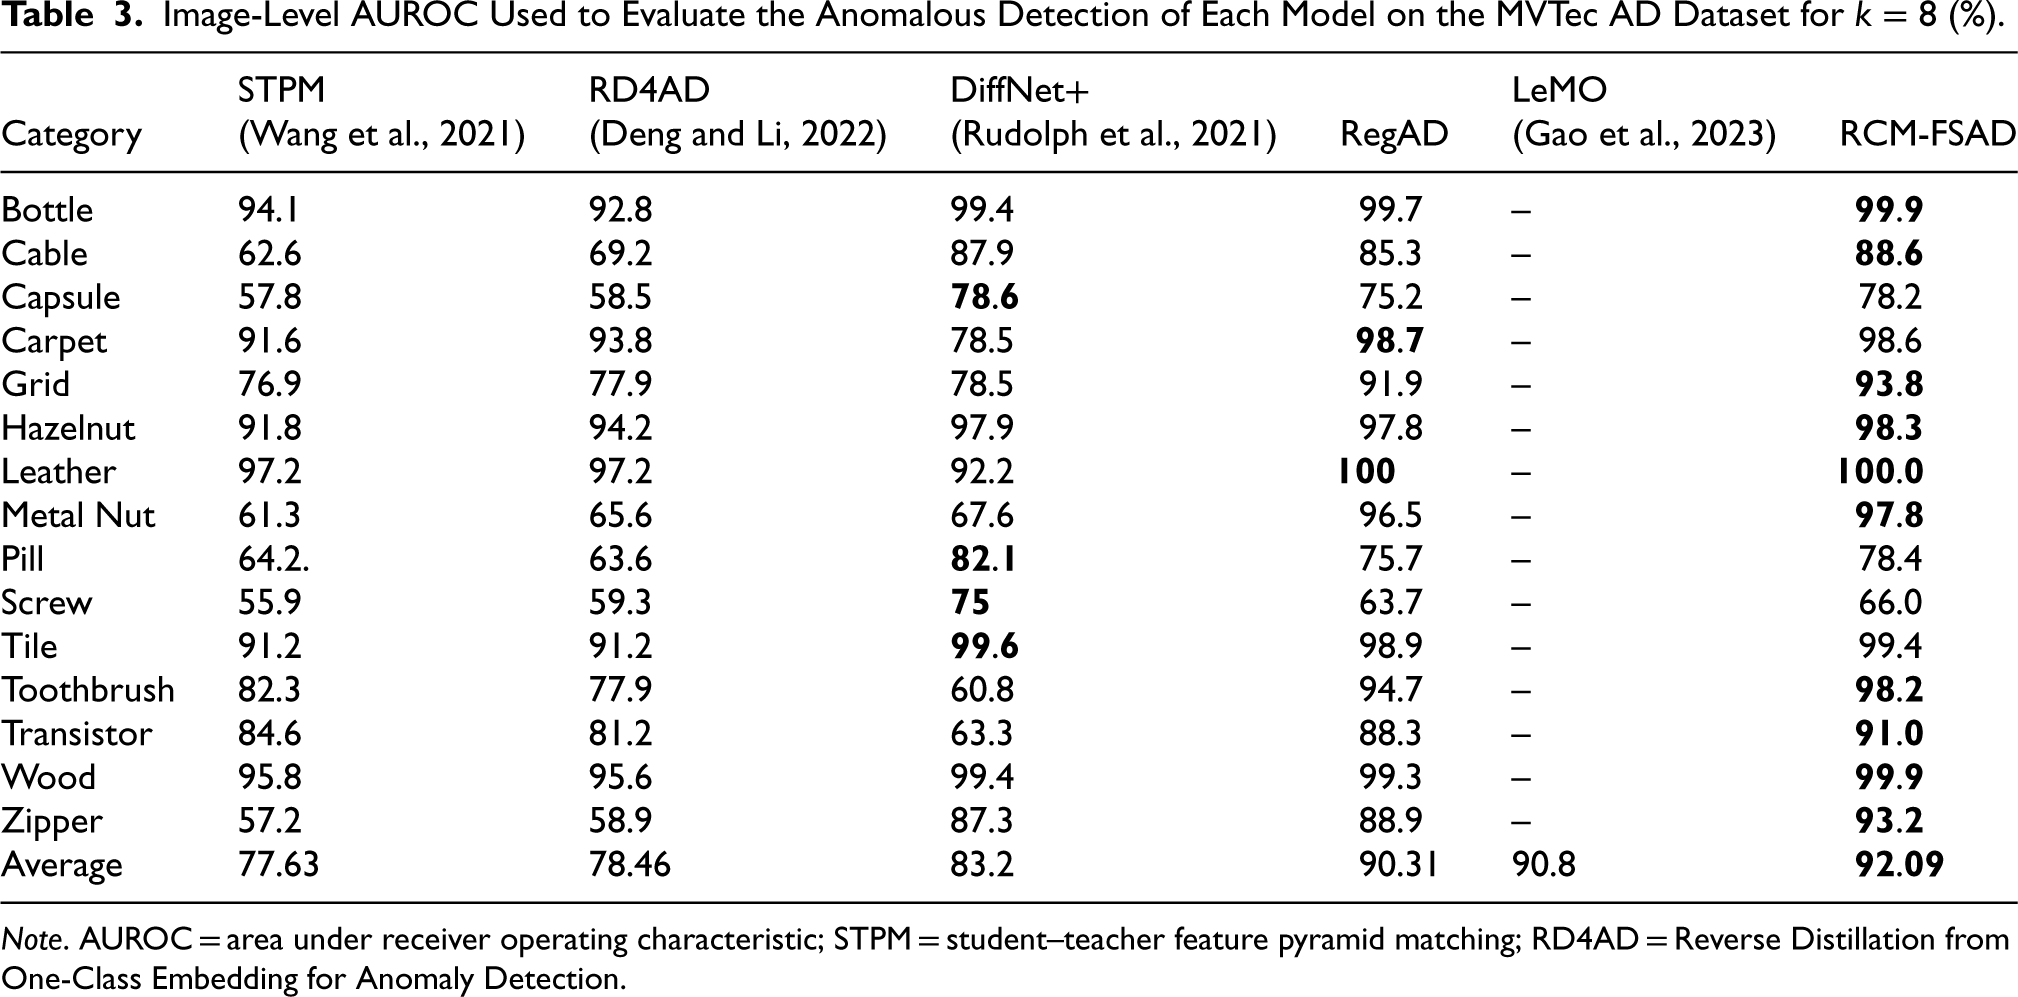
The experiments were conducted using a left-one-out setup, selecting one target category for testing while using other categories in the dataset for training. The experimental results of the k-shot anomaly detection performance on the MVTec AD dataset are shown in Tables 1–3. The results for each of the 15 categories in RCM-FSAD anomaly detection are listed in terms of the average AUROC (%) over 10 runs and are labeled separately for each category. It can be seen that the average results of RCM-FSAD anomaly detection are 87.33% (
Image-Level AUROC Used to Evaluate the Anomalous Detection of Each Model on the MVTec AD Dataset for
(%).
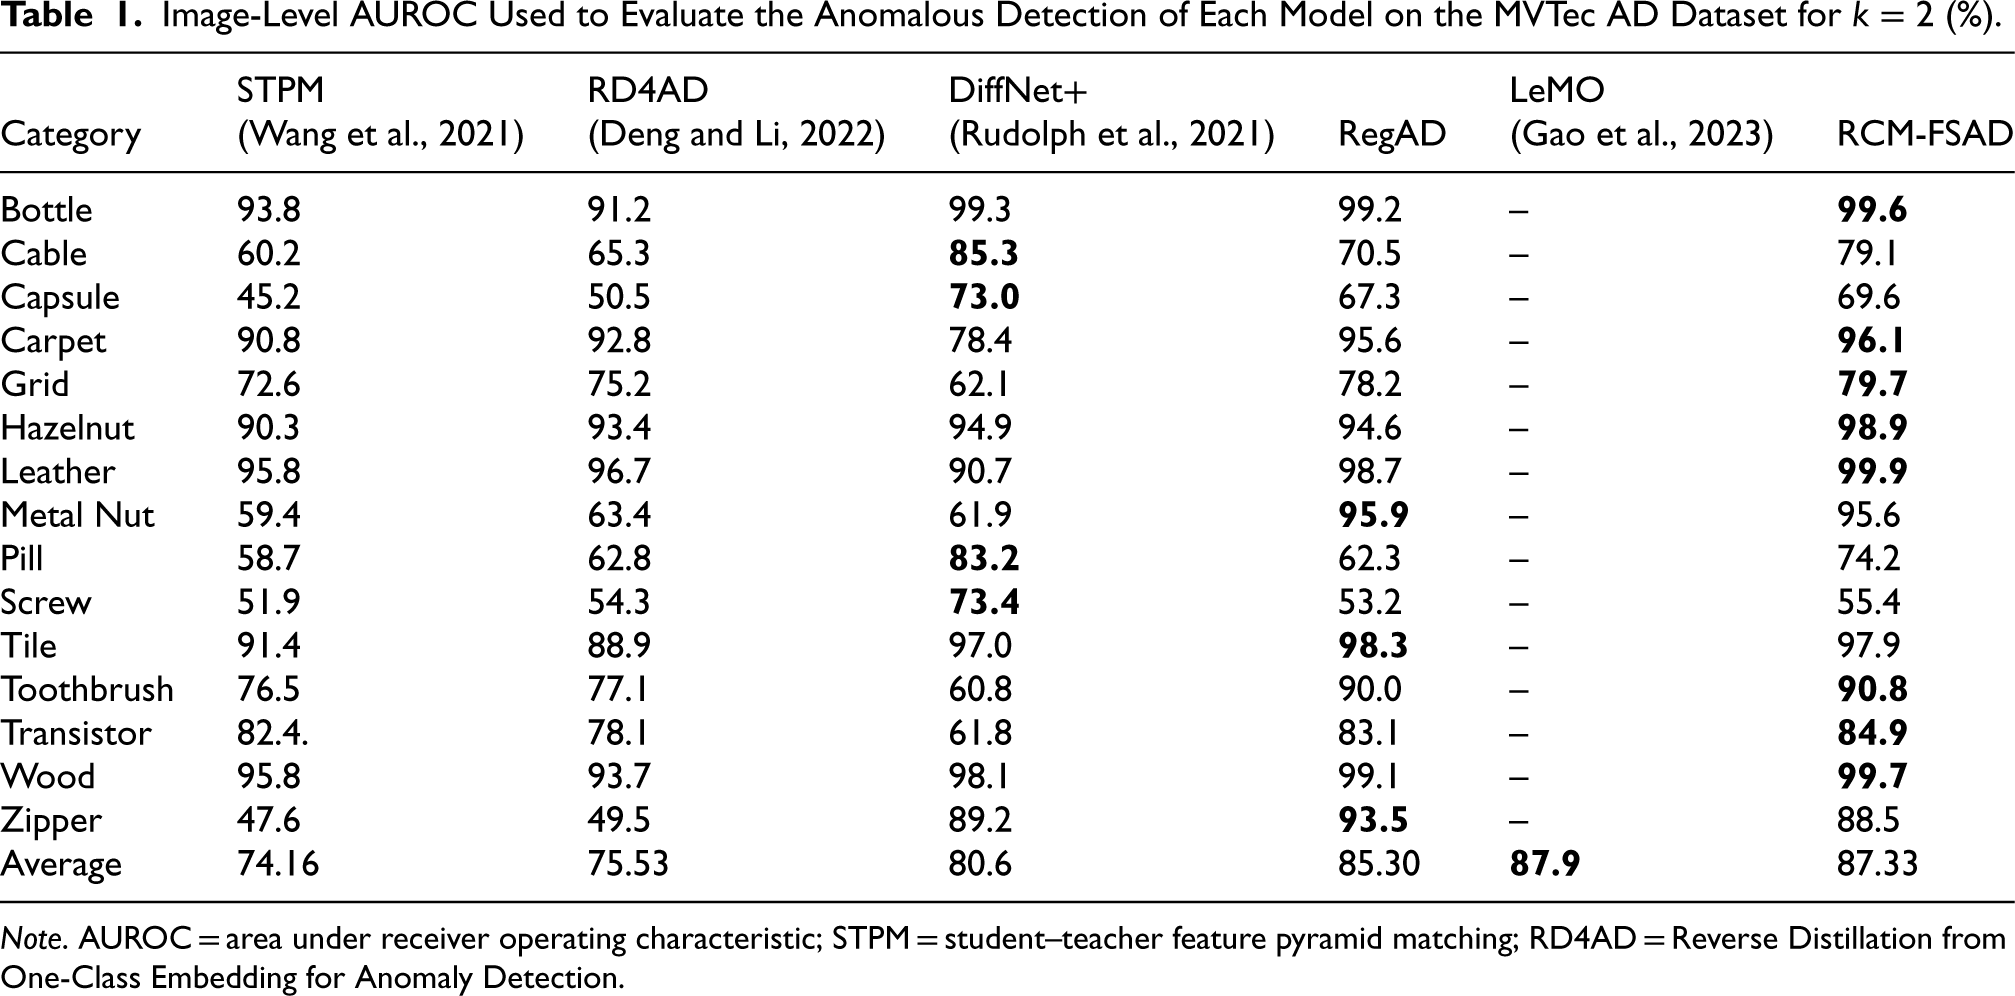
Image-Level AUROC Used to Evaluate the Anomalous Detection of Each Model on the MVTec AD Dataset for
Note. AUROC = area under receiver operating characteristic; STPM = student–teacher feature pyramid matching; RD4AD = Reverse Distillation from One-Class Embedding for Anomaly Detection.
Image-Level AUROC Used to Evaluate the Anomalous Detection of Each Model on the MVTec AD Dataset for
Note. AUROC = area under receiver operating characteristic; STPM = student–teacher feature pyramid matching; RD4AD = Reverse Distillation from One-Class Embedding for Anomaly Detection.
Image-Level AUROC Used to Evaluate the Anomalous Detection of Each Model on the MVTec AD Dataset for
Note. AUROC = area under receiver operating characteristic; STPM = student–teacher feature pyramid matching; RD4AD = Reverse Distillation from One-Class Embedding for Anomaly Detection.
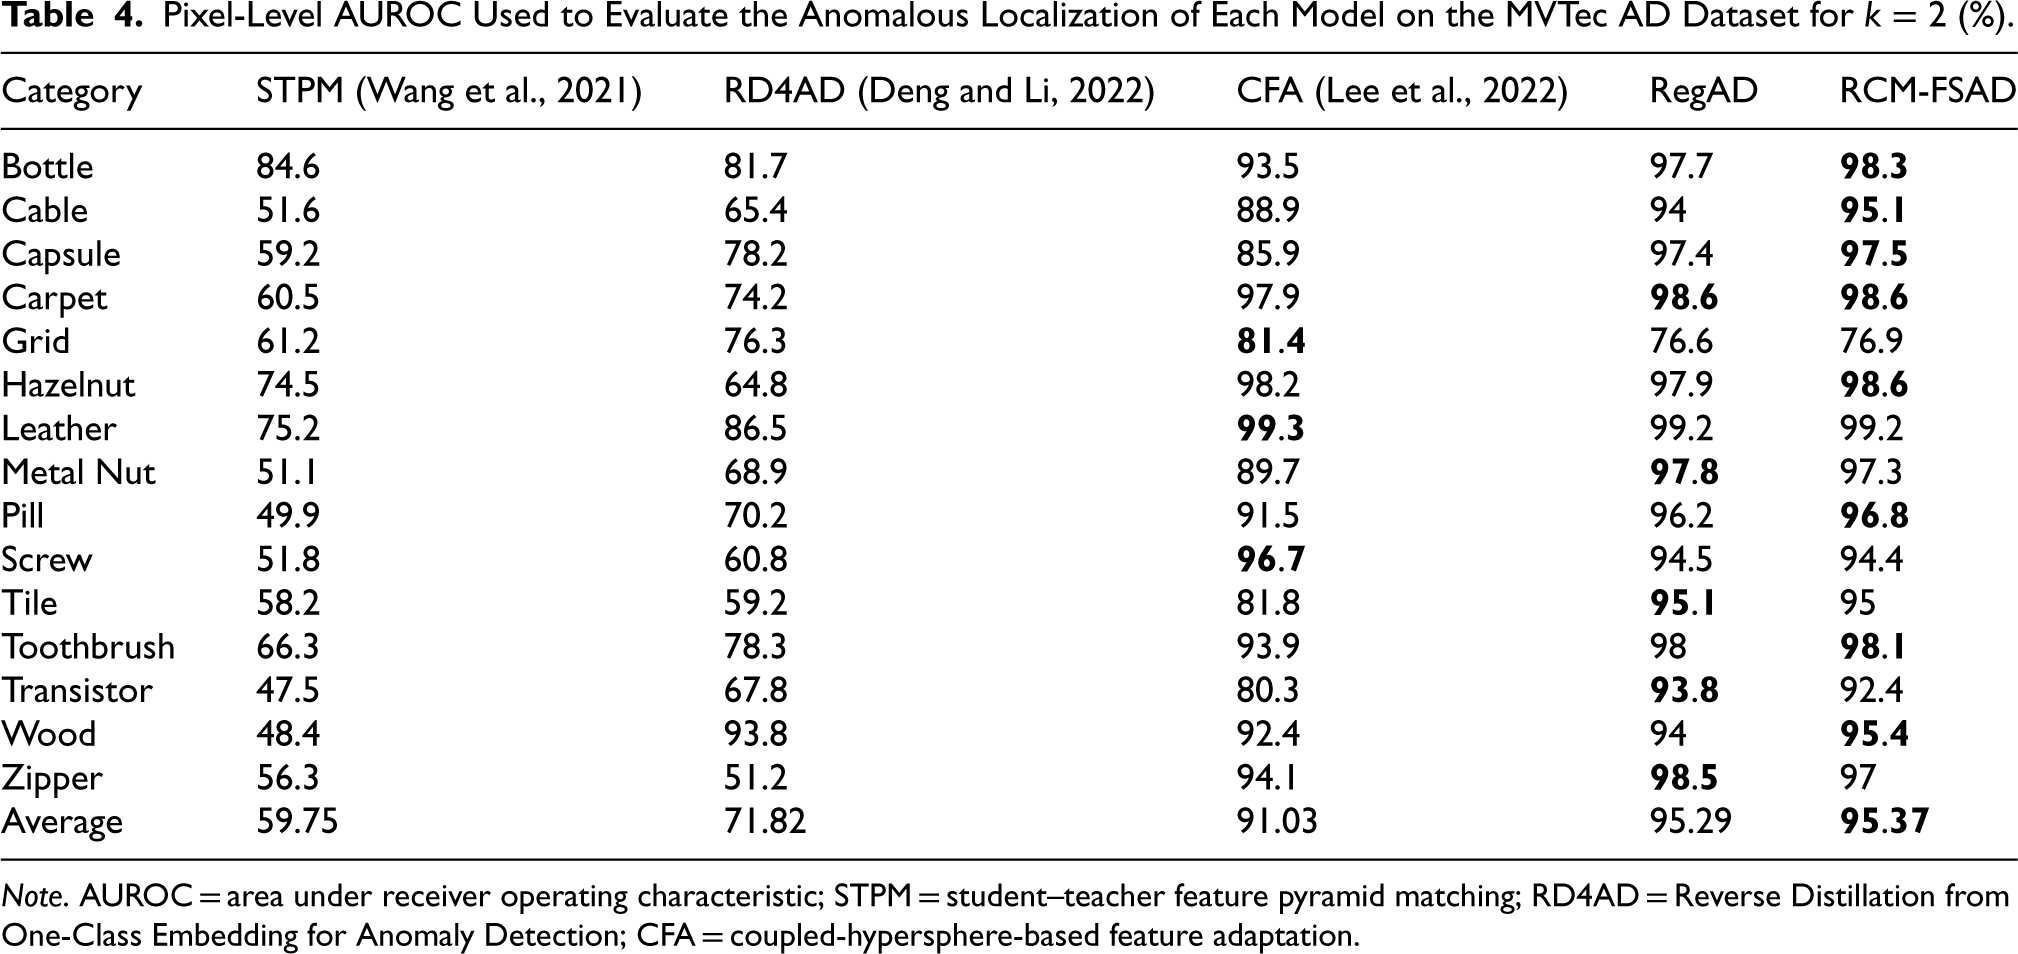
The results of the k-shot anomaly localization experiments performed on the MVTec AD dataset are presented in Tables 4–6. RCM-FSAD performs the best on the mean values of the Pixel-AUROC evaluation metrics. The model utilizes the feature representations learned throughout the training process to localize anomalous regions for the samples in the dataset accurately. Anomaly localization was performed using RCM-FSAD in 15 categories, where the results for each category are listed as the average AUROC (%) over 10 runs and labeled individually for each category. The average results for RCM-FSAD anomaly localization were 95.37% (
Pixel-Level AUROC Used to Evaluate the Anomalous Localization of Each Model on the MVTec AD Dataset for
(%).
Pixel-Level AUROC Used to Evaluate the Anomalous Localization of Each Model on the MVTec AD Dataset for
Note. AUROC = area under receiver operating characteristic; STPM = student–teacher feature pyramid matching; RD4AD = Reverse Distillation from One-Class Embedding for Anomaly Detection; CFA = coupled-hypersphere-based feature adaptation.
Pixel-Level AUROC Used to Evaluate the Anomalous Localization of Each Model on the MVTec AD Dataset for
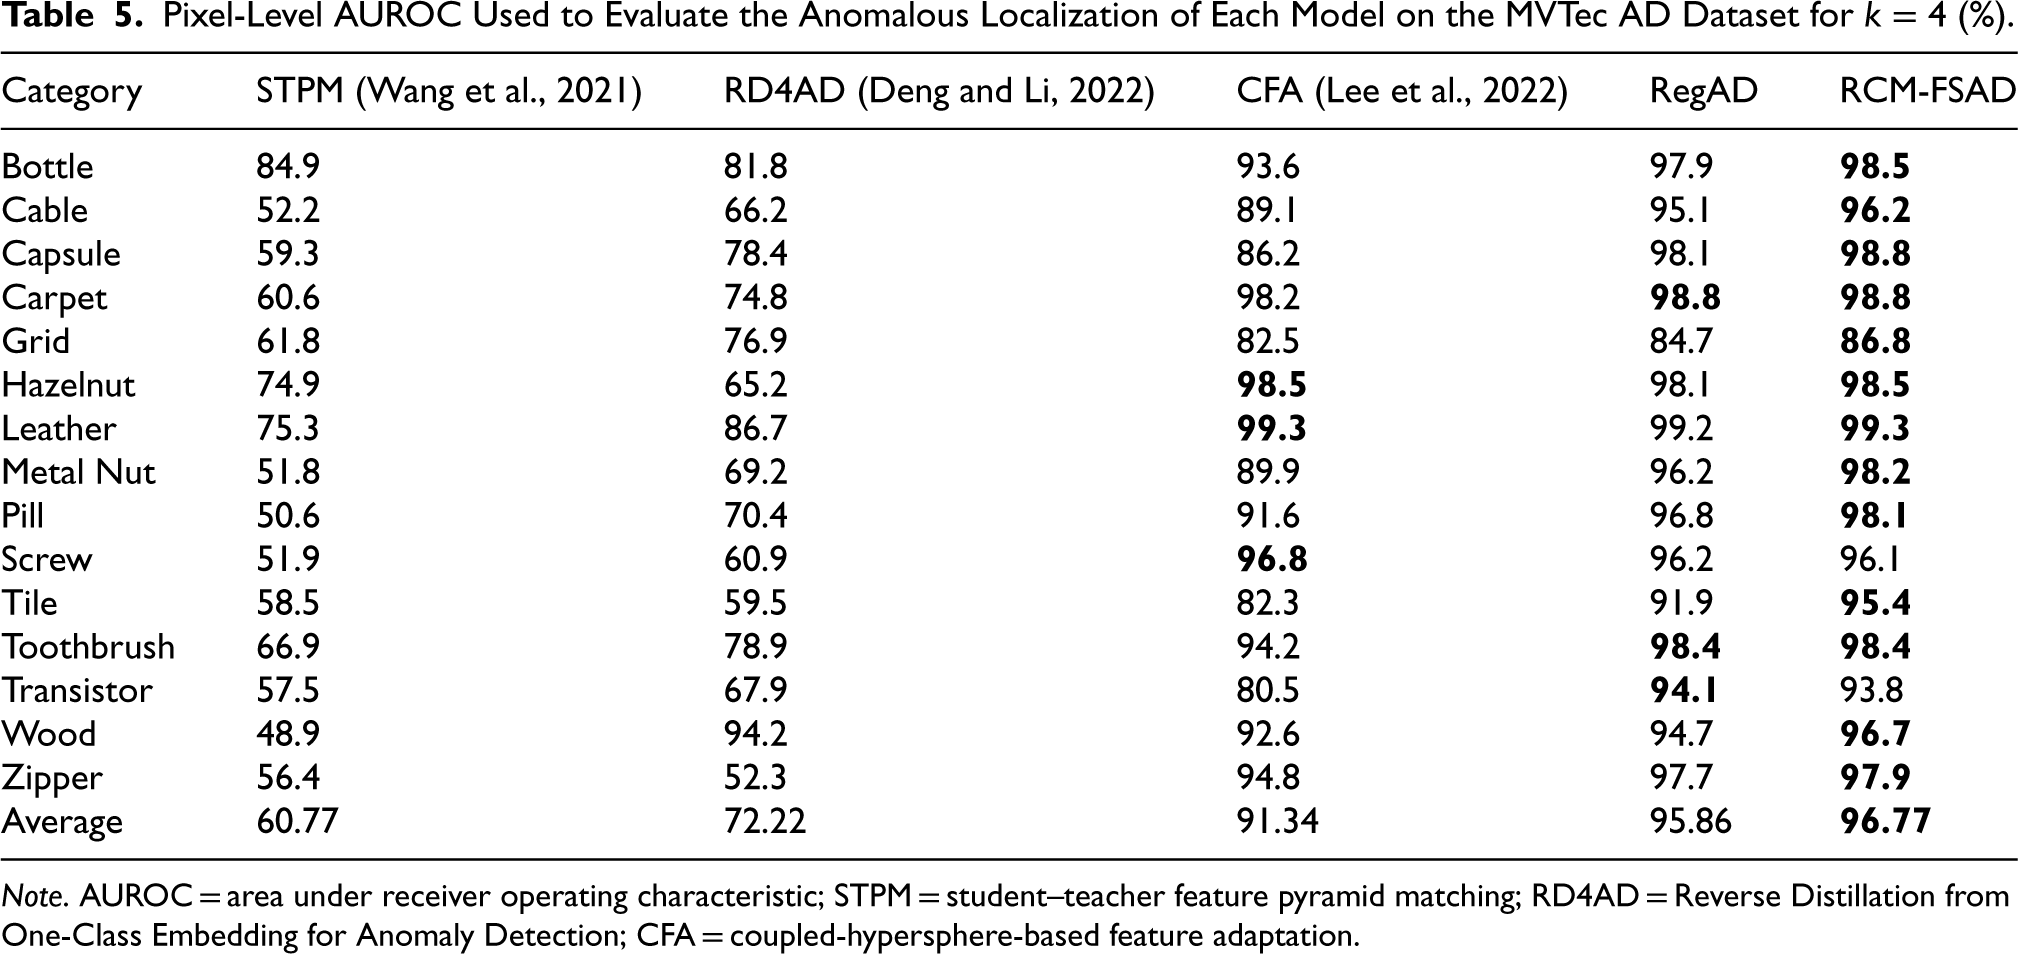
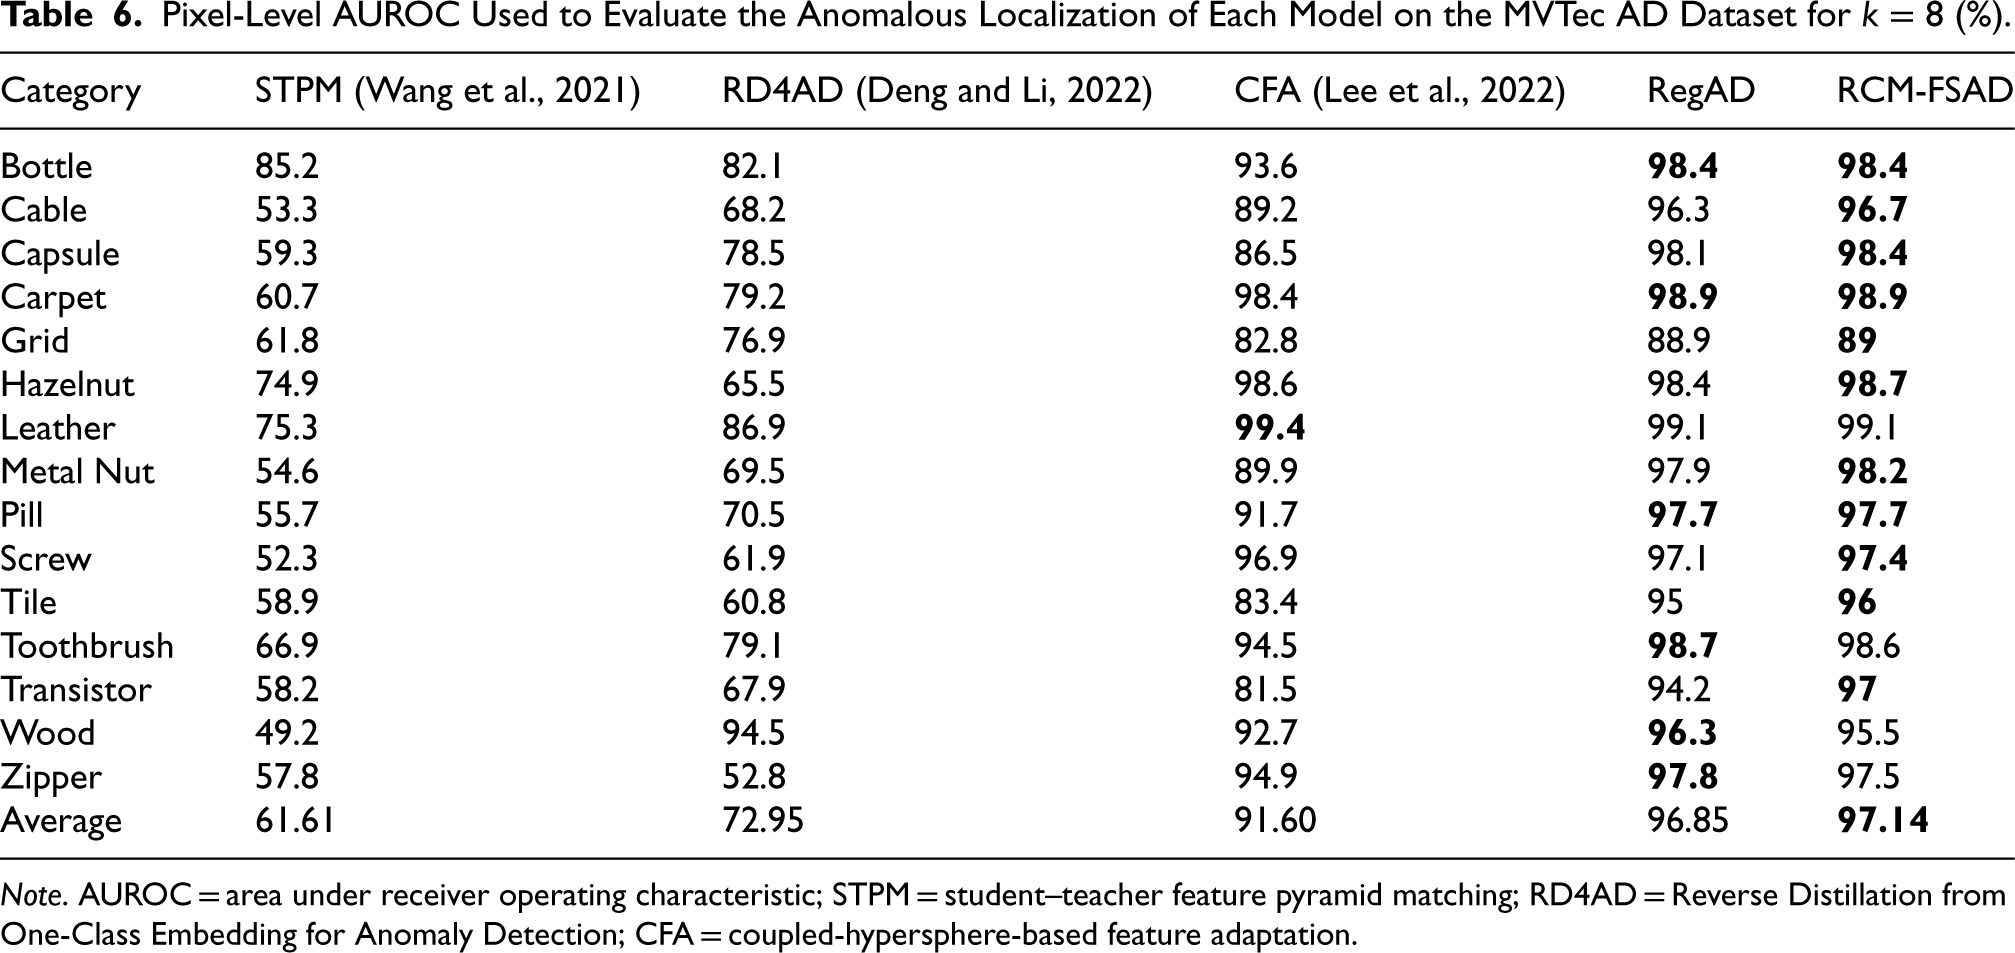
Note. AUROC = area under receiver operating characteristic; STPM = student–teacher feature pyramid matching; RD4AD = Reverse Distillation from One-Class Embedding for Anomaly Detection; CFA = coupled-hypersphere-based feature adaptation.
Some typical results of this model for anomaly localization on the MVTec dataset are shown in Figure 7. The figure contains the input images, the real anomaly segmentation graphs, and the anomaly segmentation graphs predicted by the model, which demonstrate the excellent performance of this model in localizing anomalies. This series of visualization results presents the model’s anomaly localization results.
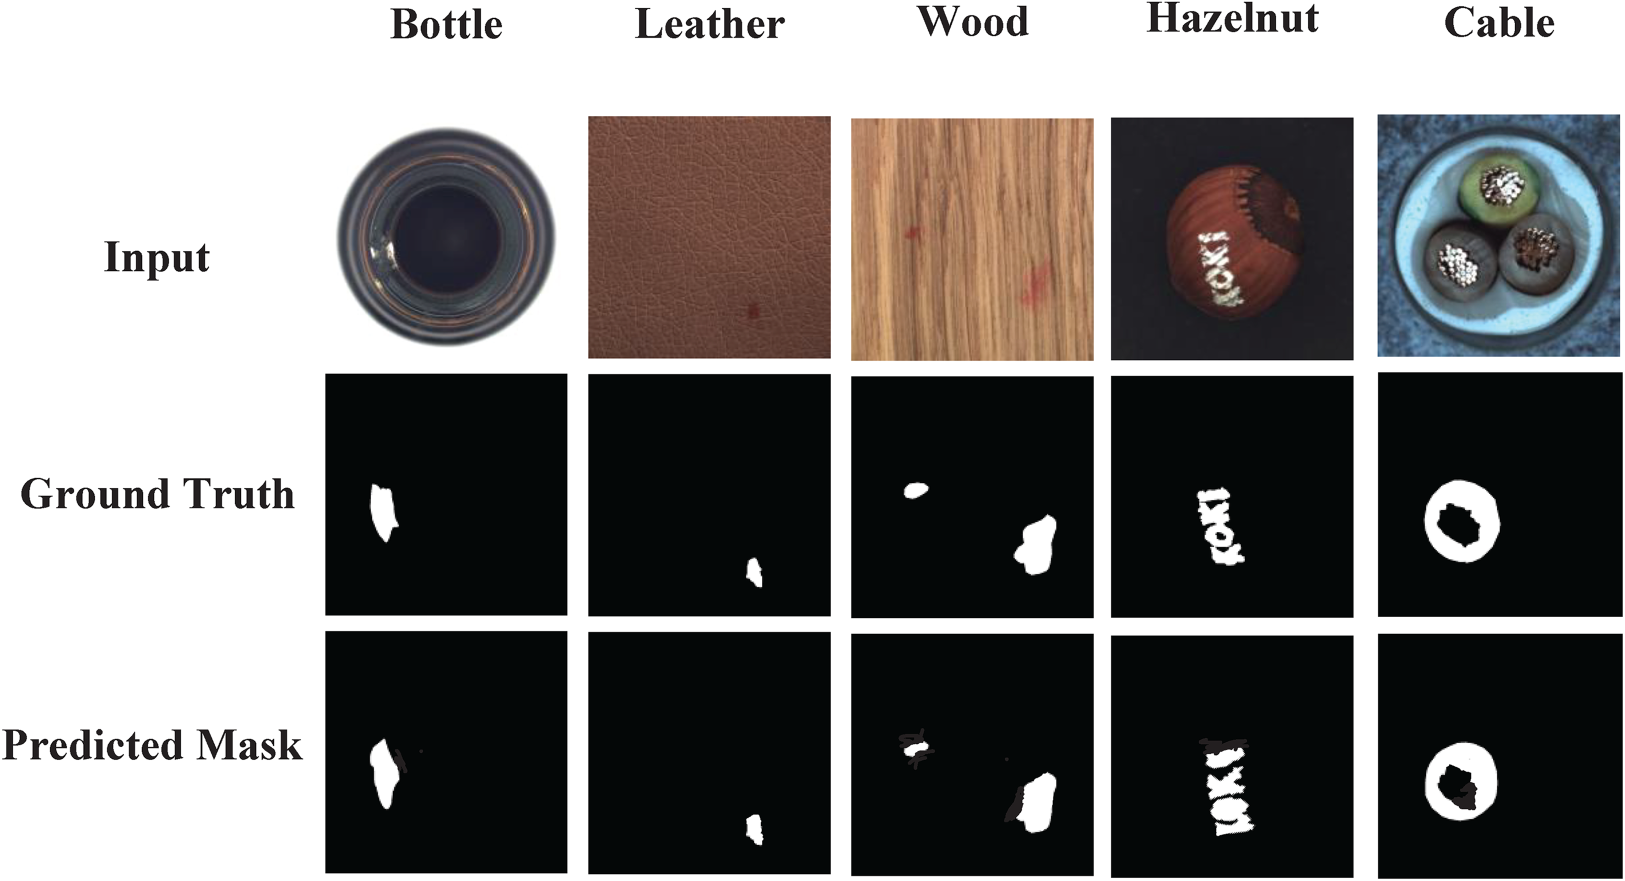
Qualitative results of anomaly location in MVTec AD dataset.
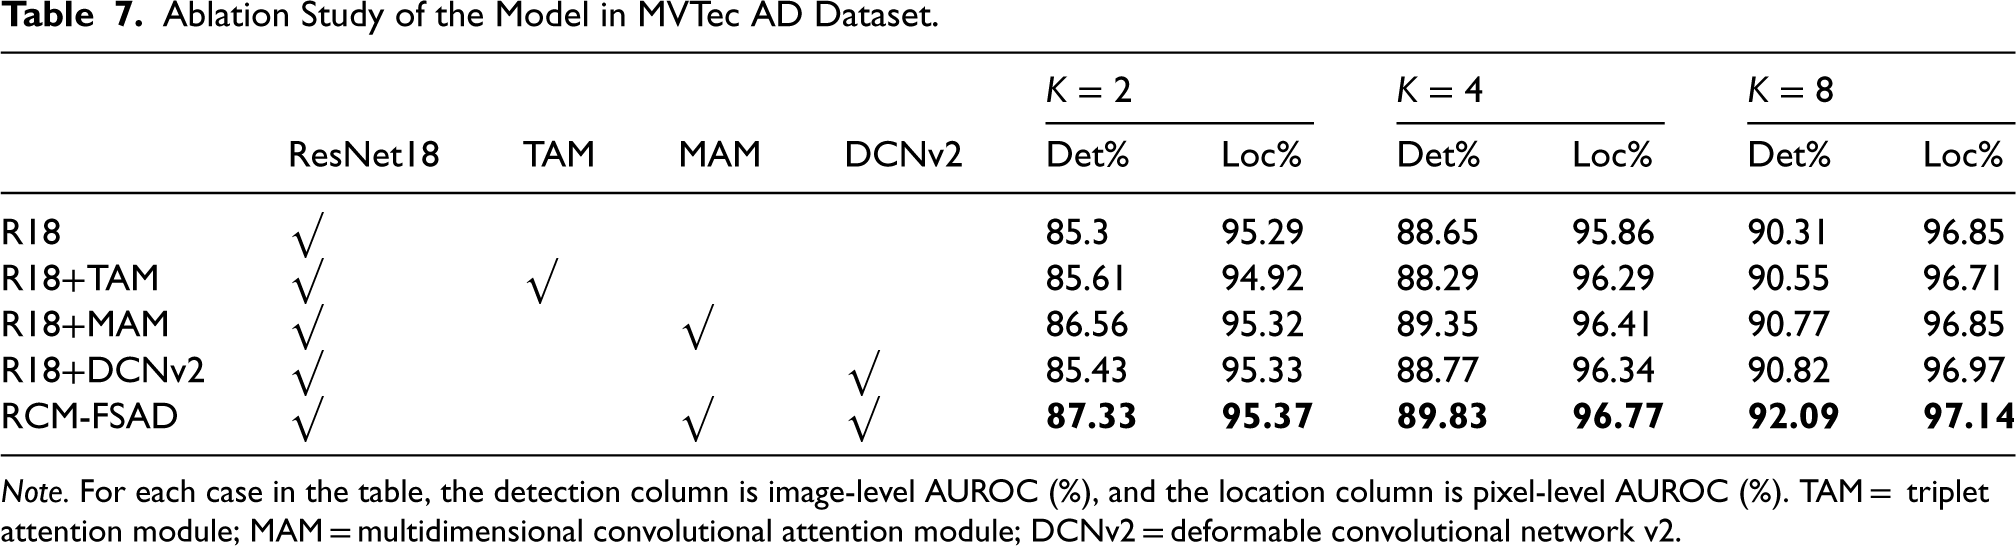
To further validate the effectiveness of the added modules, this paper conducts ablation experiments for each module on the MVTec dataset, and the k-shot results are shown in Table 7. ResNet18 was used as the feature extraction network but without the MAM and DCNv2 (denoted as R18 in the table). This was considered as the baseline performance for comparison with other models. For the MAM, the effectiveness assessment is represented from R18+TAM and R18+MAM, where ResNet18 is combined with the TAM and the MAM, respectively.
Ablation Study of the Model in MVTec AD Dataset.
Ablation Study of the Model in MVTec AD Dataset.
Note. For each case in the table, the detection column is image-level AUROC (%), and the location column is pixel-level AUROC (%). TAM = triplet attention module; MAM = multidimensional convolutional attention module; DCNv2 = deformable convolutional network v2.
The experimental results show that adding the MAM enhances the model’s performance more effectively than the TAM. This indicates that the MAM enhances the model’s ability to represent features by boosting the interaction of channel dimensions, and especially achieves significant results in enhancing feature registration. In addition, the role of DCNv2 in the model is validated. The addition of DCNv2 (R18+DCNv2) to the baseline method and the introduction of deformable convolutional kernels help the model to better understand the interrelationships between pixels in the image. This change led to an improvement in the model performance, suggesting that DCNv2 plays an active role in improving the feature learning capability. Ultimately, the model’s performance is further improved by combining the MAM and DCNv2 (R18+MAM+DCNv2), and these experiments demonstrate the effectiveness of the MAM module and DCNv2 in anomaly detection tasks, especially in improving feature representation and understanding image relationships. Combining the two, the model achieves better performance on the MVTec dataset.
Overall, the combination of R18+MAM+DCNv2 modules was chosen because they complement each other and work together to improve the performance of the model. ResNet18 provides stable feature extraction capability, the MAM enhances the feature representation capability, and DCNv2 improves the flexibility of feature learning. This combination allows the model to more accurately capture and differentiate between normal and abnormal samples in anomaly detection tasks, resulting in better performance on datasets such as MVTec.
For image anomaly detection and localization tasks, this paper proposes an unsupervised multidimensional attention module and feature registration-based anomaly detection model (RCM-FSAD) to perform detection and localization tasks of surface anomalies in images. The MAM serves as a feature optimization module, which facilitates the feature extraction and transformation module to learn the common features among categories. The variability convolution improved the Siamese network, which helps locate the anomaly region more precisely and improves the localization accuracy of the model. The overall performance of the model presented by RCM-FSAD in the MVTec AD dataset is better than that of state-of-the-art methods. In practical applications, there is still room for improvement. Image anomaly detection usually needs to consider multiple information sources, including color, texture, and shape. In the future, how to effectively fuze multimodal information into RCM-FSAD can be investigated to improve the model’s anomaly detection accuracy and robustness.
Footnotes
Author Contributions
Xin Xie and Shenping Xiong designed the study, conducted the anomaly detection experiments, and wrote the manuscript, and Tijian Cai and Wenbin Zheng provided technical support and assistance with data analysis. All authors reviewed and edited the manuscript.
Funding
The authors disclosed receipt of the following financial support for the research, authorship, and/or publication of this article: This study is supported by the National Natural Science Foundation of China (Grant No. 62162026) and the Jiangxi Provincial Natural Science Foundation (Grant Nos. 20232BAB202055, 20242BAB26019, and 20242BAB25066).
Declaration of Conflicting Interests
The authors declared no potential conflicts of interest with respect to the research, authorship, and/or publication of this article.