
Abstract
Objectives
(a) To morphometrically evaluate the Type I: Type III collagen ratio in Odontogenic keratocyst (OKC), Dentigerous cyst (DC) and Radicular cyst (RC). (b) To evaluate the efficacy of special stains, namely Herovici’s stain and Picrosirius red/fast green stain.
Methodology
A total of 30 histopathologically diagnosed archival tissue sections of odontogenic cysts were included, comprising 10 cases each of OKC, DC, and RC. Additionally, five cases of dental follicular tissue were used as the control group. All samples were subjected to routine and special staining. The stained slides were observed under 10× and 45× magnifications and three high-power (45×) fields were captured using a 2MP TS VIEW camera. The images were classified, transferred and saved in 24-bit RGB TIFF (Tagged Image File Format) used for image analysis using Image J software version 1.54d.
Results and Conclusion
One-way ANOVA test showed a marked variation in the Type I: III collagen profile among odontogenic cysts with both Herovici’s and Sirius red/fast green stains (p < .001). RC had the highest collagen ratio (2.52 ± 0.75; 1.76 ± 0.53), followed by DC (0.84 ± 0.18; 0.80 ± 0.19), while OKC showed the lowest (0.47 ± 0.15; 0.57 ± 0.18). Tukey’s post hoc analysis indicated significant differences between RC and DC (p = .002), RC and OKC (p < .001), as well as between DC and OKC (p = .002). Overall, RC showed the maximum ratio, OKC the minimum, and Herovici’s stain gave superior contrast.
Despite being benign, OKC is more aggressive than RC and DC, marked by increased Type III collagen. Collagen profiling with differential stains and image analysis aids in distinguishing cysts, assessing biological behavior, predicting recurrence, and guiding surgical management.
Keywords
The extracellular matrix (ECM) is a complex and dynamic network of macromolecules essential for preserving the appropriate cellular environment required for key functions like adhesion, proliferation, and differentiation. It is primarily composed of collagens, proteoglycans, and glycoproteins. The fibrous elements of the ECM are traditionally categorized into three types: collagen, reticular, and elastic fibers. 1
Collagen constitutes the core structural unit of the ECM. 2 Type I collagen is composed of dense, thick, and well-organized mature fibers, accounting for approximately 90% of the stromal tissue under normal physiological conditions. In contrast, Type III collagen consists of thinner, more immature fibers and comprises about 8%–10% of the stroma. 3
Collagen alterations contribute to diverse diseases—its degradation causes joint damage in arthritis, excess deposition leads to fibrosis, and genetic mutations result in tissue fragility. In cancer, abnormal remodeling promotes angiogenesis, invasion, and metastasis.4, 5
Collagen is also crucial in the pathogenesis of various oral conditions like periodontal diseases, benign lesions such as fibromas involve excessive collagen accumulation, while in odontogenic cysts, altered collagen synthesis affects cyst growth and recurrence, particularly in odontogenic keratocyst (OKC), Dentigerous cyst (DC) and Radicular cyst (RC). Odontogenic cysts make up a significant portion of pathological cases. It is particularly notorious for its high recurrence rate, which ranges from 10% to 60%. 6
The OKC is a developmental cyst of odontogenic origin, characterized by distinct histological features and a more aggressive biological behavior compared to other odontogenic lesions. The aggressive growth pattern of these cysts is believed to be driven by the active proliferation of the connective tissue wall.
The cyst’s invasive growth is likely driven by the active proliferation of its connective tissue wall. The expansion of jaw cysts is significantly influenced by the composition and organization of collagen within their connective tissue capsule. Human keratocyst-derived collagenase breaks down Type I and Type II collagen at a nearly equal rate, while having minimal effect on Type III collagen. This indicates that connective tissue degradation in OKCs may play a crucial role in their proliferative behavior.7–11
To assess stromal tissue and collagen, various staining methods are used. Traditional collagen detection stains like Masson’s trichrome, Van Gieson, and picrosirius red have limitations. 12
One innovative method, developed by Herovici in 1963, is a variant of the picropolychrome that differentiates Type I collagen by staining it red and Type III collagen blue, offering reliable and reproducible results for distinguishing collagen subtypes in tissue sections. 13 The Sirius Red/Fast Green combination offers a more uniform staining of collagen fibers, with red areas indicating Type I collagen, and is more effective for assessing overall collagen presence than Sirius Red alone. 14
Artificial intelligence enables rapid, quantitative, and unbiased pathological diagnosis. 15 Image J 1.54d is an open-access image analysis platform widely used for studying multidimensional images. Digital Image analysis is a practical, reproducible, and continuously enhanced by community-developed plugins for tasks such as color deconvolution, cell counting, and segmentation. 16 These tools support pathologists and clinicians by improving diagnostic accuracy, reducing delays, and minimizing prognostic errors, ultimately contributing to better patient care.
Hence, the current study aimed to examine, differentiate, and establish a correlation between various types of collagen fibers in odontogenic cysts using two distinct histochemical stains.
Materials and Methods
Sample selection: After obtaining Institutional Ethical Clearance, a total of 30 Histo-pathologically diagnosed cases of 10 cases of OKC (Set A), 10 cases of DC (Set B), and 10 cases of RC (Set C) were included. The blocks were cut into three sections of 5 µm thickness using a YORCO semiautomatic microtome. Each set was stained with two special stains- Herovici’s and picrosirius red with fast green stain, and one routine Hematoxylin and eosin stain.
Special Stain 1: Herovici’s Stain
The staining mixture was formulated by blending 0.1% w/v Acid Fuchsin in picric acid with 0.05% w/v Methyl blue in 1% v/v acetic acid in a 2:1 ratio. The tissue sections were then stained in this solution for 5 minutes, differentiated using 1% acetic acid for 2 minutes, and finally washed with 100% ethanol for 5 minutes. Subsequently, the slides were dehydrated through a graded series of alcohols (80%, 90%,100%), cleared in xylene, and mounted with DPX. 14
Special Stain 2: Sirius Red/Fast Green Stain
The tissue slides were initially immersed in 0.04% Fast Green for 15 minutes, rinsed under running tap water, and then further incubated in a staining solution containing 0.1% Fast Green and 0.04% Sirius red in saturated picric acid for 30 minutes. Following staining, the slides were dehydrated through a graded series of alcohols (80%, 90%, and 100%), cleared in xylene, and mounted using DPX. The stained sections were examined under 10× and 45× magnifications using a Lawrence and Mayo research microscope (Model: LM-52-1802, Aspire; Lawrence and Mayo [India] Pvt. Ltd.). To minimize selection bias, three systematically chosen high-power fields (45×) were analyzed, ensuring exclusion of areas with artifacts, tissue folds, or regions unrepresentative of the specimen. Photomicrographs were obtained using a 2 MP TS View digital camera attached to the microscope and saved in 24-bit RGB TIFF (Tagged Image File Format) format at a resolution of 640 × 480 pixels. This resolution has been previously reported to be adequate for threshold-based quantitative analysis at 45× magnification.
Image J software was used to quantify collagen fibers in histological slides through four steps: image acquisition, scale setting, deconvolution, and quantification. The scale was calibrated using the scale bar, and images were converted to RGB and separated into stained components with the “Color Deconvolution 2” command. Areas covered by blue (Type III) and red (Type I) fibers were delineated using the “threshold” tool, manually adjusted, and measured with the “Set measurement” function in the “Analyze” menu, with results displayed in the output window.
Assessment of visibility and differentiability of selected stains 16 : The selected stains were graded using a modification of the grading given by Singh R 1 for Intensity of staining, with scores: 2-Strongly positive, 1-Mildly positive, 0-Weakly positive/negative. The selected stains were graded using the grading given by Singh P et al. 8 for differentiability with scores: 1-Poor, 2-Satisfactory, 3-Excellent.
Results
Inferential statistics: The ANOVA test was used to compare the mean Type I: III collagen profile across the three groups of odontogenic groups (OKC, DC, RC), as the data were approximately continuous and normally distributed. The chi-square test was applied to compare the categorical grading scores for staining intensity and differentiability among the three groups. A p value of <.05 was considered statistically significant results.
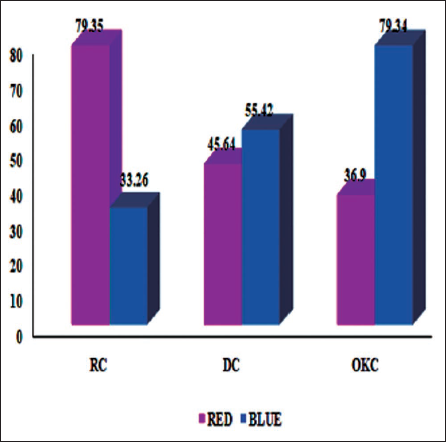
In Herovici’s stain analysis, the RC group had the highest percentage of Type I (red) fibers, 79.35 ± 7.2, and the lowest percentage of Type III (blue) fibers, whereas the OKC group had the lowest percentage of Type I (36.9 ± 9.12) and the highest percentage of Type III (79.34 ± 6.96) fibers. The mean % of area covered by red fibers was significantly higher than the mean % of area covered by blue fibers in RC. While in OKC, the blue fibers (79.34 ± 6.96) showed more predominantly than red fibers (36.9 ± 9.12) (Figure 1).
Distribution of Mean Percentage of Area Covered by Red (Type I) and Blue Fibers (Type III) in Herovici’s Stain Among Three Groups of Odontogenic Cysts.
A statistically significant variation in the mean Type I to Type III collagen ratio was observed among the three cyst groups (F(2,42) = 48.26, p < .001).
Tukey’s post hoc analysis demonstrated that the RC group (2.52 ± 0.75) showed a significant difference compared to both DC (1.38 ± 0.52; p = .002) and OKC (0.47 ± 0.14; p < .001). Additionally, a significant difference was also noted between the DC and OKC groups (p = .004).
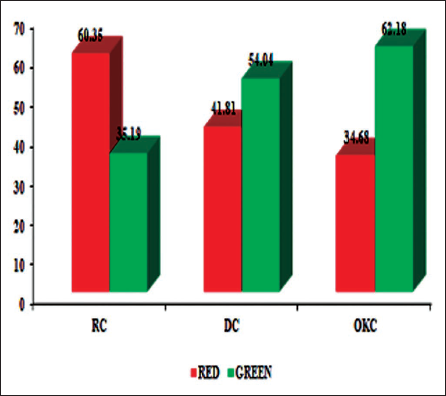
In Sirius red/fast green stain analysis, the mean % of area covered by red (Type I) fibers, 79.35 ± 7.2, was significantly higher than the area covered by green (Type III) fibers, 33.26 ± 9.99, in RC and DC. Conversely, OKC showed predominance of green fibers 62.18 ± 7.98 over red fibers (38.52 ± 9.10) (Figure 2).
Distribution of Mean Percentage of Area Covered by Red (Type I) and Green (Type III) in Sirius Red/Fast Green Stain Among Odontogenic Cysts.
The one-way ANOVA test revealed a statistically significant variation in the mean collagen ratios among the three study groups (F(2,42) = 36.57, p < .001).
As shown in Figure 3, the mean Type I to Type III collagen ratio was markedly reduced in OKC (0.47 ± 0.15; p < .001) when stained with Herovici’s method.
Comparison of the Mean Type I: III Collagen Ratio Indicated a Significant Decrease in OKC (0.47 ± 0.15) with (p < .001) Compared to RC and DC Using Herovici’s Stain.
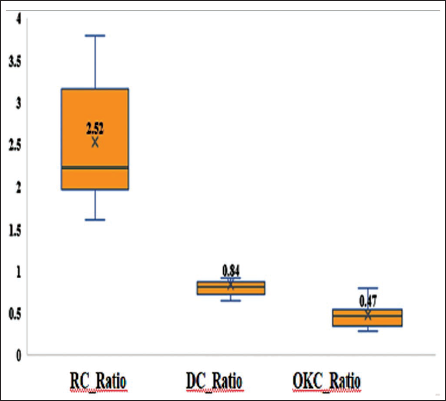
Tukey’s post hoc analysis further confirmed significant differences between RC and DC (p = .002), RC and OKC (p < .001), as well as between DC and OKC (p = .002).
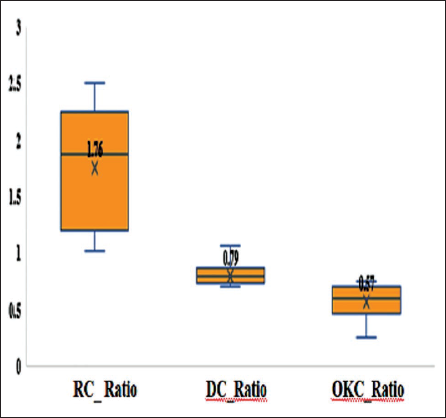
When comparing the two staining techniques, Herovici’s stain demonstrated a greater intergroup variation (RC: 2.52 ± 0.75 vs. OKC: 0.47 ± 0.14; ∇ = 2.05) than the Sirius Red/Fast Green stain (RC: 1.76 ± 0.63 vs. OKC: 0.57 ± 0.16; ∇ = 1.19) (Figures 3 and 4).
Comparison of the Mean Type I: III Collagen Ratio Indicated a Significant Decrease in OKC (0.57 ± 0.18) with (p < .001) Compared to RC and DC Using Sirius Red/Fast Green Stain.
The one-way ANOVA test indicated significant differences among the groups for both staining methods: (a) Herovici’s stain: F(2,42) = 51.82, p < .001. (b) Sirius Red/Fast Green stain: F(2,42) = 27.49, p < .001.
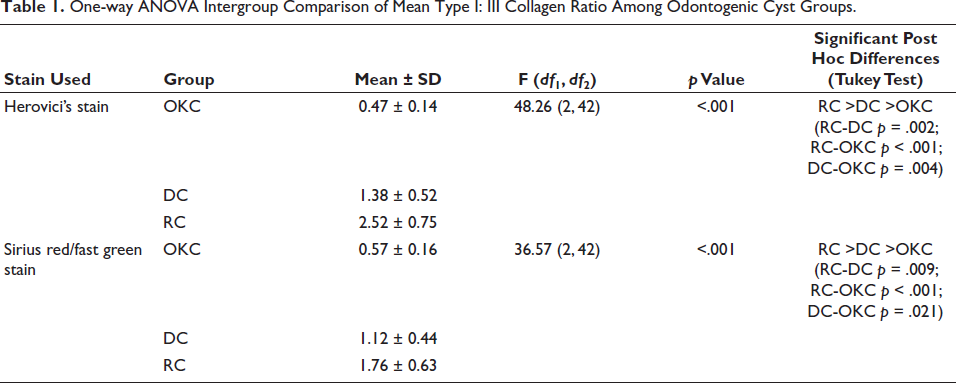
Post hoc comparisons revealed that the RC group exhibited a significantly higher mean collagen ratio compared to both DC and OKC (p < .001), while DC also showed a significant difference from OKC (p = .003) (Table 1).
One-way ANOVA Intergroup Comparison of Mean Type I: III Collagen Ratio Among Odontogenic Cyst Groups.
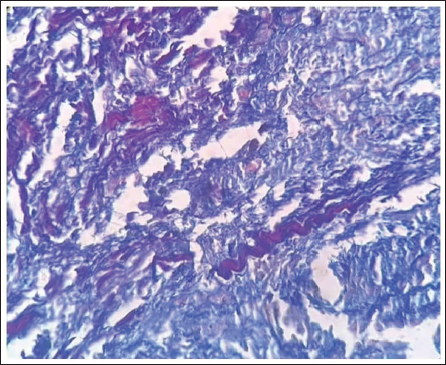
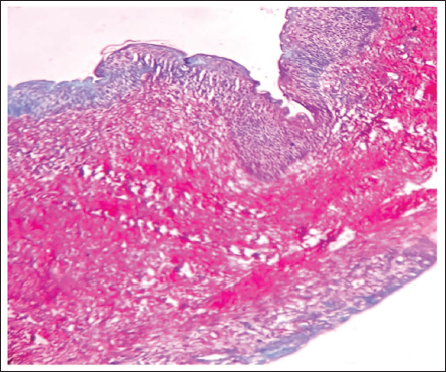
Quantitative assessment of Type I and Type III collagen fibers across the three study groups, followed by one-way ANOVA analysis, revealed a statistically significant variation in their distribution among OKC, DC, and RC. Analysis among three groups of odontogenic cysts, OKC, showed a marked elevation in the distribution of the Type III collagen fibers exhibiting blue (Herovici’s) and Green (Sirius red/fast green) stained fibers. Overall, Herovici’s stain demonstrated greater sensitivity and clarity in detecting and differentiating collagen than the Sirius red/fast green stain (Figures 5 and 6).
Herovici’s Stained Slide of OKC Demonstrated Collagen Type I: Red and Type III: Blue Fibers.
Sirius Red/Fast Green-stained Slide of OKC Demonstrated Collagen Type I: Red and Type III: Green Fibers.
Steps for Image Analysis
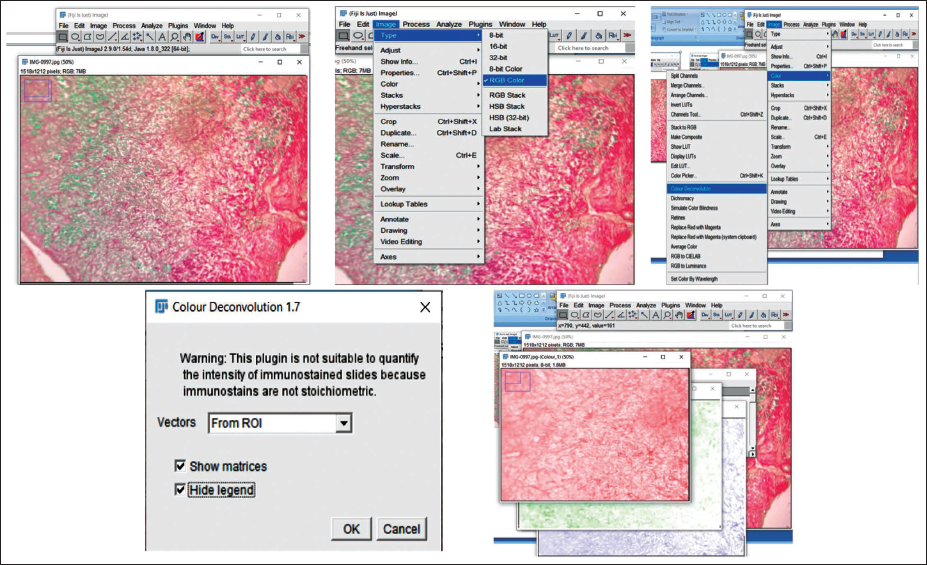
The captured images were transformed into RGB format by choosing the “RGB Color” option under the “Type” menu in the “Image” tab. Thereafter, individual stain components were isolated using the “Color Deconvolution2” function available within the “Image” menu (Figure 7).
Steps for RGB (Red, Green, and Blue) Color Deconvolution Plugin on Image J Software.
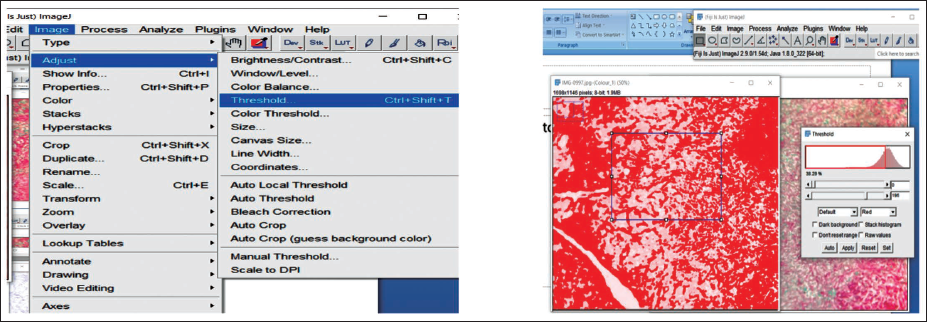
The region occupied by red fibers was outlined using the “Threshold” option within the “Adjust” menu of ImageJ and manually refined to encompass the complete stained area. Measurements were configured through “Analyze ↓ Set Measurements,” selecting the “Area” and “Limit to threshold” parameters. The quantified values were then obtained using the “Measure” function. This procedure was similarly applied to determine the area of Type III (red/green) collagen fibers in both Herovici’s and Sirius red/fast green stains (Figures 8 and 9).
Threshold Value Adjustment for Red-stained Fibers in OKC.
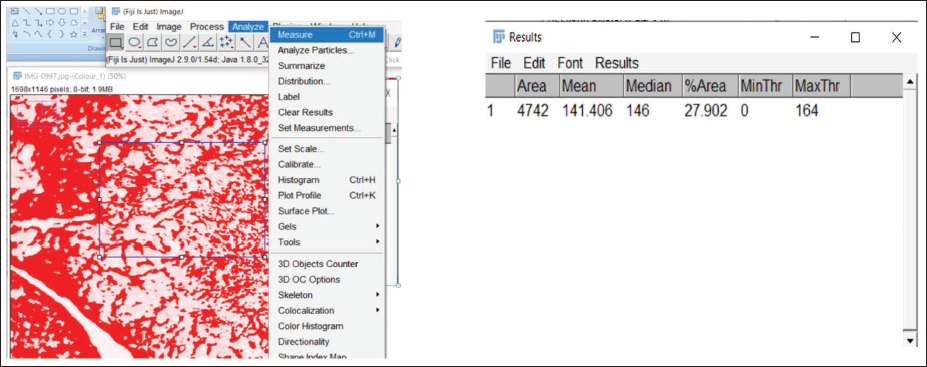
Measurement of Area Covered by Fibers in the Region of Interest.
Discussion
Epithelial–mesenchymal interactions, which play a crucial role in tooth development, may also be implicated in the pathogenesis of various conditions, including odontogenic cysts and tumors. While the epithelium is primarily considered responsible for these lesions, the connective tissue may also play an active role in their development. The dynamic interaction between epithelial and connective tissues is considered a critical factor in the development of odontogenic cysts and tumors. 17
The growth and expansion of odontogenic cysts were traditionally believed to result from osmotic pressure exerted by the cystic contents. However, recent studies have shifted focus to the significance of epithelial–mesenchymal interactions in the pathogenesis of these lesions. The stroma is thought to play a vital role in supporting and maintaining the epithelial component, together forming an interactive ecosystem characterized by continuous molecular communication. This concept was supported by studies conducted by Vedtofte P et al. (1982), who examined transplanted keratocyst epithelium in nude mice. Their findings suggested that cystic epithelial differentiation is not autonomous but is influenced by the surrounding stroma. They concluded that the stromal component contributes to the biological behavior of the lesion through ecto-mesenchymal interactions. 18
Collagen constitutes about one-third of the body’s total protein and contributes to over half of the skin’s dry weight, making it the most abundant protein in the ECM. It is essential for preserving the structural integrity and functionality of tissues. Although modern molecular techniques like immunohistochemistry are widely used for diagnostic purposes, they are less effective in highlighting pathological collagen fibers. Traditional histopathological methods with specific histochemical stains remain the most reliable for visualizing collagen. 19
While most research has concentrated on the proliferative behavior of the epithelial component in odontogenic lesions, the role of the mesenchymal tissue is equally important. Only a few studies have addressed the significance of epithelial–mesenchymal interactions in the growth of odontogenic cysts. The stroma plays a vital role in supporting epithelial tissues, with both components engaging in constant molecular interactions. Hirshberg et al. (1999) observed thick collagen fibers exhibiting green birefringence in OKC, compared to the orange-red birefringence seen in radicular and DC. This indicates that the collagen in OKC is more loosely organized and may consist of procollagen or intermediate forms, unlike the tightly packed collagen found in DC and RC. 20
More recent research on collagen in odontogenic cysts and tumors by Naik N et al. (2023) evaluated collagen fibers in DC, normal, and hyperplastic dental follicles using Masson’s trichrome and Picrosirius red stains. They reported significant differences in collagen orientation and organization, concluding that Picrosirius red was superior to MT and H&E for detecting and differentiating mature and immature fibers. 21 Peddapelli et al. (2019) compared and correlated different types and patterns of collagen fibers in KCOT (Keratocystic odontogenic tumor) and ameloblastoma using picrosirius red stain under polarizing microscopy in order to delineate their aggressiveness. 22
In various pathological states, including human odontogenic tumors, the presence of thick green to greenish-yellow fibers has been documented. While earlier studies have explored aspects such as the orientation, arrangement, organization, and polarization characteristics of thick and thin collagen fibers in the connective tissue walls of odontogenic cysts, limited research has specifically focused on the Type I to Type III collagen ratio.
In the current study, the amounts of collagen Type I and III content within the stroma were analyzed using Image J software and contrasted across OKC, DC, and RC. The mean Type I: III collagen ratio for both stains varied significantly (p < .001) among the three odontogenic cyst groups according to a one-way ANOVA test. The highest ratio was continuously shown by the RC, followed by the OKC and DC. In comparison to Sirius red/Fast green (36.57), Herovici’s stain showed higher F values (48.26), indicating stronger discriminating sensitivity.
Junqueira et al. (1982) reported that collagen fibers stained with Sirius red alone appeared as red regions with various red hues, many of which were not easily captured through image analysis. In the present study, both Sirius red/fast green and Herovici’s stains successfully differentiated between Type I and Type III collagen fibers. However, Herovici’s stain proved particularly effective by distinctly staining mature collagen fibers red and immature fibers blue. This approach removes the need for costly, specialized techniques or equipment for collagen fiber analysis. 23
The limited studies that have used contrasting stains such as Herovici’s and Sirius red/ fast green stain to profile collagen I: III fibers are on general pathology lesions rather than in odontogenic cysts. The study employed a straightforward differential staining method combined with image analysis to accurately quantify collagen content—eliminating the requirement for extensive procedures, costly molecular tools, or specialized training that could otherwise delay diagnosis.
Limitations of the Study
The study utilized a small sample size, which may affect the statistical power and generalizability of the results. However, larger cohorts are required for more accurate evaluation of collagen distribution among odontogenic cysts.
Conclusion
OKC is a benign cyst of odontogenic origin, distinguished by its unique histological features and more aggressive behavior compared to dentigerous and RC, along with an elevated presence of Type III collagen. In the present study, differential staining proved to be a cost-effective and highly reproducible technique for assessing stromal composition. The use of image analysis enhanced the objectivity of the evaluation and minimized observer bias. This study highlights the significance of collagen identification, particularly through the quantitative assessment of the Type I: Type III collagen ratio using Herovici’s stain, in distinguishing aggressive from non-aggressive lesions.
Footnotes
Acknowledgments
The author gratefully acknowledges the support and guidance of Manubhai Patel Dental College and Hospital, Vadodara, for providing the academic framework and resources necessary to carry out this research work.
Author Contributions
All authors contributed to study design, data collection, analysis, and manuscript preparation. All authors have read and approved the final manuscript.
Data Availability
The data that support the findings of this study are available from the corresponding author.
Declaration of Conflicting Interests
The authors declared no potential conflicts of interest with respect to the research, authorship, and/or publication of this article.
Ethical Approval Institutional Statement
The study received ethical clearance from the Institutional Ethics Committee. Approval No: IEC/MPDC_285/OP-49/23.
Funding
The authors received no financial support for the research, authorship, and/or publication of this article.
Informed Consent
Not applicable.