
Abstract
Background:
Pain perception in older adults is influenced by various physiological factors, including muscle health. While sarcopenia has been linked to increased pain sensitivity, the specific relationships between muscle mass, strength, and pain sensitivity remain underexplored.
Objective:
To examine the associations between skeletal muscle mass, skeletal muscle index (SMI), handgrip strength (HGS), and pressure pain threshold and tolerance in older adults.
Methods:
A cross-sectional study was conducted among 47 older adults (mean age 69.4 ± 9.1 years) residing in long-term care. Pressure pain threshold and tolerance were measured at three anatomical sites using algometry. Muscle metrics, including whole-body and regional skeletal muscle mass, SMI (kg/m2), and HGS (kg), were assessed. Multiple linear regression analyses were performed, adjusting for age, gender, BMI, comorbidities, and analgesic use.
Results:
All muscle metrics showed significant positive correlations with pain threshold and tolerance. After adjustment for confounders, these associations remained significant. HGS and whole-body skeletal muscle mass were the strongest predictors, indicating that participants with higher muscle mass and strength had greater pressure pain tolerance.
Conclusion:
Higher skeletal muscle mass and strength are independently associated with reduced pain sensitivity in older adults, suggesting that muscle health may be a modifiable factor in pain management.
Introduction
Pain perception refers to the capacity to detect and interpret noxious stimuli (Afridi et al., 2021). It is bounded by an individual’s pain threshold (the point at which a stimulus is perceived as painful) and pain tolerance (the maximum level of pain that an individual is willing or able to endure; Luu et al., 2024). This range, often referred to as the functional pain perception window, is influenced by several factors, including sociodemographic variables, comorbidities, medications, and psychosocial context (Atlas & Wager, 2012). Advancing age is associated with notable alterations in pain perception (Tinnirello et al., 2021). Evidence suggests that older adults exhibit an elevated pain threshold alongside a reduction in pain tolerance, leading to a compressed range of functional pain perception (Dagnino & Campos, 2022).
Physical activity and structured exercise interventions have been widely reported to exert analgesic effects through the activation of descending pain inhibitory pathways and the modulation of endogenous opioid and neurotransmitter systems (Sluka et al., 2018). In recent years, increasing attention has been directed toward the role of myokines, cytokines, and other peptide molecules secreted by contracting skeletal muscles as potential mediators of exercise-induced pain modulation (Docherty et al., 2022; Piccirillo, 2019). Muscle metrics, including the integrity, mass, and strength of skeletal muscles, play a critical role in facilitating exercise-induced hypoalgesia (Hendriks et al., 2024). Among older adults, age-related decline in neuromuscular integrity, myokine secretion, and the efficiency of muscle oxidative metabolism may attenuate these analgesic mechanisms (Wang et al., 2025). The quantitative sensory testing parameters provide objective and reproducible measures of mechanical pain sensitivity and are particularly valuable in both clinical assessment and experimental pain research (S. Hughes et al., 2024). Among the various methods to assess pain perception, pressure pain threshold (PPT) and pressure pain tolerance are the most widely studied and well-documented (Vesal et al., 2024). Despite developments in pain studies among older adults, there remains a limited understanding of the relationship between skeletal muscle metrics, including muscle mass, strength, and pain perception in older adults. Hence, this study investigates the relationship between skeletal muscle mass, skeletal muscle index (SMI), handgrip strength (HGS), and pressure pain threshold and tolerance among older adults in long-term care settings.
Materials and Methods
The study followed a cross-sectional design and was carried out from June 2024 to May 2025 in seven long-term settings in Udupi District, India. The Institutional Ethics Committee of Kasturba Hospital, Manipal (IEC2:88/2024) approved the research. This study is registered under registration number CTRI/2024/05/067022 at the Clinical Trials Registry- India. The sample size of n = 47 was estimated using G Power 3.1, applying the F-test: Multiple Regression (Fixed Model, R2 Increase), with α = .05, power (1 − β) = 0.80, and an expected correlation coefficient of r = .40 between skeletal muscle mass and pressure pain threshold (Cohen, 2013; Imai et al., 2022). Participants were recruited using convenience sampling. Residents who were aged ≥ 60 years and had spent at least 6 months in each facility were included in the study. Older adults with recent (≤30 days) infections, who have recently been in a hospital, are bedridden or use a wheelchair, who have metal implants or pacemakers, as well as those with serious or terminal illnesses, were excluded.
After explaining the procedure, written informed consent was obtained from the participants. Demographic data, which included age, gender, height, weight, and hand dominance, were collected. The skeletal muscle mass was estimated using the Omron Karada scan HBF-375 Bio-electrical Impedance analyzer (BIA). Participants stood on the machine with their feet positioned on the lower sensors and arms raised at 90* to shoulder level, holding the handles with elbows extended. The appendicular skeletal muscle mass (kg) obtained from the device was converted into the skeletal muscle index by dividing it by the participant’s height squared (m2; Walter-Kroker et al., 2011). The validity of BIA for estimating skeletal muscle mass in older adults has been well established (De Rui et al., 2017).
Handgrip strength (HGS) was assessed using a hand-held dynamometer (JAMAR Plus, 2015090057) following standard procedures. Participants were seated comfortably in a chair with their back supported, shoulders in a neutral position, elbows flexed at 90°, forearms in a mid-prone position, and wrists in a neutral posture. The movable handle of the dynamometer was set to the second slot. Participants were instructed to press the handle as hard as possible for 3 s. After a practice trial, participants performed the test three times with 1 min of rest in between, and the maximum isometric contraction, measured in kilograms, was recorded (Svinøy et al., 2023). The JAMAR dynamometer has been widely validated and is considered a reliable and gold-standard instrument for assessing handgrip strength in older adults (Huang et al., 2022).
Pain pressure perception was using a digital pressure algometer with a 1 cm2 sensor (Wagner- FDIX PAIN TEST TM FPIX, Model- FPIX 25 (10 × 0.005 kgf)). The participants were seated on a chair with low back support and the pressure pain was evaluated at three places: the tip of the index finger, the radial styloid process, and on the upper fibers of the trapezius. These sites were selected based on recommendations for quantitative sensory testing, representing three distinct tissue types: areas with minimal muscle mass and high sensory receptor density, regions over subcutaneous bone with no underlying muscle, and sites with maximal muscle fiber composition respectively (van Driel et al., 2024). The algometer was applied to the skin at a right angle, and a constant pressure of 1 kg/s was increased. For pressure pain threshold, the participants were instructed to say “yes” when the pressure first produced a sensation of pain, and the manometer reading was recorded. For pressure pain tolerance, the pressure on the algometer was increased until the participant could no longer tolerate it. The process measured each site three times, and the final PPT was the average of these readings. A 10-min pause at each site prevented exhaustion or potential tissue injuries (de la Coba et al., 2022).
Jamovi v2.6.23 was used to analyze the data. Demographic data were summarized using descriptive statistics. Univariate and multivariate linear regression analyses were carried out to determine the relationship between variables. Pain pressure thresholds and tolerance values were designated as dependent variables, while muscle metrics served as independent variables during the univariate analysis. Additionally, covariates like age, gender, BMI, comorbidities and medications were adjusted during the multivariate analysis. The level of significance was set at p ≤ .05. Since the data involved a one-time objective assessment and a direct data entry during participant evaluation, no missing data were expected. The Durbin–Watson statistic (1.89) confirmed residual independence, Q–Q plots indicated normality, and scatterplots of standardized residuals confirmed homoscedasticity. Multicollinearity was assessed using Variance Inflation Factor (VIF < 2). The study is reported using STROBE checklist for cross-sectional study (Supplemental File 1).
Results
A total of 47 older adults living in long-term care (mean age 69.4 ± 9.1 years; 53.2% male, 46.8% female) took part in this study after screening 285 residents, as depicted in Figure 1. The mean Body Mass Index (BMI) amongst participants was 23.2 ± 4.2 kg/m2. Most participants (61.7%) had more than one comorbid condition, with the most frequent one being diabetes (59.6%), and over 4.3% of participants were using analgesics. The demographic characteristics of the participants are provided in Table 1. Missing data imputation was not required as all variables were recorded in real-time, and completeness was ensured during data collection.

Flow of participants.
Demographic Characteristics (n = 47).

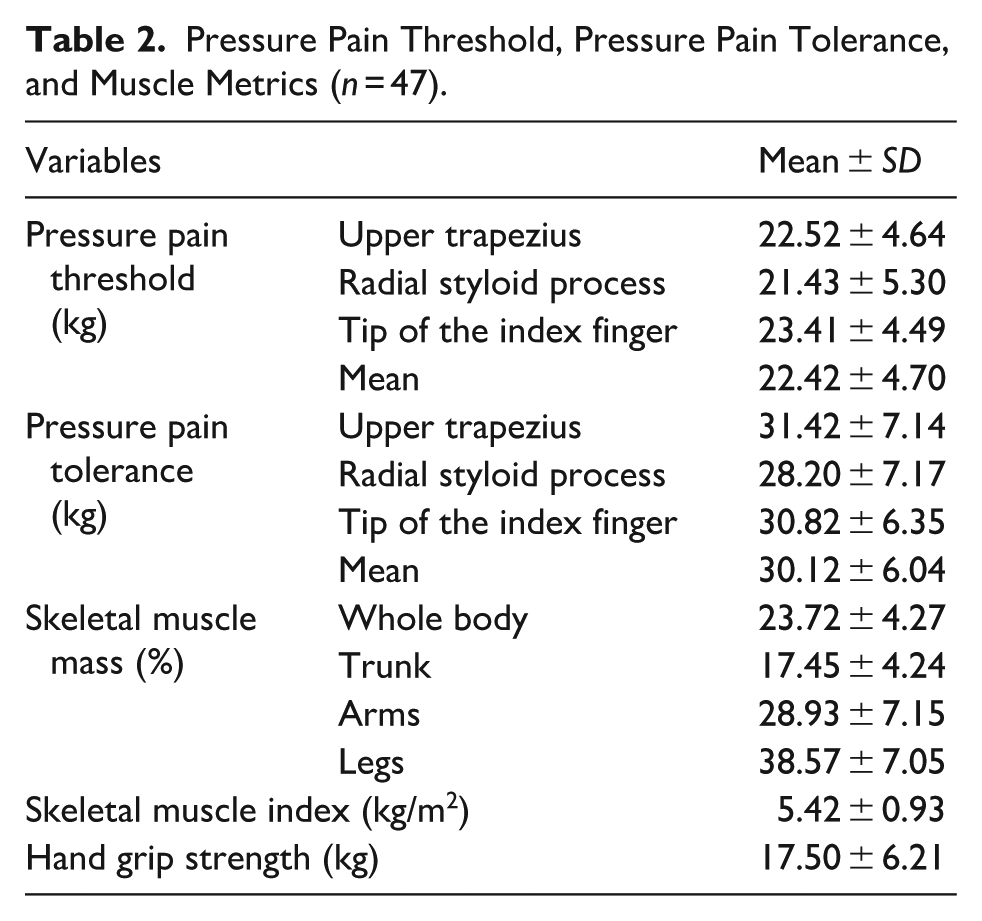
Table 2 presents the mean values of pressure pain threshold and tolerance across three anatomical sites, along with measurements of skeletal muscle mass, skeletal muscle index, and handgrip strength. On average, participants tolerated approximately 7.7 kg more pressure than their respective pain thresholds. Notably, both the mean skeletal muscle index and handgrip strength were below the established cutoff values of 5.8 kg/m2 and 18 kg, respectively.
Pressure Pain Threshold, Pressure Pain Tolerance, and Muscle Metrics (n = 47).
No significant outliers were observed (Cook’s distance < 1) and the residuals were approximately normally distributed, satisfying model assumptions. The findings from both univariate and multivariate analyses shown in Table 3, indicate a significant and consistent positive association between muscle metrics and pressure pain measures. Specifically, higher skeletal muscle mass (whole body and regional), skeletal muscle index (SMI), and handgrip strength (HGS) were associated with increased pressure pain threshold and tolerance. In the univariate analysis, correlation coefficients ranged from .326 to .477, indicating moderate associations, all of which were statistically significant (p < .005). The overall variance explained by the univariate analyses (adjusted r2) ranged from 10.7% to 22.7%. Upon adjusting for age, gender, BMI, comorbidities, and analgesic use in the multivariate analysis, the strength of these associations increased substantially (r = .602–.668), with all variables maintaining statistical significance (p < .01). Notably, handgrip strength and whole-body skeletal muscle mass exhibited the strongest associations with both pain threshold and tolerance. These results suggest that skeletal muscle mass and strength show significant correlations with pressure pain thresholds, highlighting the protective role of muscle health in modulating pain sensitivity. The overall variance explained by the multivariate analyses (adjusted r2) ranged from 28.2% to 74.3%. However, the directionality of this relationship cannot be determined from the cross-sectional data.
Relationship Between Pain Perception Levels and Muscle Metrics (n = 47).

Adjusted for age, gender, BMI, comorbidities & analgesics use.
Discussion
This study intended to find out the relationship between pain threshold and tolerance with the percentage of skeletal muscle mass and hand grip strength among older adults residing in long-term care settings. The results indicate that both low muscle mass and weak handgrip are associated with lower thresholds for pressure pain threshold and tolerance, and were still significant when adjusted for age, sex, BMI, comorbidities, and medications. The findings suggest that evaluating and managing muscle strength and mass should be an important part of non-pharmacological pain care. Muscle strength and mass assessment is easy, cost-effective thus, enhancing feasibility in resource-limited settings (Correa-de-Araujo et al., 2017). With the knowledge that muscle mass and strength can be improved with appropriate exercises and adequate nutrition, these results support setting targeted rehabilitation to boost muscle function and lessen pain (Giraldo-Vallejo et al., 2023; D. C. Hughes et al., 2018). This strategy matches recent work that seeks to lessen polypharmacy and linked risks among the elderly (Zahlan et al., 2023).
These results encourage researchers to further explore how muscles affect sensitivity to pain as we get older. Loss of muscle, a switch from type II to type I fibers and extra fat put more stress on the membranes and make older adults more sensitive to pain (Verdú et al., 2021). As a result, these processes make mechanosensitive channels, especially PIEZO2, even more active, and this happens more in atrophic muscles, so pain is felt more strongly (Murthy et al., 2018). In addition, pro-inflammatory cytokines made by muscles such as TNF-α and IL-6, act on TRPV1 and ASIC3 receptors which help sensitize the periphery (Popko et al., 2010). These observations may reflect underlying physiological mechanisms: sarcopenia-induced nociceptor sensitization (via heightened mechanical stress and pro-inflammatory cytokines), degeneration of Aδ nerve fibers, and glial cell proliferation, which disrupts nociceptive signaling (Imai et al., 2022).
The results suggest that poor muscle function may be responsible for experiencing more pain. New research is changing our view of skeletal muscle by pointing out that it is active in hormone and immune response (Pedersen & Febbraio, 2008); (Rogeri et al., 2020). Sarcopenia in older people causes the muscles to weaken, leads to inflammation and affects nerve cells, all of which can make nociceptors more reactive (Dalle et al., 2017). Aging is linked, from a neurological perspective to the decrease in Aδ fibers and reduced inhibitory activity from the locus coeruleus, which helps control pain (España et al., 2024). Such a fall is truly negative for deep somatic pain, usually found in muscles and joints. The lack of normal muscle feedback results in the cortex processing sensations incorrectly which intensifies the way pain signals are understood (De Ridder et al., 2021).
The results also point to the possibility that muscle health might impact the way pain is sensed in men and women. While former results suggested women experienced more pain, this study observed the differences getting smaller as sarcopenia advanced, suggesting their health and not just their hormones are important. As a result, the study helps explain musculoskeletal aging and pain and urges a new approach to long-term care, preferring muscle prevention over symptom-based treatment. Giving elderly people resistance training and nutritional support as part of regular care may support better mobility, greater independence and comfort while helping them use fewer analgesics.
This research stresses that muscle health is very important for how much pain older individuals in long-term care feel. This suggests that skeletal muscle mass and handgrip strength are important, easy-to-measure predictors of pain sensitivity. By detailing the physiological, neurological and inflammatory routes that muscle loss lead to abnormal pain, the study opens up new ideas for future interventions. These discoveries suggest that pain management for older adults should start with musculoskeletal health.
Strength & Limitations
The strength of this study lies in its objectivity in evaluating pain and muscle metrics. A pressure algometer is a part of the standardized Quantitative Sensory Test system, which lessens the chance for subjective errors. For elderly participants in our study, bioelectrical impedance analysis and dynamometer proved to be the most accurate way to measure skeletal mass and muscle strength. However, the associations between muscle metrics and pain sensitivity may have three possible scenarios. Firstly, muscle weakness causing increased pain sensitivity, then reverse causation where pain sensitivity leads to muscle deterioration through activity avoidance. Finally, a bidirectional relationship where both factors mutually influence each other over time. This study cannot explain this causation effect. Also, factors like nutrition, sedentarism, and social support were not looked at, despite their big impact on muscle strength and overall health. Also, the researchers did not look at anxiety, depression, stress or pain catastrophizing as psychological processes. These mental factors play a big role in perception and the experience of pain and may account for variations in pain responses not related to muscle status.
Significance of the Study
This research is important for clinicians since it reveals a strong and moderate link between measures of muscle function and tolerance to pain in older people. It is stated in the study that muscle loss not only weakens strength and affects mobility, but also strongly affects how persons manage sensory pain. Due to the large numbers of elderly living in long term care settings who have sarcopenia and chronic pain, these results suggest that treating the two conditions together could be very effective. Identifying how poor muscle status and pain sensitivity are linked, the research underlines the design of integrated treatments for rehabilitation and pain management. Intervention programs look promising because they can help restore muscle function, ease pain and increase comfort for older adults. At the same time, working out helps seniors depend less on medicines and prevents much of the side effects they may experience from drugs.
Future Recommendations
To establish causal relationships between muscle metrics and pain perception, longitudinal study designs are warranted. Such designs would enable the tracking of temporal changes in muscle mass, strength, and pain sensitivity, thereby clarifying the directionality of these associations. Furthermore, targeted investigations into the effects of specific interventions particularly resistance training and nutritional supplementation are essential to determine their efficacy in modulating pain responses among older adults with low muscle mass. These interventions may serve not only to improve musculoskeletal health but also to inform evidence-based strategies for pain management in this vulnerable population.
Conclusion
This research emphasizes the strong correlation between muscle metrics, including skeletal muscle mass and hand grip strength, and pain perception, including pain threshold and tolerance, among older people who live in long-term care institutions. The research stresses the vital importance of ensuring muscle health in the reduction of pain sensitivity and improvement of pain tolerance. This indicates that interventions intended to maintain or enhance muscle function would have the potential to represent effective strategies for the management of pain and enhancement of quality of life in long-term care settings, where both sarcopenia and chronic pain are prevalent.
Supplemental Material
sj-docx-1-ggm-10.1177_30495334251404272 – Supplemental material for Association Between Muscle Metrics and Pressure Pain Sensitivity in Older Adults
Supplemental material, sj-docx-1-ggm-10.1177_30495334251404272 for Association Between Muscle Metrics and Pressure Pain Sensitivity in Older Adults by Jashandeep Singh, Sidhiprada Mohapatra and Girish Nandakumar in Sage Open Aging
Footnotes
Ethical Considerations
The following statements are included in the methods section: “The Institutional Ethics Committee of Kasturba Hospital, Manipal (IEC2:88/2024) approved the research. This study is registered under registration number CTRI/2024/05/067022 at the Clinical Trials Registry-India.
Consent to Participate
After explaining the procedure, written informed consent was obtained from all the participants.
Funding
The authors received no financial support for the research, authorship, and/or publication of this article.
Declaration of Conflicting Interests
The authors declared no potential conflicts of interest with respect to the research, authorship, and/or publication of this article.
Data Availability Statement
The data generated from this study will be made available upon a reasonable request to the authors.
Supplemental Material
Supplemental material for this article is available online.
References
Supplementary Material
Please find the following supplemental material available below.
For Open Access articles published under a Creative Commons License, all supplemental material carries the same license as the article it is associated with.
For non-Open Access articles published, all supplemental material carries a non-exclusive license, and permission requests for re-use of supplemental material or any part of supplemental material shall be sent directly to the copyright owner as specified in the copyright notice associated with the article.