
Abstract
Introduction:
Bone loss begins between 30 and 40 years of age in men and women, with women experiencing an accelerated decline in bone mass and density after menopause. Understanding the interplay of hormonal changes, inflammation, and other factors during this period is critical for addressing bone health. The objective was to investigate the impact of menopausal transition and postmenopausal status on bone mineral density (BMD) and its associations with biochemical, anthropometric, and lifestyle factors among Pakistani women.
Methods:
This cross-sectional study involves 632 Pakistani women, equally divided into menopausal transition (MPT) and postmenopausal (PM) groups. Data on Body Mass Index (BMI), blood pressure, BMD, hormonal levels (estrogen, (Follicle stimulating hormone (FSH), Osteoprotegerin (OPG), Receptor activator of nuclear factor kappa (RANK-L)), inflammation markers (Interleukin-6 (IL-6), C-reactive protein (CRP)), vitamin D, and demographic factors were collected. Statistical analysis included ANOVA, chi-square tests, correlation analysis, and regression modeling to evaluate predictors of BMD while adjusting for confounders.
Results:
Postmenopausal women had higher BMI, blood pressure, and a greater prevalence of obesity compared to MPT women. Osteopenia was prevalent (49%), and osteoporosis affected 21.2% of participants. BMD was inversely correlated with FSH, RANK-L, IL-6, CRP, BMI, and parity, and positively associated with estrogen, OPG, vitamin D, and education. Regression analysis identified waist-to-hip ratio, BMI, and parity as significant predictors of reduced BMD.
Conclusion:
Menopause significantly impacts bone health, with hormonal changes, inflammation, and anthropometric factors contributing to BMD decline. Early identification of modifiable risk factors, such as high BMI, low education levels, and multiparity, is crucial for implementing targeted interventions. These findings emphasize the need for preventive strategies, including lifestyle modifications and early screening, to mitigate bone loss and its associated health risks in postmenopausal women.
What This Paper Adds
This paper comprehensively analyzes the impact of menopausal transition and postmenopausal status on bone mineral density (BMD) of Pakistani Asian women.
Identifies significant biochemical, anthropometric, and lifestyle factors associated with BMD decline (BMI, inflammation markers, and education).
Highlights the predictive role of waist-to-hip ratio, BMI, and parity in assessing the risk of reduced BMD in postmenopausal women.
Applications of Study Findings
Supports the need for early identification of women at risk for osteoporosis, especially those with high BMI, low education, and multiparity.
Emphasizes the importance of addressing modifiable risk factors such as BMI and inflammation in gerontological practice to prevent bone loss.
Inform policy and research aimed at developing targeted interventions to improve bone health during and after menopause, potentially reducing the burden of osteoporosis.
Introduction
Perimenopause or the transitional phase of menopause is a critical period of almost 4 years in a woman’s life that begins from the last 3 years of reproductive age and ends after 1 year of amenorrhea (Delamater & Santoro, 2018; Santoro, 2016). The World Health Organization (WHO) has defined natural menopause as 12 continuous months of amenorrhea that is not related to surgery or any other cause. Natural menopause occurs at almost 51 years of age in industrialized countries and 48 years in developing countries (Ji & Yu, 2015). Postmenopausal osteoporosis (PMOP), as defined by WHO, is decreased bone mineral density (BMD), decreased tissue remodeling, and structural decline of bone due to menopause-associated estrogen deficiency (Akkawi & Zmerly, 2018; Franic & Verdenik, 2018).
The estimated global prevalence of osteoporosis in women older than 50 years of age is 31.8% (Choi et al., 2021; Tian et al., 2017), that is expected to rise by the year 2050, with an incidence of 6 million, and three-fourth of this will be in developing countries (Ji & Yu, 2015). International Osteoporosis Foundation in 2009 reported 7.2 million Pakistani women are suffering from osteoporosis, and it is estimated to rise by 12.91 million in 2050 (Mithal et al., 2014). The prevalence of PMOP was found to be 6.7% in Karachi (A. H. Khan et al., 2018; Baig et al., 2009). A study in Lahore reported an 18.6% prevalence of osteoporosis (Habib et al., 2015). Despite the high prevalence of osteoporosis in Pakistan, multiple socioeconomic and cultural factors contribute to poor bone health and inadequate prevention strategies. These include insufficient vitamin D and calcium in diet, limited opportunities for outdoor mobility and exercise, high parity, inadequate healthcare access, and screening.
Menopause is associated with primary ovarian failure due to apoptosis or inflammation with advancing age (Santoro et al., 2021). This results in a decline in ovarian hormones, particularly estrogen (E2; WHO, 2022). E2 enhances the mesenchymal stem cell (MSC) differentiation into osteoblasts (OB) and prevents the formation of osteoclasts (OC), thus limiting bone resorption and increasing bone formation (Noirrit-Esclassan et al., 2021). Reduced levels of E2 lead to a decline in osteo-anabolic effects, hence promoting bone resorption (Fischer & Haffner-Luntzer, 2022; Wu et al., 2021; Figure 1). Bone loss typically begins in men and women between the ages of 30 and 40. In women, bone mass and density may decline significantly within the first year after menopause. Around 10 years post-menopause, the accelerated bone loss stabilizes and merges with the gradual, age-related loss of muscle mass. The menopausal transition, or perimenopause, is divided into two phases: the early phase, characterized by mostly regular menstrual cycles with occasional irregularities, and the late phase, marked by extended periods of amenorrhea lasting at least 60 days until the final menstrual period (FMP; Charde et al., 2023).
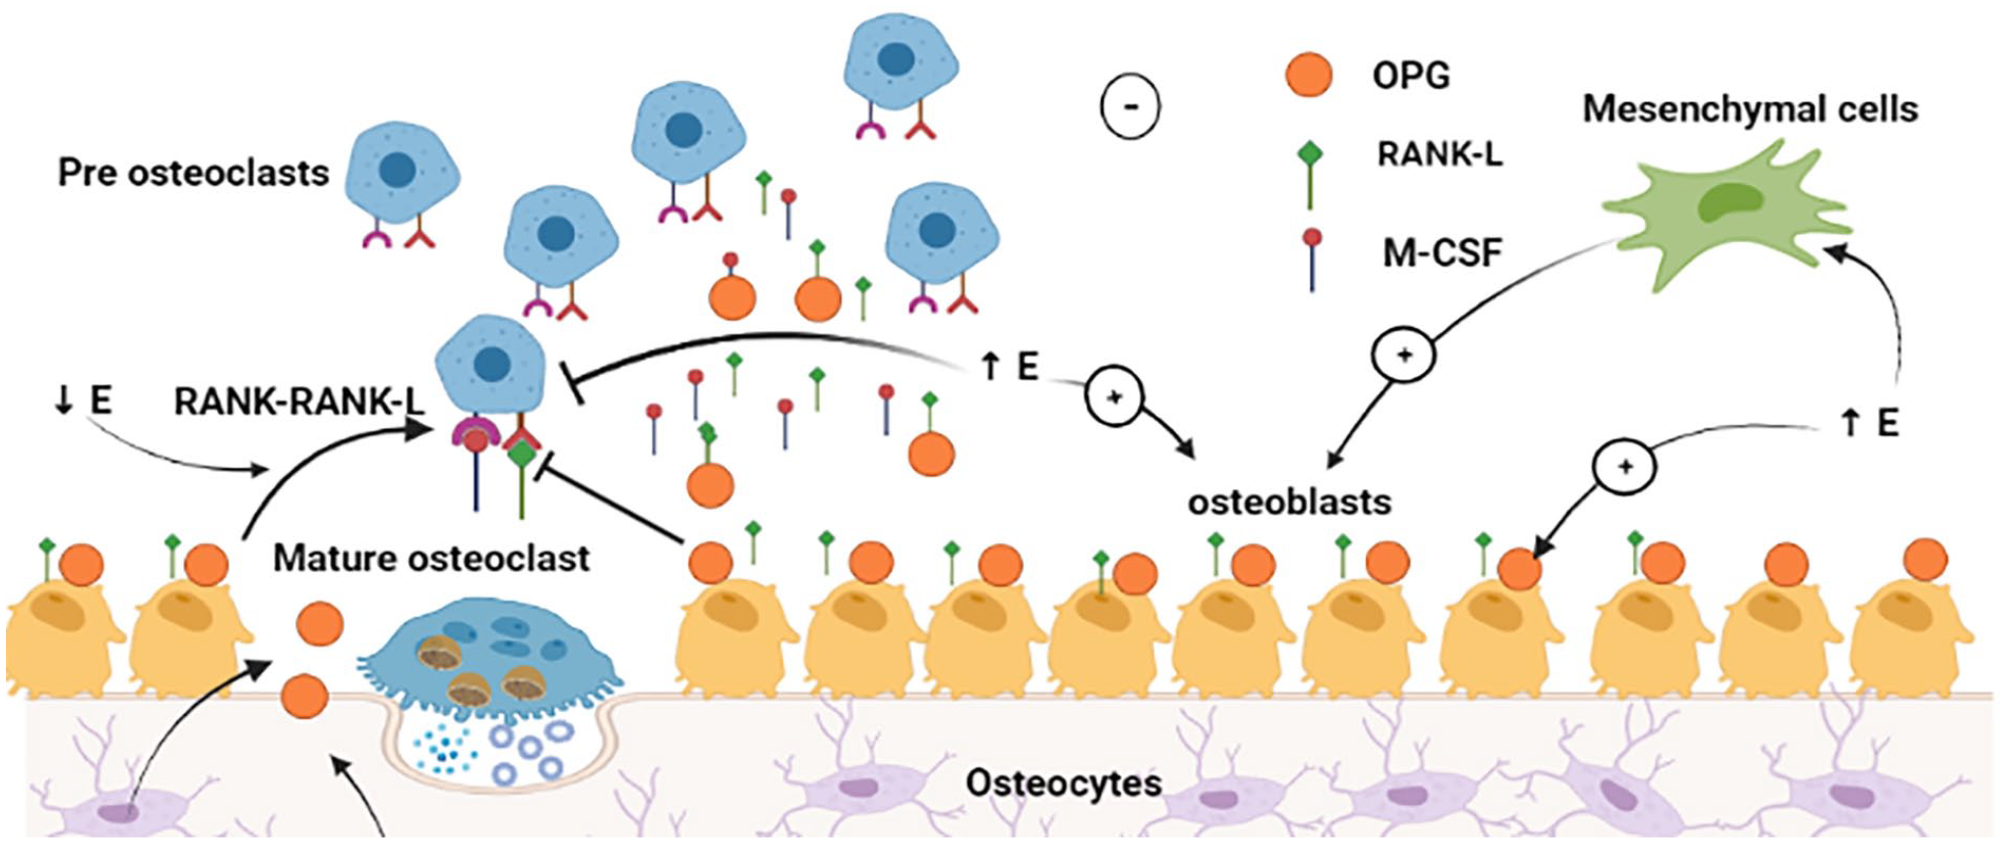
Role of estrogen in bone formation and bone resorption. E stimulates the mesenchymal cells to produce osteoblasts and causes the maturation of osteoblasts. Mature osteoblasts produce OPG, RANK-L, and M-CSF. OPG is a decoy receptor for RANK-L. High E levels stimulate this process while low E levels decline OPG action on RANK-L and hence, RANK-RANK-L interaction occurs that leads to osteoclastogenesis and bone resorption.
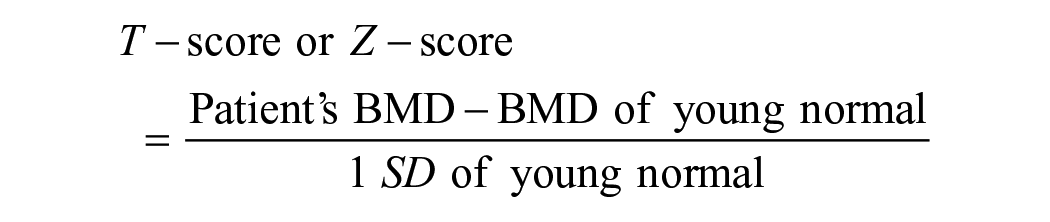
Dual X-ray absorptiometry (DXA) is the gold standard for diagnosing osteoporosis, but due to limited resources, DXA is not routinely carried out in Pakistan. A cheap, radiation-free, and almost equally effective device, quantitative ultrasound measurement (QUS), has been used for the diagnosis of osteoporosis in developing countries like Pakistan (Nguyen et al., 2021; Li et al., 2022). Postmenopausal women having a T-score of ≤−2.5 and premenopausal women with a Z-score of ≤−2.5 are considered to be osteoporotic (Akkawi & Zmerly, 2018; Ji & Yu, 2015; Sheu & Diamond, 2016; WHO, 1994). Recommended sites for measuring BMD in gm/cm2 with QUS are either the proximal phalangeal diaphysis of the hand or the calcaneum (Li et al., 2022; Nguyen et al., 2021).
The following formula is used for the calculation of the T-score or Z-score and BMD in gm/cm2 is interpreted as below:

The primary risk factor for OP is aging, however, other factors such as genetics, smoking, hormonal imbalances, sedentary lifestyle, and decreased calcium and vitamin D levels also play a vital role in the development of this disease (Fatima et al., 2025).
While previous studies have investigated osteoporosis risk factors in Pakistani women, most have focused on vitamin D deficiency or postmenopausal status as isolated variables. However, the combined effect of multiple biochemical, inflammatory, and lifestyle factors on BMD has not been explored in detail. This study is one of the first in Pakistan to examine the interaction between inflammatory cytokines (IL-6, CRP), hormonal regulators (estrogen, FSH, OPG, RANK-L), and lifestyle factors (BMI, parity, education, and waist-to-hip ratio) to BMD decline. By addressing this knowledge gap, our research provides critical data for developing early screening and prevention strategies for osteoporosis in Pakistani women.
The study aims to determine the menopause-related changes in the bone mineral density of Pakistani women and its possible association with estrogen and osteoprotegrin levels, as scarce data on the Pakistani population regarding bone mineral density in females is available. We will also explore the role of altered estrogen levels and variable demographics on bone mineral density by accounting for the influence of age and BMI as a potential confounding factor. To achieve this, the study was designed to investigate and compare bone mineral density, serum estrogen levels, osteoprotegerin, FSH, RANK-L, Vitamin D, IL-6, and C-RP levels in early and late postmenopausal women against a perimenopausal control group (Figure 2).

A flow chart showing the methodology workflow. *indicates patient recruitment protocol given in the left sided box starting with *.
Objectives
To measure and compare bone mineral density (BMD) among early and late postmenopausal women, as well as their respective early and late menopausal transition (MPT) controls, using quantitative ultrasound (QUS) assessment in Pakistani Population.
To analyze the correlation between BMD and demographic variables (age, BMI, parity, education level), menopausal status, and biochemical markers of bone metabolism, including estrogen, osteoprotegerin (OPG), receptor activator of nuclear factor kappa-Β ligand (RANK-L), vitamin D, C-reactive protein (CRP), interleukin-6 (IL-6), and follicle-stimulating hormone (FSH) of Pakistani Population.
To identify key independent predictors of BMD decline using regression modeling, assessing the impact of modifiable and non-modifiable factors such as central adiposity (waist-to-hip ratio), inflammatory markers, hormonal changes, and lifestyle factors.
Methods
It was a cross-sectional study involving 632 females above 42 years of age from larger cities of Pakistan, Lahore, Multan, Karachi, Peshawar, and Quetta, including the Capital city, Islamabad.
Sample Selection
The estimated sample size by the WHO calculator was 543 females, by keeping a confidence interval of 98%, a margin of error of 5%, and a population proportion of 49.3% (A. H. Khan et al., 2018). However, after obtaining written informed consent, we recruited 632 females via non-probability convenience sampling. Participants were divided into two equal groups, postmenopausal women (PM, n = 316) and women with menopausal transition (MPT)/perimenopausal (n = 316), based on menopause status, serum FSH, and estrogen levels. MPT and PM women were further divided into early and late stages with an equal number of women, based on Stages of Reproductive Aging Workshop (STAW) staging (Soules et al., 2001). According to the STRAW staging, adult women undergo three phases of life: reproductive, menopausal transition/perimenopause (MPT), and post-menopause (PM). The menopausal transition is Stage-2 (early, with a ≥7-day difference in length of the consecutive menstrual cycles.) and Stage-1 (late, with onset of skipped cycles or amenorrhea of ≥60 days), and similarly postmenopausal phase, with stages +1 (early, 2–6 years after menopause, i.e., 48–53 years old Pakistani women) and +2 (late, remaining years of life, i.e., Pakistani women of 54 years and above; Harlow et al., 2012; Ji & Yu, 2015; Soules et al., 2001).
Inclusion Criteria for Women With Menopausal Transition/Perimenopausal Women (MPT)
Women of 42 to 47 years of age (median range of Asian perimenopausal females according to WHO classification of menopausal status), still menstruating for the last 1 year which was further confirmed by estimation of serum FSH and estrogen levels and patients who were not in range of perimenopausal transition levels of FSH and estrogen were excluded, and new patients were recruited to their place. The cutoff value of serum FSH was taken as 30 mIU/ml and of estradiol below 20 pg/ml. These women were further divided into two groups with STRAW staging into early (−2 STRAW stage) and late (−2 STAW stage) menopausal transition, with ≥7 in the length of the consecutive menstrual cycle and ≥60 days of amenorrhea, respectively (Figure 3).

(a) Measurement of bone mineral density by quantitative ultrasound scan Sonost 3,000. (b) Bone mineral density of the given subject in terms of Z/T score. The photograph is taken with the patient’s permission.
Inclusion Criteria for Postmenopausal Women (PM)
Women of ≥48 years of age, having natural menopause for at least 1 year, and presented with or without bone aches or a history of non-traumatic fractures. Postmenopausal women were further divided into early (+1a, +1b, +1c STAW stage) and late menopause (+2 STRAW stage) with 2 to 6 years of menopause and remaining life, respectively.
Exclusion Criteria for Perimenopausal and Postmenopausal Women
All the patients meeting any of the following criteria were excluded from the study. Patients who were known cases of osteoporosis, women with a history of type I/II or gestational diabetes, renal failure, rheumatoid arthritis, and carcinoma, pregnant women, women with altered calcium, phosphorous, parathyroid hormone, vitamin D absorption, and excretion, or women with a history of use of antioxidants, vitamin D, Calcium, or steroid intake or hormone replacement therapy in the last 2 years.
Informed Consent
Written informed consent was obtained from each research participant according to the Declaration of Helsinki.
Data Collection Procedure
Sociodemographic details, parity, status of menopause, employment status, blood pressure, body mass index, waist and Hip circumferences, and bone mineral density were recorded on a questionnaire-based study proforma.
Protocol for All Research Participants
Body weight, height, waist-to-hip circumference, and blood pressure were measured using standard methods. Height in meters (m) was measured with a wall-mounted stadiometer, and weight in kilograms (kg) was determined with an automatic weighing machine. Systolic and diastolic blood pressures were measured with a Mercury sphygmomanometer.

Severely underweight BMI < 16.5 kg/m2
Underweight BMI < 18.5 kg/m2
Normal weight BMI ≥ 18.5 to 22.9 kg/m2
Overweight BMI between 23 and 24.9 kg/m2
Obesity BMI > 25 to 29.9 kg/m2
Morbidly obese BMI ≥ 30 kg/m2
Blood samples in serum separator tubes were allowed to stand at room temperature for 30 min before centrifugation. Serum separator tubes were centrifuged with the help of the centrifuge machine (EBA 20 Hettich) at a speed of 1,000×g (1,800 rpm) for 30 min. After 30 min of centrifugation of serum separator tubes, the serum was taken out with the help of Yellow tips mounted on a micropipette (SANCH 0–100 µl), aliquots were made and labeled with participants’ ID, and frozen at −20°C till further analysis.
Biochemical Parameters
Estrogen, OPG, and RANK-L were measured with commercially available ELISA kits manufactured by Bioassay Technology Laboratory, Shanghai, China. Estrogen: Cat. No E1008Hu, Standard Curve Range:10 to 2,000 ng/l and Sensitivity of 5.04 ng/l.
Osteoprotegerin: Cat. No E1558Hu Standard Curve Range: 0.05 to 15 ng/ml and Sensitivity of 0.023 ng/ml. RANK-L: Cat. No E0620Hu, Standard Curve Range: 0.074 to 22.22 pmol/l, and Sensitivity of 0.0456 pmol/l. FSH and IL-6 were estimated with ELISA kits (ELabScience). FSH: Cat No E-EL-H1143, Standard Curve Range: 1.56 to 100 mIU/ml and a Sensitivity of 0.94 mIU/ml. IL-6: Cat No: E-HSEL-H0003, Standard Curve Range: 0.78 to 50 pg/ml and Sensitivity of 0.49 pg/ml. Vitamin D and C-reactive protein levels were estimated with the chemiluminescence method and Turbidimetric immunoassay.
Data Analysis
Data was analyzed with SPSS version 23.0. The normality of data was analyzed with the Shapiro-Wilk test. Quantitative variables were expressed as Mean ± Standard deviation and qualitative variables as frequency and percentages. The mean difference across the groups was assessed by one-way analysis of variance (ANOVA) followed by post hoc Tukey’s test. Pearson correlation was applied to explore relationships between BMD and continuous variables. Multivariate logistic regression was applied with the backward elimination method to determine hormonal factors’ influence on BMD and identify independent predictors of decreased BMD. Variables included demographic data (Age, BMI, waist-to-hip ratio, and education level, as these are established risk factors for osteoporosis), biochemical markers (Estrogen, FSH, OPG, and RANK-L, given their critical role in bone metabolism and menopausal changes), Inflammatory markers (IL-6 and CRP, as chronic inflammation is known to contribute to bone loss), and Lifestyle and reproductive factors (Parity and physical activity, since multiparity and sedentary lifestyles have been associated with lower BMD) were initially included in the model based on clinical relevance and statistical significance in univariate analysis (p < .05). Non-significant variables (p > .05) were removed stepwise to refine the final predictive model.
Confounders, including BMI, parity, education, inflammatory markers (IL-6, CRP), and hormonal levels (FSH, estrogen, OPG, and RANK-L), were adjusted for in the regression models. Bonferroni correction was applied where necessary to account for multiple comparisons and reduce Type I errors. The p-value of <.05 was considered statistically significant.
Results
In the present study, 632 women, based on the presence or absence of menopause, were included (316 Menopausal transition/perimenopausal and 316 postmenopausal women).
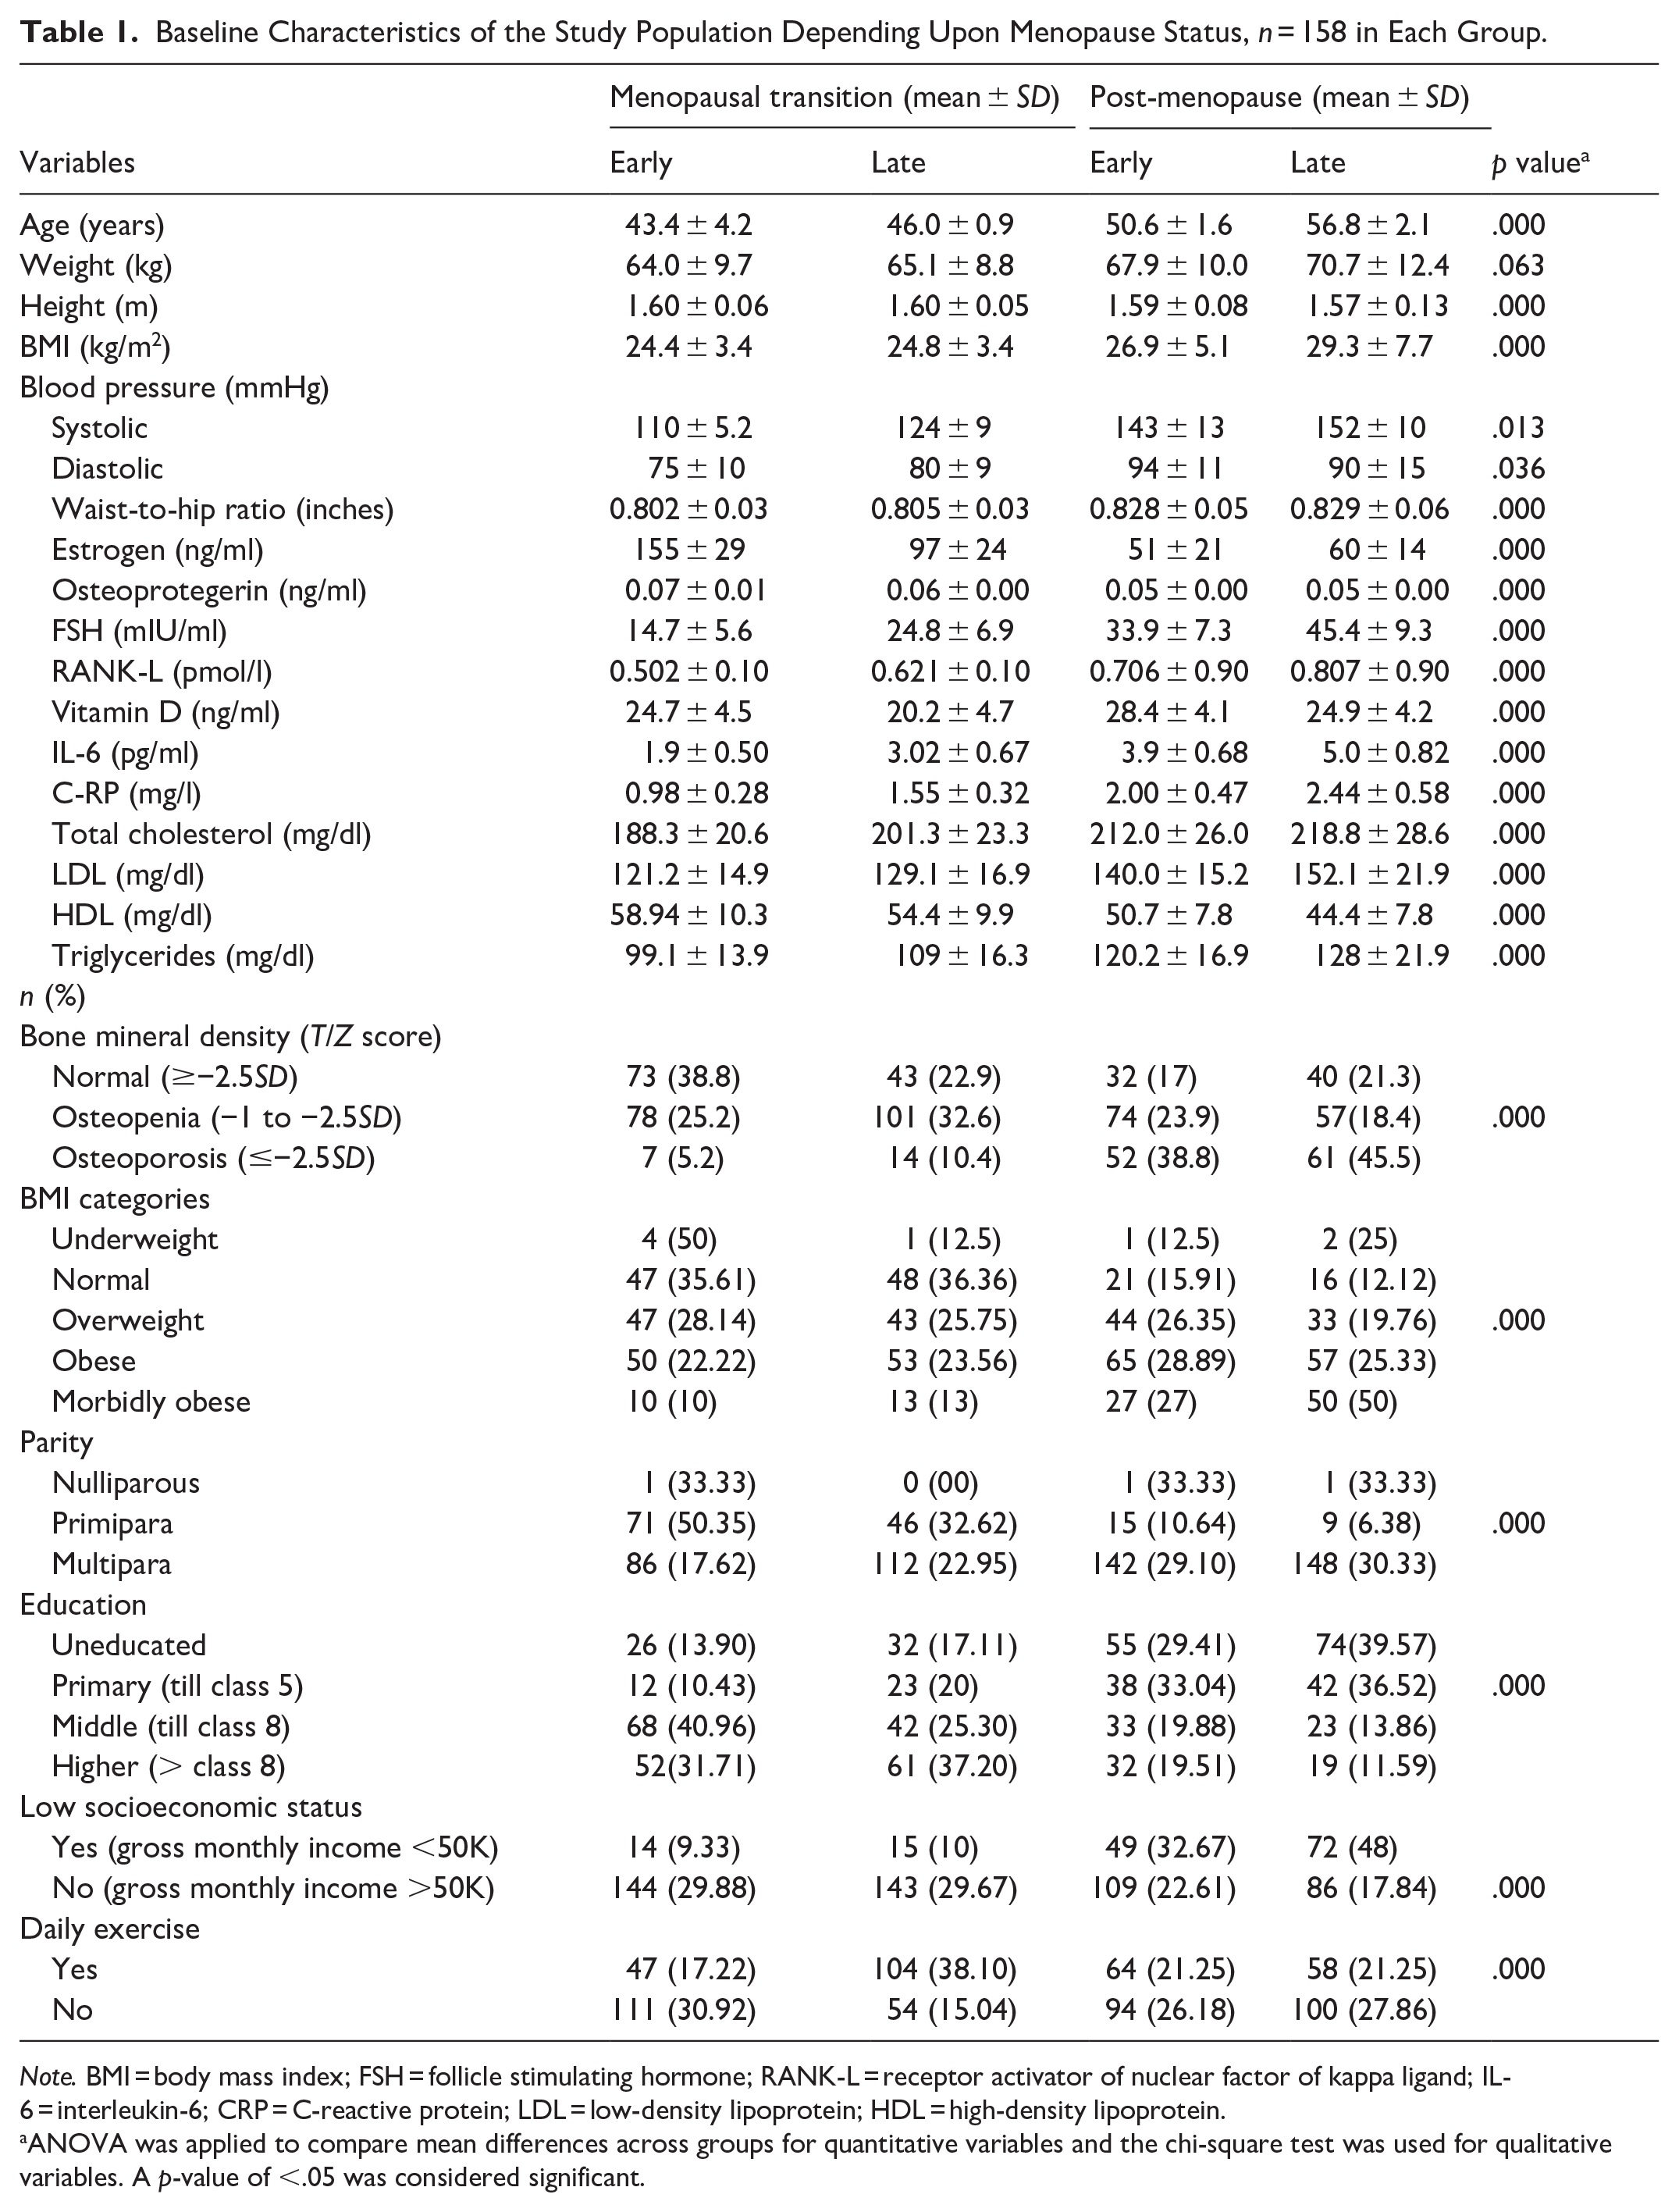
Table 1 shows descriptive statistics, including mean differences and frequency percentages as determined by ANOVA and the Chi-square test. Table 2 presents the intergroup comparison of study variables after applying post hoc Turkey’s test.
Baseline Characteristics of the Study Population Depending Upon Menopause Status, n = 158 in Each Group.
Note. BMI = body mass index; FSH = follicle stimulating hormone; RANK-L = receptor activator of nuclear factor of kappa ligand; IL-6 = interleukin-6; CRP = C-reactive protein; LDL = low-density lipoprotein; HDL = high-density lipoprotein.
ANOVA was applied to compare mean differences across groups for quantitative variables and the chi-square test was used for qualitative variables. A p-value of <.05 was considered significant.
Comparison of Variables Among Different Study Groups.
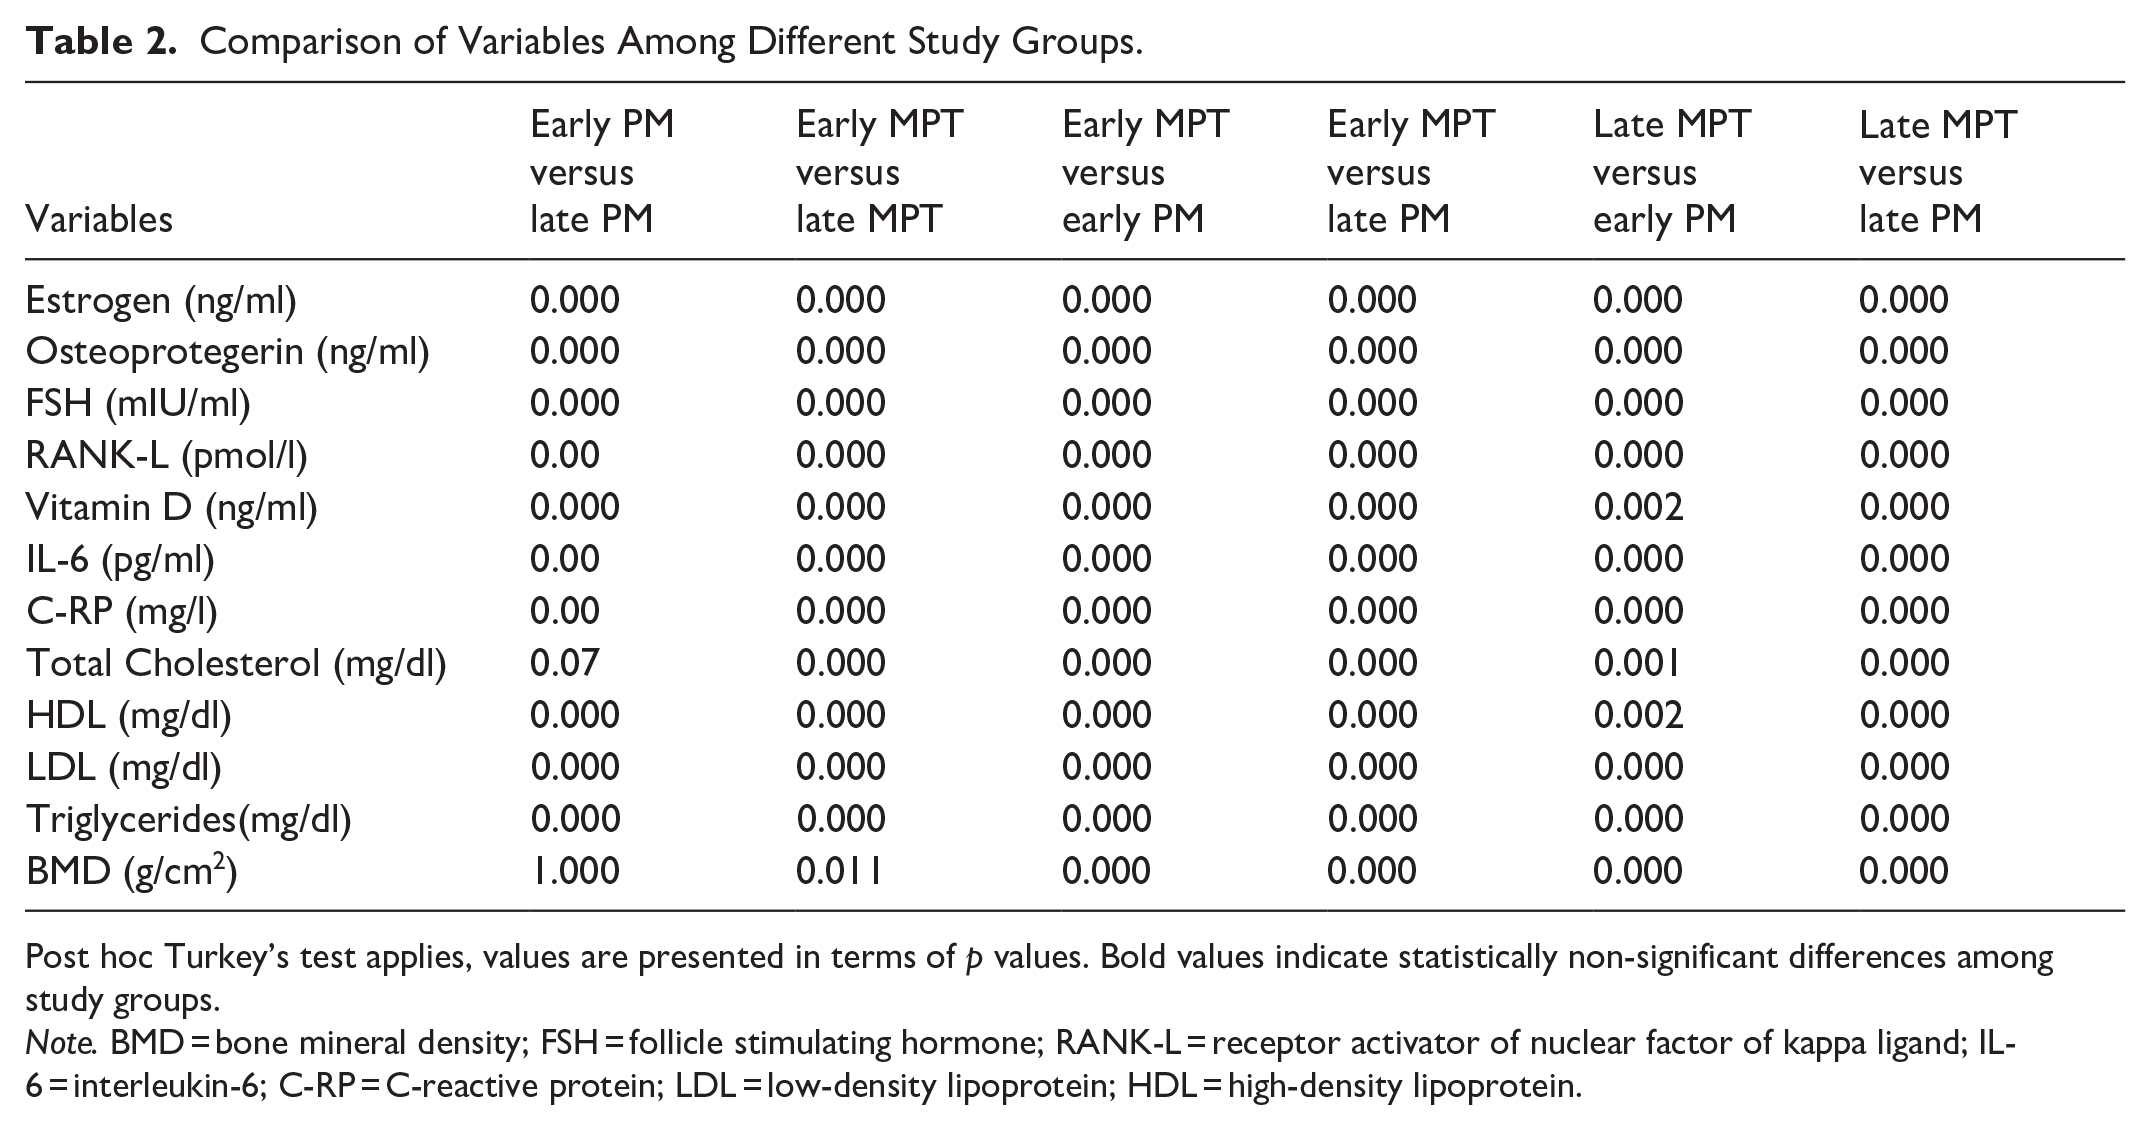
Post hoc Turkey’s test applies, values are presented in terms of p values. Bold values indicate statistically non-significant differences among study groups.
Note. BMD = bone mineral density; FSH = follicle stimulating hormone; RANK-L = receptor activator of nuclear factor of kappa ligand; IL-6 = interleukin-6; C-RP = C-reactive protein; LDL = low-density lipoprotein; HDL = high-density lipoprotein.
Baseline Characteristics of the Study Population
BMI of late PM women was higher compared to MPT controls. The body weight of both groups was almost the same, though PM women were comparatively shorter in height compared to MPT women (Table 1). According to the Asian Pacific categorization of BMI, many late PM women were morbidly obese, however, the frequency of obesity was equally distributed in all groups. There was a significant association of BMI categories with the status of menopause (Table 1). PM women had significantly higher systolic and diastolic blood pressures compared to perimenopausal women (p < .05, Table 1).
Bone Mineral Density
The majority of research participants had osteopenia (49%), but the early MPT women had comparatively normal BMD compared to other groups. The frequency distribution of osteoporosis was 21.2% in the current study population. BMD was significantly associated with the status of menopause (p < .05, Table 1). The BMD of Early PM versus Late PM was not statistically different (p = 1.000); however, a statistically significant decrease in BMD of Early MPT versus Late MPT (p = .011), Early MPT versus Late PM (p = .000), and early MPT versus Late MPT (p = .000, Table 1). BMD has a significant inverse correlation with FSH, RANK-L, IL-6, CRP, advancing age, waist-to-hip ratio, BMI, and multiparity while a significant positive correlation with estrogen, OPG, and level of education (Table 3).
Correlation of a Bone Mineral Density with Study Variables in the Total Sample (n = 632).
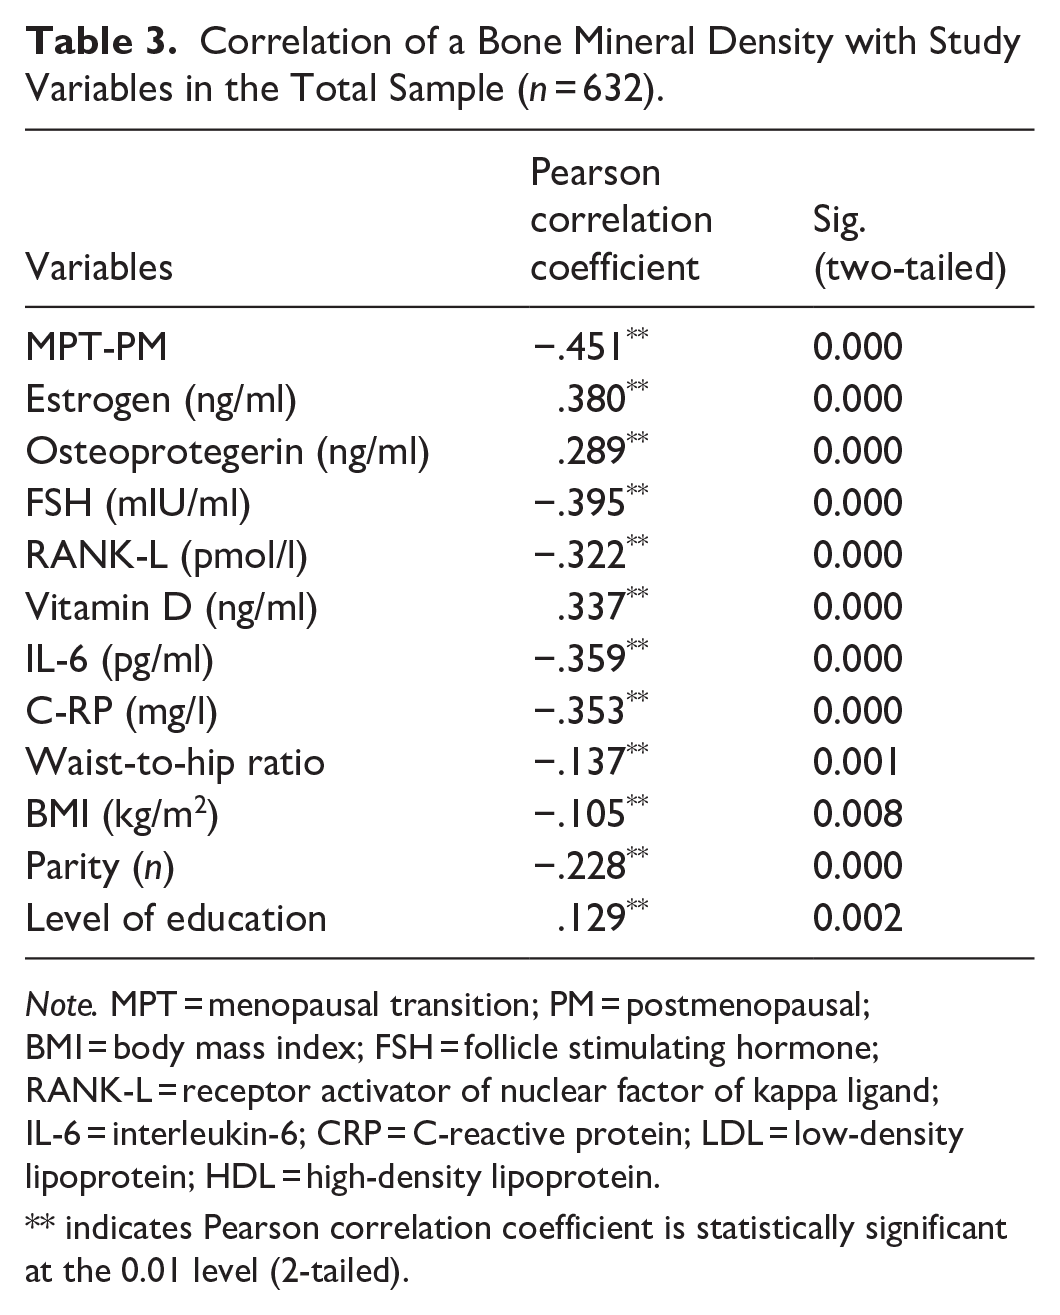
Note. MPT = menopausal transition; PM = postmenopausal; BMI = body mass index; FSH = follicle stimulating hormone; RANK-L = receptor activator of nuclear factor of kappa ligand; IL-6 = interleukin-6; CRP = C-reactive protein; LDL = low-density lipoprotein; HDL = high-density lipoprotein.
indicates Pearson correlation coefficient is statistically significant at the 0.01 level (2-tailed).
Biochemical Parameters
All groups’ Mean estrogen levels were significantly higher than late PM women(p = .000), indicating its link to menopausal status. Serum levels of OPG were significantly less in early and late PM (p < .000) compared to MPT controls. However, mean levels of OPG were not strangely different in early and late PM, which may suggest that a slight decline in its levels is sufficient for the initiation and progression of bone resorption. That supports the osteoprotective effect of both hormones. Mean FSH and RANK-L levels were significantly increased in order from early MPT (p = .000) to late PM (p = .000). Raised FSH levels are linked to the decrease in ovarian reserve, which is a hallmark of menopause, while raised RANK-L levels indicate increased osteoclastogenesis and, hence, bone resorption. Vitamin D levels were surprisingly raised in early PM women compared to their early and late MPT (p = .000, p = .002 respectively) and late PM (p = .000). These raised levels may be due to an injudicious use of vitamin D intake that the patient refused at the time of history or due to depleting calcium reserves in the body. Raised vitamin D levels are again indicative of the depletion of hydroxyapatite crystals from bone and, therefore, decreased bone strength. Mean levels of IL-6 and C-RP were also raised from early MPT to late PM groups with a significant difference (p = .000), which is suggestive of ongoing inflammation associated with bone turnover (Tables 1 and 2).
Correlation of Study Variables
There was an inverse significant correlation of BMD with the status of menopause (r = −.451, p = .000), BMI (r = −.105, p = .008), waist-to-hip ratio (r = −.137, p = .001), and multiparity (r = −.228, p = .000). When BMD was correlated with other quantitative variables in all the study population, a significantly positive correlation of BMD was observed with estrogen (r = .380, p = .000), OPG (r = .289, p = .000), vitamin D (r = .337, p = .000), level of education (r = .129, p = .002), and a significant inverse correlation with FSH (r = −.395, p = .000), RANK-L (r = −.322, p = .000), IL-6 (r = −.359, p = .000), and C-RP (r = −.353, p = .000, Table 3).
Regression Analysis
Table 4 presents the effect of waist-hip circumference ratio, parity, and education on bone mineral density by taking BMI and age as confounding factors.
Multiple Regression Analysis for Variables Associated With Changes in Bone Mineral Density in a Total Study Sample (n = 632).

After taking age and BMI as possible confounding agents, multiple regression analysis was conducted using the backward method.
The F-statistics of ANOVA were 65.009 with a p-value of .000. R2 = .723, adjusted R2 = .718.
Discussion
The present study included 632 women (158 early, 158 late menopausal transition/perimenopausal, 158 early, and 158 late postmenopausal women).
The average age of women with early and late MPT was 43.4 ± 4.2 46.0 ± 0.9 years, respectively. Early and late postmenopausal women had an average age of 50.6 ± 1.6 and 56.8 ± 2.1 years, respectively. The BMI of postmenopausal women was significantly higher compared to perimenopausal women, while no marked difference in the weight of all groups was observed. The significantly higher BMI of late postmenopausal women may be due to their comparatively shorter height and higher weight. The short height corresponds to the stooped posture of postmenopausal women compared to women with MPT.
The BMI of study participants was categorized according to Asia Pacific BMI categorization, The study found that the majority of postmenopausal women were morbidly obese (n = 50), and obesity was equally distributed among all groups. The results of BMI were consistent with the NCHS data brief 2020, that postmenopausal women suffer from severe obesity (Hales et al., 2020; Knight et al., 2021). A study by Fenton revealed a 78% prevalence of morbidly obese postmenopausal women in India (Fenton, 2021). A study in Pakistan reported a significantly higher BMI of postmenopausal women with a 29.6% prevalence of obesity. The same study found a significant difference among BMI categories, which was also consistent with the current study findings, though we employed the Asian Pacific categorization of BMI in the present study while the earlier study used the WHO classification of weight status for BMI. This suggests that, irrespective of classification systems, postmenopausal weight gain is a universal phenomenon influenced by hormonal and lifestyle factors rather than ethnic variations alone (Bibi et al., 2021). The implication of this trend is substantial, as higher BMI in postmenopausal women has been linked to an increased risk of osteoporosis and metabolic disturbances. Given that obesity-related inflammation is a known contributor to bone loss, future studies should explore targeted lifestyle interventions, including weight management programs tailored to menopausal status.
In the present study, bone mineral density was significantly decreased in postmenopausal women compared to women with MPT. Ethnic differences in bone loss patterns have been well documented, and our study contributes valuable data on the South Asian population. Research in the United States and Europe has shown that postmenopausal Caucasian and Asian women are at a higher risk for osteoporosis compared to African American women, who tend to have greater peak bone mass and slower rates of decline (Durdin et al., 2022). An International multiethnic cohort study demonstrated a rapid decline in BMD in the postmenopausal period as compared to the pre or perimenopausal period (Finkelstein et al., 2008). A study in India found decreased BMD in postmenopausal women compared to perimenopausal women (Svedha et al., 2017). Results of the current study are also supported by the findings of Qureshi et al. in Pakistan, that the BMD of postmenopausal women was significantly lower compared to perimenopausal women (Qureshi et al., 2011). The current study found a strong association between osteoporosis and the status of menopause. These findings were consistent with a study done in Peshawar, Pakistan, that revealed a significant correlation of BMD with menopause (A. W. Khan et al., 2020). The present study was different from the previous studies because peri and postmenopausal women were healthy and had no history of intake of antioxidants or any other supplement that could alter the BMD. While Quantitative Ultrasound (QUS) was used for BMD assessment due to its cost-effectiveness and accessibility, it is not the gold standard like Dual-Energy X-ray Absorptiometry (DXA). QUS primarily measures bone quality and elasticity rather than bone mineral content, which can lead to variability in osteoporosis diagnosis. Compared to DXA, QUS may underestimate or overestimate BMD values, potentially affecting the classification of osteopenia and osteoporosis. Although QUS has been validated in resource-limited settings, its limitations should be considered when interpreting results. Future studies should incorporate DXA-based validation of QUS readings or use DXA directly to ensure higher diagnostic precision and comparability with global osteoporosis research.
Our study is one of the few that examined the relationship between BMD and a broad panel of biochemical markers, including IL-6, CRP, OPG, and RANK-L. The observed correlation between inflammatory markers and osteoporosis supports the concept of inflammaging, a state of chronic low-grade inflammation that accelerates bone loss in postmenopausal women. IL-6 is known to enhance RANKL expression, stimulating osteoclast differentiation and leading to increased bone resorption. Elevated CRP levels have also been associated with greater fracture risk in postmenopausal women (AlQranei et al., 2020). These findings align with previous studies indicating that chronic low-grade inflammation contributes significantly to osteoporosis development, particularly in an estrogen-deficient state (Iantomasi et al., 2023). These findings suggest that inflammatory markers could be incorporated into osteoporosis risk assessment models, potentially improving early detection and intervention strategies.
Late and early postmenopausal women had significantly lower levels of OPG and estrogen compared to women with early or late MPT (p < .05). Previous data reports lower than normal OPG levels in normoglycemic postmenopausal women compared to perimenopausal women (Azizieh et al., 2019; Mashavi et al., 2017; Pandey et al., 2018). In contrast to the current study findings, research by Veshnavei reported significantly higher levels of serum OPG in postmenopausal women with osteoporosis (Veshnavei, 2022).
Serum estrogen levels were lower in order from the early MPT to the early postmenopausal group, but the late postmenopausal group had comparatively higher estrogen levels than the early postmenopausal group. Ovarian estrogen declines after menopause, which results in disturbed bone metabolism. However, Estrone (E1) is the primary form of estrogen in postmenopausal women, and the only source of Estradiol (E2) and E1 in postmenopausal women is the peripheral conversion of testosterone and androstenedione to E2 and E1, respectively (Richardson et al., 2020). Peripheral conversion also occurs in the adipose tissue (Richardson et al., 2020). Late postmenopausal women of the present study had a significantly higher BMI that could lead to raised estrogen levels. These findings support the previous literature on higher estrogen levels in females with greater BMI (Sriprasert et al., 2020). A study by B. Pardhe revealed lower levels of estrogen in postmenopausal women compared to perimenopausal women. This difference in results is because the majority of their study population had normal BMI, and their sample size was comparatively large (Pardhe et al., 2017).
Multiple regression analysis with the backward method has suggested a strong positive impact of the waist-to-hip ratio (β = 9.102, p = .000) on worsening of a decrease in bone mineral density, suggesting central adiposity as a significant risk factor, likely due to associated metabolic and inflammatory effects on bone health. Education status is inversely related to bone mineral density (β = −.065, p = .003), possibly due to increased awareness of health practices, better nutrition, and access to healthcare. Parity has a weak but significant positive impact on a decrease in bone mineral density (β = .033, p = .048); this could be due to the physiological and nutritional demands of pregnancy that might negatively affect bone health. Our regression analysis demonstrated that waist-to-hip ratio had a significant positive impact on BMD decline, suggesting that central adiposity is a key risk factor for osteoporosis. This finding is in line with research indicating that visceral fat is associated with increased inflammatory cytokines and bone loss.
The strengths of our study include the evaluation of a wide range of variables, including biochemical markers, anthropometric measurements, and lifestyle factors, providing a holistic understanding of factors affecting BMD by controlling confounders like BMI and age. The study also highlights actionable factors like BMI, parity, and education, paving the way for targeted interventions to mitigate bone loss. The study specifically addresses the Asian population, where regional and cultural factors may influence bone health, contributing valuable localized insights.
Conclusion
This study analyzed the impact of menopause on bone mineral density (BMD) and related factors in 632 women, equally divided into menopausal transition (MPT) and postmenopausal (PM) groups. PM women exhibited higher BMI and blood pressure and a greater prevalence of obesity. Osteopenia was the most common condition (49%), with osteoporosis affecting 21.2%. BMD declined significantly from early MPT to late PM, correlating inversely with FSH, RANK-L, IL-6, CRP, BMI, and parity while positively associated with estrogen, OPG, vitamin D, and education. Hormonal declines and inflammation were key contributors to bone loss, exacerbated by higher waist-to-hip ratios and multiparity.
This study employs a cross-sectional design, which inherently limits the ability to establish causality between menopause and changes in BMD. While significant associations were observed, it cannot be definitively concluded that menopause directly causes BMD loss. Longitudinal studies that track bone health changes over time are needed to confirm these findings and establish causation. Additionally, the convenience sampling method may affect the generalizability of the findings, and a more diverse, randomized sample should be considered in future research. Interventional studies could help determine whether modifiable risk factors, such as inflammation and BMI, play a mediating role in osteoporosis development.
While QUS was used as a cost-effective alternative for BMD assessment, it is not the gold standard like DXA. Future studies should incorporate DXA for more precise measurements and validation. These results highlight the importance of early screening and interventions to mitigate osteoporosis risk in menopausal women.
Recommendations
A major transition in BMD occurs in the late menopausal transition to the late postmenopausal period, so during this period, attention should be paid to antioxidant supplements, weight reduction, good nutrition, and lifestyle modifications.
Footnotes
Ethical Considerations
This cross-sectional study was conducted according to STROBE guidelines (von Elm et al., 2007). The study setting was the Physiology Department, Shalamar Medical and Dental College in collaboration with NUST College of Electrical and Mechanical Engineering. After obtaining ethical approval from the affiliated institutional ethical committees (SMDC: IRB No. 0430, Approval no: 2024-IRB-A-32/32, respectively), patients were selected through non-probability convenient sampling.
Author Contributions
Funding
The author(s) disclosed receipt of the following financial support for the research, authorship, and/or publication of this article: This study was self-funded
Declaration of Conflicting Interests
The author(s) declared no potential conflicts of interest with respect to the research, authorship, funding, and/or publication of this article.