
Abstract
Background:
Accurate week-ahead forecasts of continuous glucose monitoring (CGM)–derived metrics could enable proactive diabetes management, but relative performance of modern tabular learning approaches is incompletely defined.
Methods:
We trained and internally validated four regression models (CatBoost, XGBoost, AutoGluon, tabPFN) to predict 6-week-ahead CGM metrics (time-in-range [TIR], time-in-tight-range [TITR], time-above-range [TAR], time-below-range [TBR], coefficient of variation, Mean Amplitude of Glycemic Excursions [MAGE], and related quantiles) using 4622 case-weeks from two cohorts (T1DM, n = 3389; T2DM, n = 1233). Performance was assessed with mean absolute error (MAE) and mean absolute relative difference (MARD); quantile classification was summarized via confusion-matrix heatmaps.
Results:
Across T1DM and T2DM, all models produced broadly comparable performance for most targets. For T1DM, MARD for TIR, TITR, TAR, and MAGE ranged 8.5%–16.5% while TBR showed large MARD (mean ≈48%) despite low MAE. AutoGluon and tabPFN showed lower MAE than XGBoost for several targets (e.g., TITR: P < 0.01; TAR/TBR: P < 0.05–0.01). For T2DM, MARD ranged 7.8%–23.9%, and TBR relative error was ≈78%; tabPFN outperformed other models for TIR (P < 0.01), and AutoGluon/tabPFN outperformed CatBoost/XGBoost on TAR (P < 0.05). Inference time per 1000 cases varied markedly (PFN 699 s; AG 2.7 s; CatBoost 0.04 s, XGBoost 0.04 s).
Conclusions:
Week-ahead CGM metrics are predictable with reasonable accuracy using modern tabular models, but low-prevalence hypoglycemia remains difficult to predict in relative terms. Advanced automated machine learning and foundation models yield modest accuracy gains at substantially higher computational cost. External validation is required before these tools can be considered ready for clinical implementation.
Keywords
Introduction
Metrics on glycemic control derived from continuous glucose monitoring (CGM) predict all-cause mortality and development of complications.1–4 Furthermore, the use of CGM has enabled the development of personalized prediction models capable of forecasting short-term glycemic outcomes5–7 and complications such as gastroparesis and elevated ketone bodies.8–10 In individuals with type 1 diabetes (T1DM), several studies have demonstrated the feasibility of weekly forecasting of clinically relevant metrics such as excessive hypoglycemia, hyperglycemia, and glycemic variability.11–13 While the majority of forecasting research has focused on type 1 diabetes, there is increasing recognition of the potential benefits of CGM in type 2 diabetes (T2DM). 14 Intermittent and continuous CGM use is becoming more widespread in this population, and availability is expected to grow significantly in the coming decade. 15
Accurate glycemic forecasting enables a shift from reactive to proactive diabetes care, which can support earlier interventions and more personalized treatment adjustments.16,17 In this context, prediction models that can forecast glycemic control over longer-periods, such as the upcoming week, are valuable, both for clinical decision-making and for empowering patients in their self-management. However, the applicability and performance of such models in individuals with type 2 diabetes remain underexplored. Moreover, the investigation of prediction-precise weekly glycemic control metrics using a regression approach has not been utilized in either type 1 or type 2 diabetes.
Recent advances in machine learning have introduced new modeling approaches that may offer improved predictive performance. 18 One such model is Tabular Prior-data Fitted Network (TabPFN), 19 a transformer-based architecture designed specifically for tabular data. TabPFN has been shown to outperform machine learning techniques, such as ensemble, 20 statistical, and Extreme gradient boosting (XGBoost) models, across a variety of prediction tasks. Despite these promising results, it remains unclear whether deep neural models like TabPFN can provide meaningful improvements in forecasting glycemic outcomes.
This study aims to evaluate and compare the performance of traditional models, ensemble machine learning approaches, and foundation model for weekly forecasting of glycemic control in individuals with type 1 and type 2 diabetes using CGM data. By identifying the most accurate and reliable modeling strategies, we seek to showcase the potential of a personalized, data-driven tool for diabetes management.
Methods
Data material
We developed, trained, and internally validated prediction models using CGM data from two clinical trials, The DiaMonT trial21,22 and The Insulin-Only Bionic Pancreas Pivotal Trial (IOBP2) (NCT04200313) [14], to estimate the glycemic control (glycemic metrics) in the subsequent weeks.
The DiaMonT trial was a randomized controlled trial evaluating the effectiveness and safety of telemonitoring versus standard care in individuals with type 2 diabetes (T2D) receiving insulin therapy. A total of 331 participants with type 2 diabetes were enrolled (telemonitoring: n = 166; standard care: n = 165). The intervention group used CGM (Dexcom G6), a connected insulin pen, an activity tracker, and smartphone applications for 3 months. The cohort had a mean age of 61.3 (SD 10.6) years, 61.6% were male, with a median diabetes duration of 16.0 (interquartile range [IQR] 12.0) years, and a mean hemoglobin A1c (HbA1c) of 8.01% (SD 1.32)/64.0 (SD 14.4) mmol/mol.
The IOBP2 trial was a multicenter, randomized controlled trial evaluating an at-home closed-loop system against the standard of care. The study population included individuals with type 1 diabetes (T1D) aged 6–79 years. Participants were assigned to either the intervention group, which used the Dexcom G6 CGM system integrated with the iLet Bionic Pancreas for insulin delivery (n = 219), or the control group receiving standard care and CGM (n = 107). The intervention period lasted up to 13 weeks. Overall, 45% of participants were female, the mean HbA1c was 7.8% (SD 1.2), and 89% were CGM users prior to enrollment.
For model development, we included all participants with eligible CGM data. Each prediction case comprised two consecutive weeks with ≥70% CGM coverage. Features from the first week were used to predict outcomes in the second week. Participants without eligible cases were excluded. Data were split into training (70%) and test (30%) sets at the individual level to ensure that no participant contributed to both datasets. The general approach for the methodology is illustrated in Figure 1.

Schematic overview of the methodological approach. Continuous glucose monitoring (CGM) profiles from individuals with type 1 and type 2 diabetes were split into training (70%) and test (30%) datasets. Prediction models (tabPFN, CatBoost, AutoGluon, and XGBoost) were trained using cross-validation to forecast next-week glycemic control metrics. The models targeted included time-in-ranges such as hypoglycemia, hyperglycemia, and glucose variability outcomes. Final models were evaluated on the test set through internal validation, with performance assessed using correlation, error metrics, and visualization techniques. tabPFN, Tabular Prior-data Fitted Network.
Prediction targets
Clinical targets for CGM data interpretations are recommending the assessment of time-in-range (TIR), time-above-range (TAR), time-below-range (TBR), and glycemic variability. 23 Hence, based on this recommendation and newer studies,4,25 we selected prediction targets, Table 1, related to time-in-ranges and metrics describing different types of glycemic variability:
Definitions and Computation Rules for Glycemic Prediction Targets

TIR: percentage of time fraction spent at glucose levels 70–180 mg/dl
Time-in-tight-range (TITR) 24 : Percentage of time within a narrower target range (70–140 mg/dL), reflecting tighter glucose control.
TAR: percentage of time fraction spent at glucose levels above 180 mg/dl
TBR: percentage of time fraction spent at glucose levels below 70 mg/dl
Coefficient of variation (CV): The standard deviation normalized by the mean, expressed as a percentage.
Mean Amplitude of Glycemic Excursions (MAGE): 26 MAGE captures the average magnitude of significant glucose swings, both increases and decreases, by focusing on excursions that exceed one standard deviation from the mean. It is a widely used indicator of glycemic variability and the likelihood of large glucose fluctuations.
For each case, prediction targets were calculated for the second week.
Predictors and Feature Engineering
Prediction of the glycemic outcomes in week two was based on features calculated from CGM data collected during week one for each participant. To derive these features, we employed the open-source MATLAB toolbox Quantification of Continuous Glucose Monitoring (QoCGM), 27 which enables comprehensive analysis of CGM profiles. This approach captures a broad spectrum of information from the glucose traces with potential predictive value.
The derived features encompassed:
Basic descriptive statistics TIR metrics Glycemic risk indicators Glycemic variability measures (short-, medium-, and long-term) Glycemic control indicators Entropy and complexity measures
In total, 68 features were generated from the first-week CGM data (see Table 2). Detailed descriptions of the feature calculations are available in the original publication. 27 To ensure adequate data quality, only cases with ≥70% CGM coverage were included. Missing data segments were not imputed, in accordance with prior findings suggesting this approach is preferable. 28
Presents the CGM Features Calculated Using QoCGM, along with Brief Descriptions.
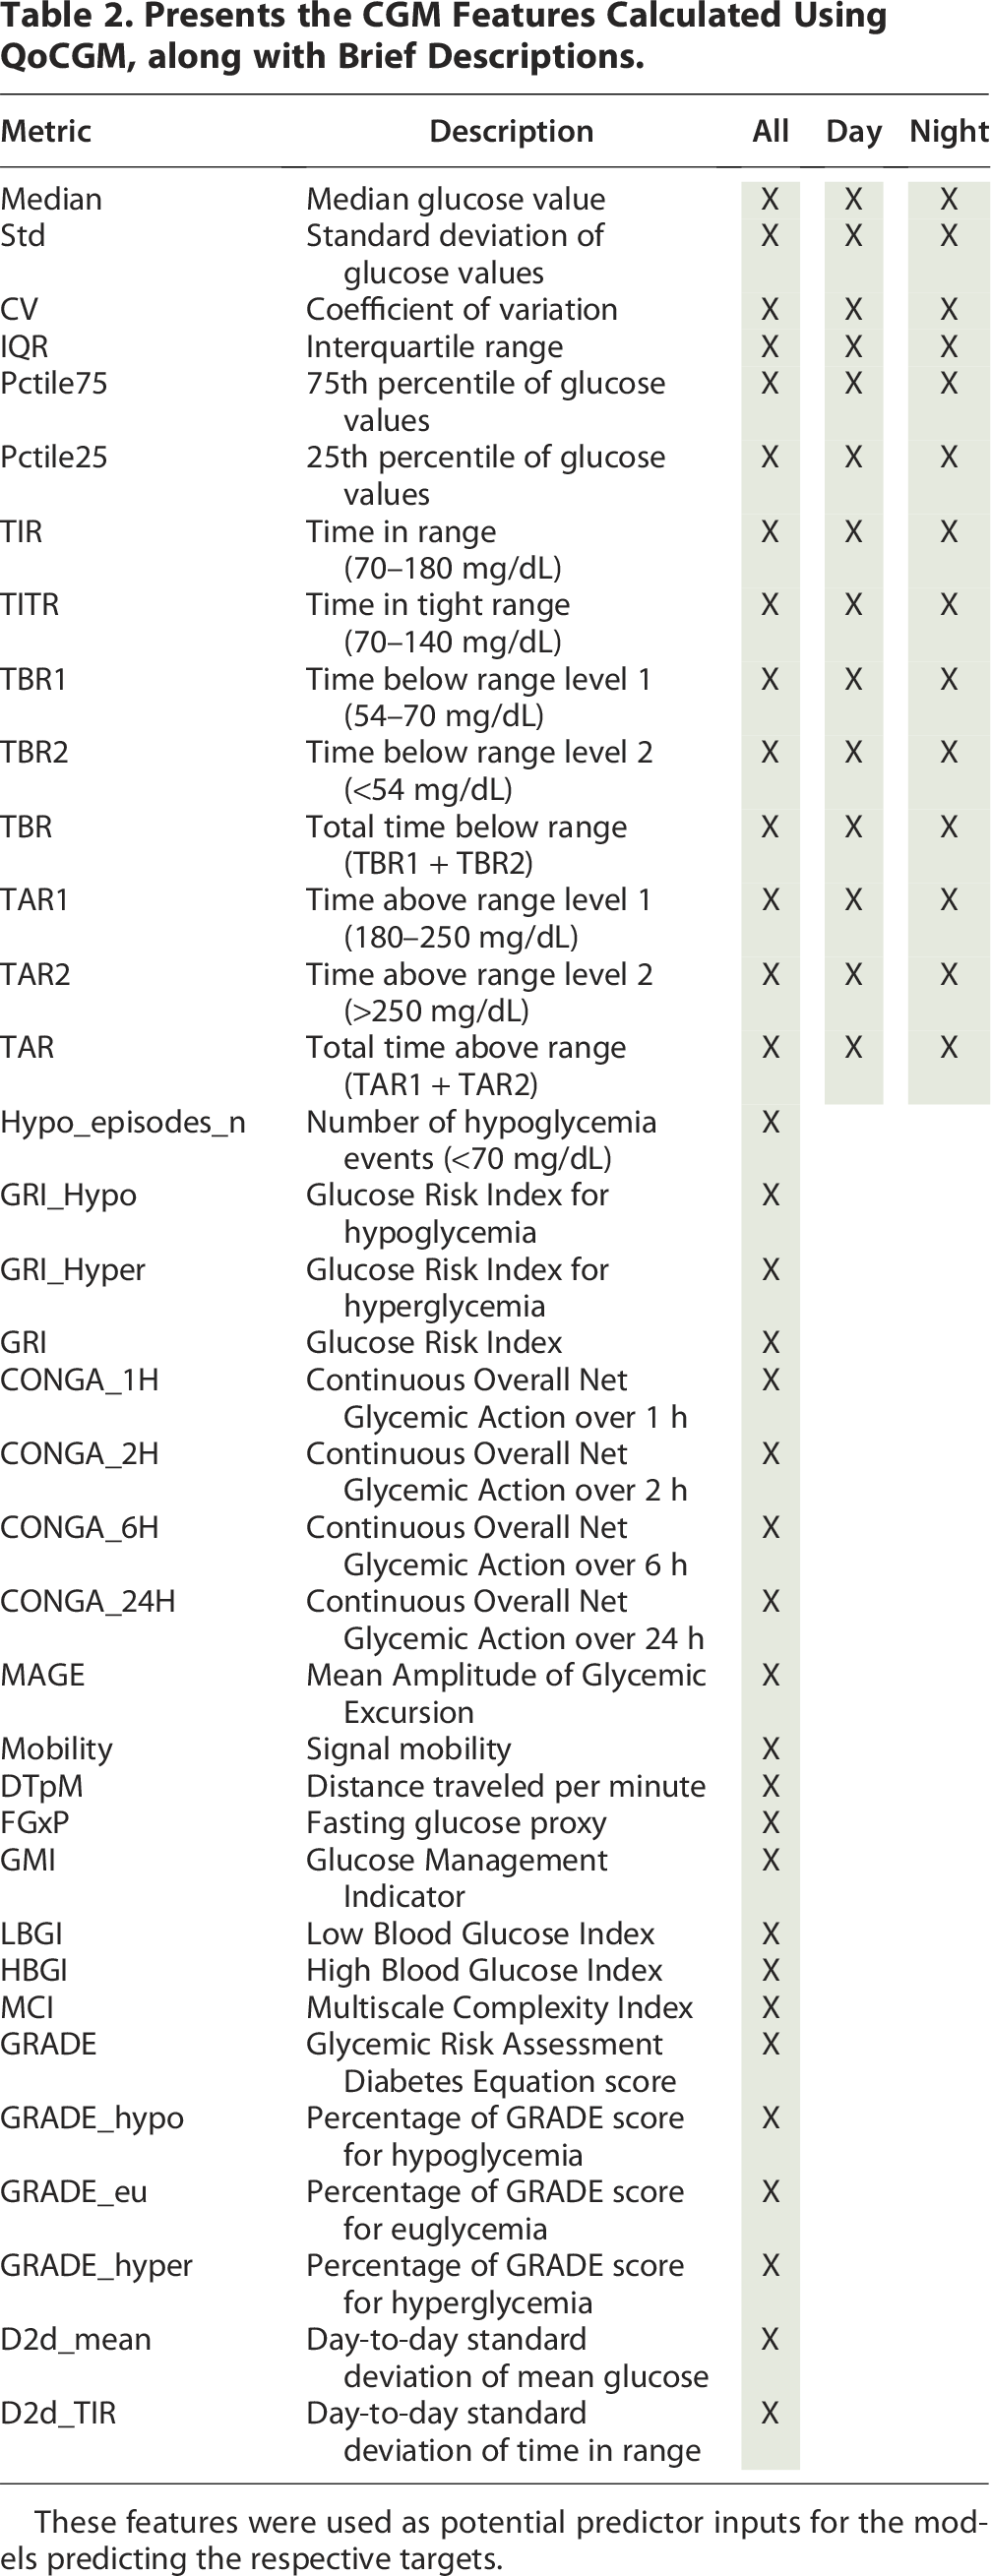
These features were used as potential predictor inputs for the models predicting the respective targets.
Model development
We employed a regression framework to predict weekly CGM metrics. To provide a comprehensive evaluation, we compared the performance of three modeling strategies: machine learning and stacked ensemble learning methods and a deep-learning foundation model. All models were trained, tested, and internally validated using identical datasets and methodologies to ensure a fair comparison. Final performance was assessed on the independent test dataset, without recalibration following training.
To enhance generalizability, model tuning was performed through grid search 29 combined with fivefold cross-validation 30 for parameter optimization. The following models were selected to represent different methodological paradigms and are briefly described below; details are presented in Supplementary Data S2:
CatBoost 31
CatBoost (CB) is a gradient boosting algorithm designed to deliver high performance with minimal parameter tuning. It is particularly well-suited for handling categorical features efficiently. CB incorporates techniques to reduce overfitting, provides robust default parameters, and offers fast training with strong accuracy, making it a popular choice for regression tasks in applied machine learning. In the implementation of CB, the hyperparameters—depth, learning rate, iteration, L2 regularization, and subsampling—were optimized.
Extreme gradient boosting 32
A tree-based ensemble learning algorithm that builds boosted decision trees in a sequential manner. XGBoost is widely recognized for its robustness, efficiency, and ability to capture complex nonlinear relationships, often outperforming traditional methods in structured tabular data. In the implementation of XBG, the hyperparameters—estimators, depth, learning rate, subsampling, regularization alpha, and lambda—were optimized.
AutoGluon 33
An automated machine learning (AutoML) framework that integrates multiple algorithms and ensembles them to optimize predictive performance with minimal manual intervention. AutoGluon (AG) streamlines model selection and hyperparameter tuning, providing a strong benchmark for automated predictive modeling. The “hyperparameter” tuned for this model was the time budget.
Tabular Prior-Data fitted network (tabPFN/PFN) 19
A transformer-based deep learning foundation model pretrained on synthetic tabular datasets. tabPFN can approximate Bayesian inference without the need for extensive training on the target dataset. In our experiment, the model was tuned via a “time budget” parameter, similar to the AG framework.
To evaluate the predictive gain of our machine learning framework, performance was benchmarked against a Last Observation Carried Forward (LOCF) baseline. In this context, LOCF represents a naïve persistence model where the glycemic metric from the preceding week serves as the direct prediction for the target week. This baseline was selected to quantify the degree of temporal autocorrelation inherent in weekly CGM data and to establish a “performance floor.” By comparing our models against LOCF, we isolated the added value of the 68 multidimensional features and nonlinear modeling over simple persistence. This comparison ensures that the machine learning models are not merely capturing the baseline stability of a participant’s glycemic profile but are successfully identifying the complex behavioral and physiological shifts that deviate from the previous week’s observations. 34
Model assessment
The performance of the regression models was evaluated using multiple complementary metrics. Predictive accuracy was quantified by the mean absolute error (MAE) and the mean absolute relative difference (MARD) (Equations 1 and 2), which capture both absolute and relative deviations between predicted and observed values. The Pearson correlation coefficient (r) and the coefficient of determination (R2) were further calculated to assess the strength of association and the proportion of variance explained by the models, respectively. To formally compare model performance, we applied the Friedman test across models, followed by pairwise Wilcoxon signed-rank tests with Holm–Bonferroni correction in cases where the omnibus test indicated significant differences. To account for the clustered data structure where participants contributed multiple case weeks, performance metrics were first aggregated to the participant level (mean error per participant) before conducting the Friedman test. This aggregation ensures that the independence assumption is maintained across the blocks of the test and prevents bias from intra-participant temporal correlations. Confidence intervals of effect were derived using nonparametric bootstrap resampling at the patient level (1000 iterations).
Finally, to assess potential clinical utility, we stratified patients into quantile-based risk groups for each target and evaluated classification accuracy. The threshold values for these quartiles (Q1, Q2, Q3, Q4) were calculated exclusively using the training set for each diabetes type. These fixed thresholds were then applied to the test set, ensuring that no information from the test distribution influenced the classification process. These results were visualized using enhanced heatmaps of confusion matrices, highlighting each model’s ability to correctly assign patients to relevant categories.
All analyses were performed using MATLAB (R2021b), Python (v3), the Scikit-learn package (v0.23.2) for machine learning utilities, the autogluon (v1.2), tabpfn (v2.0.5), catboost (v1.2.7), and the XGBoost package (v2.1.1).
Results
A total of 4622 case-weeks (T1DM, n = 3389; T2DM, n = 1233) from the IOBP2 and DiaMont cohorts were included in the analysis. In the IOBP2 cohort, each patient contributed a median of 7 case-weeks (IQR 1.0), whereas in the DiaMont cohort, each patient contributed a median of 3 case-weeks (IQR 4.0).
Type 1 diabetes
For patients with T1DM, predictive performance was generally comparable across the four models for the six targets, as illustrated in Figure 2. The models were able to predict weekly targets with reasonable MARD accuracy ranging from 8.5% to 16.5% for TIR, TITR, TAR, and MAGE, with the exception of TBR, which exhibited a mean difference of 48%. This is in contrast to the MAE of TBR, which is low, but because time spent in hypoglycemia is low, small absolute error will result in a large relative error. From a clinical perspective, PFN achieved the lowest MAE for TBR (1.05), which corresponds to an estimated weekly error of approximately 105.8 min, either over- or underestimating true hypoglycemia exposure.
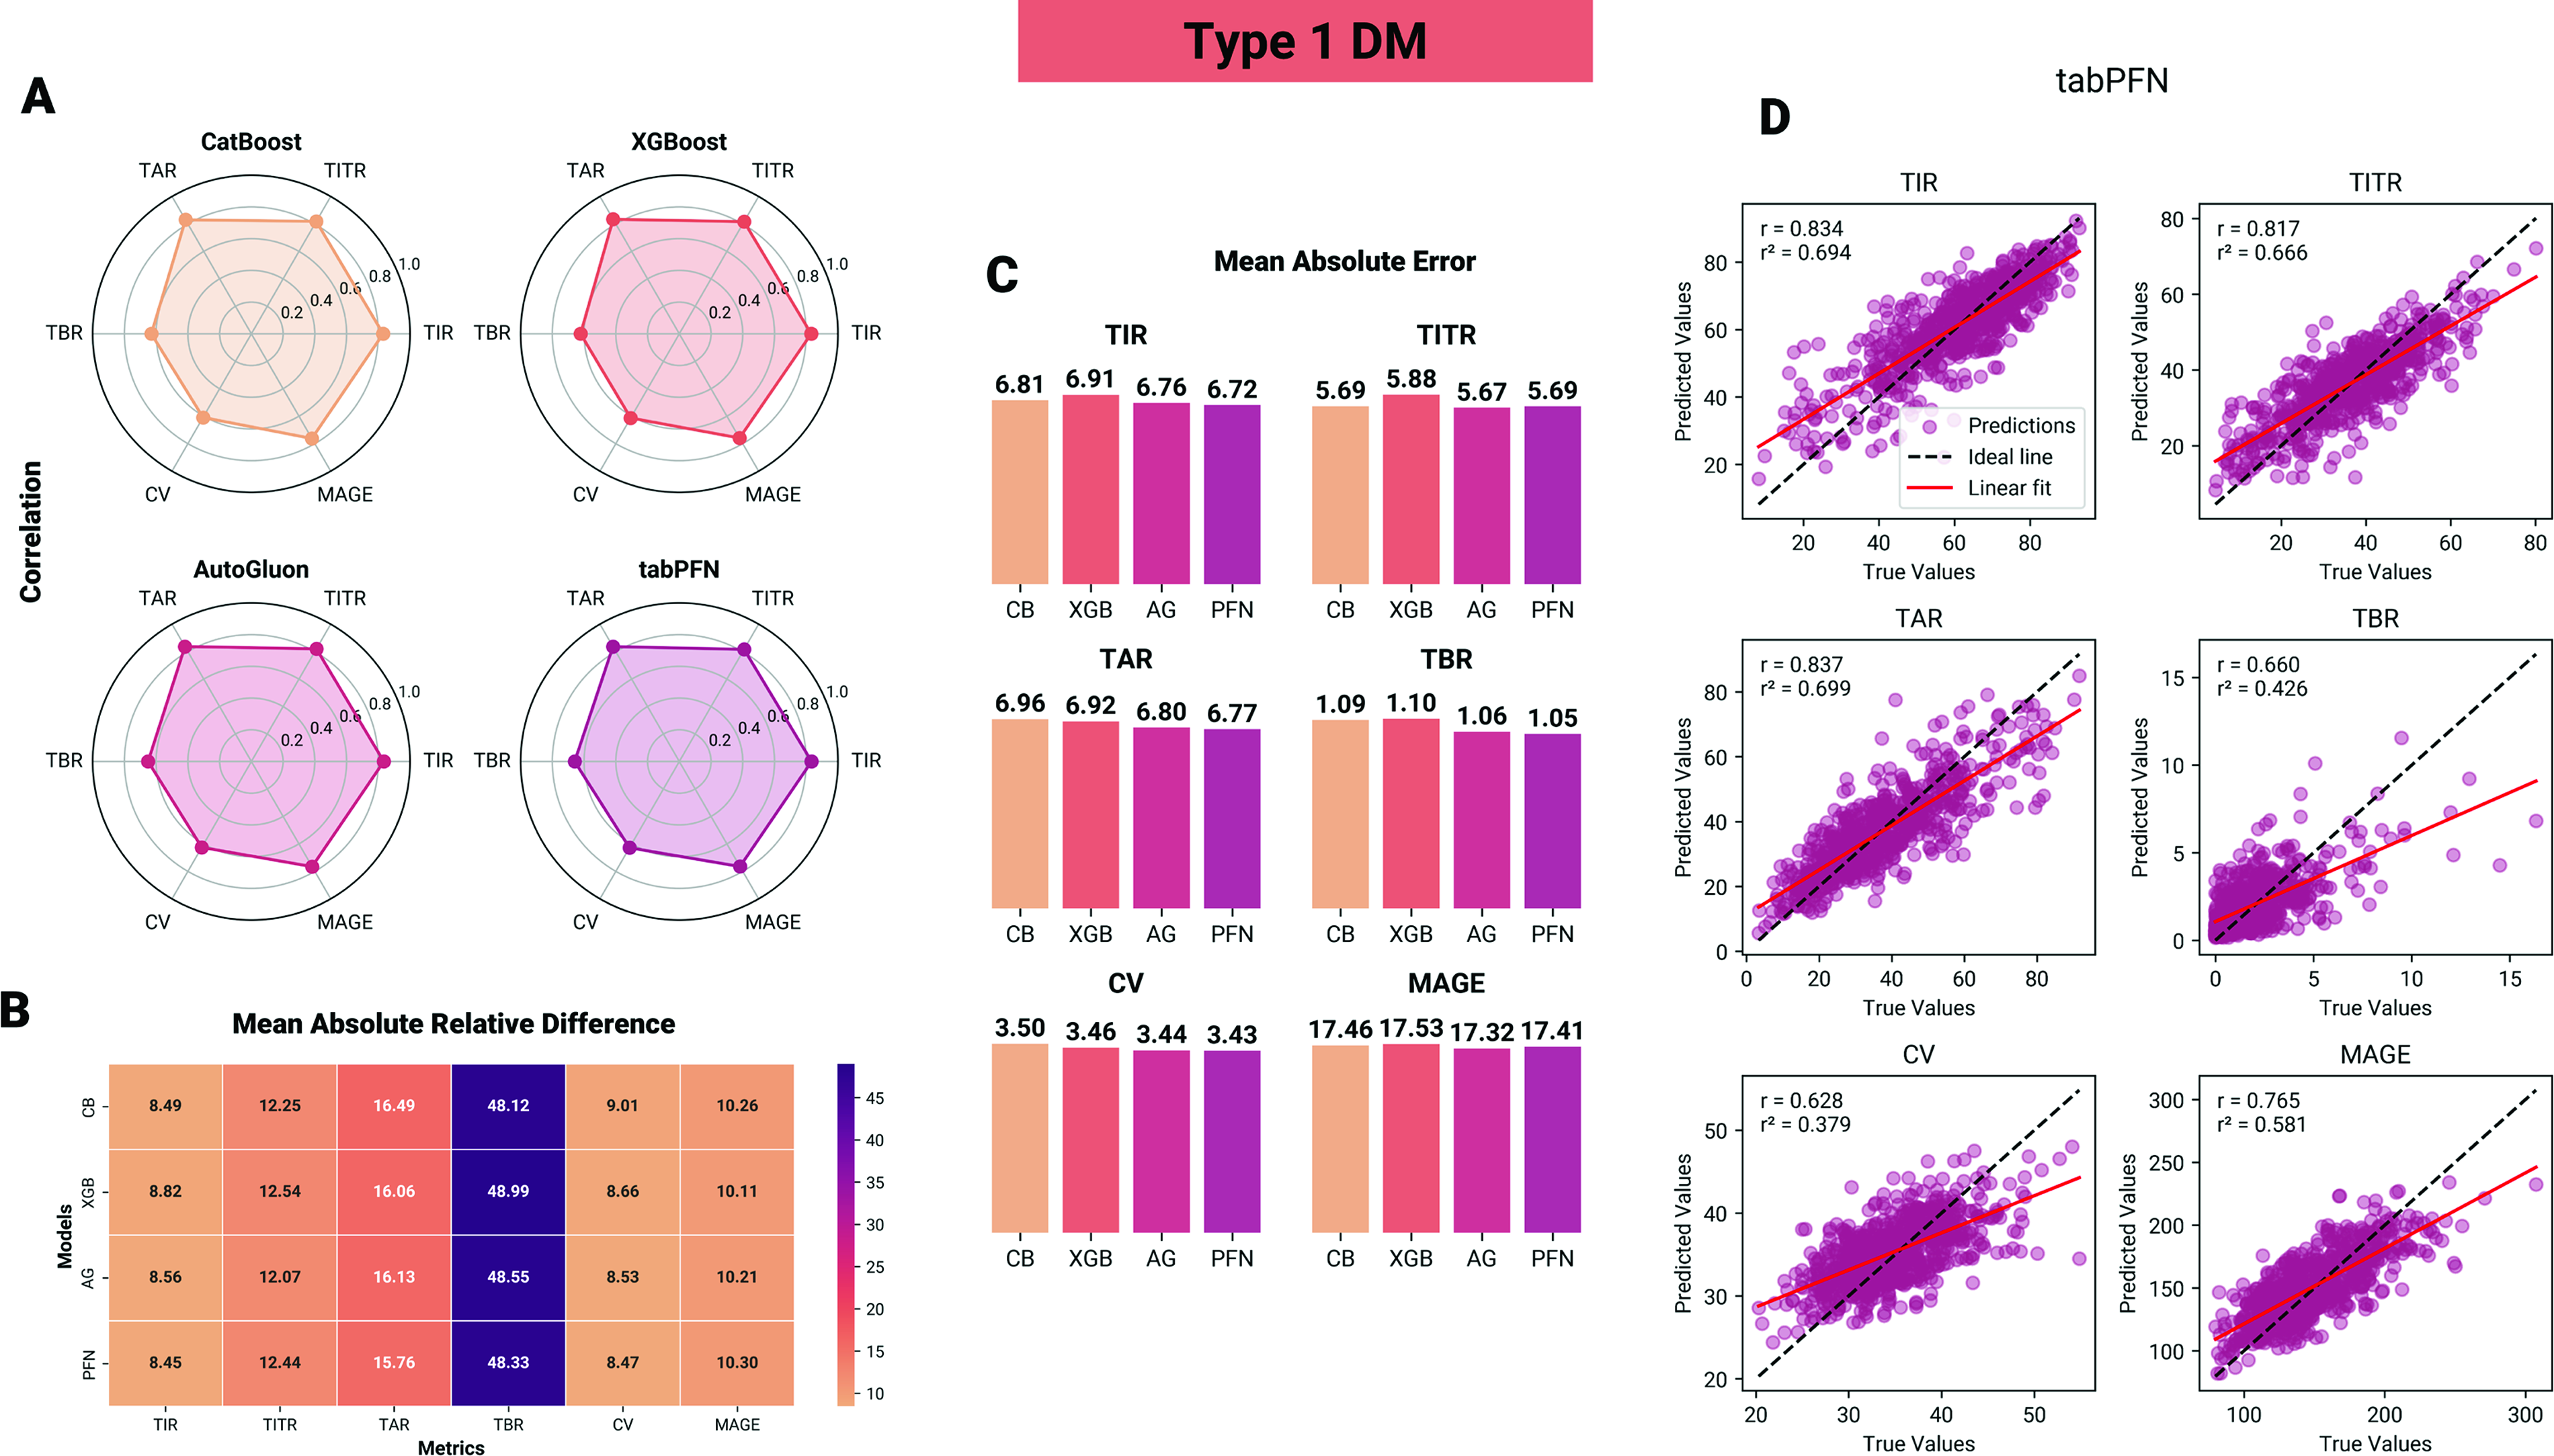
Performance of machine learning models in predicting glycemic control metrics in individuals with type 1 diabetes.
In statistical comparisons, for TITR, CB, AG, and TabPFN (PFN) all achieved significantly lower mean absolute residuals (MAE) compared with XGBoost (XGB), with absolute reductions of ΔMAE = −0.19 (95% CI: [−0.27, −0.12]), −0.21 (95% CI: [−0.31, −0.13]), and −0.19 (95% CI: [−0.26, −0.10]), respectively (P < 0.01). For TAR, AG and PFN demonstrated lower ΔMAE compared with XGB (ΔMAE = −0.12, 95% CI: [−0.18, −0.06]; and −0.15, 95% CI: [−0.20, −0.08], respectively) and CB (ΔMAE = −0.16, 95% CI: [−0.19, −0.08]; and −0.19, 95% CI: [−0.24, −0.09], respectively), P < 0.05. Similarly for TBR, AG and PFN demonstrated lower ΔMAE compared with XGB (ΔMAE = −0.04, 95% CI: [−0.06, −0.02]; and −0.05, 95% CI: [−0.08, −0.03], respectively) and CB (ΔMAE = −0.03, 95% CI: [−0.07, −0.01]; and −0.04, 95% CI: [−0.08, −0.02], respectively), P < 0.05. No statistically significant differences were observed for the remaining glycemic targets, with effect estimates close to zero and confidence intervals spanning zero.
Type 2 diabetes
For participants with T2DM, predictive performance was generally comparable across the four models for the six targets, as illustrated in Figure 3. The models were able to predict weekly targets with MARD accuracy ranging from 7.8% to 23.9% for TIR, TITR, TAR, TBR, and MAGE—with TBR, which exhibited a mean difference of 78%. From a clinical perspective, PFN achieved the lowest MAE for TBR (0.42), which corresponds to an estimated weekly error of approximately 42.3 min, either over- or underestimating true hypoglycemia exposure.

Performance of machine learning models in predicting glycemic control metrics in individuals with type 2 diabetes.
In pairwise statistical comparisons, for TIR, PFN achieved lower MAE than CB, AG, and XGB, with absolute reductions of ΔMAE = −0.41 (95% CI: [−0.62, −0.19]), −0.41 (95% CI: [−0.60, −0.21]), and −0.86 (95% CI: [−1.02, −0.64]), respectively (P < 0.01). For TITR, XGB achieved higher MAE than CB, AG, and PFN, with absolute reductions of ΔMAE = 0.6 (95% CI: [0.25, 0.78]), 0.65 (95% CI: [0.31, 82]), and 1.04 (95% CI: [0.97, 1.11]), respectively (P < 0.01). For TAR, PFN and AG outperformed CB and XGB, with MAE reductions of ΔMAE = −0.51 (95% CI: [−0.78, −0.29]) to ΔMAE = −0.59 (95% CI: [−82, −0.30]) (all P < 0.05). No statistically significant differences were observed for the remaining glycemic targets, with effect estimates close to zero and confidence intervals spanning zero.
Baseline and classification
For all glycemic targets and modeling approaches, the LOCF method exhibited significantly higher MARD values (P < 0.0001), with correlations between predicted and observed values ranging from 0 to 0.38. Detailed results are provided in Supplementary Tables S1 and S2.
The models’ ability to classify each target within the correct quantile is summarized in the heatmap-enhanced confusion matrices in Figure 4. Overall, the results from the regression and classification indicate that all models possess substantial capability to predict glycemic control for the following week, although predictions for time in hypoglycemia remain associated with large errors. While marginal differences favor the more complex AG and PFN models, these improvements are not sufficiently robust to suggest large gains in clinical performance. While the training times of more complex models are substantially longer, this represents a one-time computational cost and is therefore not a major limitation. In contrast, the inference time of PFN is markedly slower compared with the other models. For example, in our experiments, prediction of 1000 cases required 699 s with PFN and 2.7 s for AG, whereas CB and XGBoost completed the same task in 0.04 s when executed on an NVIDIA T1200 GPU (Laptop).

Confusion matrices of quantile predictions for glycemic control metrics in type 1 diabetes. Each panel displays the distribution of predicted versus actual quartiles (Q1–Q4) for one glycemic outcome (TIR, TITR, TAR, TBR, CV, MAGE) across four models (CatBoost[CB], XGBoost[XGB], AutoGluon[AG], tabPFN[PFN]). Values indicate the proportion of cases within each quantile, with darker shading reflecting higher accuracy along the diagonal.
Discussion
In this study we developed and internally validated four tabular machine-learning regression models (CB, XGBoost, AG, and TabPFN) to predict week-ahead CGM-derived glycemic control metrics in a combined sample of 4622 case-weeks from the IOBP2 and DiaMont cohorts. Across both diabetes types, models achieved comparable performance for most targets: TIR, TITR, TAR, and MAGE showed reasonable aggregate accuracy. In contrast, relative errors for TBR were substantially larger despite low absolute MAE values, an expected statistical consequence when the true target values are near zero. Although AG and TabPFN produced improvements on several endpoints relative to XGBoost and CB, the magnitude of these gains was small and must be weighed against markedly higher computational cost and slower inference. However, we do not consider this to be a major limitation for deployment, as the inference time remains minimal for individual patients, particularly in a deployment environment with more powerful hardware.
The LOCF approach demonstrated limited predictive capability across all glycemic targets. Its relatively low correlations with observed values and higher error metrics underscore the inherent challenge of forecasting glycemic outcomes based solely on a naïve approach.
This study is, to our knowledge, the first to explore this proof-of-concept potential of forecasting glycemic metrics on a week-to-week basis in a regression framework. The main finding is that aggregated, week-level glycemic metrics are predictable from recent CGM inputs with accuracy that may be clinically useful for monitoring and week-to-week planning. Predictability was consistent across multiple modern modeling approaches, suggesting that the underlying CGM-derived features contain stable signal at the weekly horizon. However, more rare or low-prevalence phenomena such as time spent in hypoglycemia remain challenging to predict with low relative error; here event-level detection metrics are more informative for assessing clinical usefulness.
Our results extend two strands of prior research. First, short-horizon glucose forecasting (minutes to hours) is well established and relies on the temporal structure in CGM traces;7,35–38 we demonstrate that this predictive signal also supports reliable week-level aggregation forecasts, aligning with studies that have modeled weekly glycemic risk prediction from CGM features.11,12,39 Second, recent reports on AutoML and tabular foundation models indicate that these approaches can rival tuned gradient-boosted trees on a range of tabular tasks.19,33,40 Consistent with those reports, TabPFN and AG in our work performed slightly better than XGBoost/CB on selected targets; however, the observed advantages were modest.
Week-ahead forecasts of aggregated glycemic metrics have multiple plausible clinical uses. Such as flagging patients at risk of losing TIR, prioritizing coaching or clinical outreach, and supporting shared decision-making around therapy adjustments. For hypoglycemia, models should be evaluated on clinically meaningful thresholds and event detection. Future work should prioritize external, prospective validation across heterogeneous cohorts and CGM technologies; incorporation of contextual data streams (e.g., insulin dosing, carbohydrate intake, wearable activity measures); and thereafter pragmatic trials to measure patient-centered and clinical outcomes when predictions are delivered as decision support.
Strengths and limitations
This study benefits from a large, combined dataset spanning both T1DM and T2DM, which enhances the representativeness of the findings. We performed a head-to-head evaluation of multiple contemporary modeling approaches using a consistent preprocessing and evaluation pipeline and reported a comprehensive set of performance measures, including absolute and relative error metrics, quantile classification results, and computational metrics.
At the same time, the study has limitations. Evaluation was restricted to internal validation within the IOBP2 and DiaMonT cohorts, so external generalizability to other populations, CGM devices, or real-world care settings remains untested; the low base rate of hypoglycemia inflates relative error measures and leaves uncertainty about model performance for clinically important hypoglycemic events. The available feature set likely omitted contextual predictors with potential additional predictive value (for example, precise meal timing, unlogged insulin changes, physical activity, or acute illness). A limitation of this study is the specific composition of the type 2 diabetes cohort from the DiaMonT dataset, which consists of individuals treated with insulin. Our results may not generalize to the broader T2D population managed solely through lifestyle modifications or non-insulin pharmacotherapies. Also, while we used a > 70% CGM coverage threshold to ensure data quality, no validated method currently exists to perfectly account for missing CGM patterns. We avoided imputation to prevent artificial bias, yet real-world coverage is often interrupted by technical sensor issues and patient-related factors. Because data gaps are related to “missing not at random” and correlate with poorer control, 41 our models primarily reflect observed behavior and may underestimate extreme fluctuations occurring during sensor downtime.
Finally, statistical improvements in prediction do not ensure clinical benefit—randomized or pragmatic trials are needed to determine whether delivering week-ahead forecasts meaningfully changes behavior or improves outcomes.
Conclusions
This investigational framework shows that predicting week-ahead CGM-derived glycemic metrics is feasible with modern tabular machine-learning methods. Most metrics (TIR, TITR, TAR, CV, MAGE) can be forecast with reasonable accuracy, whereas low-prevalence hypoglycemia remains difficult to predict with low relative error. Advanced AutoML and tabular foundation models offer modest performance gains in some settings but incur greater computational costs. While these results are promising, this approach remains an investigational framework; rigorous external validation in diverse clinical populations is mandatory before considering clinical deployment.
Footnotes
Disclaimer
The source of the data is the Insulin Only Bionic Pancreas Pivotal Trial (NCT04200313), but the analyses, content, and conclusions presented herein are solely the responsibility of the authors and have not been reviewed or approved by the Bionic Pancreas Research Group or Beta Bionics.
Preprint
A version of the article has been released as a preprint (10.48550/arXiv.2601.00613).
Ethics Statement
The presented study is a reanalysis of existing and anonymized data from the IOBP/DiaMonT clinical trials. The original study protocols and informed consent forms were approved by the institutional review board(s). Written informed consent was obtained from each participant prior to enrollment of each study the Regional Ethical Committee of North Jutland, Denmark (N-20200068); ClinicalTrials.gov number(s): NCT04200313, NCT04981808.
Author Disclosure Statement
The research was funded by i-SENS, Inc (Seoul, South Korea), and S.L.C.’s involvement with the company did not influence the design, implementation, or interpretation of the study. S.L.C. has received research funding from i-SENS, Inc (Seoul, South Korea), which manufactures some of the product types discussed in this paper. However, the study was conducted independently, and the authors declare that their involvement with i-SENS, Inc (Seoul, South Korea) did not influence the findings or conclusions of the study, including the analysis, and interpretation of the data, the writing of the report, or the decision to submit the article for publication. P.V. is head of research at Steno Diabetes Center North Denmark, funded by the Novo Nordisk Foundation.
Funding Information
The study was funded by i-SENS, Inc (Grant number: 223624) (Seoul, South Korea).
Supplemental Material
Supplemental Material
Abbreviations Used
References
Supplementary Material
Please find the following supplemental material available below.
For Open Access articles published under a Creative Commons License, all supplemental material carries the same license as the article it is associated with.
For non-Open Access articles published, all supplemental material carries a non-exclusive license, and permission requests for re-use of supplemental material or any part of supplemental material shall be sent directly to the copyright owner as specified in the copyright notice associated with the article.