
Abstract
Introduction:
Digital diabetes apps are associated with improved glycemic control in people with type 1 (T1D) and type 2 (T2D) diabetes mellitus. In this retrospective, real-world data study, we aimed to assess the standalone effect of the mySugr app on glycemic control, without the use of additional connected devices to monitor/manage diabetes therapy.
Methods:
Data were collected from mySugr Logbook users who registered from January 2018 to July 2025 and provided consent for personal data processing. Eligible users were ≥16 years old upon registration, did not have imported blood glucose (BG) log entries from connected devices, and had manually logged BG for a minimum of two entries per day for 14 days per month, for the first 6 months of logbook use.
Mean monthly BG, coefficient of variation (CV), and proportions of tests below (<70 mg/dL), within (70–180 mg/dL), and above range (>180 mg/dL) were calculated for each user. Mean values for each metric were calculated across users and compared across 6 months of mySugr use. Paired samples t-tests with Bonferroni corrections were performed.
Results:
Of the 11,891 users in the sample population, 3523 (29.6%) were people with T1D, 6704 (56.4%) were people with T2D, and 1664 (14.0%) had other/non-disclosed diabetes types. Mean (standard error of measurement [SEM]) monthly BG and CV significantly decreased from the first to the sixth month of mySugr Logbook use (Δ = –6.69 [±0.25] mg/dL and Δ = –1.70 [±0.06]%, respectively; both P < 0.001). Mean (SEM) monthly proportion of tests in range significantly increased (Δ = 4.05 [±0.15]%; P < 0.001).
Conclusions:
Highly engaged mySugr Logbook users, who manually logged their BG values without any automatically imported BG data, improved their glycemic outcomes over 6 months, suggesting that the mySugr Logbook may facilitate therapy adherence and constructive lifestyle adjustments.
Keywords
Introduction
Mobile health applications (m-health apps) are software applications on mobile devices that process health-related data for use in maintaining, improving, or managing the health of an individual or community, 1 enabling users and, if applicable, their healthcare providers (HCPs), to continuously track the user’s health. They can be tailored to support people living with specific diseases or conditions, 2 and in some cases are designed not only to compile and share data but also to actively help people monitor and manage their condition, encouraging app users to take a purposeful role in their own health care. These interventional m-health apps may use features and functions such as reminders, motivational messages, and pattern generation intended to drive behavioral change in their users. 2 Some m-health apps (i.e., software functions) meet the definition of a “medical device” according to the European (EU) Medical Device Regulation (MDR). 3
M-health apps have integrated particularly well with the need for self-management in people living with diabetes mellitus, 2 a disease that requires perpetual monitoring and delicate balancing of lifestyle and treatments. Many diabetes-specific m-health apps have been designed and marketed over the past decade, 2 and their number and sophistication continue to accelerate as companies and individuals recognize the power of m-health apps to enhance diabetes care. Diabetes-specific m-health apps have demonstrated effectiveness in improving glycemic control, patient care, and medication adherence in their users across type 1 diabetes (T1D), type 2 diabetes (T2D), and gestational diabetes.4–7 However, some reports have associated manual data collection with lower user engagement with a diabetes management m-health app 8 and patients have reported logging fatigue associated with manual data entry, adding to “the work of being a patient.” 9 Thus, it is essential that a personalized approach is taken to diabetes care.
mySugr® (mySugr GmbH, Vienna, Austria) is a diabetes management app; one of its foremost features is a digital logbook that allows users to enter an expansive range of diabetes-related data, including, but not limited to, blood glucose (BG) measurements (either manually or through automatic upload from a connected BG meter [BGM]), insulin treatment, exercise, and carbohydrate intake. The mySugr app has been associated with improved glycemic control among people with T1D or T2D in real-world observational studies, 10 and in a randomized controlled trial that recruited people with T1D, T2D, or gestational diabetes, participants who used the mySugr Logbook experienced a significant decrease in diabetes distress over the trial duration compared with the control group who did not use an app. 11 Moreover, a secondary analysis of data from this trial in people with T1D or T2D found that the intervention group who used the mySugr Logbook had nearly double the chance of achieving optimal glycemic control (defined as glycated hemoglobin [HbA1c] ≤6.5%) compared with the control group. 12 This result was further substantiated by real-world data, in which existing mySugr app users, whose demographics and baseline clinical characteristics were matched to those of the trial intervention group, significantly reduced their mean BG over a 12-month period. 12 Another real-world study investigating mySugr users who transitioned from self-monitoring of blood glucose to a real-time continuous glucose monitor (CGM) demonstrated the added value of using mySugr with a CGM device to further increase CGM-associated improvements in glycemic control. 13 The mySugr app is used globally, with more than 6 million registered accounts worldwide; 14 thus, the mySugr database offers a wealth of real-world information that can be used for research purposes.13,15
While it is established that well-designed interventional m-health apps, including mySugr, are effective for supporting diabetes management, it remains unclear exactly which components of these apps are the key ingredients for success. 16 As technology has advanced, diabetes management apps are often used as part of broader ecosystems that include automatic data transfer from connected BGMs or CGM sensors, and studies frequently do not differentiate between the benefits of BG monitoring versus the benefits of engagement with specific app features. 4 In an effort to better understand how the mySugr app influences patient outcomes, we utilized the mySugr database to investigate the standalone effect of the mySugr Logbook on glycemic control. Only users who reached a high level of engagement with the logbook through manually entering their data into the app, without using any connected devices or apps to import data, have been included in this analysis.
Methods
Ethics review
The data used in this analysis were obtained from mySugr app users who had provided electronic consent for personal data processing that allowed usage of their data for research purposes, and data were anonymized prior to study analysis. Therefore, independent ethics committee approval was not sought.
mySugr Logbook
The mySugr app was developed according to the International Organization for Standardization (ISO) 13485 Quality Management Systems for Medical Devices standards. 17 In the European Union, the mySugr Logbook is a Class IIa medical device and bears the CE marking (Conformité Européenne). 17 mySugr’s Quality Management System is additionally certified under the Medical Device Single Audit Program (MDSAP) scope, confirming compliance with the medical device and data privacy laws of the countries within its scope, including the Code of Federal Regulations, Title 21, Chapter I—Food and Drug Administration, Department of Health and Human Services, Subchapter H—Medical Devices. 18
Data collection
Data were collected from 11,891 users of the mySugr Logbook who registered between January 2018 and July 2025 and provided electronic consent for personal data processing. To be included in the study, users were required to be at least 16 years old at the time of registration and to not have any log entries in the mySugr app that originated from a device or app outside the mySugr Logbook. This included connected BGM, CGM, insulin delivery devices (smartpens and pumps), weight scales, smartwatches, blood pressure meters, the mySugr Bolus Calculator, and mySugr Pump Control. This ensured a cohort of users who utilized the mySugr Logbook without any known additional services integrated with the app, meaning they created all log entries manually. Furthermore, users needed to have logged two or more BG entries per day for a minimum of 14 days per month (defined as a 30-day period) for each of the first 6 months of using the mySugr Logbook. This engagement metric was previously shown to reliably construct mean monthly BG aggregates, as established with CGM. 19
Data availability
Anonymized data, with no demographic identifiers, underlying the results and analysis can be made available to researchers upon reasonable request to the corresponding author after publication, and pending completion of a data access agreement.
Outcomes measurements
Monthly glucose metrics, including mean monthly BG, coefficient of variation (CV), and proportions of tests below, within, and above range (with the range defined as 70–180 mg/dL according to current Ambulatory Glucose Profile guidelines), 20 were calculated for each user. The mean values for each metric were then calculated across users and compared across 6 months of mySugr use. The 6-month observation period was chosen as it provides a substantial timeframe to observe significant trends and changes in user behavior and glucose management patterns.
To compare changes in mean monthly BG across different first-month (M1) estimated HbA1c (eHbA1c) values, the mean monthly BG values were converted to eHbA1c values as a pragmatic surrogate in the absence of laboratory HbA1c, based on the established relationship between mean glucose and HbA1c. This approach enabled consistent assessment of changes in glycemic control across app users but assumes stable glycemia and may not capture individual variation or high glucose variability, limiting its accuracy as a direct substitute for measured HbA1c. 21 These eHbA1c values were categorized into bins: <7%, ≥7%–<8%, and ≥8%. The bin thresholds were chosen to represent cut-offs for well-managed (7%) and suboptimally managed (8%) diabetes values.22,23 Similarly, change in CV was categorized into bins by users whose M1 CV was <36% or ≥36%, a prescribed threshold value for a well-maintained CV. 24
Statistical analyses
To assess statistical significance, paired samples t-tests with Bonferroni corrections were performed. These tests evaluated the mean difference from M1 to the sixth month (M6) of mySugr use for the dependent variables of mean BG, CV, and proportion of tests in range.
The sample population was assessed as a whole. As they comprise the majority of users, people with T1D and T2D were subsequently assessed separately.
Results
Population characteristics
Of the 11,891 users in the sample population, 3523 (29.6%) were people with T1D; 6704 (56.4%) were people with T2D; 528 (4.4%) had gestational diabetes; 207 (1.7%) had latent autoimmune diabetes in adults; 23 (0.2%) had maturity onset diabetes of the young; 333 (2.8%) were of other diabetes types; and data on diabetes type from 573 (4.8%) were not reported.
App users came from a global sample: 5050 (42.4%) were from the United States; 1530 (12.9%) from Germany; 1011 (8.5%) from the United Kingdom; and the rest came from an additional 107 countries. Age data were available for 44.4% of the overall population; the mean user age at registration was 50.46 (±16.94) years, with people with T1D being on average 40.33 (±20.58) years old, those with T2D being 56.06 (±12.18) years old, and people with all other diabetes types being 45.99 (±14.25) years old.
Similarly, data regarding diabetes duration at registration were available for 46.8% of the cohort, with a median duration of 2 years in the overall population: 9 years in people with T1D, 1 year in people with T2D, and 0 years for other diabetes types.
Mean (±standard error of measurement [SEM]) M1 values for BG were 146.38 (±0.36) mg/dL for the overall population, 154.00 (±0.67) mg/dL for people with T1D, and 145.98 (±0.46) mg/dL for people with T2D; corresponding M1 values for eHbA1c were 6.7%, 7.0%, and 6.7%, respectively.
At M1, there were 7949 (66.9%), 2341 (19.7%), and 1601 (13.5%) people in the <7% bin, ≥7%–<8% bin, and ≥8% bin, respectively; 8962 (75.4%) people had M1 CV < 36%, and 2929 (24.7%) people had M1 CV ≥ 36%.
Mean monthly blood glucose
Mean (SEM) monthly BG was observed to significantly decrease from M1 to M6 for the overall population (Δ = –6.69 [±0.25] mg/dL; P < 0.001), in people with T1D (Δ = –1.55 [±0.44] mg/dL; P = 0.002), and people with T2D (Δ = –9.47 [±0.35] mg/dL; P < 0.001) (Table 1, Fig. 1A–C).

Mean monthly BG across the first 6 months of mySugr Logbook use.
Summary of Outcome Changes from M1 to M6 per Subgroup and Total Population
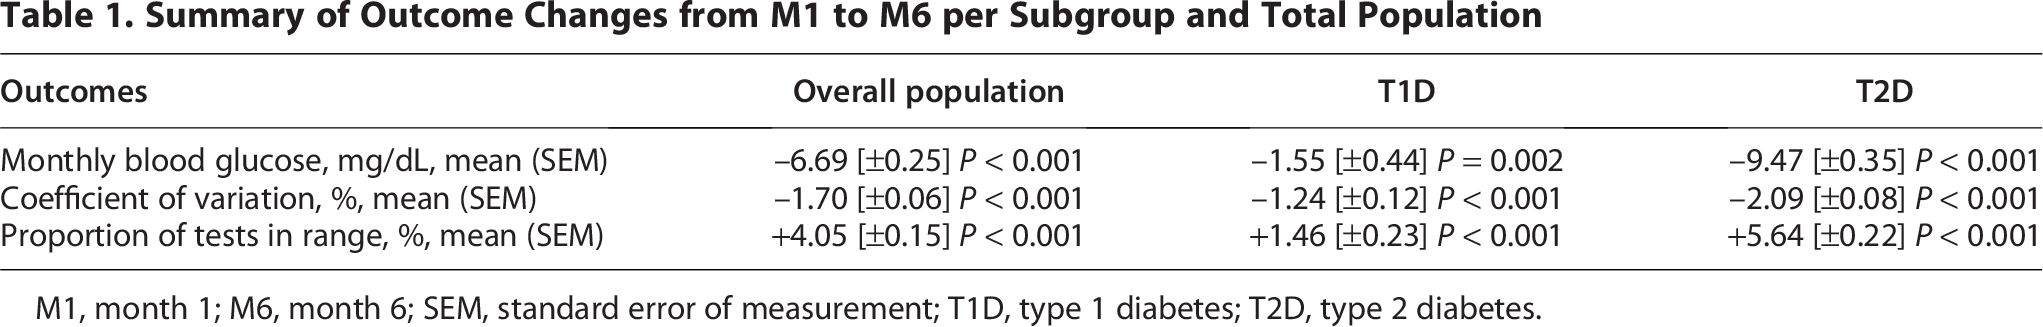
M1, month 1; M6, month 6; SEM, standard error of measurement; T1D, type 1 diabetes; T2D, type 2 diabetes.
Furthermore, in the overall population, the difference in mean monthly BG at M6 from M1 when evaluated according to M1 eHbA1c did not have a significant change for the <7% at baseline bin (Δ = –0.40 [±0.19] mg/dL; P = 0.29), but decreased significantly for the ≥7%–<8% bin (Δ = –10.49 [±0.55] mg/dL; P < 0.001) and the ≥8% bin (Δ = –32.34 [±1.22] mg/dL; P < 0.001) (Fig. 1D).
In people with T1D, the <7% bin had a significant increase in mean monthly BG (Δ = 3.45 [±0.40] mg/dL; P < 0.001), while the ≥7%–<8% (Δ = –2.51 [±0.79] mg/dL; P < 0.001) and the ≥8% (Δ = –17.36 [±1.74] mg/dL; P < 0.001) bins had significant decreases in mean monthly BG values (Fig. 1E).
Finally, in people with T2D, all binned groups had statistically significant decreases in mean monthly BG, with the decrease being smallest for the <7% bin and greatest for the ≥8% bin (Δ = –1.74 [±0.25] mg/dL, Δ = –15.75 [±0.75] mg/dL, and Δ = –41.91 [±1.70] mg/dL for the <7%, ≥7%–<8%, and ≥8% bins, respectively [all P < 0.001]) (Fig. 1F).
After 6 months, the number of people with well-managed diabetes (<7% eHbA1c) increased from 2028 (57.6%) at M1 to 2059 (58.4%) at M6 among people with T1D, and from 4574 (68.2%) at M1 to 5229 (78.0%) at M6 among people with T2D.
Coefficient of variation
The overall population, as well as people with T1D and those with T2D, had a significant mean (SEM) decrease in CV from M1 to M6 of mySugr Logbook use (Δ = –1.70 [±0.06]%; Δ = –1.24 [±0.12]%; Δ = –2.09 [±0.08]% for the overall cohort, people with T1D, and people with T2D, respectively; all P < 0.001) (Table 1, Fig. 2A–C).
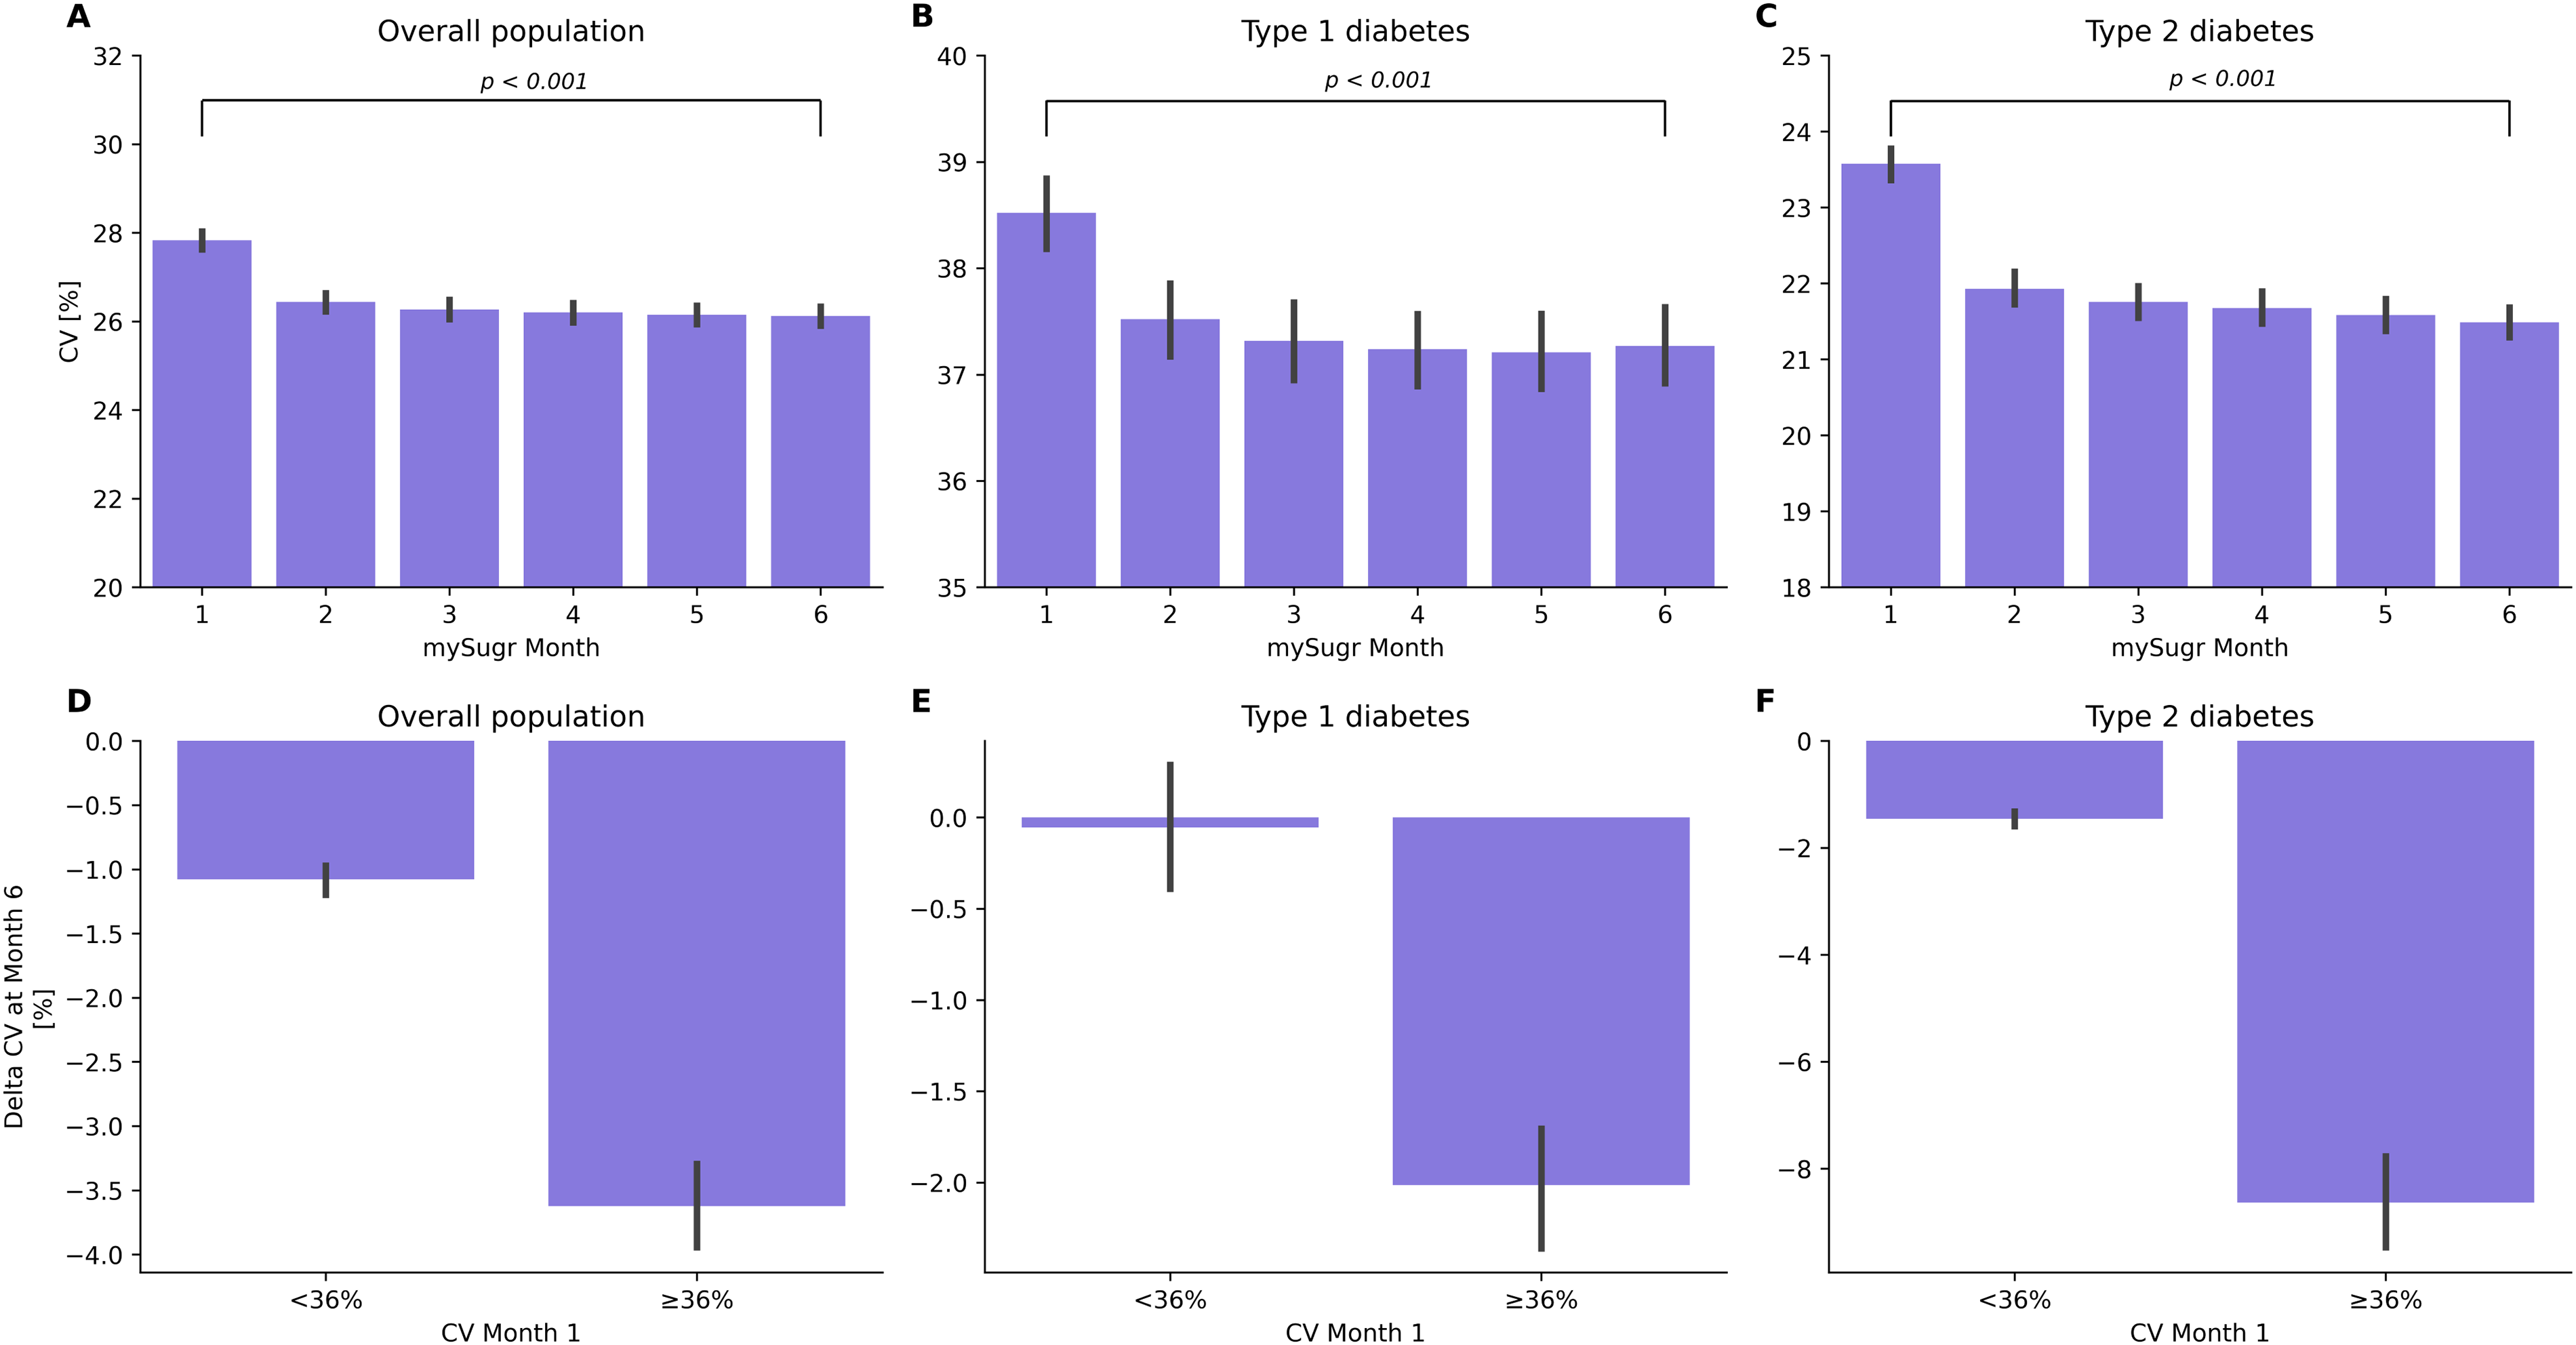
Mean monthly CV across the first 6 months of mySugr Logbook use.
When stratified by users whose M1 CV was <36% or ≥36% threshold, decreases were observed in the overall population for both bins (Δ = –1.08 [±0.06]% and Δ = –3.62 [±0.17]%; both P < 0.001). In people with T1D, the <36% bin did not have a significant change in CV (Δ = –0.06 [±0.17]%; P = 0.73), while the bin with M1 CV value ≥ 36% had a significant decrease (Δ = –2.01 [±0.16]%; P < 0.001). In people with T2D, both subgroups had significant decreases in their CV at M6, with the decrease being greatest in those with M1 CV ≥ 36% (Δ = –1.45 [±0.07]% and Δ = –8.63 [±0.46]% for <36% and ≥36%, respectively; both P < 0.001) (Fig. 2D–F).
Over the 6-month observation period, the number of people with a well-managed CV (<36%) increased from 1376 (39.1%) to 1581 (44.9%) among people with T1D and from 6114 (91.2%) to 6274 (93.6%) at M6 among people with T2D, respectively.
Tests in and out of range
The overall population, as well as people with T1D and those with T2D individually, were observed to have significant increases in the mean (SEM) monthly proportion of tests in range (Δ = 4.05 [±0.15]%; Δ = 1.46 [±0.23]%; Δ = 5.64 [±0.22]% for the overall cohort, people with T1D, and people with T2D, respectively; all P < 0.001) (Table 1, Fig. 3A–C).

Mean monthly proportions of BG tests below, in, and above range.
We also assessed the proportion of the overall population who had 70% or more tests in range each month. In the overall cohort, 64.34% of users had 70% or more reported tests in range during M1 of mySugr Logbook use, and this proportion increased to 70.37% in M6. In people with T1D, this proportion increased from 37.86% to 41.24% from M1 to M6, and in people with T2D, it increased from 74.25% to 81.75%.
Discussion
This study used retrospective data from the mySugr database to investigate the standalone effect of manually tracking diabetes-related data through the mySugr Logbook on glycemic outcomes in users without imported BG data from connected devices. A strength of this study is its real-world setting; outcomes reported here were attained within the real-world context and, consequently, can be applied to the real-world global diabetes population. Over 6 months, mean monthly BG and CV had statistically significant decreases among the overall population, including in people with T1D or T2D when these groups were analyzed separately. The overall population, people with T1D, and those with T2D had a corresponding increase in tests in range, which was also significant in all three M1 eHbA1c categories. The largest improvements in glycemic outcomes were seen among people who initially had suboptimally managed diabetes (≥8% eHbA1c) and/or did not meet the threshold of <36% for a well-managed CV, as may be expected since the opportunity for improvement was greatest.
Some differences were observed between the T1D and T2D populations. Greater improvements were seen in glycemic outcomes for people with T2D compared with people with T1D; this is in agreement with data from clinical trials of various diabetes m-health apps.25,26 People with T2D had a larger decrease in mean monthly BG from M1 to M6 versus people with T1D (–9.47 mg/dL versus –1.55 mg/dL), although the decreases in both groups were statistically significant. A contributing factor to this difference is that, in contrast to all people with T2D and people with T1D who had an eHbA1c at M1 of ≥7%, people with T1D in the <7% bin had a statistically significant increase in their mean monthly BG across the 6-month observation period (+3.45 mg/dL from M1 to M6). This may be due to differing therapy goals for people with T1D versus people with T2D, as incidence rates of both severe and non-severe hypoglycemia are higher among people with T1D, 27 who may therefore be aiming to reduce incidences of hypoglycemia rather than simply lowering their mean glycemia. This is upheld by the proportion of tests in and out of range observed in this study; people with T1D had a higher proportion of BG values below range across the study duration compared with people with T2D, and the proportion of BG values below range in people with T1D decreased over the 6 months, indicating that people with T1D in the <7% bin in M1 may have improved their time in the recommended target range. Nonetheless, it should be considered that although the observed increase in mean glucose was statistically significant in people with T1D with eHbA1c < 7% at M1, this increase was small and unlikely to be clinically meaningful. We may speculate that the increase potentially reflects either prior overtreatment or hypoglycemia avoidance during app use, which cannot be distinguished with the available data and may differ across individuals. This observation further highlights the need for individualized glycemic targets in T1D, and it remains important to actively manage hypoglycemia and time-in-range metrics between individuals and their HCPs to avoid safety implications. It is also worth noting that changes of –1.55 mg/dL (people with T1D) and +3.45 mg/dL (people with T1D with an M1 eHbA1c of <7%), while statistically significant, may not be clinically meaningful. A change of ≥0.3% in eHbA1c, which corresponds to a change of 8.6 mg/dL in BG using the estimated average glucose formula, is considered by the European Medicines Agency guidelines to be clinically relevant. 28 By this metric, only the change in mean monthly BG for people with T2D, and not T1D, would be deemed a clinically meaningful difference and improvement. Similarly, tests-in-range improvement for the T1D population was modest (+1.46%), while the ≥5% absolute increase reported for the T2D population (+5.64%) may be considered clinically meaningful by analogy with established thresholds for time in range. 29 However, no specific guidelines currently exist for tests in range, and outcomes beyond glycemic measures, including diabetes-related complications, were not assessed.
These data suggest that in a cohort of highly engaged users, manually entering BG data into the mySugr Logbook to self-manage diabetes, without automatic data transfer from connected devices, is sufficient to achieve improvements in glycemic outcomes. Many clinical trials and real-world studies have supported the efficacy of m-health app-based interventions to improve glycemic outcomes.25,26,30 These effects are presumed to be the result of lifestyle modification and greater treatment adherence prompted by the app. Presence of a lifestyle modification module in app-based interventions has been associated with a trend toward improved HbA1c 25 and in T2D, a meta-analysis found strong evidence for the efficacy of m-health apps for lifestyle modifications, such as physical activity and diet. 31 Similarly, a number of studies have reported a positive influence of m-health apps on diabetes medication adherence.32,33 M-health apps may spur on changes in their users through a variety of attributes: general education, encouraging more frequent BG testing, providing a structured display of data, providing feedback to users, and sharing data with HCPs, all of which may engender greater awareness of glycemic status and thereby lead to enriched self-management.25,30
In contrast with previous reports linking manual data collection with reduced user engagement and logging fatigue,8,9 the subset of mySugr users in this study were highly engaged in manual tracking, and the results of this study showcase that for these individuals, manual data entry (i.e., without automated data upload from connected devices) improved their glycemic outcomes. For these users, the act of logging itself likely increased glycemic awareness, and frequent self-monitoring of BG data, cued by the app, may have increased therapy adherence. Behavioral modification techniques used by the mySugr app, such as gamification, reminders for medication adherence, provision of reports to visualize and contextualize glycemic data, and the ability to share these reports with a user’s health care team, may also have influenced user behavior and played a role in the accomplishment of better glycemic outcomes. Behavior modification techniques, such as sending reminders to cue specific behaviors, providing feedback and visualization on the consequences of those behaviors, and incentivizing behaviors through a reward system of positive reinforcement, can help app users form healthy habits and are even more potent if they are personalized.34,35 Over time, behavioral modifications to enhance diabetes self-management may become ingrained as habits and thereby promote long-term glycemic control. However, user behavior was not assessed in this study, so the suggestion that these results may have been influenced by behavioral modification techniques is purely speculative.
We acknowledge that there are some limitations to this study. First is the lack of baseline data, since data prior to the sample population’s use of the mySugr Logbook were not available for analysis; instead, improvement in outcomes has been benchmarked against data from the first month of mySugr Logbook use. This limitation may have impacted the magnitude of the effect and its direction (either positive or negative) since the true baseline is not available. However, previous analysis has shown that improvements may already be observed during the first month of mySugr use. 13 Although age and diabetes were missing for >50% of users, the lack of these data did not affect the reported results, as no stratification analysis based on these demographic parameters was run. Second, potentially confounding contextual data that may impact glycemic outcomes and explain observed improvements, such as duration of diabetes, medication use, diet, comorbidities, and socioeconomic and educational factors, have not been considered here. This is particularly important in light of most users with T2D reporting that they were recently diagnosed, which may indicate that other therapies and lifestyle modifications might be contributing to the observed change in glycemia. Third, this study focused on and included data from users with a relatively high level of logbook engagement, with a minimum of 14 days per month of logging over a 6-month period, which introduced selection bias. Therefore, the results of this study are primarily relevant for app users who are highly engaged in manual data logging and are not universally applicable. It should be noted that individual preference should be considered and that the effects of the app in people who were logging less intensively (at least one BG measurement per month) have been reported previously. 12 Finally, while we speculate that use of the mySugr Logbook may have contributed to habit formation, user engagement with diabetes management apps (like other m-health apps) has been shown to decrease over time. 8 Therefore, a longer observation period and additional recording of changes in user engagement (i.e., for how long individuals continued to log their diabetes data) may help to determine whether this is taking place.
Conclusions
In conclusion, this real-world study demonstrated that highly engaged use of the mySugr Logbook in people with diabetes was associated with a statistically significant improvement in glycemic outcomes. This effect was seen in users who only manually logged data, without any upload of data from connected devices or third-party apps. Further research could determine whether the improvement in glycemic outcomes was due to the logbook’s facilitation of increased therapy adherence and constructive lifestyle adjustments, perhaps through behavioral modification and habit forming.
Authors’ Contributions
J.Z. and M.M. performed the statistical analysis. All authors contributed to data interpretation, critically reviewed the article, provided final approval of the version to be published, and agree to be accountable for all aspects of the work.
Footnotes
Acknowledgments
Medical writing support for the development of this article, under the direction of the authors, was provided by Phoebe Tate, MSc, and Tsvetana Stoilova, PhD, of Ashfield MedComms, an Inizio company, and was funded by Roche Diabetes Care GmbH (Mannheim, Germany).
Author Disclosure Statement
All authors declare financial competing interests and are employees of Roche, and may hold stock in Roche, at the time of writing the article. All authors declare no nonfinancial competing interest.
Funding Information
This study was funded by Roche Diabetes Care GmbH (Mannheim, Germany). mySugr is a trademark of Roche. All other product names and trademarks are property of their respective owners.